ASSESSING VIETNAM’S ECONOMIC GROWTH AFTER … growth.pdf · ASSESSING VIETNAM’S ECONOMIC GROWTH...
35
ASSESSING VIETNAM’S ECONOMIC GROWTH AFTER 5 YEARS ACCESSION TO THE WORLD TRADE ORGANIZATION Dr. Pham Lan Hương Ha Noi – 3/4/2013
Transcript of ASSESSING VIETNAM’S ECONOMIC GROWTH AFTER … growth.pdf · ASSESSING VIETNAM’S ECONOMIC GROWTH...

ASSESSING VIETNAM’S ECONOMIC GROWTH AFTER 5 YEARS ACCESSION TO THE WORLD TRADE ORGANIZATION
Dr. Pham Lan HươngHa Noi – 3/4/2013

Purpose and contents of the report
� Purpose
� Prepare a comprehensive report to review and assess the socio-economic development after Vietnam’s 5 years accession to the WTO and submit it to the Government.
� Contents
� Assessing comprehensively Vietnam’s social economic development after joining the WTO development after joining the WTO � Economic growth
� Trade
� Investment
� Macroeconomic stability
� Social issues: employment, income, poverty, social safety, education, health care
� Economic institution
� Environment
� Propose suitable policy recommendations in order to broaden and deepen the international economic integration process, to make this process efficient, and to facilitate the faster and sustainable development

Assessment methods
� General assessment
� International economic integration is intertwined with other developments in the economy
� Economic models could not capture all the real life situations
� The interaction between different development � The interaction between different development dimensions and the policy responses

Assessment methods (2)
� Reviewing all Vietnam’s commitments in international economic integration process (WTO, commitments in the most important multilateral, bilateral, regional agreements)
� Assessing implementation of such commitments ⇒⇒⇒⇒identifying sectors affected the mostidentifying sectors affected the most
� Overall assessment the social-economic development after 5 years joining the WTO, comparing with that of the period 2002-2006, emphasising impacts caused by international economic integration (if possible, decomposing impacts by integration channels), integrating the assessments with reviewing outcomes of implementing strategic targets, socio-economic development plans and action programmes

Impact channels of international economic integration
Hội nhập kinh
tế quốc tế
Xuất khẩu
Giá cả
Tỷ giá
NSNN
Cải cách thể chế Nhập
khẩu
Tình hình
việc làm
Thu
nhập
Phản ứng
chính sách
WTO
Các cam
Đầu tư
nước
ngoài
Cán cân thanh
toán quốc tế
Hệ thống tài
chính Đầu tư
trong
nước
Sản xuất trong nước
Cơ cấu
ngành
việc làm nhập
Thất nghiệp
Nghèo
đói
Các cú sốc
bên ngoài
Các cam
kết quốc
tế khác

Economic growth

General assessment
� GDP growth rate in 2007-2011 was 6,5%
� Lower than the rate of 7,8% in 2002-2006
� Lower than the rate of 7,0% in 1996-2000
� Significant reduction from 2000 to present
� Not achieve the target of 7,5-8% proposed in 5 year development plandevelopment plan
� Still little bit higher than that figure of other countries

GDP Growth (%)
7.1 7.37.8
8.4 8.2 8.5
6.36.8
9.5
10.5 10.210.7 10.4 10.2
7.7
6.5 6.57.3
8.5 8.38.9
7.46.6
7.57.0
6.4
8
10
12
6.3
5.3
6.8
5.9
54.2
3.64.4
4.0 3.7 3.8
4.7
1.8
2.8
4.0
2.7
6.05.5 5.5
4.5
6.5 6.5 6.6 6.4
0
2
4
6
2002 2003 2004 2005 2006 2007 2008 2009 2010 2011 2012
GDP Nông, lâm nghiệp, thủy sản Công nghiệp, xây dựng Dịch vụ
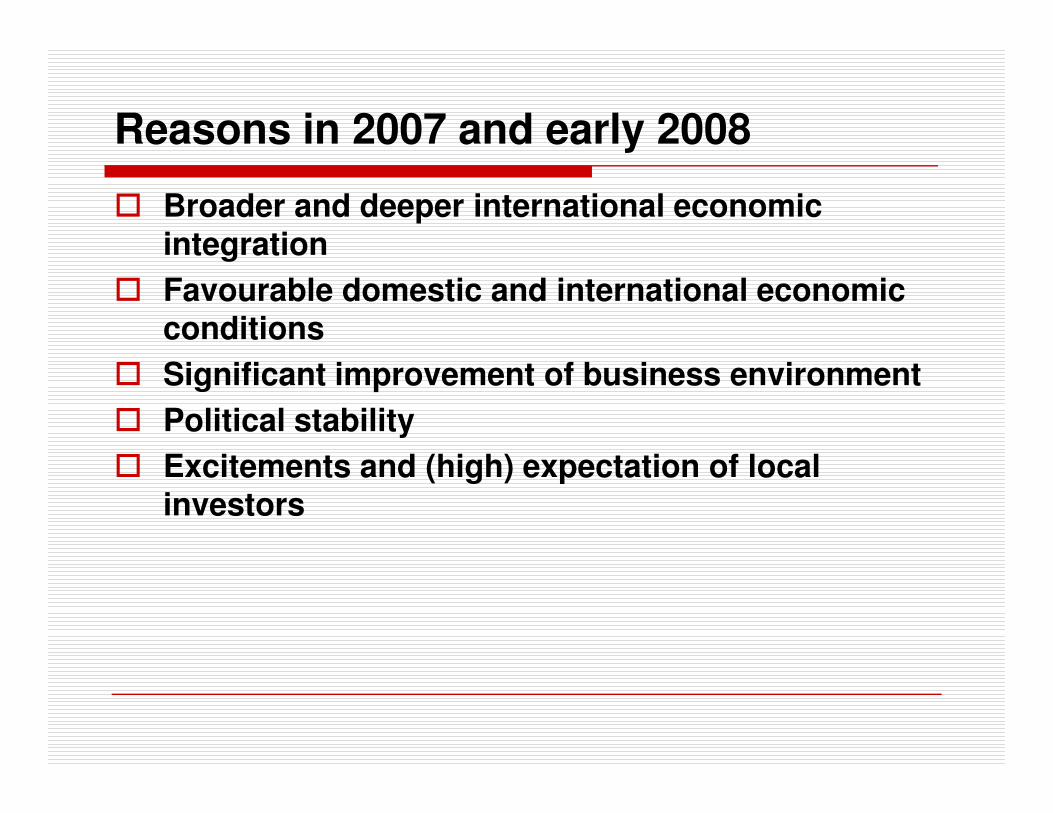
Reasons in 2007 and early 2008
� Broader and deeper international economic integration
� Favourable domestic and international economic conditions
� Significant improvement of business environment
� Political stability� Political stability
� Excitements and (high) expectation of local investors

Reasons from end of 2008
2 groups of factors that results in competing impacts:
� Negative
� Deepening of inter. eco. integration made the increase in the world commodity prices in 2008, 2009, 2010 and 2011 to have stronger and faster impacts on the economy, which in turns pushing inflation to increase economy, which in turns pushing inflation to increase and cause a reduction in economic growth
� From Oct 2008, negative impacts from global economic recession
� Recessions in trading partners, which negatively exports and FDI
� Internal weaknesses and limitations become obstacles
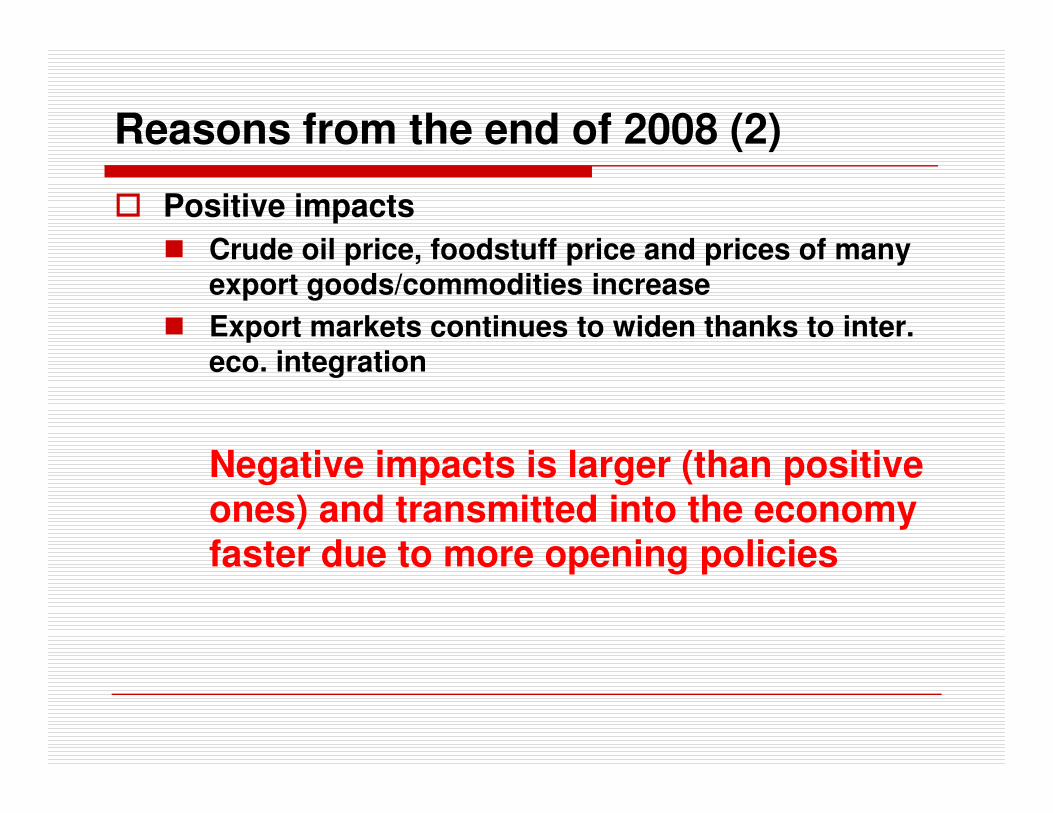
Reasons from the end of 2008 (2)
� Positive impacts
� Crude oil price, foodstuff price and prices of many export goods/commodities increase
� Export markets continues to widen thanks to inter. eco. integration
Negative impacts is larger (than positive ones) and transmitted into the economy faster due to more opening policies
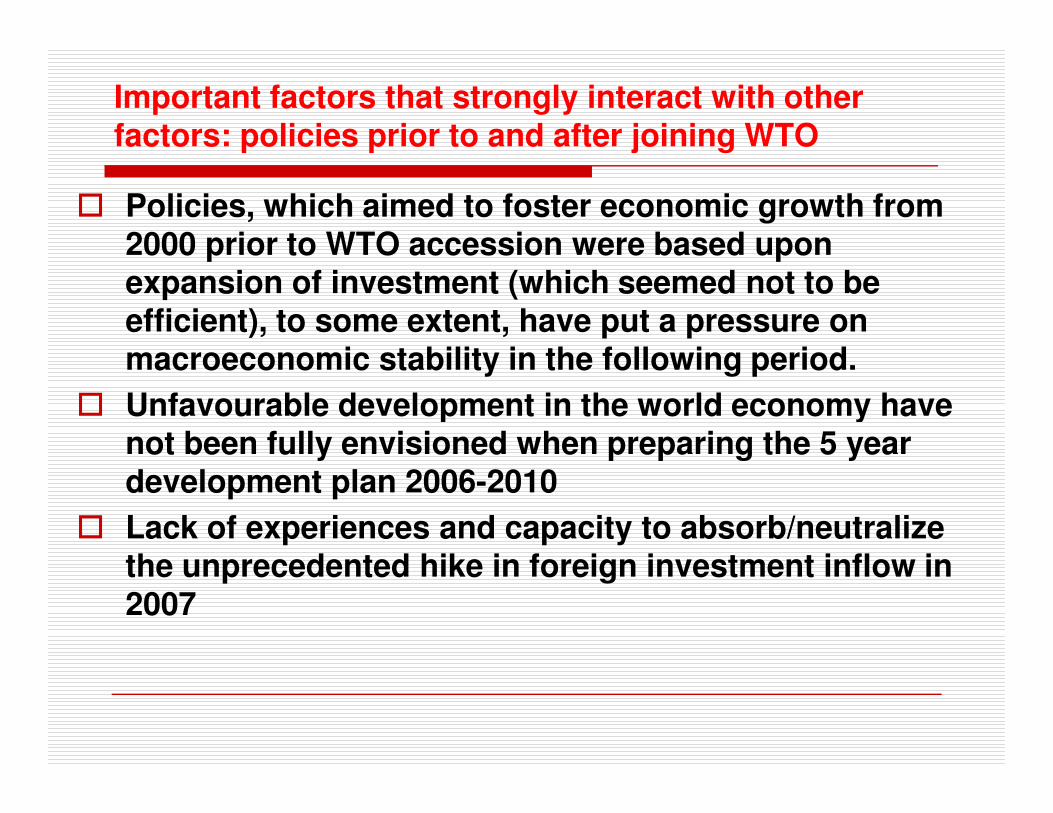
Important factors that strongly interact with other factors: policies prior to and after joining WTO
� Policies, which aimed to foster economic growth from 2000 prior to WTO accession were based upon expansion of investment (which seemed not to be efficient), to some extent, have put a pressure on macroeconomic stability in the following period.
� Unfavourable development in the world economy have � Unfavourable development in the world economy have not been fully envisioned when preparing the 5 year development plan 2006-2010
� Lack of experiences and capacity to absorb/neutralize the unprecedented hike in foreign investment inflow in 2007

Important factors that strongly interact with other factors: policies before and after joining WTO
� Perplexities and inconsistencies of fiscal and monetary policies to deal with macroeconomic instabilities in 2008-2010 also had impacts on inflation and growth
� During this period, policies usually changed unexpectedly from this extreme to other one: tightening fiscal policy when inflation hiked; as long as signs of fiscal policy when inflation hiked; as long as signs of declining inflation seen, policies immediately loosen to avoid the economic slowdown
� Since early 2011, firmly stick to the target of macroeconomic stability with measures to ensure social safety.
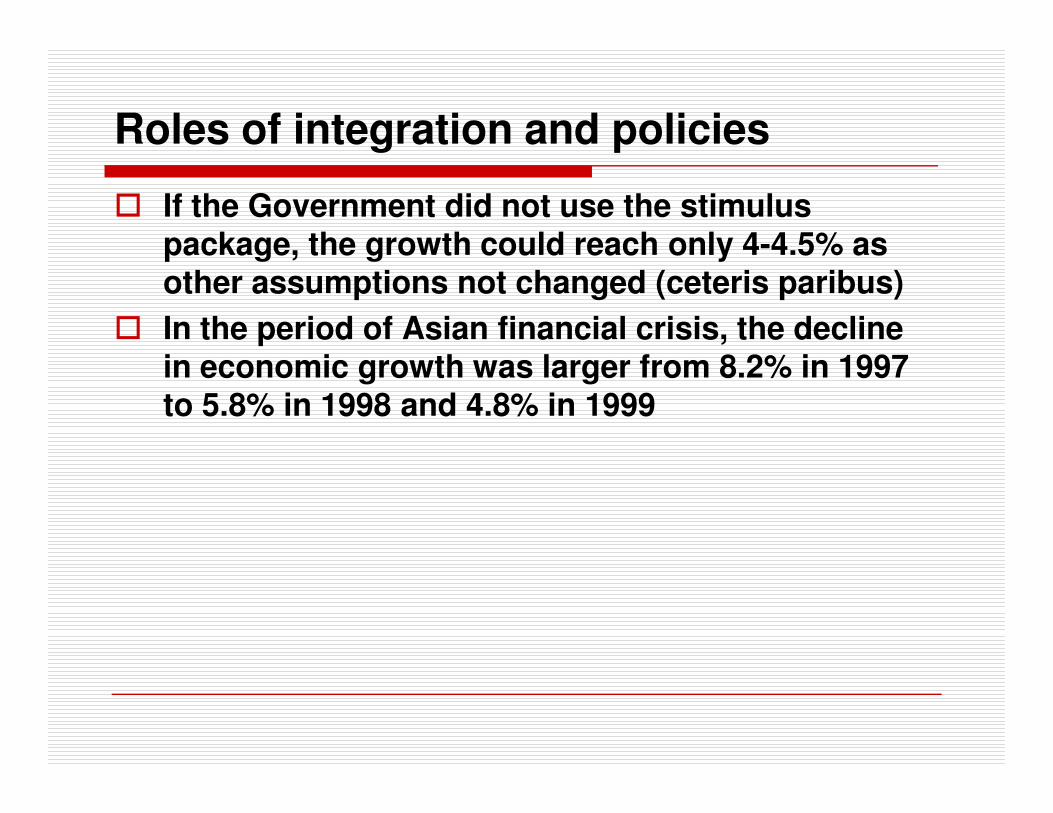
Roles of integration and policies
� If the Government did not use the stimulus package, the growth could reach only 4-4.5% as other assumptions not changed (ceteris paribus)
� In the period of Asian financial crisis, the decline in economic growth was larger from 8.2% in 1997 to 5.8% in 1998 and 4.8% in 1999to 5.8% in 1998 and 4.8% in 1999

Agri. Forestry and Aqua culture
� Average growth rate in 2007-2011 were 3.4%/year
� Higher than growth target of 3-3.2% in 5 year plan
� But 0.6 percentage point lower than that in previous 5 years
� The growth rate of this sector gradually declined since 1992since 1992
� The growth rate was not stable, depending on weather, the change in domestic and international markets
� However, the growth rate is still higher than that by international standard

Reasons
� Inter. Eco. Integration has positive impacts: improving market access, but not significant, and not the factor that have large impact on growth of the sector
� Major reason in 2007 and 2008: bumper crops, increases in commodity price in international increases in commodity price in international market. In 2009, as the international price declined, the growth rate of this sector reduced to the lowest level since 1991, at 1.8%
� Decline in domestic protection: For some commodities, reductions go beyond the commitment schedule (as fresh, frozen and processed meats in 2007-2008; seafood)
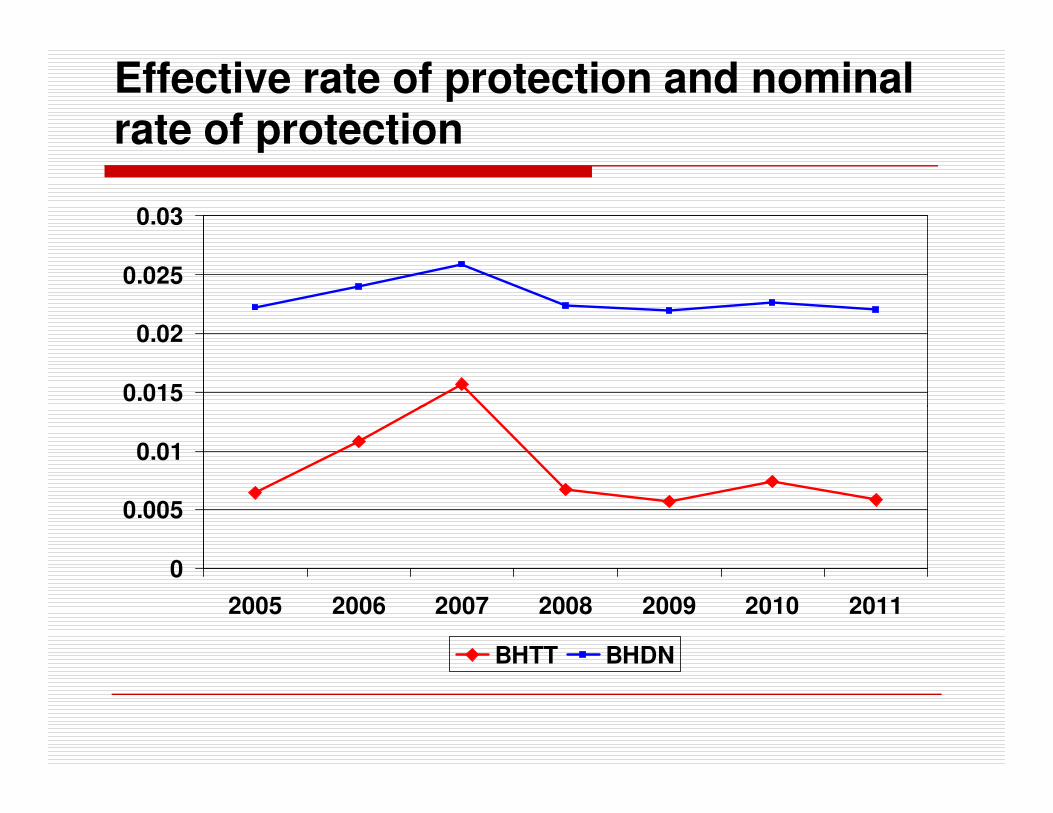
Effective rate of protection and nominal rate of protection
0.015
0.02
0.025
0.03
0
0.005
0.01
2005 2006 2007 2008 2009 2010 2011
BHTT BHDN

The ERP of some sub-sectors is lower than zero, 2011
Sub-sector ERP
Sugar cane -0,022327
Rubber -0,005268
Perennial trees -0,010558
Buffalo, cow meat -0,015582 Buffalo, cow meat -0,015582
Pig meat -0,178821
Poultry -0,066409
Agricultural service and other
agricultural products -0,084771
Wood -0,008056
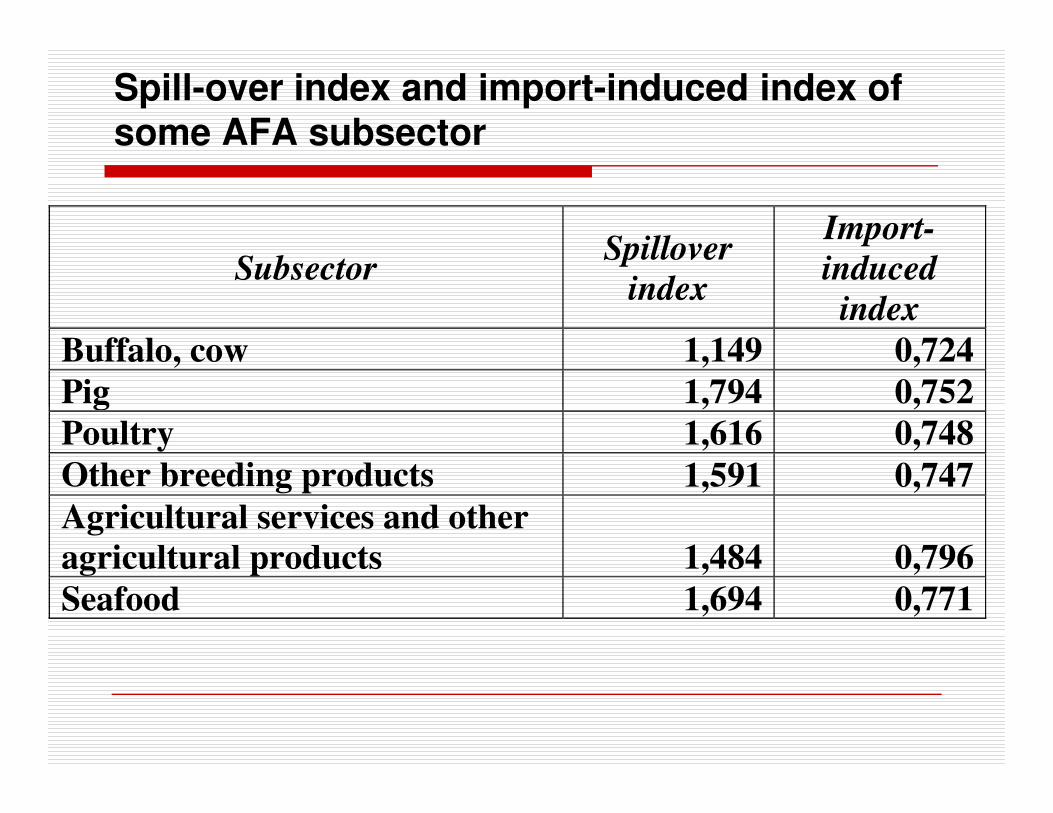
Spill-over index and import-induced index of some AFA subsector
Subsector Spillover
index
Import-
induced
index
Buffalo, cow 1,149 0,724
Pig 1,794 0,752 Pig 1,794 0,752
Poultry 1,616 0,748
Other breeding products 1,591 0,747
Agricultural services and other
agricultural products 1,484 0,796
Seafood 1,694 0,771
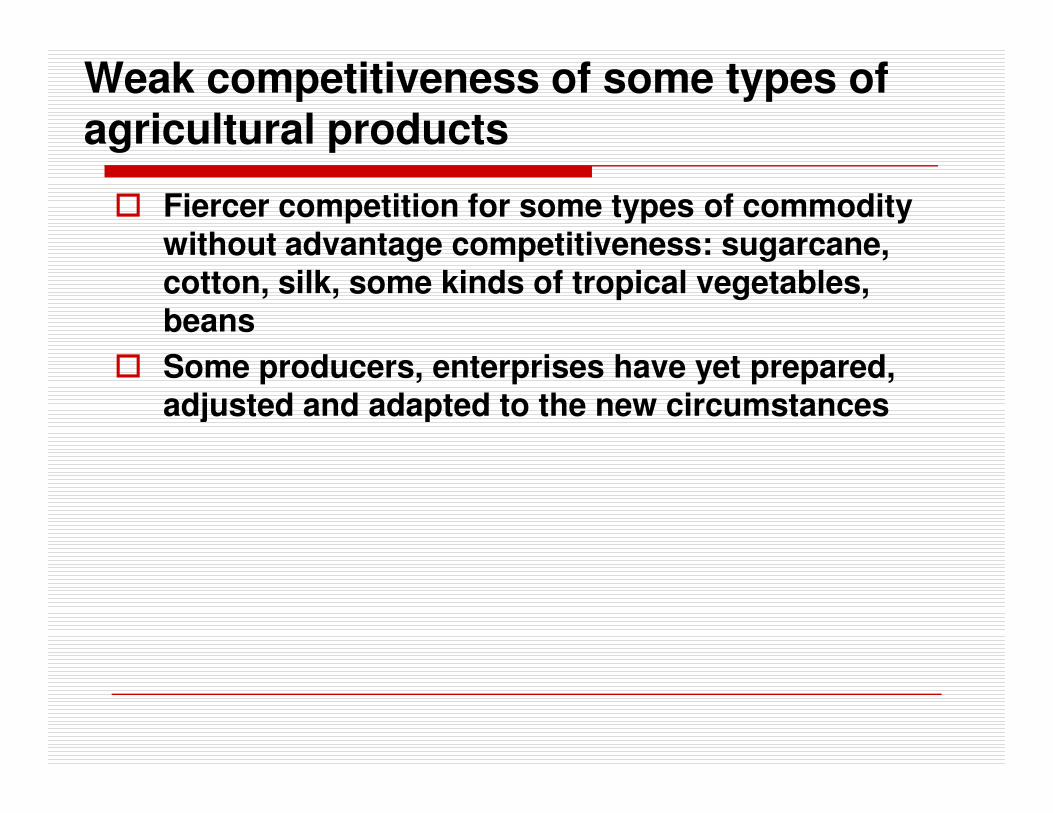
Weak competitiveness of some types of agricultural products
� Fiercer competition for some types of commodity without advantage competitiveness: sugarcane, cotton, silk, some kinds of tropical vegetables, beans
� Some producers, enterprises have yet prepared, adjusted and adapted to the new circumstancesadjusted and adapted to the new circumstances

Positive impacts of inter. eco. integration
� Fostering structural adjustment towards sectors having competitive export advantages (seafood, rice, coffee, rubber, cashew nut, peppercorn)
� Vietnamese producers have more serious business attitudes, care more about brand, quality and food hygiene safetyand food hygiene safety
� Accumulating more experiences in dealing with anti-dumping cases

Exploiting advantages?
� Achievements are below potentials and advantages of this sector
� Unsustainable development
� Low competiveness
� Not fully utilizing the available resources
� Research, scientific and technology transfer, branding development, and human resource development are limited
� Economic structural transformation in this sector is slow

Exploiting the advantage? (2)
� Productivity, quality and value added of food processing industry are low
� After-harvest lost is slightly high
� Production organization slowly reformed, not satisfied requirements for strong production developmentdevelopment
� Untrained workers could not find works in other sectors rather than agricultural-forestry-aquacultural sector
� Cultivating land is reduced
� Most of farmers depend on production methods that created low added value
� Slowness in diversifying production in rural areas

Industry – Construction
� Average annual growth rate in 2007-2011 was 7.0%
� Much lower than the growth rate of 10.2% p.a in previous 5 years
� Not achieve the growth target of 9.5-10.2% stated in 5 year 2006-2010 plan 5 year 2006-2010 plan
� Since 2008, the growth rate declined significantly

Value added growth rate (%)
Sector 2002 2004 2006 2007 2008 2009 2010 2011 2012
Industry-construction 9.5 10.2 10.4 9.4 6.0 5.5 7.7 6.3 4.2
Industry 9.2 10.6 10.2 8.7 7.8 4.0 7.0 8.5 5.2
Mining 1.1 8.9 0.6 -4.7 -3.8 7.6 -3.7 -0.1 3.5
Processing 11.6 10.9 12.4 12.6 9.8 2.8 8.4 9.0 4.5
Electric. gas.water supply 11.4 12.0 12.1 1.6 10.1 9.0 11.3 15.6 12.5
Construction 10.6 9.0 11.1 12.1 -0.4 11.4 10.1 -1.0 2.1

Reasons
� In 2008, raw material prices increased suddenly
� Domestic private sector has difficulty in accessing to capital
� Government investment was reduced to contain inflation
� In 2009, 2010, stimulus measures implemented� In 2009, 2010, stimulus measures implemented
� In 2011, strong measures to stabilize macroeconomic conditions, government expenditure was cut
� FDI inflow declined
� Tough competition with imported goods
� Reduction in domestic protections
GDP growth depends quite large on investment growth
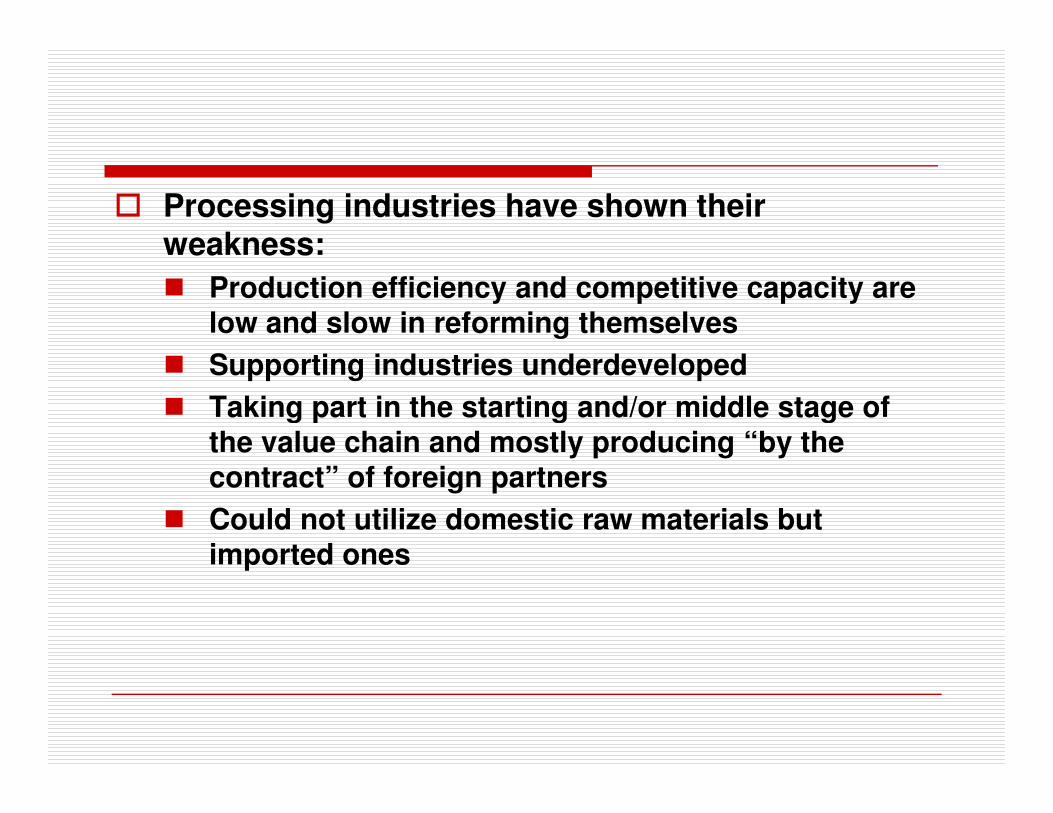
� Processing industries have shown their weakness:
� Production efficiency and competitive capacity are low and slow in reforming themselves
� Supporting industries underdeveloped
� Taking part in the starting and/or middle stage of � Taking part in the starting and/or middle stage of the value chain and mostly producing “by the contract” of foreign partners
� Could not utilize domestic raw materials but imported ones

Effective rate of protection and nominal rate of protection of industry and construction sector
0.03
0.035
0.04
0.045
0.05
0
0.005
0.01
0.015
0.02
0.025
2005 2006 2007 2008 2009 2010 2011
BHTT BHDN
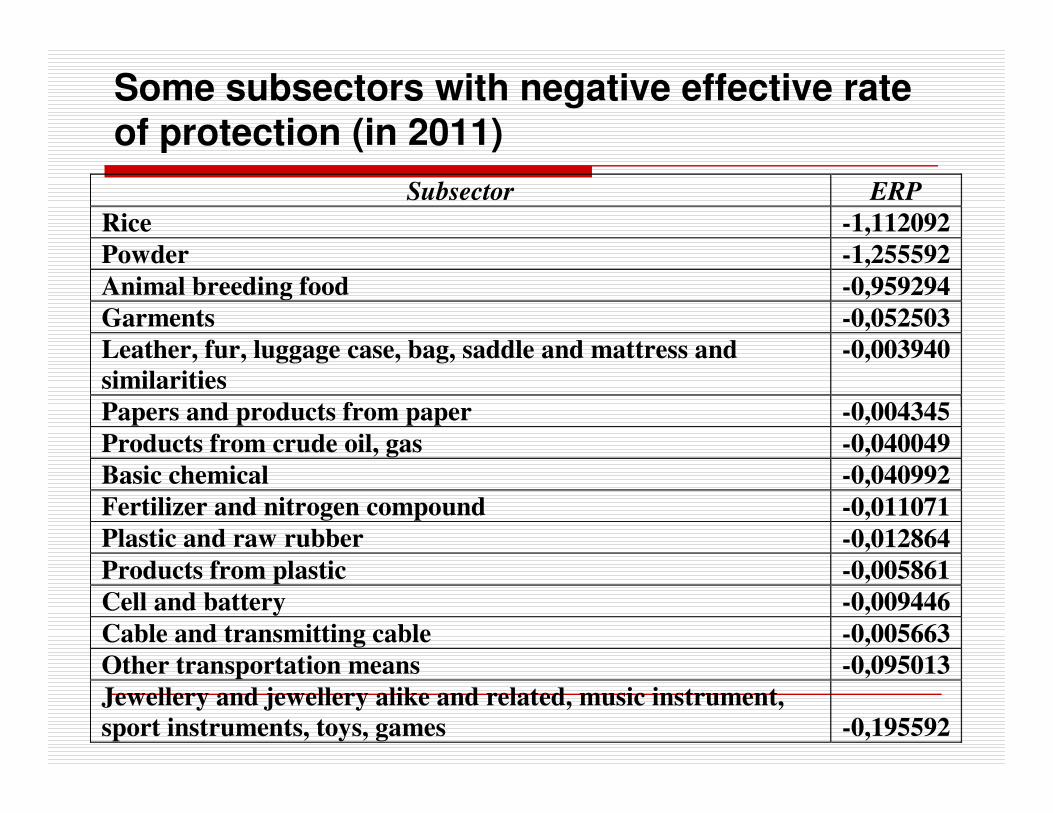
Some subsectors with negative effective rate of protection (in 2011)
Subsector ERP
Rice -1,112092
Powder -1,255592
Animal breeding food -0,959294
Garments -0,052503
Leather, fur, luggage case, bag, saddle and mattress and
similarities
-0,003940
Papers and products from paper -0,004345 Papers and products from paper -0,004345
Products from crude oil, gas -0,040049
Basic chemical -0,040992
Fertilizer and nitrogen compound -0,011071
Plastic and raw rubber -0,012864
Products from plastic -0,005861
Cell and battery -0,009446
Cable and transmitting cable -0,005663
Other transportation means -0,095013
Jewellery and jewellery alike and related, music instrument,
sport instruments, toys, games -0,195592

Economic spill-over index and import-induced index of three subsectors
Subsector Eco spill-over index Import-induced index
Rice processing 1,535418 0,732655
Powder
processing 1,479515 0,805157
Animal
breeding foods 1,636165 0,828221 breeding foods 1,636165 0,828221

Some subsectors with negative ERP, eco spill-over index < 1 and import-induced index > 1
Sector Spillover
index
Import-
induced
index
ERP
Garments 0,8746 1,1232 -0,0525
Leather, fur, luggage case, bag,
saddle, mattress, and similarities 0,9452 1,1761 -0,0040
Products from crude oil and gas 0,7949 2,0652 -0,0401 Products from crude oil and gas 0,7949 2,0652 -0,0401
Basic chemicals 0,9818 1,4339 -0,0410
Fertilizer and nitrogen compound 0,9926 1,4553 -0,0111
Plastic and raw rubber 0,9337 1,3382 -0,0129
Products from plastics 0,8113 1,1649 -0,0059

Some policy recommendations
� 1. Improve the business environment and increase the competitive capacity
� Continue comprehensively administrative reform
� Ensure macroeconomic stability; implement synchronous, consistent, flexible macroeconomic policy with feasible targets and timely measures.policy with feasible targets and timely measures.Closely coordinate among ministries in proposing, presenting and implementing policies.
� Profoundly deal with import surplus, coupled with increasing the production and export capability, fostering the development of supporting industry, and improving the product quality

Some policy recommendations (2)
� Improve the competitive capacity in three levels: national, firms and products
� Conduct researches, implement programs to increase the competitive capacity for sectors/industries having competitive potentials and programs to transform industries that lacks competitiveness.
� Increase the added values through improving the human � Increase the added values through improving the human capital, accessing to better technology, cooperating with strong partners in the same or similar industries
� Encourage firms to develop and apply scientific and technological knowledge in production
� Carry out encouraging policies to increase the competitiveness, especially focusing on restructuring the financial-banking sector, developing the infrastructure, supporting industry; and fastening trade and investment facilitation measures.

Some policy recommendations (3)
� Restructuring the economy, transform the growth model
� Sectoral policies
� Fully take advantage of current favorable conditions and reserved limitations in international commitments; have policies to support domestic firms and to direct investment towards sectors/industries that Vietnam needs
� Encourage to exploit opportunities to access to modern technology, increase the added value and product quality.technology, increase the added value and product quality.
� Encourage to reduce the transaction cost such as transportation, storage, port, post and telecommunication, finance and banking costs.
� Increase provision of the market information and marketing activities.
� Encourage firms to better exploit opportunities from free trade agreements to penetrate into foreign markets; moving from production by contract to producing and exporting directly.
� Maximize linkages with FDI firms, deeply integrate regional production chain.

Thank you for your attention!attention!