Assessing Theoretical Conclusions With Blinded Inference ...
15
Advances in Methods and Practices in Psychological Science 2019, Vol. 2(4) 335–349 © The Author(s) 2019 Article reuse guidelines: sagepub.com/journals-permissions DOI: 10.1177/2515245919869583 www.psychologicalscience.org/AMPPS ASSOCIATION FOR PSYCHOLOGICAL SCIENCE Empirical Article 869583AMP XX X 10.1177/2515245919869583Starns et al.Blinded Inference research-article 2019 Corresponding Author: Jeffrey J. Starns, Department of Psychological and Brain Sciences, University of Massachusetts, 135 Hicks Way, Amherst, MA 01003-9271 E-mail: [email protected] Assessing Theoretical Conclusions With Blinded Inference to Investigate a Potential Inference Crisis Jeffrey J. Starns 1 , Andrea M. Cataldo 1 , Caren M. Rotello 1 , Jeffrey Annis 2 , Andrew Aschenbrenner 3 , Arndt Bröder 4 , Gregory Cox 2 , Amy Criss 5 , Ryan A. Curl 5 , Ian G. Dobbins 6 , John Dunn 7 , Tasnuva Enam 8 , Nathan J. Evans 9 , Simon Farrell 7 , Scott H. Fraundorf 10,11 , Scott D. Gronlund 12 , Andrew Heathcote 13 , Daniel W. Heck 4 , Jason L. Hicks 14 , Mark J. Huff 15 , David Kellen 5 , Kylie N. Key 12 , Asli Kilic 16 , Karl Christoph Klauer 17 , Kyle R. Kraemer 8 , Fábio P. Leite 18 , Marianne E. Lloyd 19 , Simone Malejka 4 , Alice Mason 7 , Ryan M. McAdoo 12 , Ian M. McDonough 8 , Robert B. Michael 20 , Laura Mickes 21 , Eda Mizrak 22 , David P. Morgan 21 , Shane T. Mueller 23 , Adam Osth 24 , Angus Reynolds 13 , Travis M. Seale-Carlisle 21 , Henrik Singmann 25 , Jennifer F. Sloane 5 , Andrew M. Smith 26 , Gabriel Tillman 27 , Don van Ravenzwaaij 28 , Christoph T. Weidemann 29 , Gary L. Wells 26 , Corey N. White 30 , and Jack Wilson 5 1 Department of Psychological and Brain Sciences, University of Massachusetts Amherst; 2 Psychological Sciences, Vanderbilt University; 3 Department of Neurology, Washington University in St. Louis; 4 School of Social Sciences, University of Mannheim; 5 Department of Psychology, Syracuse University; 6 Department of Psychological & Brain Sciences, Washington University in St. Louis; 7 School of Psychological Science, University of Western Australia; 8 Department of Psychology, University of Alabama; 9 Department of Psychology, University of Amsterdam; 10 Department of Psychology, University of Pittsburgh; 11 Learning Research and Development Center, University of Pittsburgh; 12 Department of Psychology, University of Oklahoma; 13 School of Medicine, University of Tasmania; 14 Department of Psychology, Louisiana State University; 15 Department of Psychology, University of Southern Mississippi; 16 Department of Psychology, Middle East Technical University; 17 Department of Social Psychology and Methodology, Albert-Ludwigs-Universität Freiburg; 18 Department of Psychology, The Ohio State University at Lima; 19 Department of Psychology, Seton Hall University; 20 Department of Psychology, University of Louisiana at Lafayette; 21 Department of Psychology, Royal Holloway, University of London; 22 Department of Psychology, University of Zurich; 23 Department of Cognitive and Learning Sciences, Michigan Technological University; 24 Melbourne School of Psychological Sciences, The University of Melbourne; 25 Department of Psychology, University of Warwick; 26 Department of Psychology, Iowa State University; 27 Department of Psychological Sciences; Australian College of Applied Psychology; 28 Psychometrics and Statistics Department of Psychology, University of Groningen; 29 Department of Psychology, Swansea University; and 30 Department of Psychology, Missouri Western State University Abstract Scientific advances across a range of disciplines hinge on the ability to make inferences about unobservable theoretical entities on the basis of empirical data patterns. Accurate inferences rely on both discovering valid, replicable data patterns and accurately interpreting those patterns in terms of their implications for theoretical constructs. The replication crisis in science has led to widespread efforts to improve the reliability of research findings, but comparatively little attention has been devoted to the validity of inferences based on those findings. Using an example from cognitive psychology, we demonstrate a blinded-inference paradigm for assessing the quality of theoretical inferences from data. Our results reveal substantial variability in experts’ judgments on the very same data, hinting at a possible inference crisis.
Transcript of Assessing Theoretical Conclusions With Blinded Inference ...

https://doi.org/10.1177/2515245919869583
Advances in Methods and Practices in Psychological Science2019, Vol. 2(4) 335 –349© The Author(s) 2019Article reuse guidelines: sagepub.com/journals-permissionsDOI: 10.1177/2515245919869583www.psychologicalscience.org/AMPPS
ASSOCIATION FORPSYCHOLOGICAL SCIENCEEmpirical Article
869583 AMPXXX10.1177/2515245919869583Starns et al.Blinded Inferenceresearch-article2019
Corresponding Author:Jeffrey J. Starns, Department of Psychological and Brain Sciences, University of Massachusetts, 135 Hicks Way, Amherst, MA 01003-9271 E-mail: [email protected]
Assessing Theoretical Conclusions With Blinded Inference to Investigate a Potential Inference Crisis
Jeffrey J. Starns1 , Andrea M. Cataldo1 , Caren M. Rotello1, Jeffrey Annis2, Andrew Aschenbrenner3, Arndt Bröder4, Gregory Cox2, Amy Criss5, Ryan A. Curl5, Ian G. Dobbins6, John Dunn7, Tasnuva Enam8, Nathan J. Evans9, Simon Farrell7, Scott H. Fraundorf10,11, Scott D. Gronlund12, Andrew Heathcote13, Daniel W. Heck4, Jason L. Hicks14, Mark J. Huff15, David Kellen5, Kylie N. Key12, Asli Kilic16, Karl Christoph Klauer17, Kyle R. Kraemer8, Fábio P. Leite18, Marianne E. Lloyd19, Simone Malejka4, Alice Mason7, Ryan M. McAdoo12, Ian M. McDonough8, Robert B. Michael20, Laura Mickes21, Eda Mizrak22, David P. Morgan21, Shane T. Mueller23, Adam Osth24, Angus Reynolds13, Travis M. Seale-Carlisle21, Henrik Singmann25, Jennifer F. Sloane5, Andrew M. Smith26, Gabriel Tillman27, Don van Ravenzwaaij28, Christoph T. Weidemann29, Gary L. Wells26, Corey N. White30, and Jack Wilson5
1Department of Psychological and Brain Sciences, University of Massachusetts Amherst; 2Psychological Sciences, Vanderbilt University; 3Department of Neurology, Washington University in St. Louis; 4School of Social Sciences, University of Mannheim; 5Department of Psychology, Syracuse University; 6Department of Psychological & Brain Sciences, Washington University in St. Louis; 7School of Psychological Science, University of Western Australia; 8Department of Psychology, University of Alabama; 9Department of Psychology, University of Amsterdam; 10Department of Psychology, University of Pittsburgh; 11Learning Research and Development Center, University of Pittsburgh; 12Department of Psychology, University of Oklahoma; 13School of Medicine, University of Tasmania; 14Department of Psychology, Louisiana State University; 15Department of Psychology, University of Southern Mississippi; 16Department of Psychology, Middle East Technical University; 17Department of Social Psychology and Methodology, Albert-Ludwigs-Universität Freiburg; 18Department of Psychology, The Ohio State University at Lima; 19Department of Psychology, Seton Hall University; 20Department of Psychology, University of Louisiana at Lafayette; 21Department of Psychology, Royal Holloway, University of London; 22Department of Psychology, University of Zurich; 23Department of Cognitive and Learning Sciences, Michigan Technological University; 24Melbourne School of Psychological Sciences, The University of Melbourne; 25Department of Psychology, University of Warwick; 26Department of Psychology, Iowa State University; 27Department of Psychological Sciences; Australian College of Applied Psychology; 28Psychometrics and Statistics Department of Psychology, University of Groningen; 29Department of Psychology, Swansea University; and 30Department of Psychology, Missouri Western State University
AbstractScientific advances across a range of disciplines hinge on the ability to make inferences about unobservable theoretical entities on the basis of empirical data patterns. Accurate inferences rely on both discovering valid, replicable data patterns and accurately interpreting those patterns in terms of their implications for theoretical constructs. The replication crisis in science has led to widespread efforts to improve the reliability of research findings, but comparatively little attention has been devoted to the validity of inferences based on those findings. Using an example from cognitive psychology, we demonstrate a blinded-inference paradigm for assessing the quality of theoretical inferences from data. Our results reveal substantial variability in experts’ judgments on the very same data, hinting at a possible inference crisis.

336 Starns et al.
At the most fundamental level, science is the process of creating, testing, and refining ideas that explain and predict natural phenomena. Two core components are necessary for this process to be effective: First, research-ers must be able to produce reliable data patterns. Second, researchers must be able to reach sound theo-retical conclusions based on those patterns. Scientists in a variety of fields have developed techniques to minimize failure in the first component, that is, to cor-rect the surprisingly high rate of unreliable data pat-terns reported in the scientific literature, often referred to as the replication crisis (Open Science Collaboration, 2015). These techniques, including preregistration (Miguel et al., 2014), an increased emphasis on direct replication (Open Science Collaboration, 2015), and blinded analysis (MacCoun & Perlmutter, 2015), are crucial for promoting reliable scientific findings. How-ever, we suggest that advocates of research reform should broaden their scope to assess whether research-ers can make valid theoretical conclusions by analyzing empirical outcomes. This broader perspective could reveal whether some fields suffer from an inference cri-sis, that is, a situation in which researchers have a sur-prisingly high likelihood of drawing incorrect theoretical conclusions even if they are working with reliable, rep-licable data patterns (Rotello, Heit, & Dubé, 2015).
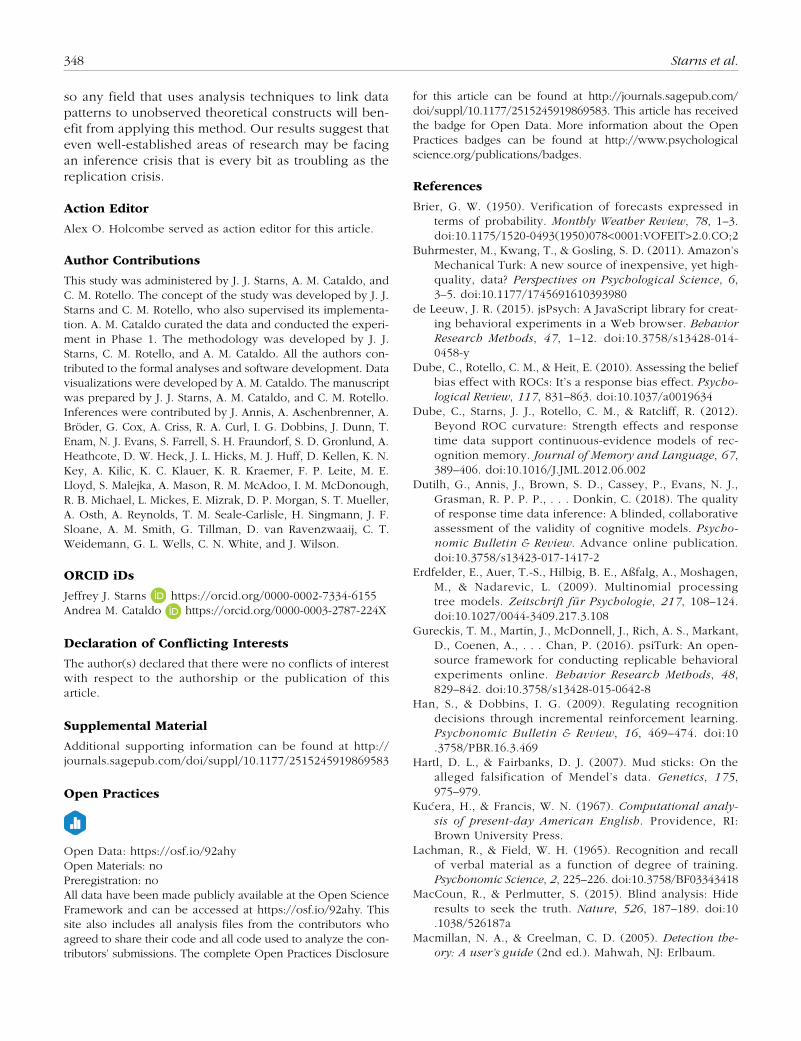
The most direct way to assess inferential skills is to create data sets for which the correct inferences are known and to determine whether researchers can dis-cover these correct inferences through blinded data analysis. This blinded-inference procedure is an exten-sion of blinding techniques that are familiar to research-ers. Figure 1 lists the general stages of the scientific process (top row), diagrams the corresponding phases of the current study (middle row), and describes the blinding procedures relevant to each phase (bottom row). During data collection and analysis, blinding techniques can be applied to reduce the tendency to promote desired outcomes. Specifically, blinded data collection refers to experimental designs that blind the experimental participant, the researcher, or both to the assigned condition (e.g., placebo vs. drug), minimizing their ability to change their behavior according to their beliefs about the assigned condition. Blinded-analysis techniques, increasingly common in physics (MacCoun & Perlmutter, 2015), hide from the data analyst either the true experimental condition from which each obser-vation is drawn (e.g., scrambled conditions) or the true value of each observation (i.e., addition of removable random noise), thereby limiting the analyst’s ability to
promote desired outcomes with analysis choices, as in the well-documented practice of p-hacking (Simmons, Nelson, & Simonsohn, 2011). These blinding procedures are valuable tools to limit the malign effects of researcher degrees of freedom, a term that refers to the wide range of design and analysis choices researchers can use to address the same research question (Simmons et al., 2011). A recent study (Silberzahn et al., 2018) high-lighted the influence of researcher degrees of freedom by sending the same data set to 29 teams of researchers and asking each team to determine whether soccer ref-erees disproportionately “red-card” darker-skinner play-ers. The results showed substantial variability in analysis techniques and conclusions across the research teams.
These blinding methods are excellent strategies to limit the influence of researcher degrees of freedom or to assess the consistency of inferences across research-ers, but they do not address the validity of those infer-ences. This extra step is crucial because researchers might make inference errors even if they are not pro-moting a desired outcome with their analysis choices, and these errors could be consistent across researchers who make similar choices (for examples, see Rotello et al., 2015). To assess the validity of theoretical infer-ence, we advocate widespread use of a blinded-inference design to supplement traditional approaches. In such a design, researchers who are blinded to condition assign-ment make inferences about the state of independent variables that are linked to theoretical constructs. Our characterization of the blinded-inference technique is heavily influenced by a recent study by Dutilh et al. (2018) in which condition-blinded data sets were sent to response time modelers who were asked to infer whether the conditions differed in terms of psychologi-cal constructs such as response caution and evidence strength. Our general characterization of the blinded-inference approach relies on Dutilh et al.’s innovative design with two modifications: First, we propose that analysts should be asked to make inferences about empirically manipulated factors rather than latent con-structs so that the correct inferences can be unambigu-ously defined. Second, we propose that analysts should be required to communicate their level of uncertainty in their inferences in terms of a probability distribution.
As characterized here, blinded inference can be used in any scenario in which researchers claim that they can (a) measure a theoretical construct on the basis of data patterns and (b) manipulate that theoretical con-struct with independent variables. If both of these claims are true, then researchers should be able to
Keywordsmemory, modeling, Bayesian methods, bootstrap, metascience, blinded inference, open data
Received 11/2/18; Revision accepted 6/25/19

337
Present Methods Blinding ProceduresScientific Stages
Expe
rimen
t A
Expe
rimen
t B
Data
Col
lect
ion
Stat
istic
al In
fere
nce
Theo
retic
al In
fere
nce
Blin
ded
Data
Col
lect
ion
Blin
ded
Anal
ysis
Blin
ded
Infe
renc
e
Expe
rimen
t C
Expe
rimen
t G
…
~
Grou
p As
sign
men
t Is
Unkn
own
to th
e Pa
rtici
pant
s an
d/or
Res
earc
hers
Co
llect
ing
the
Data
.
E.g.
, Clin
ical
Tria
ls
Som
e or
All
Aspe
cts
of a
Con
ditio
n Ar
e M
aske
d or
Rem
ovab
le N
oise
Is A
dded
to
Obse
rvat
ions
.
E.g.
, Phy
sics
Theo
retic
al M
odel
s Ar
e Us
ed to
Infe
r the
Sta
tes
of In
depe
nden
tVa
riabl
es.
Pres
ent S
tudy
Robu
st T
heor
ies
Allo
w S
ucce
ssfu
l Inf
eren
ce o
f Stu
dy M
anip
ulat
ions
Fro
m D
ata.
Theo
ry
“Dis
crim
inab
ility
Was
Man
ipul
ated
.”
Disc
rimin
abili
ty
Bias
Disc
rimin
abili
ty
Bias
Sign
al D
etec
tion
Theo
ry
Data
File
s Ho
sted
at O
SFEx
pert
Cont
ribut
ors
Infe
renc
es R
egar
ding
Ex
perim
enta
l Man
ipul
atio
ns
Data
Col
lect
ed o
n M
Turk
Fig
. 1.
Dia
gram
of
the
scie
ntific
pro
cess
. The
top r
ow
den
ote
s th
e m
ain s
tage
s. T
he
mid
dle
row
sch
emat
ical
ly o
utlin
es e
ach s
tage
of
the
met
hods
use
d i
n t
he
study
report
ed
in t
his
art
icle
. The
bottom
row
den
ote
s blindin
g te
chniq
ues
that
can
be
applied
in e
ach o
f th
e sc
ientific
stag
es (
exce
pt
theo
ry d
evel
opm
ent)
, in
cludin
g th
e blinded
-infe
rence
par
adig
m w
e ad
voca
te in t
his
art
icle
. M
Turk
= A
maz
on M
echan
ical
Turk
; O
SF =
Open
Sci
ence
Fra
mew
ork
.

338 Starns et al.
make accurate inferences about the state of indepen-dent variables specifically linked to the theoretical con-struct by analyzing data. If researchers fail in this task, this suggests that at least one of the claims is false; that is, it suggests that researchers lack valid techniques to measure the theoretical construct, lack valid ways to manipulate the construct, or both. Failures to validly measure theoretical constructs could arise from a vari-ety of problems. Some problems involve the process of selecting a measurement model to map patterns of data to underlying processes. Different models might suggest different inferences even if they have a similar ability to match observed data patterns. Other problems involve the process of applying the model; for example, biases in parameter estimation and mishandling of data can result in invalid inferences.
Consider a famous example of scientific inference: Mendel and his peas. Mendel recorded systematic pat-terns of variables—relationships between the traits of parents and offspring—and linked them to unobserv-able theoretical constructs—hereditary “factors” that obeyed certain laws. His data have been described as being too clean, with too few extreme observations, which may have been a result of “unconscious bias in classifying ambiguous phenotypes, stopping the counts when satisfied with the results, recounting when results seem suspicious, and repeating experiments whose outcome is mistrusted” (Hartl & Fairbanks, 2007, p. 975). Thus, Mendel’s conclusions might represent the first documented case of p(ea)-hacking. Clearly, Mendel would have benefited from using blinded analyses to eliminate researcher biases, but we wish to demonstrate how he could have gone further.
By applying his theory of genetics, Mendel claimed to be able to (a) measure underlying heritable factors by evaluating the phenotype of a plant and (b) manipu-late heritable factors in offspring by selecting parents with certain phenotypes. These claims are related to the validity of theoretical inference and could have been tested in a blinded-inference paradigm. For exam-ple, someone could have given Mendel a number of plants produced by mating parents with certain traits (unknown to Mendel) and asked him to use his laws of heritability to predict the likely traits of the parent plants by interpreting the traits of the offspring. Mendel would not have been able to make perfect inferences, of course, given that some phenotypes can be produced by multiple genotypes, but he should have been able to make substantially more accurate inferences than someone without a valid theory linking the phenotypes of parents and offspring. We claim that a procedure like this one would have provided a more compelling dem-onstration of the predictive value of Mendel’s laws than would unblinded data that could have been “massaged.”
Moreover, by revealing specific offspring phenotypes for which the parents’ phenotypes were particularly difficult to predict accurately, this procedure might have allowed the limitations in Mendel’s basic theory to be identified more quickly.
Many modern scientists share with Mendel the chal-lenge of making inferences about theoretical constructs on the basis of indirect evidence. For example, modern geoscientists infer the composition and dynamics of Earth’s interior using a variety of indirect methods, including radar and measurement of magnetic fields. Likewise, cosmologists have inferred that dark matter exists in the absence of direct observation. In our dis-cipline, cognitive processes are inferred from observ-able behaviors such as decision accuracy or response times. Thus, a critical step in establishing the validity of many scientific claims is to test the inferential power of the data, and this is precisely what the blinded-inference procedure achieves: If the researcher is blind to the nature of the manipulation, conclusions about what experimental factor was manipulated depend entirely on the data and not on the expectations or unconscious biases of the researcher.
In what follows, we demonstrate the blinded-inference paradigm with an example study using a rec-ognition memory paradigm. Briefly, the first three authors sent recognition memory researchers (the con-tributors) seven data sets generated with common experimental manipulations and asked them to make inferences about memory performance. In a standard recognition memory task, participants are asked to indi-cate whether they previously encountered a given stimulus (often a word) in a certain context (typically, a study list). A common question is whether, and to what extent, an independent variable affects discrim-inability (the ability to distinguish stimuli that were and were not seen in the target context), and in many cases this determination is obscured by differences in response bias (the overall predilection for responding “studied”). Signal detection theory (SDT; Macmillan & Creelman, 2005) was developed in the 1950s with the goal of separating discriminability and bias, and SDT-based measures have been in common use throughout psychology and other disciplines ever since. Several other models or measurement techniques have been developed as alternatives to SDT (Ratcliff, 1978; Riefer & Batchelder, 1988), and some of these have also achieved wide popularity throughout psychology (e.g., Erdfelder et al., 2009). Thus, researchers have had nearly seven decades to hone their ability to distinguish dis-criminability and bias as theoretical constructs, and thou-sands of published investigations have used models and measures that purportedly do so. We tested published memory researchers on their ability to detect whether

Blinded Inference 339
discriminability varied between experimental conditions that might have also varied in response biases.
We had two primary research questions: First, how vari-able are inferences across researchers? Finding high vari-ability across the researchers in our study would be unsettling, given that they all analyzed the same data. Sec-ond, and more important, how accurate are researchers’ inferences? If recognition memory researchers have effective methods for manipulating and measuring discriminability and bias, then they should be able to make accurate infer-ences about whether conditions come from the same level or from different levels of a discriminability manipulation.
To preview our results, we found surprisingly high variability in the contributors’ inferences, and we also found that many contributors made more inferential errors than would be expected if the only source of errors were sampling variability in the data. Given that our task required a relatively simple inference, we sus-pect that this pattern of surprisingly low inferential accuracy is likely to be found in other research areas. More broadly, however, we want to emphasize two positive implications of this study. First, it exemplifies scientists’ commitment to improving the research pro-cess, in that many respected memory researchers had the courage to put their conclusions to a public test. Second, despite the troubling error rate of the group, our framework identified multiple researchers who made highly accurate inferences. We therefore believe that our study demonstrates a promising methodology for the future goal of improving inferential quality by identifying best practices.
Disclosures
Data, materials, and online resources
All data, experiment code, contributor submissions and submission materials, and simulation code are available at the Open Science Framework (OSF; https://osf.io/ 92ahy). Additional details can be found in the contents guide provided at the OSF site. Supplemental Material for this article, including notes on the contributors’ under-standing of the problem, contributors’ methods, and simulation methods, can be accessed at http://journals .sagepub.com/doi/suppl/10.1177/2515245919869583.
Reporting
We report how we determined our sample size, all manipulations, and all measures in the study.
Ethical approval
All study procedures were approved by the institutional review board at the University of Massachusetts Amherst.
Method
Experimental design
The scheme in the middle panel of Figure 1 summarizes our design. There were two main phases of data col-lection. In Phase 1 (shown on the white background in the figure), we collected experimental data in a large-scale recognition memory experiment that used stan-dard study materials and had orthogonally varied factors known to influence memory discriminability and response bias. The between-participants design of Phase 1 is common in recognition memory research; for example, this design characterizes any comparison of memory performance between a special population (e.g., Alzheimer’s patients) and a control group. At the completion of Phase 1, subsets of the full data set were selected to generate seven two-condition “experiments” in which only the factor affecting discriminability varied (two experiments), only the factor affecting response bias varied (two experiments), both factors varied (two experiments), or neither varied (one experiment). The conditions in these seven experiments were masked. In Phase 2 (shown with the beige background in the figure), these data sets were shared with researchers who had published studies investigating recognition memory. These contributors were asked to rate the probability that each experiment had only a memory-discriminability manipulation, only a response-bias manipulation, both, or neither. The contributors were not told how many experiments of each type were included in the data sets, and they were free to select their preferred strategy for distinguishing memory dis-criminability and response bias.
Phase 1
Participants. A total of 459 participants were recruited through Amazon’s Mechanical Turk (Buhrmester, Kwang, & Gosling, 2011) using psiTurk (Gureckis et al., 2016). This sample size was selected because we needed a large pool of results from which we could sample data for the seven experiments sent to contributors. Participants earned $1.00 for completing the experiment.
Materials. The experiment used 104 English nouns that were three to seven letters long and had high natural-language frequency (at least 100 occurrences/million in Kucera & Francis, 1967). Four words were used in the practice block, and the remaining 100 were equally divided into two study lists, A and B. Participants were randomly assigned to study either List A or List B. All participants were tested on the combined list of all 100 words, so stimulus status (studied or unstudied) was counterbalanced across participants.

340 Starns et al.
Procedure. The experiment was coded in JavaScript using the jsPsych library (de Leeuw, 2015). Participants were given detailed instructions that included comprehen-sion checks for key components, and they completed a brief practice block before beginning the main task. Word order in the study and test phases was independently ran-domized for each participant. On each trial of the study phase, participants were asked to report whether the pre-sented word represented an animate object (all of the stimulus words represented clearly animate or inanimate objects, as judged by four independent raters). Each word remained on the screen until a response was entered. On each trial of the test phase, participants were first asked to report whether or not they had seen the presented word in the study phase. They were then asked to report how confident they were in their response, using a scale from 1 (not sure) to 3 (very sure). All responses were made via key press, and participants were asked to balance speed and accuracy throughout the experiment.
Memory discriminability and bias were manipulated between participants. Discriminability was manipulated by varying the number of times each word was pre-sented in the study phase (once, twice, or three times). Bias was manipulated by instructing participants to avoid making particular kinds of errors in the test phase. Specifically, participants in the conservative condition were told to particularly avoid false alarms (“old” responses to unstudied items), participants in the liberal condition were told to particularly avoid misses (“new” responses to studied items), and participants in the neu-tral condition were told to avoid the two kinds of errors equally. This manipulation was reinforced by varying the error feedback in the test phase: In the conservative condition, a “BAD ERROR!” message was displayed after false alarms, and a standard “ERROR” message was dis-played after misses; in the liberal condition, a standard “ERROR” message was displayed after false alarms, and a “BAD ERROR!” message was displayed after misses; and in the neutral condition, a standard “ERROR” mes-sage was displayed for both kinds of errors. The “BAD ERROR!” message was accompanied by a reminder of the type of error to particularly avoid and was presented longer than the standard “ERROR” message (2,500 ms vs. 500 ms). These manipulations were chosen because of their clear link to discriminability and bias, and indeed, none of the contributors challenged the clas-sification of study repetition as a discriminability manip-ulation and test instructions as a bias manipulation.
Phase 2
Participants. Contributors were recruited through tar-geted e-mails to researchers with a background in recogni-tion memory or models of memory and decision making. These individuals were encouraged to forward our invita-tion to other experts. Out of the 121 researchers who
ultimately received the invitation, a total of 46 (27 lead contributors, with 19 co-contributors) submitted analyses. The data were available to them in two phases. In the first phase (binary-data analyses), the confidence-rating data were withheld, and in the second, these data were included. The purpose of the phases was to investigate whether or not confidence ratings improved the quality of the contribu-tors’ inferences. Of the 27 groups of contributors, 14 submit-ted new analyses when the confidence-rating data were released. Two contributors declined authorship, and their inferences are de-identified in all public materials associated with this project. Of the 44 contributors who accepted authorship, 33 (representing 19 labs) opted to have their inferences associated with their identities; the others chose to remain anonymous. The 27 lead contributors had an average of 14.7 years of post-Ph.D. experience.
Materials. Subsets of test data collected in Phase 1 were sampled to form seven experiments for the con-tributors to analyze (see Table 1). Each experiment was designed to have two between-participants conditions that were from different levels of a memory-discriminability manipulation, a response-bias manipulation, both, or nei-ther. The data for each condition were created by taking separate random samples of participants who studied List A and participants who studied List B and combining those samples. Within each condition, the number of par-ticipants who had studied List A and the number who had studied List B were equal or very close to equal (off by 1). The data sets that the contributors received for the binary-data analyses included variables for participant ID, condition (1 or 2), study list (A or B), trial (1–100), test word, item type (target or lure), binary response (“old” or “new”), and response time. The data sets that the contributors received for the confidence-rating analy-ses additionally included the participant’s confidence rat-ing, both on the original 3-point scale and on a recoded scale that ranged from 1 (very sure new) to 6 (very sure old), and the response time for the confidence-rating response.
Contributors completed a submission template sum-marizing their analyses for each phase in which they par-ticipated (see https://osf.io/x2vn6/ for a blank example). The template asked contributors to report the research-ers collaborating on the submission, accept or decline authorship, and indicate whether they would prefer their conclusions to be de-identified. Contributors were then asked to describe their process for analyzing the data in sufficient detail for external replication, to describe any exclusion criteria that were applied, and to provide any code that they were comfortable sharing. All shared code is available at the OSF site (https://osf .io/92ahy). Finally, the contributors were asked to report, for each experiment, four probabilities corre-sponding to the four possible types of experiments, that is, the probability that the two conditions were from

Blinded Inference 341
(a) different levels of a memory-strength (discriminabil-ity) manipulation but not different levels of a bias manipulation, (b) different levels of a bias manipulation but not different levels of a memory-strength manipula-tion, (c) different levels of both a memory-strength manipulation and a bias manipulation, or (d) different levels of neither a memory-strength nor a bias manipula-tion (i.e., null data sets). These four probabilities had to sum to 1 for each experiment, as the four experiment types are mutually exclusive.
Procedure. Materials for the binary-data and confi-dence-rating-data analyses were posted to separate pri-vate OSF pages. The materials for the binary-data analyses were made accessible to contributors on July 7, 2017, and analyses were due August 31, 2017. The materials for the confidence-rating-data analyses were made accessible on September 9, 2017, and analyses were due on November 1, 2017. No changes to the binary-data analyses were allowed after the confidence-rating data were released. The independence of contributors’ inferences was sup-ported by conducting all communication between the coordinating team and the contributors via individually
generated e-mails, by hiding contributors’ identities until mid-November of 2017, and by strongly discouraging the contributors from discussing their interpretations of the data with other researchers in case they accidentally dis-covered their common participation.
Results
Phase 1 results
Complete data from this phase are available at OSF (https://osf.io/92ahy/). We offer no statistical interpretation of these data, given our goal of crowdsourcing that inter-pretation in Phase 2. However, we note that the outcome of this experiment is very consistent with the decades of recognition memory literature. For example, hit rates increased and false alarm rates decreased with repeated learning opportunities (as in, e.g., Lachman & Field, 1965; Ratcliff, Clark, & Shiffrin, 1990; Stretch & Wixted, 1998; Verde & Rotello, 2007). We also observed typical effects of response-bias manipulations: Both hit and false alarm rates tended to increase as increasingly liberal responding was encouraged (e.g., Dube, Starns, Rotello, & Ratcliff,
Table 1. Summary of the Seven Experiments Sent to Contributors, With Mean Hit and False Alarm Rates
Experiment and condition
Dis crim-inabil itya Biasb n Hit rate
False alarm rate
Experiment A Condition 1 3 Liberal 24 .873 .239 Condition 2 3 Conservative 24 .875 .126Experiment B Condition 1 1 Liberal 27 .865 .266 Condition 2 2 Conservative 25 .840 .191Experiment C Condition 1 2 Neutral 27 .861 .205 Condition 2 3 Neutral 24 .911 .174Experiment D Condition 1 1 Neutral 27 .781 .256 Condition 2 1 Conservative 26 .739 .195Experiment E Condition 1 1 Conservative 26 .742 .192 Condition 2 3 Neutral 24 .815 .190Experiment F Condition 1 1 Liberal 26 .812 .287 Condition 2 3 Liberal 26 .935 .164Experiment G Condition 1 2 Liberal 26 .847 .208 Condition 2 2 Liberal 26 .913 .208
aThis column shows the number of times each target word was presented in the study phase (1, 2, or 3 times). bThis column refers to the instructions given to participants in the test phase. The liberal instructions told participants to particularly avoid missing studied items, and the conservative instructions told participants to particularly avoid false alarms to unstudied memory probes; the neutral instructions emphasized the two types of errors equally.

342 Starns et al.
2012; Han & Dobbins, 2009; Starns, Hicks, Brown, & Martin, 2008; Swets, Tanner, & Birdsall, 1961), and the effects of bias were weaker when encoding strength was greater (e.g., Ratcliff, Sheu, & Gronlund, 1992).
Phase 2 results
Our response format was designed to highlight the fact that contributors needed to distinguish the effects of discriminability and bias, but we were primarily inter-ested in conclusions about whether there was a dis-criminability manipulation. A wide range of research questions in the recognition memory literature require conclusions about discriminability, whereas bias is more often considered a “nuisance” process. Moreover, focusing on discriminability gave the contributors the best chance to succeed because discriminability is bet-ter understood and less theoretically contentious than bias (Macmillan & Creelman, 2005). To isolate discrim-inability inferences, we collapsed probabilities for the “discriminability manipulation alone” and “both manip-ulations” categories to represent the reported probabil-ity of a discriminability manipulation, and we collapsed probabilities for the “bias manipulation alone” and “nei-ther manipulation” categories to represent the reported probability of no discriminability manipulation. In this article, we report results only for inferences about discriminability, but results for inferences about bias are available at OSF (see https://osf.io/yfpdz/); unsur-prisingly, performance was poorer for bias than for discriminability.
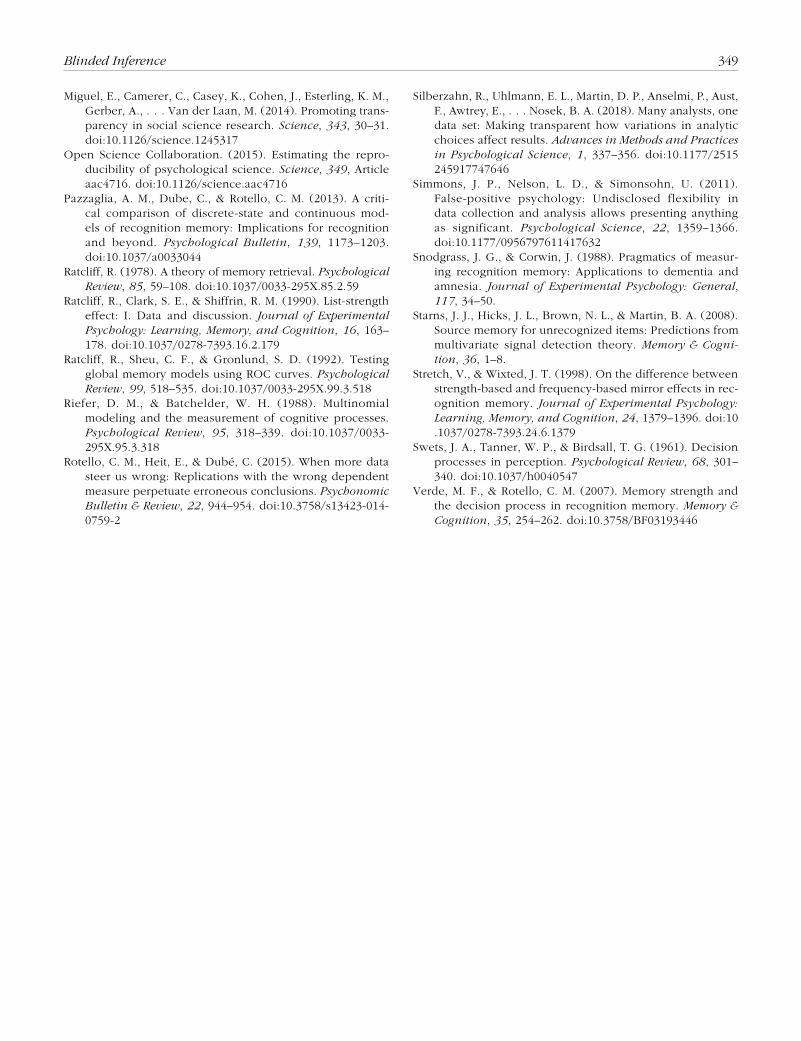
We first consider performance based on the data sets that did not include confidence-rating data (i.e., infer-ences based on the binary data). The histograms in Figure 2a show the distribution of the reported prob-ability of a discriminability manipulation for each of the seven experiments. (Note that throughout this sec-tion, we use the term contributor to refer to either an individual researcher or a group of researchers who submitted a single set of inferences, so the number of contributors matches the number of submissions, not the number of researchers.) The most striking finding apparent in this figure is the extremely high variability across contributors. For example, some contributors reported a 0% chance that Experiment A had a memory-discriminability manipulation, some reported a 100% chance, and the remaining responses followed an essentially uniform distribution between these two extremes. Responses were concentrated on the correct (green) side of the histograms for some experiments (e.g., D, F), but not for others (e.g., A, B). The high level of variability is surprising given that all the con-tributors received the same data sets. Figure 2b shows the data that informed the researchers’ inferences,
namely, the proportion of studied and nonstudied items called “old” (the hit rate and false alarm rates, respec-tively, in signal detection terms). A priori, some experi-ments seemed likely to be easier to interpret than others. This was the case, for example, when the effects on the hit and false alarm rates were both large and were consistent with the same theoretical inference (e.g., in Experiment F, the higher hit rate and lower false alarm rate for Condition 2 both indicated higher memory discriminability in this condition).
The variability in inferences was matched by high variability in the analysis methods selected by the con-tributors. These methods, identified on the y-axis of Figure 2d and explained in more detail in the Supple-mental Material, are purportedly capable of distinguish-ing memory discriminability and response bias. Within many of these techniques, some contributors used tra-ditional frequentist statistical methods (e.g., maximum likelihood estimation, significance tests), and others used Bayesian methods (e.g., posterior distributions of parameters or model selection via Bayes factors). No two groups used exactly the same analysis approach (e.g., the same exclusion criteria, measurement tech-nique, and statistical approach).
To summarize inferential accuracy, we counted the number of times across experiments that each contribu-tor reported the true discriminability-manipulation sta-tus as the more likely one, that is, reported more than a 50% chance of a discriminability manipulation when discriminability was in fact manipulated or reported less than a 50% chance of a discriminability manipula-tion when it was not. Figure 2c is a histogram of these results. Slightly more than half of the contributors per-formed well by this measure, correctly describing five or six of the seven data sets, but the other contributors performed more poorly. We note that the contributor with zero correct inferences estimated a 50% chance of a discriminability manipulation for every experiment, so in fairness, this contributor did not make any incor-rect inferences either.
Even a valid inference procedure will sometimes lead to inaccurate conclusions because of sampling vari-ability, so we needed to identify a benchmark accuracy level below which it would be reasonable to conclude that an invalid inference technique had been applied. We performed model simulations to identify this bench-mark. In the simulations, we generated data sets by randomly sampling data from a signal detection model. We then analyzed those data sets with measures derived from the same model (see the Supplemental Material for details). Each simulated data set contained the same type of information as the data sets sent to the contribu-tors, with no labeling to identify the experimental manipulation (if any). Thus, the simulation code

Blinded Inference 343
a b
.5
.6
.7
.8
.91.0
.5
.6
.7
.8
.91.0
.5
.6
.7
.8
.91.0
.5
.6
.7
.8
.91.0
.5
.6
.7
.8
.91.0
.5
.6
.7
.8
.91.0
.5
.6
.7
.8
.91.0
Hit R
ate
Hit R
ate
Hit R
ate
Hit R
ate
Hit R
ate
Hit R
ate
False Alarm Rate
Hit R
ate
05
101520
1.0
1.0
1.0
1.0
1.0
.0 .1 .2 .3 .4 .5
.0 .1 .2 .3 .4 .5
.0 .1 .2 .3 .4 .5
.0 .1 .2 .3 .4 .5
.0 .1 .2 .3 .4 .5
.0 .1 .2 .3 .4 .5
.0 .1 .2 .3 .4 .5
.0 .2 .4 .6 .8
.0 .2 .4 .6 .8
.0 .2 .4 .6 .8
.0 .2 .4 .6 .8
.0 .2 .4 .6 .8
.0 .2 .4 .6 .8
1.0.0 .2 .4 .6 .8
1.0
Expe
rimen
t A
05
101520
Expe
rimen
t B
05
101520
Expe
rimen
t C
05
101520
Expe
rimen
t D
05
101520
Expe
rimen
t E
05
101520
Expe
rimen
t F
05
101520
Estimated Probabilityof Memory Effect
Expe
rimen
t G
Condition 2, No ExclusionsCondition 1, No Exclusions
Condition 2, ExclusionsCondition 1, Exclusions
Fig. 2. (continued on next page)

344 Starns et al.
performed blinded inference just as the contributors did. The key difference between the simulation code and the contributors’ analyses is that the former used an inference procedure that was known to be valid (i.e., consistent with the process that generated the data), so the results represent expected performance levels if sampling variability is the only source of inaccuracy. We set performance benchmarks such that only 10% of the simulated studies fell below the benchmark values;
that is, the benchmarks were set such that performance would rarely be as bad as or worse than a benchmark when a valid inference method is applied.
Nearly half the contributors fell below the benchmark for the number of correct inferences (the dashed line in Fig. 2c), which suggests that some aspect of their inference method was ineffective. To assess whether our empirical data sets were a particularly misleading sam-ple (like the 10% of simulated data sets that produced
c
d
0
2
4
6
8
0 1 2 3 4 5 6 7
Number of Correct Inferences
Num
ber o
f Con
tribu
tors
SDT FLBA BSDT F
RTROC BDDM FREM FSDT BLBA B
ChanceGLM FSDT B
SDTPlots
2HT BLBA, DDM B
RTROCSDT
2HT, SDT BLBA F
DDM BSDT BSDT B
A' FDDM B
SDT BSDT, DDM B
DDM B
−1.0 −.5 .0 .5 1.0Adjusted Brier Score
Fig. 2. Results for inferences regarding whether the experiments included a discriminability manipulation. The histograms in (a) show contributors’ estimated probabilities of a discriminability manipulation in each of the seven experiments when only the binary data were available (i.e., the data did not include confidence ratings). Red backgrounds denote incorrect estimates, whereas green backgrounds denote correct estimates. The graphs in (b) show hit and false alarm rates for the two conditions in each of the seven experiments, for both the full data set and the data after contributors’ exclusions. The histogram in (c) shows the distribution of the number of correct inferences per contributor across all seven experiments for the binary data sets. The dashed vertical line denotes the simulation-based benchmark for reasonable performance. The adjusted Brier score for each contributor is shown in (d). The labels indicate the chosen method of analysis. (Labels for contributors who were willing to have their names associated with their responses are in boldface. A figure that identifies these contributors is available at the Open Science Framework, at https://osf.io/s35b8/.) Black points represent scores for the binary-data analysis. Black points with green or red outlines indicate scores from the binary-data analysis for groups that elected to contribute to the data analysis with confidence ratings. Colored points represent scores for the data analysis with confidence ratings; red indicates that performance decreased when confidence ratings were included in the analysis, and green indicates that performance increased. The solid vertical line denotes chance performance, and the dashed verti-cal line denotes the simulation-based benchmark for reasonable performance. DDM = drift diffusion model; SDT = signal detection theory; A′ = a measure for area under the receiver-operating characteristic (ROC) curve that is not linked to any particular decision model; LBA = linear ballistic accumulator model; 2HT = two-high-threshold model; RTROC = response time ROC functions; Plots = judging plots of hit and false alarm rates by eye; GLM = generalized linear model; REM = retrieving-effectively-from-memory model; B = Bayesian; F = frequentist. See the Supplemental Material for more information on the models and measurement procedures.

Blinded Inference 345
accuracy below our benchmark even when a valid infer-ence technique was applied), we used the analysis tech-nique from the simulation on the actual data sets sent to the contributors. These analyses yielded correct inferences for six of the seven data sets. Thus, the empirical data sets do not seem to be a “bad,” or misleading, sample.
Scientists should be able to express appropriate degrees of certainty in their conclusions, so we also assessed accuracy with a measure that is sensitive to probability estimates: the Brier (1950) score. The Brier score is computed as the variance between the predicted probability that an outcome will occur and the actual (0 or 1) outcome. To aid interpretation, we adjusted our Brier scores such that 0 represents chance performance, 1 represents perfect performance, and –1 represents the worst possible performance (see the Supplemental Material for details). In our case, the outcome was whether or not the two conditions in an experiment used different levels of a discriminability manipulation. Thus, reporting a 50% probability of a discriminability manipulation for all data sets would result in a score of 0, reporting a 100% probability for all data sets with a discriminability manipulation and a 0% probability for all data sets without a discriminability manipulation would result in a score of 1, and reporting a 0% prob-ability for all data sets with a discriminability manipula-tion and a 100% probability for all data sets without a discriminability manipulation would result in a score of –1. In our simulations exploring performance levels for a valid inference technique, the median adjusted Brier score was .44, and 10% of scores fell below .13, which thus served as our benchmark for problematic infer-ences. Applying the analysis technique from the simula-tions to the empirical data sets sent to the contributors produced a Brier score of .38, which is well above our benchmark.
Figure 2d shows the ranked Brier scores for the contributors (labeled by their inference technique; see the Supplemental Material for more information on models and measurement techniques). The score for the contributor who reported a 50% probability for every data set is on the chance line. Although this con-tributor returned no correct inferences, about one third of the contributors had lower Brier scores (i.e., per-formed more poorly). The contributors whose perfor-mance was below chance made multiple incorrect inferences with high confidence; in other words, their reported probabilities provided misinformation because they reported probabilities near 0% for experiments that did have a discriminability manipulation and/or probabilities near 100% for experiments that did not have a discriminability manipulation. Roughly half of the contributors were below the benchmark for problematic inferences, shown by the dashed vertical line in Figure
2d. In other words, the researchers fairly commonly made the mistake of being inappropriately confident in their incorrect inferences. Some contributors did achieve Brier scores that were basically as high as could be expected given sampling variability in the data, which suggests that they applied appropriate inference methods. Given the poor overall performance, one might wonder whether these high-performing contribu-tors were simply lucky, which would indicate that none of the contributors truly succeeded in the inference task. The Supplemental Material includes analyses that strongly support the conclusion that at least some of the contributors applied valid inference procedures.
Inference errors were not strongly associated with the choice of any particular analysis technique. The y-axis of Figure 2d reveals no clear pattern. Methods used by multiple contributors tend to appear at both ends of the performance scale, as do techniques relying on Bayesian approaches.
Our simulation results also showed that inferences about discriminability were generally robust to different measurement methods, at least for data patterns similar to those in our experiments. Specifically, we reanalyzed all of the simulated data sets using a different measure of discriminability (Pr = hit rate – false alarm rate) that is consistent with a class of models (Pazzaglia, Dube, & Rotello, 2013; Snodgrass & Corwin, 1988) different from the data-generating signal detection model. These analyses achieved accuracy levels that were well above our benchmarks for problematic inferences for both number of correct inferences and Brier score (see the Supplemental Material for details). Pr depends on dif-ferent processing assumptions than does the signal detection model used to sample the simulated data sets, but the two methods often yield similar discriminability inferences for data sets like the ones sent to the con-tributors (inferences start to diverge for data sets that have large bias effects, but the bias effects in our data sets were moderate). Thus, it is possible to make appro-priate conclusions about discriminability when using a measurement model that does not exactly match the processes generating the data, and selecting an incor-rect measurement model cannot entirely explain the poor inference performance revealed in Figure 2.
Variability in inferences was not predictable from contributors’ rules for censoring data. Although the cen-soring rules used by different contributors clearly resulted in different hit and false alarm rates (see Fig. 2b), we were unable to identify any systematic relation-ship between these rules and the accuracy of infer-ences. Moreover, seven contributors did not exclude any data, yet they used different analytic tools and reached different conclusions about the probability of a discriminability effect.

346 Starns et al.
Theoretically, effects of discriminability and bias are more easily distinguished with receiver-operating char-acteristic (ROC) curves formed from confidence-rating data than with binary old/new response data (Rotello et al., 2015). In the second round of blinded inference, 14 contributors analyzed the data with confidence rat-ings included and offered new probability ratings based on the ROCs in each experiment. The resulting Brier scores appear in Figure 2d with horizontal lines mark-ing the difference from the corresponding Brier scores based on the binary-response data. The largest changes were actually negative, indicating that inferential accu-racy was reduced with ROC data.
Discussion
Distinguishing memory-discriminability effects from bias effects is a common empirical issue for recognition memory researchers that has important theoretical and practical implications; for example, understanding mem-ory processes in a special population (e.g., older adults) hinges on the ability to determine if differences from a control group reflect differences in memory discrim-inability. The available tools to interpret discriminability are well established, and some have been in use for nearly 70 years (Macmillan & Creelman, 2005). Despite these truths, the experts who served as contributors in this study had mixed success when faced with the task of inferring whether discriminability had been manipu-lated across conditions that might have also had differ-ent levels of response bias. Strikingly, the reported probability of a discriminability effect was highly vari-able across contributors even though they all received the same data sets. One natural interpretation of these results is that the data themselves were too noisy to allow clear inference. Our simulations are inconsistent with that conclusion, as 90% of simulated studies yielded five or more (of seven possible) correct inferences about discriminability. Thus, we view the outcome of this blinded-inference study as a challenge to recognition memory researchers—one that should result in a reeval-uation of methods and in humbler presentation of con-clusions that rely on the ability to distinguish discriminability and bias effects.
The fact that we found generally low inferential qual-ity when researchers used decades-old analysis tools shows that the normal practice of science is not suffi-cient to ensure effective analysis techniques. Indeed, some examples of systematically problematic inferences have survived decades of scientific review, to the detri-ment of theoretical progress (see, e.g., Dube, Rotello, & Heit, 2010, for a specific example and Rotello et al., 2015, for a more general treatment). Widespread use of the blinded-inference procedure will help to quickly
identify these problems and refine analysis methods to optimize the quality of inferences.
Constraints on generality
Our study provides information about only a single research scenario—assessing differences in discrim-inability on the basis of recognition memory data—but the fact that we found surprisingly low accuracy for this relatively simple inferential task suggests that problem-atic inferential procedures may plague a broad range of research domains. However, these different domains must be assessed individually in future work, and our results should not be used to make general conclusions about the validity of scientific research. Even within the field of recognition memory, our results are directly troubling only in reference to conclusions that rely on the ability to measure discriminability and bias when both processes can potentially vary. Although this is an unavoidable situation for some research questions (e.g., whether memory differs across populations), for other questions memory researchers can substantially sim-plify the inferential process by experimentally control-ling bias when evaluating discriminability, or vice versa. Moreover, memory researchers use a wide range of different types of paradigms and data beyond the rec-ognition task that we investigated.
The blinded-inference paradigm demonstrated here is also not a substitute for good theory testing and development. A theory that makes correct assumptions could perform poorly in blinded inference because of limitations in the analysis tools available to implement the measurement properties of the theory, and a theory that makes incorrect assumptions might nevertheless serve as a useful tool in some situations (e.g., Newton’s laws are sufficient for many applications despite being incomplete). Our results show that inferential problems are not limited to particular theoretical approaches in recognition memory: Even researchers who relied on the same measurement model were highly variable in their inferences. Good theory development should run on several parallel tracks simultaneously: empirical assessment, quantitative modeling or analysis, and, we argue, blinded-inference studies to establish that appli-cations of the theory can truly measure what they are intended to measure.
Another potential limitation of our results is that the contributors might have applied different analysis stan-dards for this project than they would in a “real” study conducted in their labs. We cannot rule out the possi-bility that the contributors might have made better infer-ences if they had been analyzing their own data for their own purposes, but there are many good reasons to consider this unlikely. The vast majority of the

Blinded Inference 347
contributors elected to be coauthors on this manuscript, and a majority (33/46) agreed to have their name directly linked to their performance level in presenta-tions and publications (note that although names are not used in Fig. 2, results are identified by name at OSF). Thus, one could argue that the contributors had a stronger incentive for rigor than in typical studies, for which no one is likely to rerun the analyses or compare conclusions with an “answer key.” Indeed, the contribu-tors generally displayed a remarkable level of motiva-tion and dedication to the project; some applied state-of-the-art techniques such as hierarchical Bayesian modeling or analyzed the data with multiple measure-ment models to inform their conclusions. Moreover, the majority of contributors agreed to make their analysis code publicly available at OSF (14 of the 27 submis-sions). Thus, we are confident that the inferential prob-lems that we observed are not based on a simple lack of effort, and although we cannot rule out the possibil-ity that some contributors made careless, easily correct-able mistakes, we seriously doubt that these mistakes can fully explain the problems that we observed.
Comparison with similar studies
Our results are similar to those of Silberzahn et al. (2018) in that both studies revealed high variability in infer-ences across contributors who all received the same data. In many ways, though, the high variability in the present case is even more surprising—and troubling—given that our inference task represented a fairly com-mon research scenario. Whereas Silberzahn et al.’s contributors addressed the novel research question of whether referees are biased against darker-skinned players by analyzing real-world data that lacked an experimental control, the contributors in the current study addressed a research question that has been a focus of recognition memory research for decades using data from controlled experiments.
Our results are also similar in some respects to those of the previous blinded-inference study reported by Dutilh et al. (2018), but direct comparisons are difficult because of procedural differences between the two studies. In Dutilh et al.’s study, response time modelers analyzed unlabeled data sets with the goal of inferring whether the conditions differed with regard to psycho-logical constructs represented in response time models. Unfortunately, the contributors disagreed about which cognitive processes should theoretically vary as a func-tion of certain experimental manipulations; in other words, they had different views about what the “answer key” should be. Different scoring rules were developed in light of this disagreement, so it is difficult to charac-terize overall performance. When the originally planned
scoring was used, at least, the percentage of correct inferences (71%) was similar to our overall accuracy rate (68%). We recommend that future blinded-inference studies adopt the strategy of asking contributors to make inferences about experimental manipulations as opposed to underlying theoretical processes in order to avoid scoring ambiguities. A second difference between our study and that of Dutilh et al. also limits our ability to compare the results: Their contributors were not required to express their uncertainty with probability distributions. As a result, we do not know if their con-tributors’ inferences varied as dramatically as our con-tributors’ inferences, which ranged from probabilities of 0% to 100% for some data sets, and we cannot compare Brier scores between the two studies.
Refining analysis quality
Blinded inference can be a method to not only assess inference quality, but also improve it. Many of the con-tributors expressed surprise when they learned of their performance level and indicated that they would care-fully reevaluate their chosen analysis techniques. Our results show that inferential problems for recognition memory data are not a simple consequence of choosing poor measurement techniques, as there are many instances of the same technique being used by both high- and low-performing contributors. Defining the characteristics of effective inference will require addi-tional research, but for now, we recommend that analysts try a variety of analysis techniques and, ideally, ask other researchers to independently analyze the same data, reserving high confidence for consistent inferences.
Conclusion
We end by again emphasizing that all the contributors to this study drew inferences about the same data. Thus, the disparate conclusions that they reached are not another example of the replication crisis. The contribu-tors were allowed to use any analysis and any data-censoring criteria they preferred, but those researcher degrees of freedom could not systematically influence their conclusions because the contributors were blind to the nature of the manipulations in the experiments. Thus, our findings suggest that current efforts to improve research quality are incomplete, in that they largely focus on limiting researchers’ ability to bias results by promoting desired outcomes (whether implicitly or explicitly). Even unbiased analysis techniques can be ineffective, so it is critical for scientists to subject their skills as analysts to direct (and public) tests. The blinded-inference paradigm is a promising method of assessing inferential quality and improving analysis procedures,
348 Starns et al.
so any field that uses analysis techniques to link data patterns to unobserved theoretical constructs will ben-efit from applying this method. Our results suggest that even well-established areas of research may be facing an inference crisis that is every bit as troubling as the replication crisis.
Action Editor
Alex O. Holcombe served as action editor for this article.
Author Contributions
This study was administered by J. J. Starns, A. M. Cataldo, and C. M. Rotello. The concept of the study was developed by J. J. Starns and C. M. Rotello, who also supervised its implementa-tion. A. M. Cataldo curated the data and conducted the experi-ment in Phase 1. The methodology was developed by J. J. Starns, C. M. Rotello, and A. M. Cataldo. All the authors con-tributed to the formal analyses and software development. Data visualizations were developed by A. M. Cataldo. The manuscript was prepared by J. J. Starns, A. M. Cataldo, and C. M. Rotello. Inferences were contributed by J. Annis, A. Aschenbrenner, A. Bröder, G. Cox, A. Criss, R. A. Curl, I. G. Dobbins, J. Dunn, T. Enam, N. J. Evans, S. Farrell, S. H. Fraundorf, S. D. Gronlund, A. Heathcote, D. W. Heck, J. L. Hicks, M. J. Huff, D. Kellen, K. N. Key, A. Kilic, K. C. Klauer, K. R. Kraemer, F. P. Leite, M. E. Lloyd, S. Malejka, A. Mason, R. M. McAdoo, I. M. McDonough, R. B. Michael, L. Mickes, E. Mizrak, D. P. Morgan, S. T. Mueller, A. Osth, A. Reynolds, T. M. Seale-Carlisle, H. Singmann, J. F. Sloane, A. M. Smith, G. Tillman, D. van Ravenzwaaij, C. T. Weidemann, G. L. Wells, C. N. White, and J. Wilson.
ORCID iDs
Jeffrey J. Starns https://orcid.org/0000-0002-7334-6155Andrea M. Cataldo https://orcid.org/0000-0003-2787-224X
Declaration of Conflicting Interests
The author(s) declared that there were no conflicts of interest with respect to the authorship or the publication of this article.
Supplemental Material
Additional supporting information can be found at http://journals.sagepub.com/doi/suppl/10.1177/2515245919869583
Open Practices
Open Data: https://osf.io/92ahyOpen Materials: noPreregistration: noAll data have been made publicly available at the Open Science Framework and can be accessed at https://osf.io/92ahy. This site also includes all analysis files from the contributors who agreed to share their code and all code used to analyze the con-tributors’ submissions. The complete Open Practices Disclosure
for this article can be found at http://journals.sagepub.com/doi/suppl/10.1177/2515245919869583. This article has received the badge for Open Data. More information about the Open Practices badges can be found at http://www.psychological science.org/publications/badges.
References
Brier, G. W. (1950). Verification of forecasts expressed in terms of probability. Monthly Weather Review, 78, 1–3. doi:10.1175/1520-0493(1950)078<0001:VOFEIT>2.0.CO;2
Buhrmester, M., Kwang, T., & Gosling, S. D. (2011). Amazon’s Mechanical Turk: A new source of inexpensive, yet high-quality, data? Perspectives on Psychological Science, 6, 3–5. doi:10.1177/1745691610393980
de Leeuw, J. R. (2015). jsPsych: A JavaScript library for creat-ing behavioral experiments in a Web browser. Behavior Research Methods, 47, 1–12. doi:10.3758/s13428-014-0458-y
Dube, C., Rotello, C. M., & Heit, E. (2010). Assessing the belief bias effect with ROCs: It’s a response bias effect. Psycho-logical Review, 117, 831–863. doi:10.1037/a0019634
Dube, C., Starns, J. J., Rotello, C. M., & Ratcliff, R. (2012). Beyond ROC curvature: Strength effects and response time data support continuous-evidence models of rec-ognition memory. Journal of Memory and Language, 67, 389–406. doi:10.1016/J.JML.2012.06.002
Dutilh, G., Annis, J., Brown, S. D., Cassey, P., Evans, N. J., Grasman, R. P. P. P., . . . Donkin, C. (2018). The quality of response time data inference: A blinded, collaborative assessment of the validity of cognitive models. Psycho-nomic Bulletin & Review. Advance online publication. doi:10.3758/s13423-017-1417-2
Erdfelder, E., Auer, T.-S., Hilbig, B. E., Aßfalg, A., Moshagen, M., & Nadarevic, L. (2009). Multinomial processing tree models. Zeitschrift für Psychologie, 217, 108–124. doi:10.1027/0044-3409.217.3.108
Gureckis, T. M., Martin, J., McDonnell, J., Rich, A. S., Markant, D., Coenen, A., . . . Chan, P. (2016). psiTurk: An open-source framework for conducting replicable behavioral experiments online. Behavior Research Methods, 48, 829–842. doi:10.3758/s13428-015-0642-8
Han, S., & Dobbins, I. G. (2009). Regulating recognition decisions through incremental reinforcement learning. Psychonomic Bulletin & Review, 16, 469–474. doi:10 .3758/PBR.16.3.469
Hartl, D. L., & Fairbanks, D. J. (2007). Mud sticks: On the alleged falsification of Mendel’s data. Genetics, 175, 975–979.
Kucera, H., & Francis, W. N. (1967). Computational analy - sis of present-day American English. Providence, RI: Brown University Press.
Lachman, R., & Field, W. H. (1965). Recognition and recall of verbal material as a function of degree of training. Psychonomic Science, 2, 225–226. doi:10.3758/BF03343418
MacCoun, R., & Perlmutter, S. (2015). Blind analysis: Hide results to seek the truth. Nature, 526, 187–189. doi:10 .1038/526187a
Macmillan, N. A., & Creelman, C. D. (2005). Detection the - o ry: A user’s guide (2nd ed.). Mahwah, NJ: Erlbaum.
Blinded Inference 349
Miguel, E., Camerer, C., Casey, K., Cohen, J., Esterling, K. M., Gerber, A., . . . Van der Laan, M. (2014). Promoting trans-parency in social science research. Science, 343, 30–31. doi:10.1126/science.1245317
Open Science Collaboration. (2015). Estimating the repro-ducibility of psychological science. Science, 349, Article aac4716. doi:10.1126/science.aac4716
Pazzaglia, A. M., Dube, C., & Rotello, C. M. (2013). A criti-cal comparison of discrete-state and continuous mod-els of recognition memory: Implications for recognition and beyond. Psychological Bulletin, 139, 1173–1203. doi:10.1037/a0033044
Ratcliff, R. (1978). A theory of memory retrieval. Psychological Review, 85, 59–108. doi:10.1037/0033-295X.85.2.59
Ratcliff, R., Clark, S. E., & Shiffrin, R. M. (1990). List-strength effect: I. Data and discussion. Journal of Experimental Psychology: Learning, Memory, and Cognition, 16, 163–178. doi:10.1037/0278-7393.16.2.179
Ratcliff, R., Sheu, C. F., & Gronlund, S. D. (1992). Testing global memory models using ROC curves. Psychological Review, 99, 518–535. doi:10.1037/0033-295X.99.3.518
Riefer, D. M., & Batchelder, W. H. (1988). Multinomial modeling and the measurement of cognitive processes. Psychological Review, 95, 318–339. doi:10.1037/0033-295X.95.3.318
Rotello, C. M., Heit, E., & Dubé, C. (2015). When more data steer us wrong: Replications with the wrong dependent measure perpetuate erroneous conclusions. Psychonomic Bulletin & Review, 22, 944–954. doi:10.3758/s13423-014-0759-2
Silberzahn, R., Uhlmann, E. L., Martin, D. P., Anselmi, P., Aust, F., Awtrey, E., . . . Nosek, B. A. (2018). Many analysts, one data set: Making transparent how variations in analytic choices affect results. Advances in Methods and Practices in Psychological Science, 1, 337–356. doi:10.1177/2515 245917747646
Simmons, J. P., Nelson, L. D., & Simonsohn, U. (2011). False-positive psychology: Undisclosed flexibility in data collection and analysis allows presenting anything as significant. Psychological Science, 22, 1359–1366. doi:10.1177/0956797611417632
Snodgrass, J. G., & Corwin, J. (1988). Pragmatics of measur-ing recognition memory: Applications to dementia and amnesia. Journal of Experimental Psychology: General, 117, 34–50.
Starns, J. J., Hicks, J. L., Brown, N. L., & Martin, B. A. (2008). Source memory for unrecognized items: Predictions from multivariate signal detection theory. Memory & Cogni - tion, 36, 1–8.
Stretch, V., & Wixted, J. T. (1998). On the difference between strength-based and frequency-based mirror effects in rec-ognition memory. Journal of Experimental Psychology: Learning, Memory, and Cognition, 24, 1379–1396. doi:10 .1037/0278-7393.24.6.1379
Swets, J. A., Tanner, W. P., & Birdsall, T. G. (1961). Decision processes in perception. Psychological Review, 68, 301–340. doi:10.1037/h0040547
Verde, M. F., & Rotello, C. M. (2007). Memory strength and the decision process in recognition memory. Memory & Cognition, 35, 254–262. doi:10.3758/BF03193446