
Assessing the value of commonly used methods for measuring ... · ORIGINAL EMPIRICAL RESEARCH...
22
ORIGINAL EMPIRICAL RESEARCH Assessing the value of commonly used methods for measuring customer value: a multi-setting empirical study Sara Leroi-Werelds & Sandra Streukens & Michael K. Brady & Gilbert Swinnen Received: 28 January 2013 /Accepted: 21 October 2013 /Published online: 1 December 2013 # Academy of Marketing Science 2013 Abstract Despite the importance of customer value, consid- erable divergence of opinion exists on how to adequately conceptualize and measure this construct. In this study, four commonly used methods for measuring customer value (i.e., the methods proposed by Dodds et al. (1991), Gale (1994), Holbrook (1999) and Woodruff and Gardial (1996)) are com- pared. First and foremost, the psychometric properties of the different methods are evaluated. Next, the authors compare the predictive ability of the different methods with respect to key outcome variables (i.e., satisfaction, word of mouth, re- purchase intention). Finally, the methods are compared based on their relative practicality and actionability. The authors’ findings show that each method has its own benefits and costs and should be used based on its suitability for a particular application. The paper culminates with a prescriptive flow- chart that summarizes the main findings and provides direc- tion for choosing the optimal value measurement method. Keywords Customer value . Perceived value . Measurement methods . Comparison In today’ s increasingly competitive business world, in which customers are more demanding and more value conscious than ever before (Sweeney and Soutar 2001), it is indispens- able for organizations to understand how to assess value from the customer ’s perspective (Sweeney and Soutar 2001; Woodruff 1997). Customer value, which can be defined as a tradeoff between the offering’ s benefits and costs perceived by the customer, has been widely recognized as an essential ingredient for firm performance (Slater 1997; Woodruff 1997). Additionally, the importance of customer value is underscored by Vargo and Lusch (2004) when they presented service-dominant logic. In their groundbreaking Journal of Marketing article (Vargo and Lusch 2004), they refer to value more than 50 times and it plays a central role in at least three of their foundational premises (see also Woodruff and Flint 2006). Because of the importance of customer value to the mar- keting literature as well as marketing practice, it has been extensively studied in recent years. However, there is a press- ing need for further understanding of how value should be measured (e.g., Sánchez-Fernández et al. 2009; Sweeney and Soutar 2001) since “making customer value strategies work begins with an actionable understanding of the concept itself” (Woodruff 1997, p. 141). Although a great number of value measurement methods are offered in the literature, no empir- ical work exists that considers the relative performance of the most popular methods. We argue that this is a critical over- sight, as empirical evidence concerning how to optimally conceptualize and measure perceived customer value repre- sents a necessary condition for realizing the full potential of customer value management. In response to this gap in the literature, we aim to assess and compare the performance of four commonly used cus- tomer value measurement methods (i.e., Dodds et al. 1991; Gale 1994; Holbrook 1999; Woodruff and Gardial 1996). We compare these methods with regard to two quantitative and S. Leroi-Werelds (*) : S. Streukens : G. Swinnen Department of Marketing & Strategy, Hasselt University, Agoralaan - D, 3590 Diepenbeek, Belgium e-mail: [email protected] S. Streukens e-mail: [email protected] G. Swinnen e-mail: [email protected] M. K. Brady Department of Marketing, College of Business, Florida State University, 821 Academic Way, P.O. Box 3061110, Tallahassee, FL, USA e-mail: [email protected] J. of the Acad. Mark. Sci. (2014) 42:430–451 DOI 10.1007/s11747-013-0363-4
Transcript of Assessing the value of commonly used methods for measuring ... · ORIGINAL EMPIRICAL RESEARCH...
ORIGINAL EMPIRICAL RESEARCH
Assessing the value of commonly used methods for measuringcustomer value: a multi-setting empirical study
Sara Leroi-Werelds & Sandra Streukens &Michael K. Brady & Gilbert Swinnen
Received: 28 January 2013 /Accepted: 21 October 2013 /Published online: 1 December 2013# Academy of Marketing Science 2013
Abstract Despite the importance of customer value, consid-erable divergence of opinion exists on how to adequatelyconceptualize and measure this construct. In this study, fourcommonly used methods for measuring customer value (i.e.,the methods proposed by Dodds et al. (1991), Gale (1994),Holbrook (1999) and Woodruff and Gardial (1996)) are com-pared. First and foremost, the psychometric properties of thedifferent methods are evaluated. Next, the authors comparethe predictive ability of the different methods with respect tokey outcome variables (i.e., satisfaction, word of mouth, re-purchase intention). Finally, the methods are compared basedon their relative practicality and actionability. The authors’findings show that each method has its own benefits and costsand should be used based on its suitability for a particularapplication. The paper culminates with a prescriptive flow-chart that summarizes the main findings and provides direc-tion for choosing the optimal value measurement method.
Keywords Customer value . Perceived value .Measurementmethods . Comparison
In today’s increasingly competitive business world, in whichcustomers are more demanding and more value consciousthan ever before (Sweeney and Soutar 2001), it is indispens-able for organizations to understand how to assess value fromthe customer’s perspective (Sweeney and Soutar 2001;Woodruff 1997). Customer value, which can be defined as atradeoff between the offering’s benefits and costs perceived bythe customer, has been widely recognized as an essentialingredient for firm performance (Slater 1997; Woodruff1997). Additionally, the importance of customer value isunderscored by Vargo and Lusch (2004) when they presentedservice-dominant logic. In their groundbreaking Journal ofMarketing article (Vargo and Lusch 2004), they refer to valuemore than 50 times and it plays a central role in at leastthree of their foundational premises (see also Woodruffand Flint 2006).
Because of the importance of customer value to the mar-keting literature as well as marketing practice, it has beenextensively studied in recent years. However, there is a press-ing need for further understanding of how value should bemeasured (e.g., Sánchez-Fernández et al. 2009; Sweeney andSoutar 2001) since “making customer value strategies workbegins with an actionable understanding of the concept itself”(Woodruff 1997, p. 141). Although a great number of valuemeasurement methods are offered in the literature, no empir-ical work exists that considers the relative performance of themost popular methods. We argue that this is a critical over-sight, as empirical evidence concerning how to optimallyconceptualize and measure perceived customer value repre-sents a necessary condition for realizing the full potential ofcustomer value management.
In response to this gap in the literature, we aim to assessand compare the performance of four commonly used cus-tomer value measurement methods (i.e., Dodds et al. 1991;Gale 1994; Holbrook 1999; Woodruff and Gardial 1996). Wecompare these methods with regard to two quantitative and
S. Leroi-Werelds (*) : S. Streukens :G. SwinnenDepartment of Marketing & Strategy, Hasselt University,Agoralaan - D, 3590 Diepenbeek, Belgiume-mail: [email protected]
S. Streukense-mail: [email protected]
G. Swinnene-mail: [email protected]
M. K. BradyDepartment of Marketing, College of Business, Florida StateUniversity, 821 Academic Way, P.O. Box 3061110,Tallahassee, FL, USAe-mail: [email protected]
J. of the Acad. Mark. Sci. (2014) 42:430–451DOI 10.1007/s11747-013-0363-4

two subjective topics. First, we investigate the measurementmodel associated with the four methods by examining theirpsychometric properties, which is a crucial step in the evalu-ation of measurement methods. Second, we examine thestructural models associated with the four methods by com-paring their abilities to predict key customer outcome mea-sures (i.e., customer satisfaction, repurchase intentions, andword of mouth). Third, we evaluate the practicality of thedifferent methods both from the researcher’s and practitioner’spoints of view. Finally, we evaluate the actionability of thefour methods in terms of their abilities to offer specific direc-tions for improvement. To ensure cross-validation of results,model comparisons take place across four different productsettings. The paper culminates with a prescriptive flowchartthat offers advice on the most suitable measurement approachacross a variety of commonly encountered settings.
We organize the rest of this paper as follows. First, we givea brief literature review in which we describe customer value,present the four methods for measuring customer value thattake central stage in this study, and discuss their similaritiesand differences. Second, we describe the four topics of com-parison. Next, we discuss the research design, and subsequent-ly, we describe our findings with respect to each of the topics.Finally, we discuss the results and limitations, and makesuggestions for further research.
Literature review
Conceptual background on customer value
A review of the existing literature on customer value providessome key insights into the nature of the concept. First, al-though a number of definitions have been put forth, the oneproposed by Zeithaml (1988, p. 14), “the consumer’s overallassessment of the utility of a product based on perceptions ofwhat is received and what is given,” is perhaps the mostuniversally accepted definition of customer value (e.g., Chenand Dubinsky 2003; Flint et al. 2002; Ruiz et al. 2008).Second, customer value is perceived by the customer; there-fore, it is the customer who defines the value of a product orservice and not the supplier (Vargo and Lusch 2004;Woodruff1997). Third, customer value is personal. Each customerperceives value based upon personal characteristics such ashis/her own needs and desires, knowledge, previous experi-ence, and financial resources (Grönroos 2011; Holbrook1999; Woodall 2003). Fourth, the value perceived by thecustomer depends on circumstances, time frame, and location(Holbrook 1999; Woodruff 1997; Woodruff and Gardial1996). For example, a hot cup of tea can be very valuable inwinter, but an ice cold cup of lemonade may be preferred insummer. Fifth, customer value implies an interaction betweena subject (the customer) and an object (e.g., a product, a
service, a store). This latter characteristic distinguishes cus-tomer value from customer values, which are the customer’score values, purposes, and goals in life (Holbrook 1999;Woodruff 1997; Woodruff and Gardial 1996). Sixth, customervalue is experiential, which means that it resides not in theproduct purchased or the brand chosen, but in the consump-tion experiences derived therefrom. Hence, the subject (i.e.,the customer) interacts with the object (i.e., the product orservice) by using or experiencing it in some way (Holbrook1999). This perspective is in line with the notion of value-in-use, which implies that real value only emerges during use,since “value is not created and delivered by the supplier butemerges during usage in the customer’s process of valuecreation” (Grönroos and Ravald 2011, p. 8). The firm facili-tates the customer’s value creation process by producing anddelivering resources that represent potential value (or expectedvalue-in-use).
In this study, we focus on product settings in business-to-consumer (hereafter B-to-C) physical goods markets.Although value is a key construct in nearly every consumptionsetting, recent research in B-to-B (e.g., Blocker et al. 2011;Ulaga and Eggert 2006) and service (e.g., Chan et al. 2010)markets suggests that measuring value in those settings re-quires the consideration of personal interactions. This perspec-tive is in line with the notion of value co-creation mentionedby Grönroos and colleagues (Grönroos 2011; Grönroos andRavald 2011; Grönroos and Voima 2013). They mention thatduring direct interactions with the customer, the supplier getsopportunities for value co-creation, which implies that thesupplier can influence the customer’s process of value crea-tion, with the intention of enhancing the level of value.Because of the fundamental nature of interactions in servicesettings and business markets, personal interactions betweenthe customer and the supplier can be a source of value aboveand beyond the value of the core offering itself (Ulaga andEggert 2006). Hence, personal interactions should be takeninto account when measuring customer value in those mar-kets. Because the four value measures assessed here do notcapture personal interactions, we place our focus on the per-ceived value of physical goods in B-to-C settings.
Customer value conceptualizations
An overview of the literature reveals two main approaches tothe operationalization of customer value: a one-dimensionalapproach and a multi-dimensional approach. The one-dimensional approach to customer value represents the originof the study of customer value (Sánchez-Fernández andIniesta-Bonillo 2007). According to the one-dimensionalview, customer value is “a single overall concept that can bemeasured by a self-reported item (or set of items) that evalu-ates the consumer’s perception of value” (Sánchez-Fernándezand Iniesta-Bonillo 2007, p. 430).
J. of the Acad. Mark. Sci. (2014) 42:430–451 431
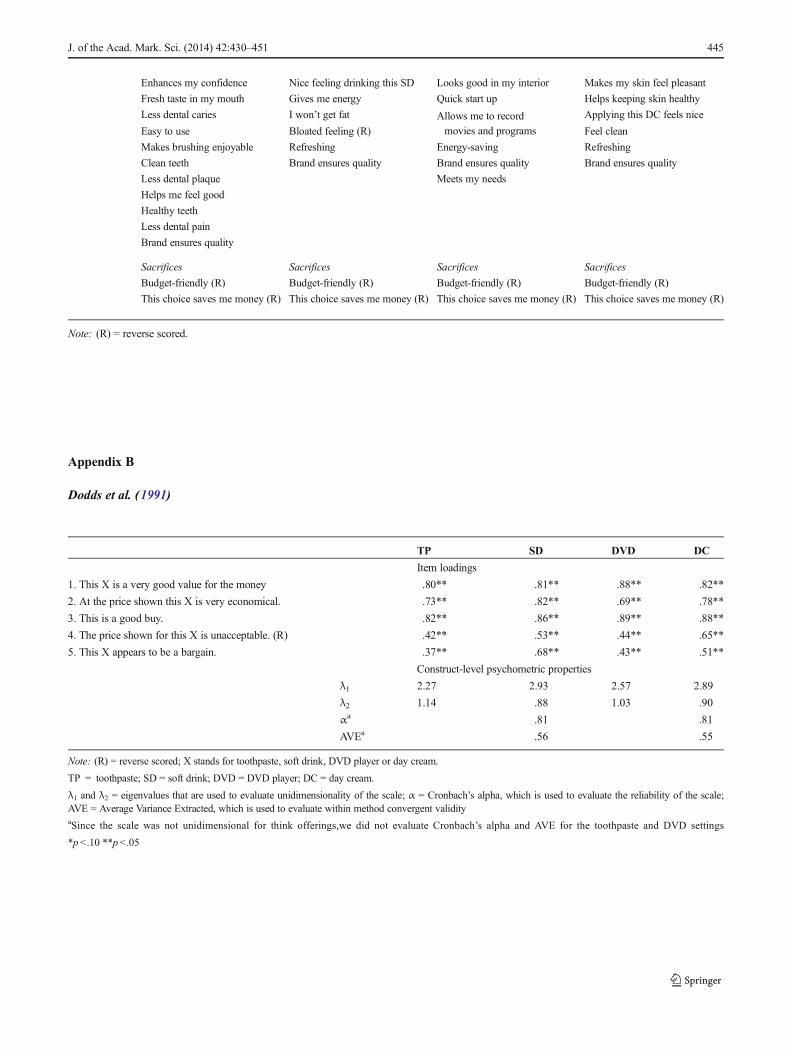
One of the first approaches to measure customer value isthe one-dimensional measurement method developed byDodds et al. (1991). These authors defined customer valueas “a cognitive tradeoff between perceived quality and sacri-fice” (Dodds et al. 1991, p. 316). On the basis of this defini-tion, they measure customer value by asking respondents fivesummary questions concerning the overall value of the prod-uct or service (see Appendix B for a list of the items). As canbe seen in the wording of the items, this approach focuses onthe monetary exchange and the overall price-quality relation-ship. Empirical studies using the measurement scale of Doddset al. (1991) include Teas and Agarwal (2000), Agarwal andTeas (2001), Baker et al. (2002), Chen and Dubinsky (2003)and Caruana and Fenech (2005).
Although an often-mentioned advantage of the one-dimensional measurement method is its simplicity and easeof implementation (Lin et al. 2005), many researchers (e.g.,Ruiz et al. 2008; Sweeney and Soutar 2001) point out thatcustomer value is too complex to be captured by a one-dimensional measurement method. As a response to this cri-tique, so-called multi-dimensional approaches have been putforth, which consider customer value as consisting of severalinterrelated components or dimensions (Sánchez-Fernándezand Iniesta-Bonillo 2007).
We pause here to elaborate on means-end theory as afoundation for understanding the multi-dimensional ap-proaches for studying customer value. Means-end theory(Gutman 1982) provides the necessary theoretical backgroundof how customers view products. It states that the way prod-ucts are related to customers can be represented by threelevels: attributes, consequences, and desired end-states.Attributes are physical characteristics or features of a productsuch as size, shape, or on-time delivery. Consequences aremore subjective experiences resulting from product use, suchas a reduction in lead time or a pleasant experience (Gutman1982; Woodruff and Gardial 1996). Finally, desired end-statesare the customer’s core values, purposes, and goals in life andcan be formally defined as “centrally held and enduring be-liefs about right and wrong, good and bad that cut acrosssituations and products or services” (Woodruff 1997, p.141). The key premise of means-end theory is that individualsare goal-directed and use products as a way to achieve valuedstates of being such as happiness, security, accomplishment(Gutman 1982). Products and services - and their relatedcustomer value - are thus means to reach those end-states.With regard to the operationalization of customer value, someresearchers adopted an attribute-based view, whereas othersprefer a consequence-based view on the topic. The key differ-ence here is whether the items refer to qualities the productpossesses (attributes) versus qualities the product delivers(consequences).
Gale (1994, p. xiv) focuses on product attributes and de-fines customer value as “market perceived quality adjusted for
the relative price of your product.” The basic premise under-lying Gale's (1994) ‘Customer Value Analysis’ is that custom-er value equals the difference between a weighted qualityscore (termed market-perceived quality) and a weighted pricescore (termed market-perceived price). The process of creat-ing a market-perceived quality score is as follows:
1. Make a list of the product attributes that customers andcompetitor’s customers find important. These attributesare known by the company or elicited from in-depth orfocus group interviews, and they cover all relevant aspectsrelated to perceived quality.
2. Establish how the various quality attributes are weightedin the customer’s decision. This can be done by askingcustomers to evaluate the importance of the variousattributes.
3. Ask customers to rate the performance of the product andcompeting products on each of the attributes.
4. Multiply the performance score on each attribute by theweight of that attribute, and add the results to get themarket-perceived quality score.
The same procedure holds for creating a market-perceivedprice score. Based on the market-perceived quality score andmarket-perceived price score, the firm can evaluate the valueof its products and compare it with the value of competingproducts. Authors following Gale's (1994) Customer ValueAnalysis include Laitamäki and Kordupleski (1997), Lamet al. (2004) and Setijono and Dahlgaard (2007).
Woodruff and Gardial (1996) argue that value creationtakes place at the consequence level and that consequencescan be positive or negative. More formally, value is consid-ered to be “the result of the trade-off between the positive andnegative consequences of product use as perceived by thecustomer” (p. 57). According to Woodruff and Gardial(1996), many firms view their output as a bundle of attributesand focus their research and development on improving theiroffering by adding, refining, or deleting attributes, whereascustomers are interested in the consequences of using orpossessing the product. They argue that a shift in focus fromattributes to consequences will result in value creation thatleads to a more pronounced and sustainable competitive ad-vantage. Rather than simply focusing on attributes, firms mustunderstand how and why customers prefer certain productattributes, which requires understanding the consequences ofproduct use (Overby et al. 2004).
Finally, there are different classifications of types of cus-tomer value. With regard to such typologies, Holbrook’smethod is considered “the most comprehensive approach tothe value construct because it captures more potential sourcesof value than do other conceptualizations” (Sánchez-Fernández et al. 2009, p. 97). Further, Holbrook’s typologyencompasses other measurement methods proposed in theliterature. For example, the Perceived Value (PERVAL) scale
432 J. of the Acad. Mark. Sci. (2014) 42:430–451

suggested by Sweeney and Soutar (2001) and the ExperienceValue Scale (EVS) proposed by Mathwick et al. (2001) arevalue typologies that are based on or fit within Holbrook’s(1999) value typology. Holbrook (1999, p. 5) defined custom-er value as “an interactive relativistic preference experience”and developed a customer value framework that reflects threeunderlying dimensions: (1) extrinsic value versus intrinsicvalue (i.e., an offering appreciated for its functional, utilitarianability to achieve something versus an offering appreciated asan end-in-itself), (2) self-oriented value versus other-orientedvalue (i.e., an offering prized for the effect it has on oneselfversus the effect it has on others), and (3) active value versusreactive value (i.e., the customer acts on the object versus theobject acts on the customer). Using the three dimensionsoutlined above, Holbrook (1999) developed a matrixrepresenting eight types of customer value: efficiency,excellence, status, esteem, play, aesthetics, ethics, andspirituality.
The Holbrook typology involves the co-existence of dif-ferent types of customer value, meaning that a consumptionexperience can entail many—or even all—of the value typesidentified in the typology (Holbrook 1999). However, some ofthe value types in Holbrook’s framework are related in such away that it is extremely difficult to operationalize them sepa-rately. For that reason, some authors suggest combining thesevalue types in an overarching category. In particular, thedemarcation between status and esteem can be problematic(Holbrook 1999) because “the active nature of status and thereactive nature of esteem tend to blur together in ways thatrender the two hard to distinguish” (Holbrook 1999, p.188).Therefore, we follow previous research by combining statusand esteem in an overarching category called social value(Bourdeau et al. 2002; Gallarza and Gil-Saura 2006;Sánchez-Fernández et al. 2009; Sweeney and Soutar 2001).Social value arises when one’s own consumption behaviorserves as a means to influence the responses of others(Holbrook 2006). Similarly, ethics and spirituality can becombined under the heading of altruistic value, as “both lieoutside the sphere of ordinary marketplace exchanges”(Sánchez-Fernández et al. 2009, p. 101). One can definealtruistic value as “a concern for how my own consumptionbehavior affects others where this experience is viewed as aself-justifying end-in-itself” (Holbrook 2006, p. 716).
To summarize, the conceptualizations of Dodds et al.(1991), Gale (1994), Woodruff and Gardial (1996) andHolbrook (1999) take center stage in our study. All fourmethods encompass the tradeoff approach mentioned inZeithaml’s (1988) definition and have been commonly usedin both applied and academic research. The method of Doddset al. (1991) is a one-dimensional approach, whereas theothers are multi-dimensional. With regard to the multi-dimensional approaches, the method of Gale (1994) focuseson the attributes, whereas the methods of Woodruff and
Gardial (1996) and Holbrook (1999) include the conse-quences of product use.
Key customer outcomes of value
In this paper, we studied customer value in its relationshipwith three outcome variables: satisfaction, word of mouth, andrepurchase intentions. These particular variables were selectedfor three reasons: First, we opted for outcome variables forwhich there exists considerable empirical evidence that theyare related to actual behavior and (financial) performance. Agrowing body of research links these three outcome variableswith market share (Anderson et al. 1994; Morgan and Rego2006), long-term profitability (Anderson et al. 1997;Bernhardt et al. 2000; Villanueva et al. 2008; Mittal et al.2005), accounting returns (Ittner and Larcker 1998), newcustomer acquisition (Trusov et al. 2009), shareholder value(Anderson et al. 2004; Gruca and Rego 2005; Morgan andRego 2006), stock prices (Fornell et al. 2006), and consumerspending (Fornell et al. 2010). Second, the chain of effectsbetween perceived customer value and the outcome variablesunder study are rooted in Bagozzi’s (1992) appraisal→ emo-tional response → coping framework (Gotlieb et al. 1994;Cronin et al. 2000) and, taken together, they capture the keyprocesses leading to positive outcomes for firms. Based onthis framework, the initial product or service evaluation (i.e.,appraisal) leads to satisfaction (i.e., emotional response) that,in turn, drives behavioral intentions (i.e., coping) (Gotliebet al. 1994).1 Third, we opted for outcome variables andlinkages that are well-established and validated in the market-ing literature. Prior research has indicated that customer valueis an important antecedent to satisfaction, repurchase inten-tions, and word of mouth (Bolton and Drew 1991; Croninet al. 2000; Lai et al. 2009). Hence, we developed the struc-tural model presented in Fig. 1 to evaluate the performance ofthe four measurement methods.
Comparison of methods
The primary objective of our study is to compare the fourvalue measurement methods with regard to two quantitativeand two subjective criteria. The quantitative criteria includethe assessments of the measurement and structural modelsrelated to the four methods. More specifically, we look at thepsychometric properties and predictive ability associated witheach of the four methods. The subjective criteria include eachmethod’s practicality and actionability, which generally refer
1 In line with the work of Anderson et al. (1994) and Cronin et al. (2000),we define customer satisfaction as the cumulative evaluation that is basedon all experiences with the supplier’s offering over time and we includeda direct link between value and behavioral intentions.
J. of the Acad. Mark. Sci. (2014) 42:430–451 433

to ease of use and ability to offer specific directions forimprovement. We describe each of the four criteria in moredetail below.
Measurement model: psychometric properties
We start our comparison with evaluating the measurementmodels in terms of how well the value construct is measuredby the indicator variables, both individually and jointly (Hairet al. 2011). Therefore, we examine the psychometric proper-ties of all first-order constructs used in our study. We note,however, that it is crucial to distinguish between reflective andformative scales (Hair et al. 2011; MacKenzie et al. 2005).
Regarding the reflective scales, relevant psychometric prop-erties include unidimensionality, internal consistency reliabili-ty, item validity, within-method convergent validity, and dis-criminant validity. Unidimensionality refers to the existence ofa single construct underlying a set of items and is assessedfollowing the procedure suggested by Sahmer et al. (2006).According to this two stage procedure, a set of items is unidi-mensional if: (1) the first eigenvalue of the correlation matrixof items exceeds one, and (2) the second eigenvalue is smallerthan one. Thus, this implies testing the following hypotheses:
(1) H0 : λ1 ¼ 1 Ha : λ1 > 1
(2) H0 : λ2 ¼ 1 Ha : λ2 < 1
According to Karlis et al. (2003), the first hypothesis (Ha :λ1>1) can be accepted if
λ1 > 1þ 2
ffiffiffiffiffiffiffiffip−1n−1
r
where p equals the number of indicators and n indicates thesample size. The second hypothesis implies testing whetherthe second eigenvalue is smaller than one (Ha : λ2<1).
Internal consistency reliability refers to the degree to whichthe items intended to measure the same latent construct havesimilar scores. Cronbach’s alpha has traditionally been used toassess the internal consistency reliability of reflective con-structs. In general, the accepted threshold for Cronbach’salpha is .70 or above (MacKenzie et al. 2011).
For reflective constructs, the validity of the individual items(i.e., item validity) can be assessed by determining whether therelationship between each item and its latent construct is largeand significant. A value greater than .70 would suggest anadequate level of item validity because it suggests the item isaccounting for more measurement variance than error(MacKenzie et al. 2011; Hair et al. 2011). Within methodconvergent validity refers to the extent to which the differentindicators of the same construct are in agreement. A commonmeasure to examine convergent validity is the average vari-ance extracted estimate (AVE), as defined by Fornell andLarcker (1981). Based on this test, a construct possessesconvergent validity if the majority of the variance in thereflective indicators is accounted for by the underlying latentconstruct rather than by measurement error (i.e., AVE>.50).
A necessary condition for discriminant validity is that theshared variance between the latent variable and its indicatorsis larger than the variance shared with other variables. To testfor this, the AVE is compared with the squared correlationsamong constructs (Fornell and Larcker 1981). This test isbased on the principle that each construct should be morehighly related to its own indicators than to other constructs(Chin 2010).
Formative constructs demand a different approach to eval-uate the measurement model (Diamantopoulos andWinklhofer 2001) and should only be evaluated by means oftheir item and discriminant validity. Item validity is capturedby the significance of the path from the indicator to the latentconstruct (MacKenzie et al. 2011). Indicators that do not havea significant loading on the construct can be considered forelimination. However, “it is important to remember that sub-dimensions should not be eliminated unless all of the essentialaspects of the focal construct domain are captured by theremaining sub-dimensions” (MacKenzie et al. 2011, p. 316).Discriminant validity of the formative constructs can be eval-uated by testing whether the constructs are less than perfectlycorrelated. This implies assessing whether an absolute valueof 1 falls within two standard errors of the latent variablecorrelations (MacKenzie et al. 2005).
Structural model: predictive ability
Our second comparison criterion relates to the structural mod-el. More specifically, we look at the ability of each method topredict key outcome variables (i.e., satisfaction, word ofmouth, repurchase intentions) drawn from the literature (e.g.,Cronin et al. 2000). From a theoretical perspective, expandingour knowledge of the predictive properties of these commonlyused value measurement methods is needed to understand theeffects of customer value in relation to other constructs.Additionally, information about the behavior of the variouscustomer value measurement methods in the context of otherrelevant constructs allows for greater understanding of the
Customervalue
Customer satisfaction
Word ofmouth
Repurchase intentions
Fig. 1 Structural model
434 J. of the Acad. Mark. Sci. (2014) 42:430–451

broader nomological network. Based on the existing literature,we put forward two hypotheses with regard to the predictiveability of the various methods.
First, we expect that multi-dimensional methods performbetter than one-dimensional methods. This expectation isfueled by the fact that one-dimensional methods “cannotdiscern the complex nature of perceived value” (Lin et al.2005, p. 319). Thus, we hypothesize the following.
H1: With regard to predictive ability, multi-dimensionalvalue conceptualizations perform better than one-dimensional value conceptualizations.
Second, we expect methods that include benefits and sac-rifices at the consequence level to perform better thanmethodsthat do not. This expectation is in line with the service-dominant logic proposed by Vargo and Lusch (2004) andmore specifically with the concept of ‘value-in-use’. Luschand Vargo (2006, p. 44) state that “there is no value until anoffering is used—experience and perception are essential tovalue determination.” This implies that value is fundamentallyderived and determined in use (i.e., consequences) rather thanin exchange (i.e., attributes) (Vargo et al. 2008), which isconsistent with our expectation that value should be measuredat the consequence level rather than at the attribute level.Therefore, we put forward the following hypothesis.
H2: With regard to predictive ability, value conceptualiza-tions that assess benefits and sacrifices at the conse-quence level perform better than value conceptualiza-tions that do not assess benefits and sacrifices at theconsequence level.
Practicality
In this study, we approach practicality from two perspectives:ease of use and questionnaire length. Ease of use implies that themethod is straightforward and simple and, as a result, can easilybe used, even by non-experts (Devlin et al. 2003; Stewart 1992).For example, if interviews are necessary to generate items beforea particular method can be used, this process is very timeconsuming and is therefore a drawback. With regard to ques-tionnaire length, a value measurement method with many itemsmay fatigue respondents and therefore researchers should ac-count for survey length when choosing a value measurementmethod (Drolet and Morrison 2001). Indeed, as shown byDeutskens et al. (2004), questionnaire length has a negativeeffect on response rates, completion rates, and response quality.
Actionability
The primary purpose of any measurement approach is to gaininformation (Drolet and Morrison 2001), and thus we arguethat information is another important basis on which each of
the measurement methods should be evaluated. However, wego one step further by assessing ‘actionability’, which impliesthat the information gathered by the measurement method canbe easily translated into actionable guidelines. With regard tovalue measurement methods, the primary goal is to gatheruseful information to identify directions for improvement(Woodruff 1997). Leading companies are looking for mea-surement tools that provide insight into the strengths andweaknesses of the company and an increased understandingof what is important to the customer (Devlin et al. 2003; Rustet al. 2004). Thus, the choice of a measurement method notonly affects the reliability and validity of the results, but alsohow the results can be used (Devlin et al. 2003).
Methodology
Sampling
We collected data in cooperation with a European onlineresearch bureau. Although respondents were self-selected,they were disqualified if they did not use or buy the productthey evaluated or did not pay for the product themselves. Toensure cross-validation of results, data were gathered acrossseveral settings. The choice of settings was guided by theFoote, Cone, and Belding (FCB) grid (Vaughn 1980), whichclassifies customers’ purchase decisions on two dimensions:involvement (high/low) and type of offering (think/feel). Theproducts selected as research contexts for our study are softdrinks (low involvement, feel), toothpaste (low involvement,think), day cream (high involvement, feel) and DVD players(high involvement, think). A manipulation check was con-ducted based on the scale suggested by Ratchford (1987).Regarding the level of involvement, as expected, day creamand DVD players were evaluated as higher involvement(M =4.94, 4.72 respectively) than toothpaste and soft drinks(M =4.14, 4.26, p <.001). With respect to the type ofoffering (think vs. feel), soft drinks (M =4.91) and daycream (M =4.76) were judged to be higher feel thantoothpaste (M =4.39) and DVD players (M =3.99,p <.001).
Each respondent was asked to answer the items associatedwith only one of the four value measurement methods understudy, and for only one of the four settings. Data were collect-ed from a total of 3,360 respondents. More specifically, wecollected data from 16 different samples (i.e., 4 methods in 4different settings), each having a sample size of 210 respon-dents. The rationale behind this choice is threefold. First, wetried to keep the amount of time and effort (and hence fatigue)from the respondents as low as possible. Second, we tried toavoid carry-over effects among the different value measure-ment approaches. Finally, restricting ourselves to between-subject variance allows us to draw statistically valid
J. of the Acad. Mark. Sci. (2014) 42:430–451 435

conclusions among all possible combinations of value mea-surement methods. Table 1 displays key demographiccharacteristics.
Questionnaire design
All questionnaires were administered in Dutch and identical interms of the measurement instruments for customer sat-isfaction, repurchase intentions, and word of mouth.What differed across the questionnaires was the valuemeasurement method, which was adapted to the particularsetting. All individual items are listed in Appendices A andB and are evaluated on 9-point Likert scales unless indicatedotherwise.
Dodds et al.'s (1991) approach To assess the performance ofthe measurement approach suggested by Dodds et al. (1991),we used the five items suggested by the original authors.
Gale’s (1994) approach To generate items for Gale’s (1994)Customer Value Analysis, we carried out in-depth interviewsusing the laddering technique (Woodruff andGardial 1996) andlisted the attributes that people foundmost important in the fourdifferent settings (see Appendix A). In total, 28 interviews wereconducted with respondents that had experience with the prod-uct under investigation (DVDplayer n =7; day cream n =6; softdrinks n =7; toothpaste n =8). The number of respondents ineach setting was determined using the procedure suggested byStrauss and Corbin (1998). Since Gale’s (1994) method impliesa relative approach for measuring customer value, we asked
respondents to evaluate the product attributes relative to thecompetition with labels ranging from XYZ is much better toXYZ is much worse (Babakus et al. 2004). In line with Gale’s(1994) measurement method, a directly assessed importanceweight was needed for each attribute. However, becausethe number of attributes was considerably large, pointallocation—as proposed by Gale (1994)—was not anoption. Thus, we asked the respondents to rate the impor-tance of each attribute on a Likert scale anchored at 1 (veryunimportant) and 9 (very important ).
Woodruff and Gardial’s (1996) approach The generation ofitems for the measurement method proposed byWoodruff andGardial (1996) was based entirely on the results of theladdering interviews mentioned above (see Appendix A).
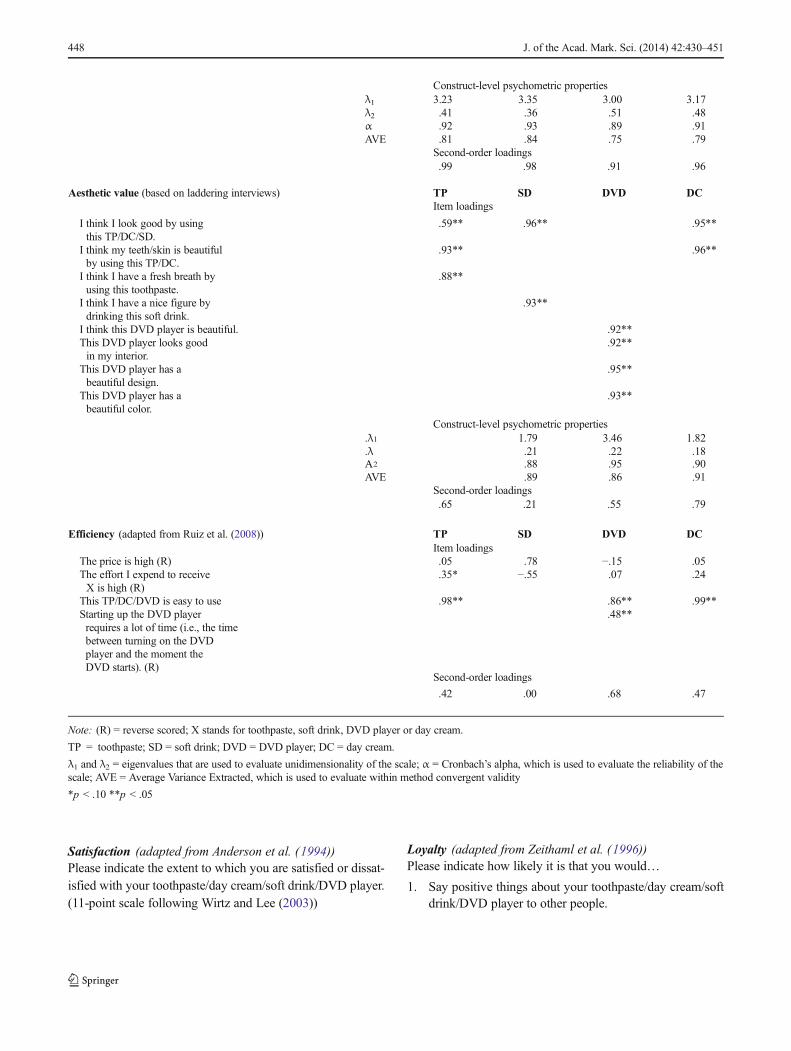
Holbrook’s (1999) approach For the measurement ofHolbrook’s (1999) typology, we used existing scales whereverpossible (e.g., excellence: Oliver 1997, efficiency: Ruiz et al.2008, social value: Sweeney and Soutar 2001, play: Petrick2002) and adapted them to the particular product settings bymeans of the laddering interviews described above. Anexisting scale for aesthetic value was not available, so we usedthe results of the laddering interviews to generate items.Altruistic value was not mentioned in the interviews, so wedid not take this value type into account in our empirical study(Gallarza and Gil-Saura 2006).
Outcome variables To assess customer satisfaction, Wirtz andLee’s (2003) 11-point scale was used. Repurchase intentions
Table 1 Demographiccharacteristics Setting Method Sample size Gender Age
Male Female M SD
Toothpaste Dodds et al. 210 47.10% 52.90% 48.64 14.49
Gale 210 37.10% 62.90% 43.83 14.60
Woodruff and Gardial 210 55.20% 44.80% 47.28 14.14
Holbrook 210 51.00% 49.00% 48.51 14.41
Soft drink Dodds et al. 210 46.70% 53.30% 48.69 13.35
Gale 210 44.80% 55.20% 50.09 11.87
Woodruff and Gardial 210 50.00% 50.00% 47.25 13.13
Holbrook 210 42.40% 57.60% 48.29 13.69
DVD player Dodds et al. 210 80.50% 19.50% 49.82 14.75
Gale 210 60.00% 40.00% 46.68 11.92
Woodruff and Gardial 210 57.10% 42.90% 47.99 11.70
Holbrook 210 59.00% 41.00% 48.19 12.97
Day cream Dodds et al. 210 21.00% 79.00% 46.11 12.04
Gale 210 21.40% 78.60% 47.00 13.69
Woodruff and Gardial 210 21.90% 78.10% 46.43 13.05
Holbrook 210 14.30% 85.70% 46.87 13.80
TOTAL 3,360 44.34% 55.66% 47.60
436 J. of the Acad. Mark. Sci. (2014) 42:430–451

and word of mouth were measured using the scales developedby Zeithaml et al. (1996).
Parameter estimation
Partial Least Squares (PLS) path modeling was used to ana-lyze the data. PLS is the preferred approach in our study for atleast two reasons. First, in line with our objective to evaluatethe predictive ability of the different value measurementmethods, an estimation approach that ensures optimal predic-tion accuracy was desirable (Hair et al. 2011). Second, PLSpath modeling allowed us to estimate measurement modelsthat include both formative and reflective indicators. Thisfeature is particularly relevant, as the literature indicates thatvalue measurement models include both types of measures(Ruiz et al. 2008). To assess the statistical significance of theparameter estimates, we constructed percentile bootstrap con-fidence intervals based on 5,000 samples (Hair et al. 2011;Preacher and Hayes 2008).
Measurement model structures
Dodds et al.'s (1991) approach In keeping with its originalscale development process and further applications in theliterature, we specified Dodds et al.’s (1991) measurementscale as a first-order reflective measurement model.
Gale’s (1994) approach With respect to the Customer ValueAnalysis suggested by Gale (1994), we started from its basicpremise that customer value equals the difference between aweighted quality score (market-perceived quality) and aweighted price score (market-perceived price). Both scoreswere determined by multiplying the relative performancescore (relative price) for each quality (price) attribute by itsnormalized weight and summing these weighted scores overthe relevant quality (price) attributes. Subsequently, followingthe rationale of Jarvis et al. (2003), we used this market-perceived quality score and market-perceived price score asformative indicators of the customer value construct.
Woodruff and Gardial’s (1996) approach Concerning the cus-tomer value measurement approach recommended byWoodruff and Gardial (1996), it is important to distinguishbetween the first- and second-order constructs. According toresearch by Ruiz et al. (2008) and Lin et al. (2005), the benefitand sacrifice components (first-order constructs) associatedwith this approach should be considered formative compo-nents of customer value, because customers make an explicitmental tradeoff between these components to arrive at anoverall value perception (second-order construct). The twofirst-order constructs—benefits and sacrifices—were modeledaccording to the guidelines developed by Jarvis et al. (2003).Specifically, the benefits construct consists of diverse positive
consequences mentioned during the laddering interviews and,hence, is modeled formatively. Alternatively, the sacrificeconstruct is measured by two reflective indicators reflectingthe monetary consequences of the product. To model custom-er value as a second-order construct, we used the two-stageapproach (Reinartz et al. 2004; Ringle et al. 2012) wherein, inthe first stage, the latent variable scores were estimated with-out the second-order construct (customer value) present butwith all of the first-order constructs (benefits and sacrifices) inthe model. In the second stage, the latent variable scores of thefirst-order factors (benefits and sacrifices) were used as indi-cators of the second-order construct (customer value) in aseparate higher-order PLS model.
Holbrook’s (1999) approach Regarding the value typologyspecified by Holbrook (1999), customer value can be consid-ered a higher-order construct consisting of multiple compo-nents (Gallarza and Gil-Saura 2006; Sánchez-Fernández et al.2009). Thus, each of Holbrook’s (1999) value types can beconsidered a first-order construct measured either by reflectiveor formative indicators. In our case, because the differentvalue types are not interchangeable and not necessarily corre-lated, and the direction of causality is from each of the valuetypes to the overall customer value construct, these valuetypes should be considered formative components of custom-er value (Jarvis et al. 2003). To model customer value as asecond-order construct, we again used the two-stage approachdescribed above (Reinartz et al. 2004).
Results
Tables 2, 3, 4 and 5 present the correlations, means, andstandard deviations for the value measures (or their dimen-sions), cumulative satisfaction, repurchase intentions, and wordof mouth across each of the settings and each of the methods.
Measurement model: psychometric properties
All relevant psychometric properties of the constructs understudy are presented in Appendices A and B. Our analysesconfirmed favorable psychometric properties for the fourmethods in the four different settings, with the exception ofDodds et al.’s (1991) approach. In particular, the results (seeAppendix B) show that the scale suggested by Dodds et al.(1991) is not unidimensional for the two think settings (i.e.,toothpaste and DVD players). More specifically, in thesesettings, the eigenvalues of the construct’s inter-item correla-tion matrix reveal the existence of more than one constructunderlying the five items. Since these items are intended to bealternative indicators of the same underlying construct (i.e.,value), this violates one of the most critical and basic assump-tions of measurement theory (Gerbing and Anderson 1988).
J. of the Acad. Mark. Sci. (2014) 42:430–451 437

Because of the lack of favorable psychometric propertiesfor the Dodds et al. (1991) scale, we did not use this measure-ment method in further analyses (e.g., to compare predictiveability) in the toothpaste and DVD player settings.
Overall, with the exception of the Dodds et al. (1991)method for the two think offerings, the four different methodsare capable of assessing customer value perceptions in areliable and valid manner across different settings.
Structural model: predictive ability
The performance of the four customer value measurementmethods with regard to their predictive ability of customersatisfaction, repurchase intentions, and word of mouth, wasevaluated by means of the multiple correlation coefficient R.The R coefficient is defined as the correlation between theactual (y) and the predicted value (ŷ) of the dependent vari-able. As each respondent filled out a questionnaire containingonly one of the different value measurement methods understudy, testing H1 and H2 regarding the methods’ predictive
validity boils down to assessing whether the relevant indepen-dent sample correlation coefficients are statistically equal. Incases where the null hypothesis of equal correlation coeffi-cients was rejected, post-hoc comparison tests as proposed byZar (1996) were conducted.
Table 6 displays the R-values for each of the settings aswell as a pairwise comparison between these R-values. TheR2-values (i.e., the coefficients of determination) can be foundin parentheses. All R-values (R2-values) are significantly dif-ferent from zero, meaning that all four value measurementmethods are capable of explaining variance in cumulativesatisfaction, repurchase intentions, and word of mouth. Notethat, for think offerings (i.e., toothpaste and DVD player), theR- and R2-values are not calculated for the Dodds et al. (1991)approach because the scale did not possess favorable psycho-metric properties for these settings.
Although in some instances, the one-dimensional approachof Dodds et al. (1991) performed equally well as the multi-dimensional methods, it is important to note that it neveroutperformed them. Thus, in general, H1 is supported.
Table 2 Summary of correlations, means and standard deviations for Dodds et al.'s method
Think Feel
VAL SAT REP WOM M SD VAL SAT REP WOM M SD
VAL – .48** .47** .45** 6.65 1.28 VAL – .32** .27** .35** 6.24 1.46
SAT .34** – .52** .56** 7.78 1.64 SAT .41** – .64** .50** 8.26 1.23
REP .33** .43** – .73** 6.41 1.65 REP .33** .55** – .58** 7.29 1.53
WOM .42** .38** .52** – 6.26 1.75 WOM .34** .57** .55** – 6.84 1.48
M 5.89 7.91 7.14 6.07 M 5.56 8.38 7.60 6.44
SD 1.06 1.42 1.56 1.81 SD 1.59 1.24 1.38 1.95
Correlations for high (low) involvement offerings are presented above (below) the diagonal. Means and standard deviations for high (low) involvementofferings are presented in the vertical columns (horizontal rows)
VAL value, SAT satisfaction, REP repurchase intentions, WOM word of mouth
*p <.05 **p <.01
Table 3 Summary of correlations, means and standard deviations for Gale's method
Think Feel
MPQ MPP SAT REP WOM M SD MPQ MPP SAT REP WOM M SD
MPQ – −.35** .43** .51** .58** 6.15 1.12 MPQ – −.36** .45** .45** .46** 6.78 1.26
MPP −.44** – −.13 −.14* −.18** 3.88 1.51 MPP −.15* – −.15* −.14 −.12 4.08 1.69
SAT .46** −.17* – .59** .69** 7.80 1.71 SAT .37** −.18* – .65** .55** 8.46 1.28
REP .37** .00 .59** – .62** 6.30 1.55 REP .35** −.05 .46** – .57** 7.44 1.43
WOM .49** −.15* .54** .61** – 6.25 1.90 WOM .49** −.07 .47** .50** – 6.90 1.57
M 6.28 4.21 8.31 7.24 6.30 M 6.61 4.33 8.69 7.79 6.78
SD 1.14 1.32 1.27 1.65 1.96 SD 1.06 1.76 1.00 1.23 1.62
Correlations for high (low) involvement offerings are presented above (below) the diagonal. Means and standard deviations for high (low) involvementofferings are presented in the vertical columns (horizontal rows)
MPQ market-perceived quality, MPP market-perceived price, SAT satisfaction, REP repurchase intentions, WOM word of mouth
*p <.05 **p <.01
438 J. of the Acad. Mark. Sci. (2014) 42:430–451

Second, it is interesting to note that the best-performingmethods—those of Woodruff and Gardial (1996) andHolbrook (1999)—assess benefits and sacrifices at the conse-quence level, which supports H2.
In aggregate, these results indicate that, from a strictly meth-odological point of view, the methods proposed by Woodruffand Gardial (1996) and Holbrook (1999) are the best choices tomeasure value. We note, however, that although both
Table 4 Summary of correlations, means and standard deviations for Woodruff and Gardial's method
Think Feel
BEN SAC SAT REP WOM M SD BEN SAC SAT REP WOM M SD
BEN – −.22** .65** .48** .70** 6.58 1.08 BEN – −.34** .59** .50** .70** 7.16 1.25
SAC −.33** – −.14* −.17* −.15* 4.00 1.74 SAC −.27** – −.24** −.17* −.32** 4.19 2.33
SAT .50** −.34** – .55** .68** 7.70 1.69 SAT .61** −.02 – .53** .54** 8.35 1.26
REP .43** −.01 .51** – .65** 6.28 1.66 REP .52** −.06 .60** – .59** 7.40 1.44
WOM .51** −.18** .46** .55** – 6.43 1.81 WOM .50** −.19** .56** .53** – 7.03 1.40
M 6.28 4.73 7.96 7.07 5.98 M 6.19 5.27 8.16 7.50 6.33
SD 1.26 1.87 1.30 1.61 1.81 SD 1.10 2.19 1.22 1.35 1.79
Correlations for high (low) involvement offerings are presented above (below) the diagonal. Means and standard deviations for high (low) involvementofferings are presented in the vertical columns (horizontal rows)
BEN benefits, SAC sacrifices, SAT satisfaction, REP repurchase intentions, WOM word of mouth
*p <.05 **p <.01
Table 5 Summary of correlations, means and standard deviations for Holbrook's method
AEST EFF EXC PLAY SOC SAT REP WOM M SD
Think
AEST – .02 .47** .55** .25** .34** .23** .33** 5.36 1.90
EFF .10 – .08 −.12 −.33** .24** .22** .11 6.90 1.31
EXC .51** .18** – .35** .09 .54** .47** .53** 5.96 1.46
PLAY .69** −.05 .30** – .44** .14* .02 .21** 4.46 1.69
SOC .49** −.27** .04 .57** – −.08 −.13 −.01 2.06 1.59
SAT .41** .29** .70** .23** .03 – .54** .56** 7.94 1.34
REP .36** .23** .73** .16* −.09 .67** – .63** 6.15 1.49
WOM .52** .10 .69** .42** .23** .59** .59** – 6.19 1.69
M 5.61 6.96 6.67 4.30 2.71 8.01 7.18 6.10
SD 1.79 1.25 1.47 2.14 1.90 1.73 1.70 1.82
Feel
AEST – .16* .60** .56** .26** .49** .46** .52** 6.52 1.67
EFF −.19** – .05 −.06 −.35** .20** .21** .06 6.97 1.36
EXC .22** −.12 – .40** .23** .67** .57** .52** 6.72 1.36
PLAY .52** −.17* .35** – .48** .31** .30** .43** 5.60 1.92
SOC .59** −.33** .09 .40** – .07 .04 .26** 3.27 1.97
SAT .13 .02 .66** .25** −.01 – .76** .58** 8.21 1.21
REP −.04 −.07 .53** .16* −.11 .55** – .67** 7.39 1.50
WOM .24** −.03 .51** .42** .15* .59** .61** – 6.81 1.56
M 2.59 6.39 6.82 4.29 2.14 8.38 7.51 6.08
SD 1.93 1.45 1.65 2.13 1.72 1.36 1.58 2.29
Correlations for high (low) involvement offerings are presented above (below) the diagonal. Means and standard deviations for high (low) involvementofferings are presented in the vertical columns (horizontal rows)
AEST aesthetics, EFF efficiency, EXC excellence, PLAY play, SOC social value, SAT satisfaction, REP repurchase intentions, WOM word of mouth
*p <.05 **p <.01
J. of the Acad. Mark. Sci. (2014) 42:430–451 439

approaches performwell in a general sense and for feel products,this is not the case for think products. Regarding low-involvement think products, the method of Holbrook (1999) isthe safest choice, as its predictive ability is at least equal to thatof Woodruff and Gardial’s (1996) approach, whereas, for high-involvement think offerings, the opposite holds. Here, the meth-od of Woodruff and Gardial (1996) is preferred, as its perfor-mance is at least equal to that of Holbrook’s (1999) method.
Practicality
Dodds et al.’s (1991) approach can be used to measure valuein the case of feel products because it is a straightforwardand simple method, and it consists of only five items.Furthermore, it can be used in these settings without anymajoradjustments. As such, it is easy to incorporate in a question-naire, has only a limited impact on questionnaire length, andrequires little effort on behalf of the respondent.
Gale’s (1994) method requires a combination of performanceand importance weights, thereby increasing questionnaire lengthand respondents’ effort substantially. From the researcher’s per-spective, the practicality of Gale’s (1994) method depends onwhether the relevant attributes are known beforehand. Whenthese attributes are unknown, the researcher needs to invest timeand effort in conducting interviews to generate them.
Because of its focus on the consequences instead of theattributes, interviews are almost always required to generateitems for Woodruff and Gardial’s (1996) method. Regardingquestionnaire length, the scales we used for this approachconsisted of 11—16 items, which is two to three times morethan the shortest scale, i.e., that of Dodds et al. (1991).
Holbrook’s (1999) approach consists of various valuetypes. Some of these value types have an existing scale; forexample, to measure social value one can use the scale ofSweeney and Soutar (2001). However, for other value types,interviews could be necessary to generate items. Furthermore,the use of various value types, each having its own scale,results in a great number of items, thus negatively impactingquestionnaire length.
To compare the measurement methods with regard to theeffect of questionnaire length, we conducted an additional studyin which we assessed response times and asked some questionsabout the perceived time and effort required to fill out thequestionnaire (the items are presented in Table 7). We usedtoothpaste as the setting for this study and opted for a between-subjects design to avoid carry-over effects among the differentvalue measurement approaches. The sample consisted of 310undergraduate students at a large American state university. Theresults of this study are presented in Table 7. With regard to theobjective time required to fill out the questionnaire, a significant
Table 6 Comparison between the coefficients of determination
Satisfaction Word of mouth Repurchase Intention
D G W H D G W H D G W H
Toothpaste D D D
Think - Low involv G .46(.21) ** G .61(.37) * G .62(.38) **
W .56(.31) ** W .63(.40) W .62(.38) **
H ** ** .71(.50) H * .72(.52) H ** ** .78(.61)
D G W H D G W H D G W H
Soft drink D .47(.22) ** ** D .60(.36) D .63(.39)
Feel - Low involv G .38(.14) ** ** G .58(.33) G .55(.31)
W ** ** .74(.55) W .59(.35) W .67(.45)
H ** ** .67(.45) H .62(.39) H .64(.40)
D G W H D G W H D G W H
DVD player D D D
Think - High involv G .43(.19) ** ** G .76(.58) ** G .69(.48)
W ** .73(.54) * W .76(.58) ** W .61(.38)
H ** * .62(.38) H ** ** .62(.38) H .61(.37)
D G W H D G W H D G W H
Day cream D .42(.18) ** ** D .56(.32) ** D .65(.43) *
Feel - High involv G .45(.20) * ** G .60(.36) * G .73(.53)
W ** * .62(.38) W ** * .73(.54) W .67(.45)
H ** ** .68(.47) H .64(.41) H * .77(.60)
This table displays the R-values with the R2 -values in parenthesis
D Dodds et al., G Gale, W Woodruff and Gardial, H Holbrook
*p <.10 **p <.05
440 J. of the Acad. Mark. Sci. (2014) 42:430–451

difference was found between the various methods (F=35.315;p<.001). Pairwise analyses show that the scale used by Doddset al. (1991) required significantly less time to complete than theother methods. However, regarding the respondent’s perceptionsof time and effort, no significant differences were found betweenthe four methods (see F-values in Table 7). Thus, althoughDodds et al. (1991) method has the least items and requires theleast time to complete, this feature is not reflected in the respon-dent’s perceived effort and time.
Actionability
As a final comparison, we examine the relative actionability ofthe four measurement approaches. Actionability refers to thedegree to which the methods yield information that is relevantfor diagnostic purposes or easily translated into actionablestrategies. Methods that prioritize attributes or consequencestherefore would be more actionable than methods that do not.As an example, a problemwith Dodds et al.’s (1991) approach isthat although a firmmay know its overall value score, no specificdirection is given in terms of how it can be improved (Petrick2002). Thus, while the Dodds et al. (1991) measure scored highin practicality, there is a tradeoff in that it is low in actionability.Furthermore, this method had unfavorable psychometric proper-ties in the case of think offerings and, hence, should only be usedfor feel products.
Gale’s (1994) method, on the other hand, clearly identifiesdirections for improvement. Since it is based on a combination
of importance and relative performance, it is fairly easy todiscern a product’s strengths and weaknesses (Gale 1994).Furthermore, Gale (1994) suggests various practical guide-lines and tools to analyze the data, such as a customer valuemap and a head-to-head chart.
However, several authors (e.g., MacDonald et al. 2011;Woodruff 1997; Woodruff and Gardial 1996) have indicatedthat only focusing on attributes (e.g., Gale’s approach) is notenough. “A substantive, radical, and strategically sustainableadvantage is more likely to result when organizations stepback from a narrow focus on attribute improvement andconsider the broader issues of consequence and value deliv-ery” (Woodruff and Gardial 1996, p. 80). What customersreally desire are not the attributes but the consequencesresulting from product use (Lusch and Vargo 2006), whichfavors the methods of Woodruff and Gardial (1996) andHolbrook (1999). Aside from this strength of beingconsequence-based, several authors (e.g., Bevan and Murphy2001; Smith 1999) note that Holbrook’s typology scores highin terms of actionability because it offers a complete, clear,efficient, easily comprehensible and intuitively appealingmodel for researchers and practitioners alike.
Discussion
This study was aimed at comparing four commonly usedcustomer value measurement methods (i.e., Dodds et al.
Table 7 Results regarding time and effort
Dodds et al.’smethodn=81
Gale’smethodn =80
Woodruff andGardial's methodn =68
Holbrook’smethodn =81
ResultsANOVA
M SD M SD M SD M SD F (p-value)
Objective time (in seconds) 27.02 15.30 76.14 47.38 78.60 41.16 81.56 44.31 35.32 (.00)
Perception of time (9-point scales)
How much time was required from youto fill out this survey? very littletime - a great deal of time
1.95 1.26 2.10 1.38 1.96 1.41 2.05 1.45 .22 (.88)
The time required to fill out this surveyis… very low - very high
1.89 1.23 2.16 1.38 2.00 1.41 2.09 1.48 .58 (.63)
Perception of effort (9-point scales)
It was difficult for me to fill out the survey. 1.95 1.80 2.30 1.80 2.19 1.93 2.64 2.35 1.69 (.17)
I had to concentrate a lot while fillingout the survey.
1.96 1.74 2.51 1.97 2.35 1.98 2.46 2.19 1.27 (.28)
I had to think very hard aboutanswering some questions.
2.07 1.92 2.43 1.73 2.26 1.85 2.35 1.96 .52 (.67)
How much effort was required from youto fill out this survey? very littleeffort - a great deal of effort
2.15 1.58 2.71 1.78 2.41 1.93 2.35 1.59 1.49 (.22)
The effort required to fill out this surveyis… very low - very high
1.88 1.21 2.38 1.55 2.29 1.66 2.10 1.45 1.82 (.14)
J. of the Acad. Mark. Sci. (2014) 42:430–451 441
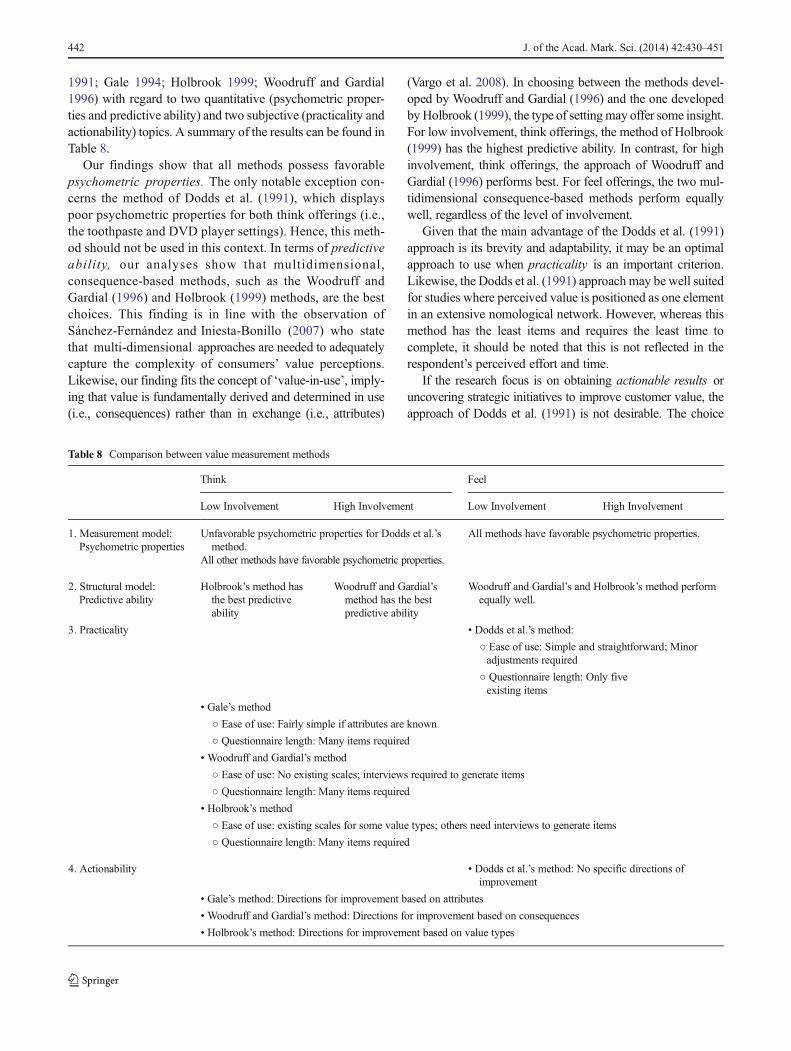
1991; Gale 1994; Holbrook 1999; Woodruff and Gardial1996) with regard to two quantitative (psychometric proper-ties and predictive ability) and two subjective (practicality andactionability) topics. A summary of the results can be found inTable 8.
Our findings show that all methods possess favorablepsychometric properties. The only notable exception con-cerns the method of Dodds et al. (1991), which displayspoor psychometric properties for both think offerings (i.e.,the toothpaste and DVD player settings). Hence, this meth-od should not be used in this context. In terms of predictiveability, our analyses show that multidimensional,consequence-based methods, such as the Woodruff andGardial (1996) and Holbrook (1999) methods, are the bestchoices. This finding is in line with the observation ofSánchez-Fernández and Iniesta-Bonillo (2007) who statethat multi-dimensional approaches are needed to adequatelycapture the complexity of consumers’ value perceptions.Likewise, our finding fits the concept of ‘value-in-use’, imply-ing that value is fundamentally derived and determined in use(i.e., consequences) rather than in exchange (i.e., attributes)
(Vargo et al. 2008). In choosing between the methods devel-oped by Woodruff and Gardial (1996) and the one developedbyHolbrook (1999), the type of settingmay offer some insight.For low involvement, think offerings, the method of Holbrook(1999) has the highest predictive ability. In contrast, for highinvolvement, think offerings, the approach of Woodruff andGardial (1996) performs best. For feel offerings, the two mul-tidimensional consequence-based methods perform equallywell, regardless of the level of involvement.
Given that the main advantage of the Dodds et al. (1991)approach is its brevity and adaptability, it may be an optimalapproach to use when practicality is an important criterion.Likewise, the Dodds et al. (1991) approachmay be well suitedfor studies where perceived value is positioned as one elementin an extensive nomological network. However, whereas thismethod has the least items and requires the least time tocomplete, it should be noted that this is not reflected in therespondent’s perceived effort and time.
If the research focus is on obtaining actionable results oruncovering strategic initiatives to improve customer value, theapproach of Dodds et al. (1991) is not desirable. The choice
Table 8 Comparison between value measurement methods
Think Feel
Low Involvement High Involvement Low Involvement High Involvement
1. Measurement model:Psychometric properties
Unfavorable psychometric properties for Dodds et al.’smethod.
All methods have favorable psychometric properties.
All other methods have favorable psychometric properties.
2. Structural model:Predictive ability
Holbrook’s method hasthe best predictiveability
Woodruff and Gardial’smethod has the bestpredictive ability
Woodruff and Gardial’s and Holbrook’s method performequally well.
3. Practicality • Dodds et al.’s method:
○ Ease of use: Simple and straightforward; Minoradjustments required
○ Questionnaire length: Only fiveexisting items
• Gale’s method
○ Ease of use: Fairly simple if attributes are known
○ Questionnaire length: Many items required
• Woodruff and Gardial’s method
○ Ease of use: No existing scales; interviews required to generate items
○ Questionnaire length: Many items required
• Holbrook’s method
○ Ease of use: existing scales for some value types; others need interviews to generate items
○ Questionnaire length: Many items required
4. Actionability • Dodds et al.’s method: No specific directions ofimprovement
• Gale’s method: Directions for improvement based on attributes
• Woodruff and Gardial’s method: Directions for improvement based on consequences
• Holbrook’s method: Directions for improvement based on value types
442 J. of the Acad. Mark. Sci. (2014) 42:430–451

between the methods of Gale (1994), Woodruff and Gardial(1996) and Holbrook (1999) may be guided by attributes orconsequences. As it can be expected that firms may know theattributes associated with its own products, Gale’s (1994) ap-proach seems to be a good choice for measuring customer valuein practice. However, if the company wants to look beyond themere attributes of its products and it intends to come up withcreative and innovative solutions for customer needs, it is betterto focus on the consequences (MacDonald et al. 2011;Woodruff 1997) and therefore, the methods of Woodruff andGardial (1996) and Holbrook (1999) should be used. In thesubsequent choice between the methods of Woodruff andGardial (1996) and Holbrook (1999), it is important to notetwo characteristics of the Holbrook (1999) conceptualization.First, an advantage of Holbrook’s (1999) method is its classifi-cation framework that could be very helpful in structuring thedifferent value types in an understandable and intuitively ap-pealing way. Second, existing scales are available for some ofHolbrook’s value types, thereby limiting the time and effortneeded to design a suitable measurement instrument.
To summarize our findings and provide guidance to thoseinterested in measuring customer value, we constructed theprescriptive flowchart presented in Fig. 2. This flowchart aimsto provide direction when choosing an adequate method basedon the specific context.
Limitations and future research
Although this study contributes to our understanding of customervalue and its measurement, several limitations and further re-search suggestions deserve to bementioned. First, other productswith more extreme levels of high/low involvement or think/feelcould be used. Although the four settings selected for this studydiffered significantly in terms of involvement (high/low) andtype of offering (think/feel), future work could replicate ourfindings in, perhaps, more extreme settings. Also, the applicabil-ity across different settings could be explored along other dimen-sions. One dimension for further testing might be the level ofproduct knowledge, which has been shown to affect customers’
Start
Is actionability the main
purpose of your research?
Think or feel product?
Is value the main construct in your
conceptual model?
Do not use the method of Dodds
et al., but use one of the other
methods.
Do you prefer a typology?
Use Holbrook’s method
Use Woodruff and Gardial’s
method
Is predictive ability important
for your research?
Is predictive ability important
for your research?
High or low involvement
product?
Focus on attributes or
consequences?
Use Holbrook’s method
Use Woodruff and Gardial’s
method
Use Gale’s method
feel think
no
yes
yesno
no
yes
no yes
consequences
attributes high low
Use the method of Dodds et al.
no
yes
Fig. 2 Guidelines for choosing acustomer value measurementmethod
J. of the Acad. Mark. Sci. (2014) 42:430–451 443
means-end associations (e.g., Graeff 1997). In addition, futurework could replicate our findings in less tangible settings.
Second, we used customer satisfaction, repurchase inten-tions, and word of mouth as criterion variables to assesspredictive ability. Although we deliberately chose tooperationalize these outcome variables in a way that is con-sistent with the majority of existing academic research, we areaware that alternative approaches to measure the three out-come variables might yield different results.
Third, measures of actual behavior, rather than behavioralintentions, could enhance the soundness of this study.Unfortunately, such behavioral data are often difficult andexpensive to obtain. In addition, it should be noted that,although a significant positive association between intentionand behavior exists, the conversion of (re)purchase intentionsinto (re)purchase behavior may be moderated by variousfactors (e.g., Seiders et al. 2005).
Fourth, recent research (i.e., Grönroos 2011; Grönroos andRavald 2011) emphasizes the importance of value co-creationfor contemporary marketing literature as well as practice.Hence, future research should consider the value co-creatingopportunities of the firm as well as the consequences of thisvalue co-creation for the customer. This value co-creation caninfluence how value could and should be measured. Forexample, when value is co-created, there could be other valuetypes that come into play during direct interactions with thefirm. Along these lines, an opportunity for further research isthe difference, and maybe also the interaction, between value-in-use and co-created value. Are value-in-use and co-created
value complementary or substitutable concepts? Do theystrengthen each other? Are there other value types that comeinto play when value is co-created? These and other, similarquestions are worthy topics for future research.
Finally, a fruitful avenue for further research is to investigatethe linkages between the attributes and consequences as men-tioned in Woodruff and Gardial’s (1996) Value Hierarchy.Although these authors indicate that “value is a trade-offbetween the positive and negative consequences of productuse as perceived by the customer” (Woodruff and Gardial1996, p. 57), they also indicate that it is important to under-stand the linkages between attributes, consequences and de-sired end-states. The focus of this research was on the assess-ment of four common value measures and therefore theselinkages were not included in the present study. Future researchcould examine these linkages in further detail and provideadditional insights into the way customer value is created.
Despite these limitations, this study provides a more com-prehensive, in-depth understanding of customer value as wellas an important tool for managers, since “making customervalue strategies work begins with an actionable understandingof the concept itself” (Woodruff 1997, p. 141).
Acknowledgments The authors wish to thank Wim Janssens for hishelpful comments on early drafts of this article. The authors thank theResearch Foundation - Flanders (FWO Vlaanderen) for a doctoralfellowship.
Funding This work was supported by the Marketing Science Institute[grant #4-1668].
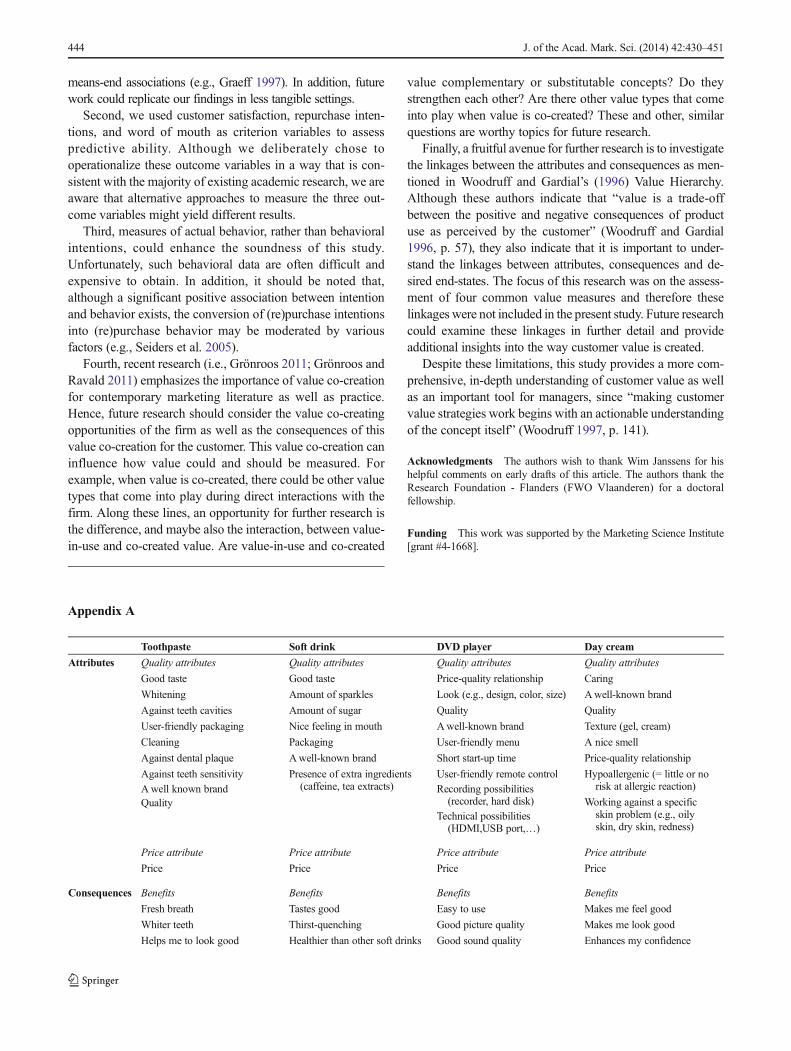
Appendix A
Toothpaste Soft drink DVD player Day cream
Attributes Quality attributes Quality attributes Quality attributes Quality attributes
Good taste Good taste Price-quality relationship Caring
Whitening Amount of sparkles Look (e.g., design, color, size) Awell-known brand
Against teeth cavities Amount of sugar Quality Quality
User-friendly packaging Nice feeling in mouth Awell-known brand Texture (gel, cream)
Cleaning Packaging User-friendly menu A nice smell
Against dental plaque Awell-known brand Short start-up time Price-quality relationship
Against teeth sensitivity Presence of extra ingredients(caffeine, tea extracts)
User-friendly remote control Hypoallergenic (= little or norisk at allergic reaction)Awell known brand Recording possibilities
(recorder, hard disk) Working against a specificskin problem (e.g., oilyskin, dry skin, redness)
QualityTechnical possibilities
(HDMI,USB port,…)
Price attribute Price attribute Price attribute Price attribute
Price Price Price Price
Consequences Benefits Benefits Benefits Benefits
Fresh breath Tastes good Easy to use Makes me feel good
Whiter teeth Thirst-quenching Good picture quality Makes me look good
Helps me to look good Healthier than other soft drinks Good sound quality Enhances my confidence
444 J. of the Acad. Mark. Sci. (2014) 42:430–451
Appendix B
Dodds et al. (1991)
Enhances my confidence Nice feeling drinking this SD Looks good in my interior Makes my skin feel pleasant
Fresh taste in my mouth Gives me energy Quick start up Helps keeping skin healthy
Less dental caries I won’t get fat Allows me to record
movies and programs
Applying this DC feels nice
Easy to use Bloated feeling (R)
Energy-saving
Feel clean
Makes brushing enjoyable Refreshing
Brand ensures quality
Refreshing
Clean teeth Brand ensures quality
Meets my needs
Brand ensures quality
Less dental plaque
Helps me feel good
Healthy teeth
Less dental pain
Brand ensures quality
Sacrifices Sacrifices Sacrifices Sacrifices
Budget-friendly (R) Budget-friendly (R) Budget-friendly (R) Budget-friendly (R)
This choice saves me money (R) This choice saves me money (R) This choice saves me money (R) This choice saves me money (R)
Note: (R) = reverse scored.
TP SD DVD DC
Item loadings
1. This X is a very good value for the money .80** .81** .88** .82**
2. At the price shown this X is very economical. .73** .82** .69** .78**
3. This is a good buy. .82** .86** .89** .88**
4. The price shown for this X is unacceptable. (R) .42** .53** .44** .65**
5. This X appears to be a bargain. .37** .68** .43** .51**
Construct-level psychometric properties
λ1 2.27 2.93 2.57 2.89
λ2 1.14 .88 1.03 .90
αa .81 .81
AVEa .56 .55
Note: (R) = reverse scored; X stands for toothpaste, soft drink, DVD player or day cream.
TP = toothpaste; SD = soft drink; DVD = DVD player; DC = day cream.
λ1 and λ2 = eigenvalues that are used to evaluate unidimensionality of the scale; α = Cronbach’s alpha, which is used to evaluate the reliability of the scale;AVE = Average Variance Extracted, which is used to evaluate within method convergent validityaSince the scale was not unidimensional for think offerings,we did not evaluate Cronbach’s alpha and AVE for the toothpaste and DVD settings
*p<.10 **p<.05
J. of the Acad. Mark. Sci. (2014) 42:430–451 445
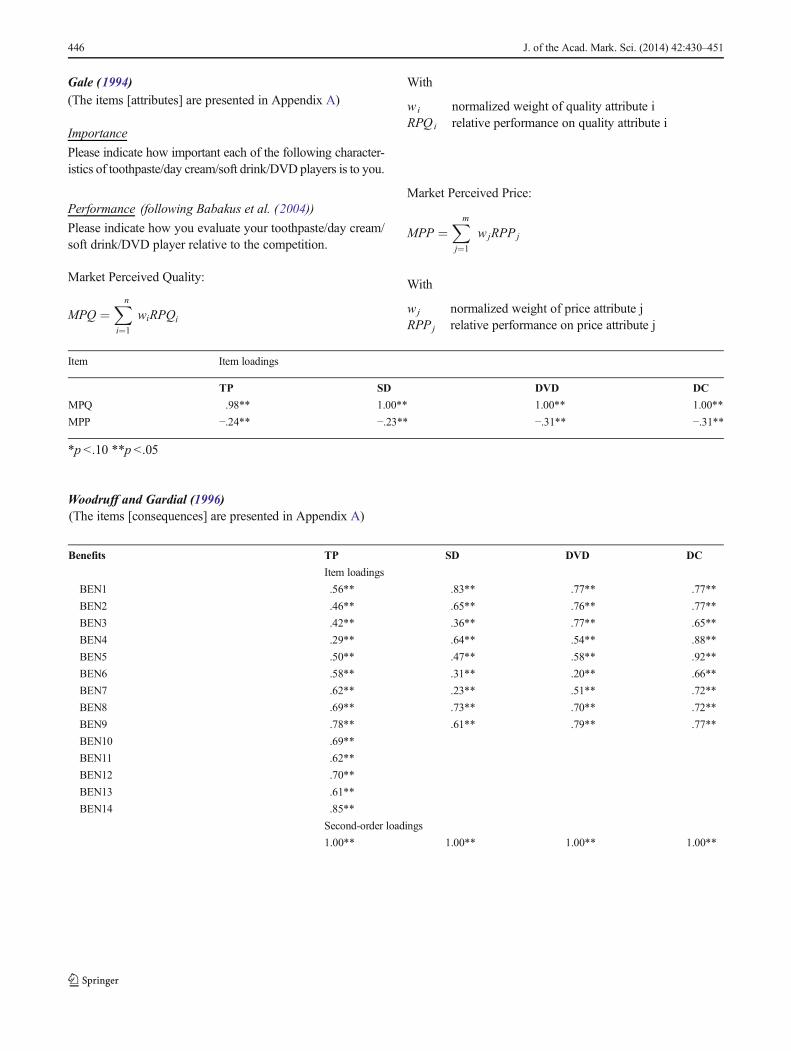
Gale (1994)(The items [attributes] are presented in Appendix A)
Importance
Please indicate how important each of the following character-istics of toothpaste/day cream/soft drink/DVD players is to you.
Performance (following Babakus et al. (2004))
Please indicate how you evaluate your toothpaste/day cream/soft drink/DVD player relative to the competition.
Market Perceived Quality:
MPQ ¼X
i¼1
n
wiRPQi
With
wi normalized weight of quality attribute iRPQi relative performance on quality attribute i
Market Perceived Price:
MPP ¼X
j¼1
m
wjRPP j
With
wj normalized weight of price attribute jRPPj relative performance on price attribute j
Item Item loadings
TP SD DVD DC
MPQ .98** 1.00** 1.00** 1.00**
MPP −.24** −.23** −.31** −.31**
*p <.10 **p <.05
Woodruff and Gardial (1996)(The items [consequences] are presented in Appendix A)
Benefits TP SD DVD DC
Item loadings
BEN1 .56** .83** .77** .77**
BEN2 .46** .65** .76** .77**
BEN3 .42** .36** .77** .65**
BEN4 .29** .64** .54** .88**
BEN5 .50** .47** .58** .92**
BEN6 .58** .31** .20** .66**
BEN7 .62** .23** .51** .72**
BEN8 .69** .73** .70** .72**
BEN9 .78** .61** .79** .77**
BEN10 .69**
BEN11 .62**
BEN12 .70**
BEN13 .61**
BEN14 .85**
Second-order loadings
1.00** 1.00** 1.00** 1.00**
446 J. of the Acad. Mark. Sci. (2014) 42:430–451

Sacrifices TP SD DVD DCItem loadings
SAC1 .96** .97** .97** .96**SAC2 .92** .92** .70** .96**
Construct-level psychometric propertiesλ1 1.76 1.79 1.50 1.85λ2 .24 .21 .50 .15α .92 .88 .67 .92AVE .88 .89 .71 .92
Second-order loadings−.32** −.14 −.29** −.40**
Note: TP = toothpaste; SD = soft drink; DVD = DVD player; DC = day cream.
λ1 and λ2 = eigenvalues that are used to evaluate unidimensionality of the scale; α = Cronbach’s alpha, which is used to evaluate the reliability of thescale; AVE = Average Variance Extracted, which is used to evaluate within method convergent validity
*p <.10 **p <.05
Holbrook (1999)
Social value (adapted from Sweeney and Soutar (2001)) TP SD DVD DC
Item loadings
Helps me to feel acceptable. .94** .95** .98** .85**
Improves the way I am perceived. .95** .97** .99** .94**
Makes a good impression on others. .91** .92** .81** .95**
Gives me social approval. .91** .95** .95** .90**
Construct-level psychometric properties
λ1 3.45 3.60 3.55 3.34
λ2 .23 .25 .30 .32
α .95 .96 .96 .93
AVE .86 .90 .87 .83
Second-order loadings
.09 .03 −.14 .21
Play (adapted from Petrick (2002)) TP SD DVD DC
Item loadings
Makes me feel good. .82** .82** .58** .80**
Gives me pleasure. .91** .90** .81** .93**
Gives me a sense of joy. .95** .95** .90** .94**
Makes me feel delighted. .91** .96** .85** .94**
Gives me happiness. .91** .95** .82** .93**
Construct-level psychometric properties
λ1 4.09 4.20 3.42 4.14
λ2 .56 .42 .76 .52
α .94 .95 .88 .95
AVE .81 .84 .64 .83
Second-order loadings
.39 .47 .35 .56
Excellence (adapted from Oliver (1997)) TP SD DVD DC
Item loadings
The quality is excellent. .87** .92** .83** .88**
One of the best regarding quality. .93** .94** .91** .92**
High quality product. .95** .94** .91** .93**
Superior compared to competing products. .84** .85** .81** .82**
J. of the Acad. Mark. Sci. (2014) 42:430–451 447
Satisfaction (adapted from Anderson et al. (1994))Please indicate the extent to which you are satisfied or dissat-isfied with your toothpaste/day cream/soft drink/DVD player.(11-point scale following Wirtz and Lee (2003))
Loyalty (adapted from Zeithaml et al. (1996))Please indicate how likely it is that you would…
1. Say positive things about your toothpaste/day cream/softdrink/DVD player to other people.
Construct-level psychometric propertiesλ1 3.23 3.35 3.00 3.17λ2 .41 .36 .51 .48α .92 .93 .89 .91AVE .81 .84 .75 .79
Second-order loadings.99 .98 .91 .96
Aesthetic value (based on laddering interviews) TP SD DVD DCItem loadings
I think I look good by usingthis TP/DC/SD.
.59** .96** .95**
I think my teeth/skin is beautifulby using this TP/DC.
.93** .96**
I think I have a fresh breath byusing this toothpaste.
.88**
I think I have a nice figure bydrinking this soft drink.
.93**
I think this DVD player is beautiful. .92**This DVD player looks goodin my interior.
.92**
This DVD player has abeautiful design.
.95**
This DVD player has abeautiful color.
.93**
Construct-level psychometric properties.λ1 1.79 3.46 1.82.λ
2
.21 .22 .18Α .88 .95 .90AVE .89 .86 .91
Second-order loadings.65 .21 .55 .79
Efficiency (adapted from Ruiz et al. (2008)) TP SD DVD DCItem loadings
The price is high (R) .05 .78 −.15 .05The effort I expend to receiveX is high (R)
.35* −.55 .07 .24
This TP/DC/DVD is easy to use .98** .86** .99**Starting up the DVD playerrequires a lot of time (i.e., the timebetween turning on the DVDplayer and the moment theDVD starts). (R)
.48**
Second-order loadings
.42 .00 .68 .47
Note: (R) = reverse scored; X stands for toothpaste, soft drink, DVD player or day cream.
TP = toothpaste; SD = soft drink; DVD = DVD player; DC = day cream.
λ1 and λ2 = eigenvalues that are used to evaluate unidimensionality of the scale; α = Cronbach’s alpha, which is used to evaluate the reliability of thescale; AVE = Average Variance Extracted, which is used to evaluate within method convergent validity
*p < .10 **p < .05
448 J. of the Acad. Mark. Sci. (2014) 42:430–451

2. Recommend your toothpaste/day cream/soft drink/DVDplayer to someone who seeks your advice.
3. Encourage friends and relatives to buy this toothpaste/daycream/soft drink/DVD player.
4. Consider this toothpaste/day cream/soft drink/DVDplayer yourfirst choice to buy toothpaste/day cream/soft drink/DVDplayer.
5. Buy this toothpaste/day cream/soft drink/DVD player againwhen you need toothpaste/day cream/soft drink/DVD player.
6. Doubt about buying this toothpaste/day cream/soft drink/DVD player again.
References
Agarwal, S., & Teas, R. K. (2001). Perceived value: mediating role ofperceived risk. Journal of Marketing Theory and Practice, 9(4), 1–14.
Anderson, E. W., Fornell, C., & Lehmann, D. R. (1994). Customersatisfaction, market share, and profitability: findings from Sweden.Journal of Marketing, 58(3), 53–66.
Anderson, E. W., Fornell, C., & Mazvancheryl, S. K. (2004). Customersatisfaction and shareholder value. Journal of Marketing, 68(4),172–185.
Anderson, E.W., Fornell, C., & Rust, R. T. (1997). Customer satisfaction,productivity, and profitability: differences between goods and ser-vices. Marketing Science, 16(2), 129–145.
Babakus, E., Bienstock, C. C., & Van Scotter, J. R. (2004). Linkingperceived quality and customer satisfaction to store traffic andrevenue growth. Decision Sciences, 35(4), 713–737.
Bagozzi, R. P. (1992). The self regulation of attitudes, intentions, andbehavior. Social Psychology Quarterly, 55, 178–204.
Baker, J., Parasuraman, A., Grewal, D., & Voss, G. B. (2002). Theinfluence of multiple store environment cues on perceived merchan-dise value and patronage intentions. Journal of Marketing, 66(2),120–141.
Bernhardt, K. L., Donthu, N., & Kennett, P. A. (2000). A longitudinalanalysis of satisfaction and profitability. Journal of BusinessResearch, 47(2), 161–171.
Bevan, J., & Murphy, R. (2001). The nature of value created by UKonline grocery retailers. International Journal of Consumer Studies,25(4), 279–289.
Blocker, C. P., Flint, D. J., Myers, M. B., & Slater, S. F. (2011). Proactivecustomer orientation and its role for creating customer value inglobal markets. Journal of the Academy of Marketing Science,39(2), 216–233.
Bolton, R. N., & Drew, J. H. (1991). A multistage model of customers’assessments of service quality and value. Journal of ConsumerResearch, 17(4), 375–384.
Bourdeau, L., Chebat, J. C., & Couturier, C. (2002). Internet consumervalue of university students: e-mail-vs.-Web users. Journal ofRetailing and Consumer Services, 9 , 61–69.
Caruana, A., & Fenech, N. (2005). The effect of perceived value andoverall satisfaction on loyalty: a study among dental patients.Journal of Medical Marketing, 5(3), 245–255.
Chan, K. W., Yim, C. K., & Lam, S. S. K. (2010). Is customer participa-tion in value creation a double-edged sword? Evidence from pro-fessional financial services across cultures. Journal of Marketing,74(3), 48–64.
Chen, Z., & Dubinsky, A. J. (2003). A conceptual model of perceivedcustomer value in E-commerce: a preliminary investigation.Psychology & Marketing, 20(4), 323–347.
Chin, W. W. (2010). How to write up and report PLS analyses. In V.Esposito Vinzi, W. Chin, J. Henseler, & H. Wang (Eds.), Handbookof partial least squares. Concepts, methods and applications (pp.655–690). Berlin: Springer.
Cronin, J. J., Jr., Brady, M. K., & Hult, G. T. M. (2000). Assessing theeffects of quality, value, and customer satisfaction on consumerbehavioral intentions in service environments. Journal of Retailing,76(2), 193–218.
Deutskens, E., de Ruyter, K., Wetzels, M., & Oosterveld, P. (2004).Response rate and response quality of Internet-based surveys: anexperimental study. Marketing Letters, 15(1), 21–36.
Devlin, S. J., Dong, H. K., & Brown, M. (2003). Selecting a scale formeasuring quality. Marketing Research, 15(3), 13–16.
Diamantopoulos, A., & Winklhofer, H. M. (2001). Index constructionwith formative indicators: an alternative to scale development.Journal of Marketing Research, 38(2), 269–277.
Dodds, W. B., Monroe, K. B., & Grewal, D. (1991). Effects of price,brand, and store information on buyers’ product evaluations.Journal of Marketing Research, 28(3), 307–319.
Drolet, A. L., &Morrison, D. G. (2001). Do we really need multiple-itemmeasures in services research? Journal of Service Research, 3(3),196–204.
Flint, D. J., Woodruff, R. B., & Gardial, S. F. (2002). Exploring thephenomenon of customers’ desired value change in a business-to-business context. Journal of Marketing, 66(4), 102–117.
Fornell, C., & Larcker, D. F. (1981). Evaluating structural equationmodels with unobservable variables and measurement error.Journal of Marketing Research, 18(1), 39–50.
Fornell, C., Mithas, S., Morgeson, F., & Krishnan, M. S. (2006).Customer satisfaction and stock prices: high returns, low risk.Journal of Marketing, 70(1), 3–14.
Fornell, C., Rust, R., & Dekimpe, M. G. (2010). The effect of customersatisfaction on consumer spending growth. Journal of MarketingResearch, 47(1), 28–35.
Gale, B. T. (1994). Managing customer value: Creating quality andservice that customers can see . New York: Free Press.
Gallarza, M. G., & Gil-Saura, I. (2006). Value dimensions, perceivedvalue, satisfaction and loyalty: an investigation of university stu-dents’ travel behavior. Tourism Management, 27 (3), 437–452.
Gerbing, D.W., & Anderson, J. C. (1988). An updated paradigm fro scaledevelopment incorporating unidimensionality and its assessment.Journal of Marketing Research, 25(2), 186–192.
Gotlieb, J. B., Grewal, D., & Brown, S. W. (1994). Consumer satisfactionand perceived quality: complementary or divergence constructs.Journal of Applied Psychology, 79(6), 875–885.
Graeff, T. R. (1997). Comprehending product attributes and benefits: therole of product knowledge and means-end chain inferences.Psychology & Marketing, 14(2), 163–183.
Grönroos, C. (2011). Service as business logic: implications for valuecreation and marketing. Journal of Service Management, 22(1), 5–22.
Grönroos, C., & Ravald, A. (2011). Service as business logic: implica-tions for value creation and marketing. Journal of ServicesManagement, 22(1), 5–22.
Grönroos, C., & Voima, P. (2013). Critical service logic: making sense ofvalue creation and co-creation. Journal of the Academy ofMarketingScience, 41(2), 133–150.
Gruca, T. S., & Rego, L. L. (2005). Customer satisfaction, cashflow, andshareholder value. Journal of Marketing, 69(3), 115–130.
Gutman, J. (1982). A means-end chain model based on consumer cate-gorization processes. Journal of Marketing, 46(2), 60–72.
Hair, J. F., Ringle, C.M., & Sarstedt, M. (2011). PLS-SEM: indeed a silverbullet. Journal of Marketing Theory and Practice, 19(2), 139–151.
Holbrook, M. B. (1999). Consumer value: A framework for analysis andresearch. London: Routledge.
J. of the Acad. Mark. Sci. (2014) 42:430–451 449

Holbrook, M. B. (2006). Consumption experience, customer value, andsubjective personal introspection: an illustrative photographic essay.Journal of Business Research, 59(6), 714–725.
Ittner, C. D., & Larcker, D. F. (1998). Are nonfinancial measures leadingindicators of financial performance? An analysis of customer satis-faction. Journal of Accounting Research, 36, 1–35.
Jarvis, C. B., MacKenzie, S. B., & Podsakoff, P. M. (2003). A criticalreview of construct indicators and measurement modelmisspecification in marketing and consumer research. Journal ofConsumer Research, 30(2), 199–218.
Karlis, D., Saporta, G., & Spinakis, A. (2003). A simple rule for theselection of principal components. Communications in Statistics:Theory and Methods, 32(3), 643–666.
Lai, F., Griffin, M., & Babin, B. J. (2009). How quality, value, image, andsatisfaction create loyalty at a Chinese telecom. Journal of BusinessResearch, 62(10), 980–986.
Laitamäki, J., & Kordupleski, R. (1997). Building and deploying profit-able growth strategies based on the waterfall of customer valueadded. European Management Journal, 15(2), 158–166.
Lam, S. Y., Shankar, V., Erramilli, M. K., &Murthy, B. (2004). Customervalue, satisfaction, loyalty, and switching costs: an illustration froma business-to-business service context. Journal of the Academy ofMarketing Science, 32(3), 293–311.
Lin, C. H., Sher, P. J., & Shih, H. Y. (2005). Past progress and futuredirections in conceptualizing customer perceived value. InternationalJournal of Service Industry Management, 16(4), 318–336.
Lusch, R. F., & Vargo, S. L. (2006). The service-dominant logic ofmarketing: Dialog, debate, and directions . New York: M.E.Sharpe Inc.
MacDonald, E. K., Wilson, H., Martinez, V., & Toossi, A. (2011).Assessing value-in-use: a conceptual framework and exploratorystudy. Industrial Marketing Management, 40(5), 671–682.
MacKenzie, S. B., Podsakoff, P. M., & Jarvis, C. B. (2005). The problemof measurement model misspecification in behavioral and organiza-tional research and some recommended solutions. Journal ofApplied Psychology, 90(4), 710–730.
MacKenzie, S. B., Podsakoff, P. M., & Podsakoff, N. B. (2011).Construct measurement and validation procedures in MIS and be-havioral research: Integrating new and existing techniques. MISQuarterly, 35(2), 293–334.
Mathwick, C., Malhotra, N., & Rigdon, A. (2001). Experientialvalue: conceptualization, measurement and application in thecatalog and Internet shopping environment. Journal of Retailing,77(1), 39–56.
Morgan, N. A., & Rego, L. L. (2006). The value of different customersatisfaction and loyalty metrics in predicting business performance.Marketing Science, 25(5), 426–439.
Mittal, V., Anderson, E. W., Sayrak, A., & Tadikamalla, P. (2005). Dualemphasis and the long-term financial impact of customer satisfac-tion. Marketing Science, 24(4), 544–558.
Oliver, R. L. (1997). Satisfaction: A behavioral perspective on the con-sumer. New York: McGraw-Hill.
Overby, J. W., Gardial, S. F., & Woodruff, R. B. (2004). French versusAmerican consumers’ attachment of value to a product in a commonconsumption context: a cross-national comparison. Journal of theAcademy of Marketing Science, 32(4), 437–460.
Petrick, J. F. (2002). Development of a multi-dimensional scale formeasuring the perceived value of a service. Journal of LeisureResearch, 34(2), 119–134.
Preacher, K., & Hayes, A. (2008). Asymptotic and resampling strategiesfor assessing and comparing indirect effects in multiple mediatormodels. Behavior Research Methods, 40(3), 879–891.
Ratchford, B. T. (1987). New insights about the FCB grid. Journal ofAdvertising Research, 27(4), 24–38.
Reinartz, W., Krafft, M., & Hoyer, W. D. (2004). The customerrelationship management process: its measurement and
impact on performance. Journal of Marketing Research,41 (3), 293–305.
Ringle, C. M., Sarstedt, M., & Straub, D. W. (2012). A critical look at theuse of PLS-SEM in MIS Quarterly. MIS Quarterly, 36(1), 3–14.
Rust, R. T., Lemon, K. L., & Zeithaml, V. A. (2004). Return on market-ing: using customer equity to focus marketing strategy. Journal ofMarketing, 68(1), 109–127.
Ruiz, D. M., Gremler, D. D., Washburn, J. H., & Carrión, G. C. (2008).Service value revisited: specifying a higher-order, formative mea-sure. Journal of Business Research, 61(12), 1278–1291.
Sahmer, K., Hanafi, M., & Qannari, E. M. (2006). Assessing unidimen-sionality within PLS path modeling framework. In M. Spiliopoulou,R. Kruse, A. Nürnberger, C. Borgelt, & W. Gaul (Eds.), From dataand information analysis to knowledge engineering (pp. 222–229).Heidelberg: Springer Verlag.
Sánchez-Fernández, R., & Iniesta-Bonillo, M. A. (2007). The concept ofperceived value: a systematic review of the research. MarketingTheory, 7(4), 427–451.
Sánchez-Fernández, R., Iniesta-Bonillo,M. A., &Holbrook,M. B. (2009).The conceptualisation and measurement of consumer value in ser-vices. International Journal of Market Research, 51(1), 93–113.
Seiders, K., Voss, G. B., Grewal, D., & Godfrey, A. L. (2005). Dosatisfied customers buy more? Examining moderating influencesin a retailing context. Journal of Marketing, 69(4), 26–43.
Setijono, D., & Dahlgaard, J. J. (2007). Customer value as a key perfor-mance indicator (KPI) and a key improvement indicator (KII).Measuring Business Excellence, 11(2), 44–61.
Slater, S. F. (1997). Developing a customer value-based theory of thefirm. Journal of the Academy ofMarketing Science, 25(2), 162–167.
Smith, N. C. (1999). Ethics and the typology of consumer value. In M. B.Holbrook (Ed.), Consumer value: A framework for analysis andresearch (pp. 147–158). London: Routledge.
Stewart, T. J. (1992). A critical survey on the status of multiple criteriadecision making theory and practice. International Journal ofManagement Science, 20(5/6), 569–586.
Strauss, A. L., & Corbin, J. M. (1998). Basics of qualitative research:Techniques and procedures for developing grounded theory.London: Sage Publications.
Sweeney, J. C., & Soutar, G. N. (2001). Consumer perceived value: thedevelopment of a multiple item scale. Journal of Retailing, 77(2),203–220.
Teas, R. K., & Agarwal, S. (2000). The effects of extrinsic product cueson consumers’ perceptions of quality, sacrifice, and value. Journalof the Academy of Marketing Science, 28(2), 278–290.
Trusov, M., Bucklin, R. E., & Pauwels, K. (2009). Effects of word-of-mouth versus traditional marketing: findings from an Internet socialnetworking site. Journal of Marketing, 73(5), 90–102.
Ulaga, W., & Eggert, A. (2006). Value-based differentiation in businessrelationships: gaining and sustaining key supplier status. Journal ofMarketing, 70(1), 119–136.
Vargo, S. L., & Lusch, R. F. (2004). Evolving to a new dominant logic formarketing. Journal of Marketing, 68(1), 1–17.
Vargo, S. L., Maglio, P. P., & Akaka, M. A. (2008). On value and valueco-creation: a service systems and service logic perspective.European Management Journal, 26(3), 145–152.
Vaughn, R. (1980). How advertising works: a planning model. Journal ofAdvertising Research, 20(5), 27–33.
Villanueva, J., Yoo, S., &Hanssens, D.M. (2008). The impact of marketing-induced versus word-of-mouth customer acquisition on customer eq-uity growth. Journal of Marketing Research, 45(1), 48–59.
Wirtz, J., & Lee, M. C. (2003). An examination of the quality andcontext-specific applicability of commonly used customer satisfac-tion measures. Journal of Service Research, 5(4), 345–355.
Woodall, T. (2003). Conceptualising ‘value for the customer’: an attribu-tional, structural and dispositional analysis. Academy of MarketingScience Review, 12, 1–42.
450 J. of the Acad. Mark. Sci. (2014) 42:430–451

Woodruff, R. B. (1997). Customer value: the next source for competitiveadvantage. Journal of the Academy of Marketing Science, 25(2),139–153.
Woodruff, R. B., & Gardial, S. F. (1996). Know your customer: Newapproaches to understanding customer value and satisfaction .Cambridge: Blackwell Publications.
Woodruff, R. B., & Flint, D. J. (2006). Marketing’s service-dominantlogic and customer value. In R. F. Lusch & S. L. Vargo (Eds.), The
service-dominant logic of marketing: Dialog, debate, and directions(pp. 183–195). New York: M.E. Sharpe Inc.
Zar, J. H. (1996). Biostatistical analysis . New Jersey: Prentice-Hall.Zeithaml, V. A. (1988). Consumer perceptions of price, quality, and
value: a means-end model and synthesis of evidence. Journal ofMarketing, 52(2), 2–22.
Zeithaml, V. A., Berry, L. L., & Parasuraman, A. (1996). The behavioralconsequences of service quality. Journal of Marketing, 60(2), 31–46.
J. of the Acad. Mark. Sci. (2014) 42:430–451 451