Assessing the potential of wastewater reuse in Palestine ...
219
An-Najah National University Faculty of Graduate Studies Assessing the potential of wastewater reuse in Palestine using business processes re-engineering coupled with value chain analysis as a tool: The case of Nablus Governorate By Leen Yahya Ameen Arafat Supervisor Dr. Abdel Fattah R. Hasan This Thesis is Submitted in Partial Fulfillment of the Requirements for the Degree of Master of Science in Water and Environmental Engineering, Faculty of Graduate Studies, An- Najah National University, Nablus, Palestine. 2015
Transcript of Assessing the potential of wastewater reuse in Palestine ...
An-Najah National University Faculty of Graduate Studies
Assessing the potential of wastewater reuse in Palestine using business processes re-engineering coupled with value chain analysis as a tool: The
case of Nablus Governorate
By Leen Yahya Ameen Arafat
Supervisor
Dr. Abdel Fattah R. Hasan
This Thesis is Submitted in Partial Fulfillment of the Requirements for the Degree of Master of Science in Water and Environmental Engineering, Faculty of Graduate Studies, An-Najah National University, Nablus, Palestine.
2015


iii
Dedication
For my soul and life for my rock in life for you with all
of my love. for all of you who stand by me in the dark
nights and encouraged me to the end of the light
I dedicate my work
My son and husband, my mom and dad, my family and
step family
Thank you from the bottom of my heart
iv
Acknowledgment
This research was done by the fund and support
from the Palestinian Water Authority and the Austrian
government through the Austrian Project "Capacity
Building Project and institutional reform for the
integrated management of water and sanitation services
in rural communities in the West Bank" and SWEMED
project

vi
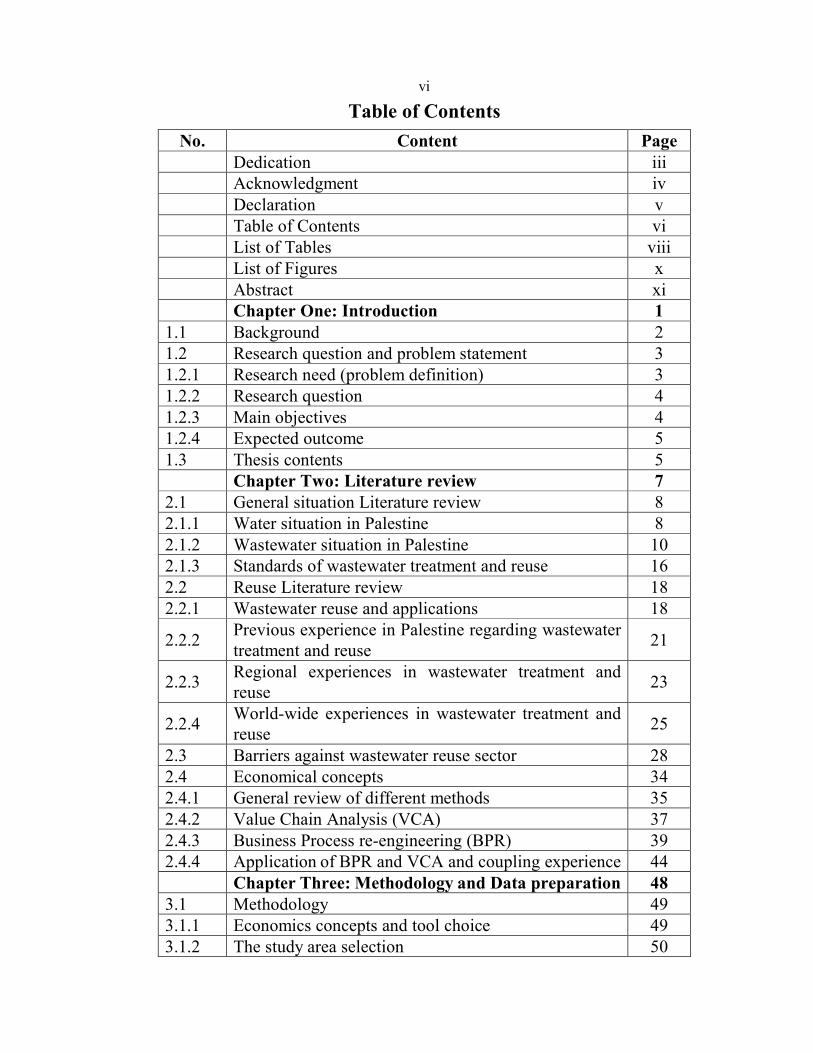
Table of Contents
No. Content Page Dedication iii
Acknowledgment iv
Declaration v
Table of Contents vi
List of Tables viii
List of Figures x
Abstract xi
Chapter One: Introduction 1 1.1 Background 2
1.2 Research question and problem statement 3
1.2.1 Research need (problem definition) 3
1.2.2 Research question 4
1.2.3 Main objectives 4
1.2.4 Expected outcome 5
1.3 Thesis contents 5
Chapter Two: Literature review 7 2.1 General situation Literature review 8
2.1.1 Water situation in Palestine 8
2.1.2 Wastewater situation in Palestine 10
2.1.3 Standards of wastewater treatment and reuse 16
2.2 Reuse Literature review 18
2.2.1 Wastewater reuse and applications 18
2.2.2 Previous experience in Palestine regarding wastewater
treatment and reuse 21
2.2.3 Regional experiences in wastewater treatment and
reuse 23
2.2.4 World-wide experiences in wastewater treatment and
reuse 25
2.3 Barriers against wastewater reuse sector 28
2.4 Economical concepts 34
2.4.1 General review of different methods 35
2.4.2 Value Chain Analysis (VCA) 37
2.4.3 Business Process re-engineering (BPR) 39
2.4.4 Application of BPR and VCA and coupling experience 44
Chapter Three: Methodology and Data preparation 48 3.1 Methodology 49
3.1.1 Economics concepts and tool choice 49
3.1.2 The study area selection 50

vii
No. Content Page
3.1.3 Coupling between BPR &VCA methodology and
application 56
3.2 Meeting preparation and data collection 57
3.3 Questionnaire preparation and data collection 58
3.4 Workshop preparation and data collection 68
Chapter Four: Outcomes, Results and Analysis of the field Data
71
4.1 Questionnaire analysis and outcomes and results 72
4.1.1 End users Questionnaire outcome 72
4.1.2 Sellers Questionnaire results 78
4.1.3 Farmers Questionnaire results 82
4.2 Workshop analysis and outcomes 86
4.2.1 Workshop schedule and attendance 86
4.2.2 Workshop presentations summary 86
4.2.3 Workshop recommendations and results 91
4.2.4 Before and after analysis and results 91
4.2.4.1 End users 91
4.2.4.2 Farmers 93
4.3 Industrial data and outcomes 95
Chapter Five: Wastewater reuse sector Modeling and Analysis using VCA software and BPR
101
5.1 Modeling, purpose and key players (current situation) 102
5.2 VCA tool and application 103
5.2.1 Data entering and model building 104
5.2.2 Results of the model run 113
5.3 BPR application 122
Chapter Six: Conclusion and Recommendation and Future Research Needs
128
6.1 Conclusions and Recommendations 129
6.2 Further research suggestion 131
References 132 Appendices 140 ABCDEب ا

viii
List of Tables
No. Table Page
Table (2.1) Water demand, supply and deficiency in Palestine in MCM 2010 (PWA, 2012a).
10
Table (2.2) Characteristics of raw municipal and rural domestic wastewater in the West Bank
12
Table (2.3) quality of wastewater flow in several major wadis in the West Bank (HWE and PWA, 2011)
13
Table (2.4)
Methodologies of BPR (Muthu, et.al, 1999) 43
Table (3.1) Maximum and minimum cost for most of Nablus governorate agricultural products.
52
Table (3.2) Industries amount in Nablus 53
Table (3.3) Some of the industries water consumption in Nablus Governarate
54
Table (3.4) The sources of water in Nablus governorate 55
Table (3.5) The water cost in Nablus governorate according to type of use and quantity.
55
Table (3.6) Methodologies of BPR and VCA 56
Table (3.7) The number of samples needed in each case 64
Table (3.8) The characteristics of the test sample 66
Table (3.9) The answers of the questionnaire questions 67
Table (3.10) The speakers, there institutes and papers name in the workshop.
70
Table (4.1) Sample characteristics 72
Table (4.2) Sample answers about the habits regarding fruit and vegetable use
73
Table (4.3) Sample answers about purchasing fruit and vegetables habits
73
Table (4.4) Sample answers regarding water and treated wastewater use in agriculture
74
Table (4.5) Summary of the end users results 77
Table (4.6) Sample characteristics 78
Table (4.7) Sample answers about purchasing fruit and vegetables for selling
78
Table (4.8) Sample answers regarding the acceptability of selling treated wastewater products
79
Table (4.9) summary of the sellers questionnaires 82
Table (4.10) Sample characteristics 82
Table (4.11) Sample answers regarding the methods of farming
83

ix
No. Table Page
Table (4.12) Sample answers about acceptability to use wastewater and treated wastewater in agriculture
83
Table (4.13) Attendance of the workshop 86
Table (4.14) Comparison in the awareness for end users 92
Table (4.15) comparison in the awareness for the farmers 94
Table (4.16) industrial questionnaire outcomes 97
Table (5.1) List of the goods, activities and plans in the VCA model
105
Table (5.2) Forex premium data. 107
Table (5.3) The data for some of the goods needed 108
Table (5.4) The data needed for some of the activities. 110
Table (5.5) One Plan data needed for the model 112
Table (5.6) Result in NIS 114
Table (5.7) Results in percentage 114
Table (5.8) value added components and profits in the VCA plans
115
Table (5.9) Scenario one result 117

x
List of Figures
Figure No. Title Page
Figure (2.1) Percentage Distribution of Households in the Palestinian Territory by the Main Mean of Obtaining Water and Region(PCBS, 2011).
9
Figure (2.2) Percentage Distribution of Households in the Palestinian Territory by Wastewater Disposal Method and Region(PCBS, 2011).
11
Figure (2.3) Portar's model of value chain (Porter, 1985) 38
Figure (2.4) The four dimensions of an organization (Leavitt's diamond) (Simon, 1994).
41
Figure (4.1) Location vs. clean habits 75
Figure (4.2) Location vs. buying UNTWW products 76
Figure (4.3) Status Vs buying UNTWW products 77
Figure (4.4) Location vs. acceptability to tww products selling
80
Figure (4.5) Types of product sell prefer 81
Figure (4.6) source of water declaration 85
Figure (5.1) The model of the reclaimed treated wastewater right now
103
Figure (5.2) Water-Wastewater-Product chain. 104
Figure (5.3) Reference price or Market price 106
Figure (5.4) Parameters of the model. 107
Figure (5.5) The goods data table. 108
Figure (5.6) The activities data table 109
Figure (5.7) The plan data table. 111
Figure (5.8) Plans results 113
Figure (5.9) Graphical representation of the results. 114
Figure (5.10) Scenario one results 117
Figure (5.11) Scenario two results. 118
Figure (5.12) Scenario three results 118
Figure (5.13) Scenario four results 119
Figure (5.14) Scenario five results 119
Figure (5.15) Scenario six results 120
Figure (5.16) Scenario seven results 121
Figure (5.17) Scenario nine results 121
Figure (5.18) Scenario ten results 122
Figure (5.19) BPR organization 123
Figure (5.20) Leavitt's diamond 124
Figure (5.21) Re-engineered reclaimed wastewater sector 127

xi
Assessing the potential of wastewater reuse in Palestine using business processes re-engineering coupled with value chain analysis as a tool:
The case of Nablus Governorate By
Leen Yahya Ameen Arafat Supervisor
Dr. Abdel Fattah R. Hasan
Abstract
Water and environmental issues are the trend of this century due to
the reduced amounts of drinkable water and safe environment to the future
generations. Palestine is one of the countries that suffers badly from both
issues and need drastic measurement to solve them.
The water unavailability in Palestine and the increase in demand
forces the authorities and the scientists to search for new sources of water,
one of these sources is the reclaimed wastewater which not only reduces
the amount of drinkable water used for agriculture and industries but also
solve an environmental hazard of polluting the ground water when running
un treated in the wadis among other threats.
Thus, for an efficient study of the reclaimed wastewater in Palestine ,
the reclaimed wastewater reuse is addressed not only as an environmental
necessity but also as an economic commodity in order to identify all
resulted barriers against it in order to facilitate developing this sector after
the many failures that were faced.
Two main modern economic concepts are coupled in order to cover
those objectives which are the Value Chain Analysis (VCA) and the
xii
Business Process Re-Engineering (BPR). Coupling these two concepts
gives an efficient assessment tool for the barriers against reclaimed
wastewater reuse .
Several field researches, meetings, and workshop were conducted in
a practical approach to insure the reliability of the results that showed that
the economical and social barriers are the main barriers in the reclamation
sector.
The main results showed that neither the age, sex or education is
related to the acceptability of reclaimed wastewater only the status of the
person whether he is married and provide to his family or not is the main
factor. Their results was used as input for a VCA model for the reclaimed
wastewater in order to assess the current situation of the reclaimed
wastewater sector which was found to be weak and lack the proper support
and organization. The result of this model was introduced to BPR
methodology in order to re-engineer the sector which gave a new organized
entities model that should be enforced to reach a successful sector, and
determine the proper solutions for the identified barriers.
From an engineering point of view, the increase in the acceptability
toward the reclaimed waste water will increase the profits for the farmers
and the suppliers of the fresh water and the reclaimed waste water, which
would happen if new re-engineered model for the reclaimed wastewater
was used with the proper lows that regulates the use of water and reclaimed
waste water.

xiii
The researcher recommends to have wide scale awareness campaign
regarding the reclaimed waste water, also to invest more money regarding
the support of the reclaimed wastewater sector and to apply the re-
engineered model of the reclaimed waste water sector in order to enhance
the new sector. and to encourage the new projects in this area that will
enhance the agriculture and provide new work opportunities.

1
Chapter One
Introduction

2
Chapter One
Introduction
1.1 Background
Water scarcity is a property of the 21st century (FAO, 2007).
Unconventional water resources started to gain popularity to suffice
increasing demand on water for different uses. Reclaimed wastewater is
now playing a major role of replacing fresh water in many uses (Al Masri
and McNeil, 2008).
Palestine is one of the countries that already have water insufficiency
due to several factors, and this insufficiency is increasing through years.
Agriculture is the largest user of water in Palestine since it consumes 70%
of the total water consumption (Trottier J,1999; Nazer et.al.,2007). This is
a considerable demand on water. Reducing this irrigation demand by using
reclaimed wastewater will save more fresh water for domestic uses (Nazer
et. al., 2007).
Barriers against the reuse of reclaimed wastewater expand over a
wide spectrum of issues related to many factors. These include
environmental considerations, social and economic aspects, cultural
dimensions, political considerations, demography, legal and regulatory
maturity, institutional capacity, technicalities, and sustainability. These
barriers need to be studied, and assessed (Zimmo and Petta, 2005).
In this research the reclaimed wastewater reuse is studied from and
environmental side of view that should also provide money to cover its
costs and may be some profits in the future.

3
In order to obtain economical independency for the sector two
concepts are coupled; the Value Chain Analysis (VCA) and the Business
Process Re-Engineering (BPR). These tools covers not only the economical
issues but also have the ability to introduce the social aspects in their
consideration for a full assessment of the sector.
Both analytical and non analytical methods is used starting from
meetings to workshops and questionnaires and ending with using VCA and
BPR models in order to identify the barriers, assess and re-engineer the
reclaimed wastewater sector.
1.2 Research question and problem statement
1.2.1 Research need (problem definition)
Palestine is among the countries with the scarcest renewable water
resources due to both natural and artificial barriers, the personal
consumption is averaged to around 100 L/c.d. for all purposes and 80
L/c.d. for the domestic purposes (PWA,2012a). At present water demand
exceeds water available for supply. The Palestinians in the West Bank are
consuming groundwater for domestic, industrial, and agricultural purposes.
Examples of industrial activities in Palestine are: stone cutting,
construction materials, textile and garment, agro-industries, food
processing, handcrafts, metals fabrication, chemical, pharmaceutical,
plastic and technological processes, while agricultural practices are mainly
crops production and livestock. The ratio between the amount of water

4
used for agriculture to the domestic and industrial use is 71:29 which
shows the great amount of water consumed by agriculture (PWA, 2012a;
PMNE, 2012).
The gap between water supply and water needs is growing; it
emphasizes the need for adaptation of the integrated water resources
management approach and the mobilization of any conventional and non-
conventional water resources as the reuse of reclaimed wastewater. Thus,
PWA started the installation of wastewater treatment plants to produce
reclaimed wastewater as a new resource of water beyond many benefits
such as protecting the public health and conserving the local environment.
(PWA, 2012a)
1.2.2 Research question
What are the barriers against reclaimed wastewater reuse in Palestine?
And how to overcome them and develop this sector using the proper
assessment tools?
1.2.3 Main objectives
• Identifying the main barriers against reclaimed wastewater reuse in
Palestine.
• Assessing the reclaimed wastewater reuse potential in Palestine.
• Re-engineering the reclaimed wastewater reuse sector.

5
1.2.4 Expected outcome
The research will result in a study for the barriers against reclaimed
wastewater, emphasizing on socio-economic one as the main barriers using
qualitative and quantitative analysis for the reclaimed wastewater sector,
with questionnaire forms that covers the social side point of view for the
use of reclaimed wastewater. Recommendations of mitigation measures
and solutions for the barriers will facilitate the development of the
reclaimed wastewater sector.
1.3 Thesis Contents
The first chapter of this thesis discussed the research need and
statement with the main objective, followed by the second chapter that
consists of the background and literature review about the situation of
water and wastewater and reuse in Palestine, with the rules available for
regulating them, also the experience of different countries in the reuse
sector. It also discusses the identified barriers against reclaimed wastewater
sector in Palestine and the different economic concepts which were studied
in order to choose the best concept and method for the assessment of the
sector.
The third chapter explains the methodology of the coupled tools.
And the area of research -Nablus Governorate-.This chapter also presents
the preparation for the data collection using a questionnaire, meetings and
6
workshop with all the samples size calculations, questionnaire preparation,
testing and workshop planning.
The fourth chapter presented the outcomes and results of the
meetings, questionnaires, and the workshop. The fifth chapter showed how
the data collected in chapter four was introduced into the VCA model, in
addition to analysis and results. The fifth chapter then introduced the
application of the BPR methodology on the data in order to find the final
re-engineered model for the sector.
The sixth chapter is the conclusions and the recommendations for
managing and monitoring the wastewater reuse sector and further
researches needed for the development of this field.

7
Chapter Two
Literature review

8
Chapter Two
Literature review
2.1General situation Literature review
2.1.1 Water situation in Palestine
Palestine is among the countries with the scarcest renewable water
resources due to both natural and artificial barriers, the available water
from the mountains is 650 cubic meter and from the valleys is 70 million
cubic meter with only 20% available for use due to the Israel's barriers.
Around 30 cubic meter of fresh water is consumed annually per capita in
Palestine, This is far below the per capita water resources available in other
countries in the Middle East and the world .Right now water demand
exceeds water available for supply, the gap between demand and supply is
growing due to population growth, increasing higher standards of living
and the need for expanding the irrigated agriculture and industrialization
(AMAN, 2009; PWA, 2012a).
In 2011 (Figure 2.1), the West bank have 89.4% households that are
connected to water networks, with a total consumption of 11 MCM of
water per month and average of 23.6 cubic meter per month per family.
While in Gaza 96.3% households are connected with a total consumption
of 6 MCM per month and an average of 24.3M3 per month per family
(PCBS, 2011).

9
Figure (2.1): Percentage Distribution of Households in the Palestinian Territory by the Main Mean of Obtaining Water and Region(PCBS, 2011).
At present, and mainly due to political barriers, water needs exceeds
the available water supply. The gap between water supply and water needs
is growing, emphasizing the need for adaption of the integrated water
resources management approach and the mobilization of any conventional
and non-conventional water resources, thus helping to solve part of the
existing problems of the water system. (PWA, 2009)
The amount of water needed in Palestine and the amounts of water
deficiency that are covered through purchasing water from the Israel's
water company (Palestinian water department) are presented in Table 2.1
(PWA, 2012a).

10
Table (2.1): Water demand, supply and deficiency in the West bank in MCM 2010 (PWA, 2012a).
Gov
ern
orat
e
Pop
ula
tion
Nn
eed
ed
qu
ali
ty
Loc
al
reso
urc
es
Pu
rch
ase
d
reso
urc
es
Def
icit
Lo
sses
Act
ual
co
nsu
mp
tion
Act
ual
d
efic
it
Jenin 274001 15.002 7.996 1.99 9.015 1.64 4.347 10.655
Tubas 54765 2.998 9.689 4.336 1.298 0.51 1.19 1.808
Tulkarm 165791 9.077 1.725 0.398 4.471 1.847 2.759 6.318
Nablus 340117 18.621 14.31 3.637 7.387 3.314 7.92 10.701
Qalqilia 97447 5.335 10.91 0.679 1.326 0.922 3.087 2.248
Salfit 63148 3.457 0.174 2.45 0.89 0.552 20.15 1.442
Jericho 301296 2.487 3.585 16.391 -1.0635 0.866 2.684 -0.196
Ramallah 45433 16.496 25.029 1.831 0.301 4.34 11.855 4.641
Jerusalem 144740 7.925 0.693 3.942 3.29 1.845 2.79 5.134
Beitlehm 188880 10.341 4.504 7.553 -0.345 3.676 7.01 3.331
Hebron 600364 32.87 7.702 12.23 13.06 5.19 14.62 18.25
Total 2275982 124.609 86.317 55.437 39.6295 24.702 78.412 64.332
As the numbers show the amount of water used for agriculture is
huge around 70%. So reducing the water amount needed for agriculture and
also industry will save enough water for domestic uses. Better management
of the water and wastewater sector could reduce total water demand, reduce
the pressure on the water supply system, and addresses health and
environmental issues (PWA, 2012b).
2.1.2 Wastewater situation in Palestine
Palestine produces around 106 MCM annually wastewater where; 50
MCM is from the West Bank, 56 MCM from Gaza and 39 MCM comes
from the Israeli's settlements and their untreated industrial wastewater that
flows uncontrolled in Palestine's lands (Samhan et. al., 2010).
In 1998 about 65% of the households of the 11 larger communities in
the West Bank were connected to sewer systems. Households that are not
serviced by sewer systems dispose their wastewater into cesspools,

11
infiltration ditches or similar facilities. Grey wastewater is sometimes being
used in gardens or disposed in to wadis (Exact, 2001).
While in 2011 (figure 2.2), wastewater networks were used by
40.2% of households in the West Bank and cesspits were used by 59.8% of
households. These connected households are distributed as 47% from urban
areas and 10.5% from rural areas and 90.9% from the camps (PCBS, 2011).
Figure (2.2): Percentage Distribution of Households in the Palestinian Territory by Wastewater Disposal Method and Region(PCBS, 2011).

12
There is no specified quality characteristics of the wastewater
produced in Palestine published yet as an average values but there have
been several studies for cities wastewater by itself (Table 2.2). The quality
of the wastewater discharged through several wadis(Table 2.3), which are
some of the main wadis in West Bank these wadis will be the source of
water for treatment in the treatment plants, these transboundary wadis are
(HWE and PWA, 2011):
1. Beit Jala
2. Al Zumar (Nablus and Tulkarm)
3. Al Samen (Hebron)
4. Al Mahbas (Ramallah district)
5. Al Moqata' ( Jenin)
6. Al Zohor (Qalqilya)
Table (2.2): Characteristics of raw municipal and rural domestic wastewater in the West Bank
IN mg/l Municipal urbanj wastewater Rural domestic
waste water Parameter Ramallah Nablus Hebron Al-Bierh Gray Black
BOD5 525 1850 1008 522 286 282
COD 1390 2115 2886 1044 630 560
Kj-N 79 120 278 73 17 360
NH4-N 51 104 113 27 10 370
NH3-N 0.6 1.7 0.3 - 1 -
SO4 132 137 267 - 53 36
PO4 13.1 7.5 20 44 16 34
CL- 350 - 115 1099 200 -
TSS 1290 - 1188 554 - -

13
Ta
ble
(2.
3):
qu
ali
ty o
f w
ast
ewate
r fl
ow
in
sev
era
l m
ajo
r w
ad
is i
n t
he
Wes
t B
an
k (
HW
E a
nd
PW
A,
20
11
)
LO
CA
TIO
N
PH
B
OD
M
G/L
C
OD
M
G/L
T
SS
M
G/L
N
H4
MG
/L
PO
4
MG
/L
CL
M
G/L
B
M
G/L
T
DS
M
G/L
D
O %
T
EM
P.
C
WA
DI
BE
IT J
AL
A
7.8
468.7
900
7044.7
114.3
2.1
422.7
5.6
1437.7
1.9
20.4
WA
DI
AL
SA
ME
N
7.6
265.2
404.3
9774.7
104
1.9
754.8
5
1839.3
1.9
20.4
WA
DI
AL
MA
HB
AS
7.2
103.7
260
104
68.1
2.1
347.7
3.6
1093.3
1.2
19.2
WA
DI
AL
ZO
UR
7.3
241.8
493.3
265.3
35.6
1.4
258.3
9.6
1013.2
1.3
20.1
WA
DI
AL
ZO
MA
R
7.6
368.7
502.7
3566.7
81.9
1.5
774.7
6.4
1736.5
1.4
19.8
WA
DI
AL
MO
QA
TA
7.5
403.4
614.7
617.7
113.8
1.6
457.3
8.5
1364.2
1.9
16.9
AV
AR
AG
E
7.5
308.5
8
529.1
7
3656.5
2
86.2
8
1.7
7
502.5
8
6.4
5
1414.0
3
1.6
19.4
7
14
When Palestine was totally under the Israel's occupation only
preliminary treatment plants was constructed; the ponds in Tulkarm, Jenin
and Ramallah. In 1996 under the Palestinian leadership one new
wastewater treatment plant was constructed in Al Bierh city . Right now
several new treatment plants are under study or construction as Eastern
Nablus treatment plant. (Samhan, et al., 2010)
At the West Bank Four large-scale WWTPs are reported out of
which two are not operating. The treatment technologies adopted at these
plants are: (Exact, 2001)
• Activated Sludge with Trickling filter, (Al-Bireh).
• Aerated lagoons - Aerated ponds, (Jenin and Ramallah).
• Anaerobic lagoons followed by Aerobic stabilisation ponds, (Tulkarm).
• Algae ponds.(Hebron)
There are four privately owned small-scale treatment plant, out of
which two are located in the district of Bethlehem, one in Jericho and one
in the Birzeit University. The treatment technologies adopted at these
plants are: (Exact, 2001)
• Activated sludge- extended aeration,
• Oxidation ditch.
Due to the scattered populations in the West Bank several small
scale treatment units was constructed that may serve a house or several

15
houses to gather these treatment units treats wastewater and divert it to the
agricultural land near to those houses in order to benefit from this water.
several NGOs like PARC and PHG has constructed hundreds of these units
all around the West Bank as will be discussed in the next sections. (PHG,
2008; PARC,2005)
The reason for the delay of the construction of new wastewater
treatment plants is due to the Israel's obstacles against getting the approvals
of the treatment plants. They claim that the plants are in area C or that the
settlements should be connected to the treatment plant which is not
accepted for the Palestinians. (Zimmo and Petta, 2005)
The Israel's exploits the fact that Palestinian wastewater is not treated
inside the West Bank and flows into Israel. Israel treats some of this
wastewater in facilities inside its sovereign area and uses it for agricultural
irrigation and to rehabilitate streams, yet deducts the cost of building these
facilities and of the treatment from tax money owing to the Palestinian
Authority, 0.8-2.2 NIS is the cost of one meter cube of untreated waste
water with no specified reason for this wide range. (HWE and PWA, 2011)
The Palestinian Authority has established a new sectoral strategy for
2012 which vision is " A regulated water and wastewater sector which
contributes to Palestinian statehood as well as the sustainability of water
resources built on strong health, environmental, social and economic
foundations to meet essential and developmental requirements of the
Palestinian Society." (PWA, 2012b)

16
Also a new reclaimed wastewater classification was established that
is restricted to the type of use of reclaimed water. (PWA, 2012a)
2.1.3 Standards of wastewater treatment and reuse
Several bodies are responsible for the water, wastewater and reuse
sector in Palestine since it is connected to different elements. These bodies
may be governmental or national, and each one have its role. As for the
regulations and standards the authority side take the responsibility of
issuing the standards and guideline and for the inspection and auditing on
these standards. (Zimmo and Petta, 2005)
The Authority side bodies that are responsible for the water,
wastewater treatment and reuse are:
• Palestinian water Authority
• Environmental Quality Authority
• Ministry of Agriculture
• Ministry of Health
These bodies work together in order to issue the lows, standards and
guidelines that govern that issue which are:
• Palestinian water Low 2014
Which was issued after reviewing the amended Basic Law for the
year 2003 and its amendments in particular Article (43), And the
17
Palestinian Local Government Law of 1997 No (1) and its amendments,
And the Environmental Law No (7) and its amendments, And the Water
Law No (3) of 2002, And the Agricultural Law No (2) of 2003.
• PSI 6/2001 article 16
The main components of standard are as below:
1. Field /(Reclaimed Wastewater & Effluent of WWTP)
2. Definitions (Wastewater & Reclaimed wastewater)
3. General Guidelines (reclaimed wastewater quality, irrigation periods,
sensitive crops, irrigate eaten raw crops with any reclaimed wastewater
is forbidden, pipelines specifications, no mixing with fresh water, no
direct infiltration, keeping 500 m offshore distance in case of sea
disposal),
4. Specifications/(Quality of the treated wastewater, 24-hour composite
samples, and requirements should be met in at least 80% of samples
taken),
5. Classification of reclaimed wastewater (A, B, C, D)
6. List of Restrictions or Barriers (11 barriers)
7. Allowable crops for unrestricted irrigation (industrial crops, cotton,
seeds before flowering, woody crops and forests without public
accessibility, fodders and fodder grass).

18
• Treated water for agriculture Guidelines 34/2012
Where it aims for protecting the nature from any pollution if treated
wastewater is to be used and to set some bases for the use of treated
wastewater in order not to harm the human beings or the animals.
• The Palestinian agricultural low 2/2003
Where several articles was taking about the identification and
classifications of treated wastewater that may be reused in several aspects
of life.
2.2 Reuse Literature review
2.2.1 Wastewater reuse and applications
Wastewater can be identified as the water supply of the community
after it has been used in a variety of applications." Wastewater" as a term
mean any water that can't be benefited from any more in any application.
Wastewater reuse started in ancient Greece in Minion nation where they
used it for agriculture. Later traces of wastewater reuse were found in 16th
century in Germany and in 18th century in the United kingdom and also in
India and China where some of these untreated practices lead to disastrous
event in the 50’s (Vigneswaran and Sundaravadivel, 2004).
Reuse is frequently practiced as a method of water resources
management, since the water reclaimed can be used in several sectors as
follows (GEC and UNEP, 2010; Vigneswaran and Sundaravadivel, 2004):

19
• Wastewater reuse for agriculture
• Wastewater reuse for industry
• Wastewater reuse for Urban Applications
• Wastewater reuse for environmental water enhancement and
groundwater recharge
Several benefits was gained when treated wastewater was reused.
Mainly conservation of fresh water and reducing its pollution. In
agriculture reducing the fertilizers used, supporting food security and
saving the soil, as in industry the cost of treating the industrial wastewater
and the reduction of the cost of recovery row materials and heat(GEC and
UNEP, 2010).
Another benefit is in urban applications, where many countries uses
the secondary treated wastewater and filters it in sand filters and use it in
fire fighting or car washing or parking and street washing, or in a dual
distribution system; one for fresh water and other for treated wastewater
reaches the building, where toilet flushing water and other uses is from
treated waste water(GEC and UNEP, 2010).
Last but not least is in Enhancement of the environment and ground
water recharge that are the most direct methods that affect the environment,
in the environmental enhancement an enlarge of the areas that are available
for retaining water like lakes and bonds that will enhance the environment

20
in the area as for the ground water recharge it will enhance the amount
available of ground water (GEC and UNEP, 2010).
Several points should be considered when reusing treated
wastewater, irrigating with it may have obstacles or barriers; First health
risks and safety, which can affect both farmers and users of the crops,
Second nutrient management, Third irrigation methods and crop
types(Vigneswaran and Sundaravadivel, 2004).
Water quality requirements for industry reuse differ according to
application types in order to avoid scaling, corrosion, biological growth,
and fouling, which may impact industrial process integrity and efficacy, as
well as product quality(Vigneswaran and Sundaravadivel, 2004).
As for urban use the most important concern in this application is the
protection of water from contamination with treated wastewater as in pipe
leakage or crossing, also that very restrict disinfection should be applied
since this treated wastewater will make contact with the public more than
other applications(Vigneswaran and Sundaravadivel, 2004).
For the ground water recharge can be done by three methods, each
one have different amount of treatment needed, these methods are recharge
basin, direct injection and Vadose zone injection (Vigneswaran and
Sundaravadivel, 2004).

21
2.2.2 Previous experience in Palestine regarding wastewater treatment
and reuse
Due to the Israeli's delays and obstacles against the construction of
new wastewater treatment plants several small scale projects and
experiments were conducted. Several trials from the Palestinian side were
done some of the successful trials are but not limited to: (HWE and PWA,
2011).
1. Birzeit university experience, where an onsite activated sludge
treatment is used for landscape irrigation using the drip system and for
toilet flushing, No problems occurred in the system but concerns about
the ground water are raised. (PWA, 1998)
2. Al Bireh bio-solids composting and reuse of reclaimed wastewater,
which was funded by the USAID as a demonstration for Hebron
wastewater treatment plant on Al-Bireh wastewater treatment plant site.
Six dunums of land was irrigated with reclaimed wastewater planted
with orchard and ornamental trees, grape stocks, processed vegetable
and flowers and ornamental shrubs. Very high quality reclaimed water
is used to irrigate a 600 m2 greenhouse with cultivation of cooked
vegetables and commercial nursery crops (IWS, 2006).
3. The Palestinian Agricultural Relief Committee (PARC) has a long
experience in constructing small scale treatment plants for gray water
that is collected from around 20 houses consisted of anaerobic pond,
gravel filter, sand filter and the polishing pond which considered as low

22
cost treatment. Also they have constructed hundreds of households
treatment units for gray water where they consisted of septic tank
followed by up flow gravel filter. The efficiency of these treatment
method reaches about 88% and irrigates home garden trees (PARC,
2005).
4. Several trials were done through different NGOs who tried to install
small size onsite, separate treatment units or plants in the villages to
reuse the gray water in agriculture like The Palestinian Hydrology
Group, the Applied Research institute in Jerusalem and the Economic
and Social Development Center of Palestine (ESDC) (PHG, 2008;
ARIJ, 2008).
5. During the early 2000 by the German economical and technical
assistance, AL-Bireh wastewater treatment plant (AWWTP )was
constructed to treat the wastewater from the area around, it operates as
a large scale extended aeration system. The major aim of AWWTP
establishment was to improve public health and protect the limited
available water resources, where the reuse of the treated effluent in
agricultural irrigation near Deir Debwan town is one component of the
treatment facility, but unfortunately the extensive high loads are
shutting this wastewater treatment plant and reduces the effluent quality
of treated wastewater from it (Al-Sa`ed et.al. , 2008).
6. Nablus western wastewater treatment plant was constructed at the
western part of the city it will serve300000 PE that covers Nablus

23
western part wastewater and the upper Ziemar Wadi concentrations
with an activated sludge system that will be constructed on 3 phases to
reach a 20/30 mg/l BOD5/TSS, it was funded throw the Germans for
treatment and reuse of the water effluent (Saleh, 2014).
After meeting with Nablus municipality and asking about the current
situation of the treatment plant they said that until the end of 2015 the
treated wastewater did not reach the effluent quality nodded for
reuse(Saleh, 2014).
2.2.3 Examples of regional experience in wastewater treatment and
reuse
The regional countries around Palestine that have the same climate,
land use, culture and industry have a larger experience regarding
wastewater treatment and reuse that may be useful to study in order to get
the best techniques and to overcome any problems that may happen. also to
learn the do's and don'ts in this new area.
Israel in the 2010 treated and reused 100% of Tel Aviva area and
80% of its total wastewater and uses this treated wastewater in agriculture.
Several degrees of treatment is used for each type of irrigation. Tertiary
treated and reused wastewater is produced in 2 main projects; first is the
Dan Region Reclamation Project which is the largest in Israel which
produces 140 million cubic meter that produces water for agricultural use
with quality of accidental drinking water, second is the Hakishon Project

24
which produces unrestricted irrigation water quality of around 35 million
m3 (Lidman, 2010).
In Jordan, which has the largest boarders with Palestine, wastewater
reuse in agriculture was practiced for a very long time but without any
restrictions. This is due to the water scarcity and salinity there. The
collection and treatment of wastewater was started at 1960 when the first
collection system and treatment plant was built at Ain Ghazal. The treated
effluent was discharged to Sell Zarqa, most of Jordan treated wastewater is
discharged to the Jordan valley where it is used for irrigation (Al-Momani,
2011).
Jordan now has around 19 wastewater treatment plants that generate
more that 80 million cubic meters of treated wastewater per year used for
restricted irrigation, since also the water pumping from springs and wells
dried up most of the streams, this treated wastewater was returned to the
streams in order to replace the flow which helped in the process of saving
the ecological balance as well as for irrigation. This volume is significant
and will play an important role in meeting future demands for water in
Jordan where it should reach 232 million cubic meters by 2020 (Hayajneh,
et.al, 2004).
One of the major wastewater treatment plants in Jordan is Khirbet
As-Samra, which started at 1985 as a stabilization pond to serve Amman,
Zarqa and Russeifa, but due to increasing loads over the years,
rehabilitation of this plant with a new mechanical treatment plant are

25
planned, this wastewater treatment plant is an amazing example of reusing
and recycling since the plant generated bioelectricity to cover it's need of
electricity and the sludge is treated so it is safe to dispose and use. As for
the plant treated wastewater effluents quality is optimized for reuse in crop
irrigation in the Wadi Dhleil area and the Jordan Valley's downstream King
Talal Reservoir (Al-Momani, 2011).
The table in appendix 1 shows most of Jordan's wastewater treatment
plant with quantities and reuse types (Al-Momani, 2011).
2.2.4 Examples of World experience in wastewater treatment and reuse
Wastewater reuse is an integral part of the national water resources
strategy in Tunisia which is one of the first countries that established and
forced a national policy for wastewater reuse in 1989 mainly for irrigation
for crops like citrus, olives, fodder and cotton as well as for golf courses
and hotel gardens. Also in the wet season except agriculture period,
groundwater recharge is carried out. Since most of the population lives in
the coastal area most of the treatment plants are there to treat wastewater
from domestic, tourism, and industrial sources. The number of treatment
plants reaches 135 in 2006 that treats 200 million m3
(GEC, UNEP. 2010).
As one of the major countries that is known of its high technology
Japan has many successful examples on reuse of treated waste water in
many sectors such as rice irrigation in Kwnamoto. Several experiments
were done before applying the treated wastewater on the rice regarding the

26
optimal percentage of mixing river water with treated wastewater and the
exact amount of fertilizers that should be applied in order to avoid any
excessive nitrogen amount problems on the rice which leads to a successful
rice cultivation with minimizing the amount of river water and fertilizers
needed. Another major example on treated wastewater reuse is in Tokyo
city as a dual distribution systems and stream augmentation is installed in
Shinjuku area and used as toilet-flushing water in 25 high-rise business
premises and for stream augmentation, the system, which has been
successfully operated since 1984, is supplying treated wastewater up to a
maximum 8,000 m3/day (GEC, UNEP.2010) and (Vigneswaran and
Sundaravadivel, 2004).
In the U.S.A, California, Washington D.C. and Florida are major
wastewater reuse states with several land mark project in this section.
As for California’s Experience it was found that in 2007 a total of
450 MGD wastewater was treated where half of it is used for agricultural
crops irrigation starting from artichokes to zucchini, a 10 year experience
in salad crops irrigation with treated wastewater was successful in terms of
marketing and public health. Castroville project is a living example on
solving both salt water intrusion and irrigation with treated wastewater in
California by replacing the ground water that was depleted by agriculture
with treated wastewater in order to reverse the salt water level and to be
used as a source for irrigating the crops on the sore (York, et al., 2010).

27
In Washington state shortage of drinking water and low stream
flows forces the authorities to consider reusing treated wastewater that
comes out from the LOTT wastewater treatment plant which covers cities
of Lacey, Olympia, Tumwater and northern Thurston County. The
treatment plant has several production line each one produces one type of
reclaimed water which are class A reclaimed water and Secondary treated
wastewater each type is used for specific purpose like infiltration to the
ground for ground water recharge and for supporting wild life in ponds and
around also for irrigating golf courses and public play grounds (McCauley
and Dennis-Perez, 2008).
Florida’s Experience started at 2006 when reuse has become very
popular in Florida. A total of 468 domestic wastewater treatment facilities
provided 663 MGD of treated wastewater for reuse which represented 58
percent of the total permitted domestic wastewater treatment plant capacity
in Florida. 83 MGD of reclaimed water was used to irrigate about 38,500
acres of agricultural land with feed and fodder crops, 13 MGD was used to
irrigate over 14,000 acres of edible crops like citrus, cabbage, cucumbers,
figs, grapes, herbs, peas, pecans, peppers, persimmons, strawberries, and
tomatoes. One of the major wastewater reuse project is the Water
Conserv2. The project distribution center is located west of Orlando,
provides irrigation for over 3,200 acres of agricultural crops also used to
irrigate several golf courses, landscape nurseries, and numerous residential
properties and it provides some freeze protection for citrus and eliminates
the installation, operation, and maintenance costs for irrigation pumping

28
systems. Excess reclaimed water is used to recharge the area’s ground
water using an extensive network of rapid infiltration basins (York, etc,
2010) .
Australia is know of its recreational areas and tourism. One of the
amazing examples on treated wastewater reuse is the Mount Buller Alpine
Resort, which is located 200km north east of Melbourne. This resort uses
it's treated wastewater to create snow under the US EPA’s standards for
unrestricted recreational use which bring an enormous benefits to the resort
over the years (GEC, UNEP.2010).
2.3 Barriers against wastewater reuse sector
Wastewater reuse sector is like any other new sector needs good
construction, management and monitoring in order to succeed and to
overcome any barrier that may be faced. For any sector several component
should be present in it; institutions, policy and regulatory framework,
human resources, economics and participation of the public, and if any one
of those is not available or properly managed the sector will suffer (GEC
and UNEP, 2010).
Several barriers may be faced at the beginning of any sector, these
barriers may be classified according to their relation with the main
components of the sector. Some examples From the small experience of the
Palestinian wastewater reuse sector is presented with each barrier:

29
I. Institutional barriers
Several institutions have a major role in the wastewater reuse sector;
private users that implement the initiative, the environmental quality
authority, the Palestinian water Authority, the universities and the research
institutes. Each one of those has its role in the management and
development of the sector but the increasingly large number of institutions
with no framework or coordination between them in order to identify the
responsibilities, may lead to overlapping of responsibilities or negligence
of responsibilities which is a serious barrier to be faced (Zimmo and Petta,
2005).
PWA has started to identify an institutional framework that will
define each party responsibility in this sector which will be considered as a
solution for this barrier (PWA, 2012b).
II. Policy and regulatory frame work barriers
The foundation rock for any sector is lows and regulations and in the
wastewater reuse sector these lows are necessary to ensure the protection of
human health and the environment as permits, quality standards, reuse
limitations and mechanisms for enforcing the lows, the situation in
Palestine is that there is a draft for the standards of treatment and reuse of
treated wastewater but no mechanism for enforcement is available which
may lead to serious health and risk problems (Mogheir, et.al, 2005).

30
III. Human resources barriers
Technical and managerial human resources are essential to assess,
design, operate and develop any wastewater treatment or reuse project
which may be accomplished by training or educating an existing employee
to reach the needed level of experience or by hiring or retention of new
experienced employee whom do have the needed experience. In Palestine
PWA using Funds from the Austrian project have trained and educated
several employees and non-employed researchers in order to establish a
well educated and experienced experts in all areas related to wastewater
treatment and reuse this will enhance the wastewater sector (PWA, 2012b).
IV. Economical barriers
Economical condition play a huge role in the finance of the
wastewater treatment and reuse sector starting by constructing the
collection line down to the treatment plants and infrastructure for reuse
project, without forgetting the operating costs for them. All of these cost
make a huge burden on the PWA and the municipalities or the research
centers. This barrier is considered a major one since most of the wastewater
projects are designed but still waiting for fund or if funded the operating
costs can't be covered (PWA, 2009).
Several external funds from outside Palestine helped in constructing
several wastewater treatment and reuse project but unless the public served
by their services pays his share the sector will stay under the donor mercy
for fund (GCG. et al. 2012).

31
This situation leads to the economical barriers of people not
accepting to pay for the service or the treated wastewater as a new water
source for non potable uses, examples and demonstration related to the
public economical barriers will be discussed with the next barrier.
Several solutions may be found to this barrier as the case of Israel
wastewater and treatment sector. Several studies were conducted for
encouraging farmers to use this water as increasing the cost of fresh water
to be higher than the treated wastewater (PWA,2013)
This barrier will be further studied in this research using the VCA as
an economical analysis and assessment tool using field data from meeting
and questionnaires.
V. Participation of the public barriers:
As any third part of an equation the public whom are the receptors
plays a huge role in the success and failure of the wastewater treatment and
reuse sector. the economic side of the willingness to pay for the treatment
and the non-direct reuse was discussed earlier, but the acceptance of the
entire sector and the services provided is another issue (GEC and UNEP,
2010).
Treating the public as a decision-maker will make them more
committed to the new sector, this can be done using public awareness
campaigns that will enrich the societies knowledge and vision in this sector
(GEC and UNEP, 2010).

32
The willingness to pay for products cultivated or produced by this
water is governed by various psychological, cultural, religious, educational,
Trust and demographical factors. Neglecting them will for sure destroy the
sector (Zimmo and Petta, 2005).
Several studies were done in that area usually before constructing a
wastewater plant or a reuse scheme but very little of these projects were
functioning efficiently in the reuse part when applied on the public, so an
extensive research should be done. Here is some studies results that some
of them succeeded and some did not in Palestine.
As a start the trust barrier between the public and the provider of the
treated wastewater or the farmers make a huge difference toward the
acceptance of this sector. The success of a wastewater re-use project
depends on the strong commitment of the wastewater treatment institutions
to achieve consistent operational performance at all times in order to gain
the trust of the public about the quality of the treated wastewater and it's
reuse products (Murni Po, et.al, 2003).
As for the religious barrier, in 1979 the Islamic Council of Research
and Consultation issued a fatwa said that treated wastewater could be used
for all purposes as long as it meets standards of health, but never the less
the public still not convinced of that and having a second thought on it
(Saleh , 2009).
Several studies were done on the public perception toward the
reclaimed wastewater reuse using questionnaire forms for both farmers and

33
consumers in Palestine. Most of them gives the results that it is ok for
farmers to use this reclaimed wastewater and that they may change their
crop pattern too ranging it's cost in Hebron from 4-5Nis/m3. 0.5$/m3 in
Tubas is the cost of treated wastewater that the farmers are willing to pay,
these studies also shows that the consumer with the right knowledge would
use the products irrigated with treated wastewater ( PHG, 2008; Al-Zeer
and Al-Khatib, 2008; Saleh, 2009).
A study were conducted on the whole West Bank showed that there
is social, cultural and religious acceptability from the people to use
reclaimed wastewater in fodder crops but these factors have a negative
effect when less knowledge is available. The study also showed a very low
public awareness in the topics of treatment and reuse of wastewater (Al-
Kharouf, 2003).
EMWATER project -Efficient Management of Wastewater, its
Treatment and Reuse between Turkey, Jordan, Lebanon and Palestine-
results of the questionnaire distributed over a small scale community
regarding buying agricultural crops irrigated by reclaimed wastewater
indicated that most of the participants were willing to buy these products if
hygienically hazardous free. Corotech project that was done in Birzeit,
Jaffna, Ein Sinya and Jalazoun camp in 2002 showed that people do not
accept to pay for on-site sanitation or handling their own wastewater. They
also reject the idea of reusing wastewater even in agriculture, which is
contradicting (Zimmo & Petta , 2005).

34
A study was conducted in tubas using questionnaires found that
people supports reuse in theory but when it came to reality they refuse to
use the products of the reused treated wastewater. Another questionnaire
study was conducted in one of Ramallah villages -Deir Debwan- lead to
that the public has a high level of knowledge regarding the water
deficiency in Palestine and that people are willing to use treated wastewater
only if it is theirs (Abu Madi, 2007).
In a research done in Dura ,Hebron people were against buying fruits
that are irrigated with treated wastewater and the small amount of people
who accepted said that these fruits should be sold with half the price of the
fresh water irrigated fruits so the economical factor is obvious (Isaed,
2007).
As it is noticed each research has its own results that doesn't agree on
one opinion, so these barriers will be further researched in this research
using questionnaires and field visits.
2.4 Economical Concepts
In order to prepare for the economical barriers analysis several
economic and engineering methods and principle may be used for the
assessment and modification of a service or process that may range from
simple to sophisticated levels. The choice of using such methods depends
on the objective and scope of the work, and since each method has its own
approach and focus, the choice to be made according to how close the tools
and the project approach to satisfy the objective.
35
Different methods were studied in order to determine the most
suitable ones to satisfy the objectives of this research. These methods are:
multi-criteria decision analysis, value engineering, business process re-
engineering, and value chain analysis,.
2.4.1 General review of different methodsMulti-Criteria Decision
Analysis MCDA is defined as "an approach and a set of techniques,
with the goal of providing an overall ordering of options, from the
most preferred to the least preferred option. The options may differ in
the extent to which they achieve several objectives, and no one option
will be obviously best in achieving all objectives"(DCLG :London,
2009). It is easily used for solving problems have alternatives to
choose from, it is also logical and consistent. On the other hand this
method depends on human perception in order to rank the alternatives
which makes it weak, and since this Research doesn't have alternatives
it will not be suitable for use (DCLG :London, 2009).
II. Value engineering can be identified as "the systematic application of
recognized techniques by multi-disciplined team(s) that identifies the
function of a product or service; establishes a worth for that function;
generates alternatives through the use of creative thinking; and
provides the needed functions, reliably, at the lowest overall
cost"(WVDOH, 2004). value engineering uses cost reduction as a
major goal which is not applicable this research and it is mainly used

36
for a product either in the private or public sector but not a service and
may only be used in the designing phase (WVDOH, 2004).
III. Value Chain Analysis is a method of customer driven base that
ranges from simplicity at its qualitative procedure to sophistication at
its qualitative procedure, it takes data from both the field and the
science to evaluate an existing procedure or product and takes into
account both the horizontal and vertical dimensions of any process. It
can be used in the design or running phase of a project, but on the
other hand it addresses only physical aspects in the process which is
not enough in this research (Kaplinsky and Morris, 2000; Brown,
2009).
IV. Business Process Re-engineering is a method of an owner driven
base that describes the present and propose the future of all aspect of a
project or a structure including; physical, technical and personal
components. It has different methodologies each one serve a type of
construction or product according to the intended objective but it also
need an assessment tool to identify the value of any component thus
using it alone will not be enough (Muthu, et.al, 1999; Simon, 1994).
As a result and after reviewing the different methods it was found
that coupling between BPR and VCA would be the best tool since the
coupling will construct a tool that is both owner and customer driven with
data from the field, the scientist and experts. Also it will cover all the

37
physical, technical and personal side of the company and the product or
service delivered.
2.4.2 Value Chain Analysis (VCA)
Due to the increasing competitiveness in the last century all the
business owners started to look for a way to insure the sustainability of
their business and profits. They started to develop business concepts for
this reason. Value chain analysis is one of these concepts that can be
described as a holistic approach that describes the dynamic markets of a
product or a service, the inter relations between the activities, horizontal
and vertical linkages and finally policy formulation and implementation
(Kaplinsky and Morris, 2000).
The concept of value chain analysis descends from two original
concepts: the French ‘filière concept’ 1960s –analytical tool for empirical
agricultural research-and the concept of commodity chain 1970s-an
elaboration of the dependency theory-, these two emerges into Porter value
chain analysis and consequently to the global commodity chain and the
world economic triangle. Value chain concept -as it is known -was first
introduced by Michael Porter in1985 as a business concept that tries to
verify the values of the activities in any project. Such values then may be
used in process reengineering or any other development method. (Porter,
1985; Rowe, et al., 1994)
Value chain is defined as "the full range of activities which are
required to bring a product or service from conception, through the

different phases of production
transformation and the input of various producer services), delivery to final
consumers, and final disposal after use "(Kaplinsky and Morris,
A value of an activity is identifi
value between the income product and outcome product in an activity or
process. The value chain divides the activities in a project into primary and
supporting activities as in the figure
Figure (2.3): Portar's model of value chain (Porter,
There is a debate around whether VCA is a heuristic device or an
analytical tool, but it may be considered as both; as a heuristic device in its
simple form as Porter defined it and analytical tool as developed later
(Kaplinsky and Morris,
38
different phases of production (involving a combination of physical
transformation and the input of various producer services), delivery to final
consumers, and final disposal after use "(Kaplinsky and Morris,
A value of an activity is identified in economics as the difference
value between the income product and outcome product in an activity or
process. The value chain divides the activities in a project into primary and
supporting activities as in the figure 2.3 (Porter, 1985; Rowe, et.al
model of value chain (Porter, 1985)
There is a debate around whether VCA is a heuristic device or an
analytical tool, but it may be considered as both; as a heuristic device in its
simple form as Porter defined it and analytical tool as developed later
plinsky and Morris, 2000; Brown, 2009).
(involving a combination of physical
transformation and the input of various producer services), delivery to final
consumers, and final disposal after use "(Kaplinsky and Morris, 2000).
ed in economics as the difference in
value between the income product and outcome product in an activity or
process. The value chain divides the activities in a project into primary and
et.al, 1994).
There is a debate around whether VCA is a heuristic device or an
analytical tool, but it may be considered as both; as a heuristic device in its
simple form as Porter defined it and analytical tool as developed later

39
Value chain analysis is still in its initial steps regarding the
environmental issues, so concepts and methodologies of green value chain
or environmental value chain as may be called is still vague with no exact
framework or methodologies.
Value chain analysis is a method that has two types; one depends on
the end market -buyer driven chains- and chain analysis in order to get the
value of the several activities in any project and then analyze it. This
method is basically a public perception idea that makes the end market
decides the critical issues and values, the other one depends on the
producer's technologies -producers driven chains-. (Kaplinsky and Morris,
2000; Brown, 2009).
Several scientist presented the methodology of the VCA, most of
them presented all the possible and ever used ways for analysis but
declared that these ways were mentioned for the researcher to pick the best
and sufficient way for analysis according to the type of product,
organization or service to be analyzed. The major steps in VCA are; value
chain identification, value chain mapping, analysis and vetting (Kaplinsky
and Morris, 2000).
2.4.3 Business Process re-engineering (BPR)
Business process re-engineering can be found under different names
where all give the same meaning. These names includes but not limited to;
Reengineering, Process Reengineering, Process Change Management,

40
Business Process Re-design, Business Process Improvement, Business
Reengineering, Business Process Engineering and Business
Transformation (Simon, 1994).
The different phrases that represents BPR shows that the history of
BPR started early in the 1800's, at the time the management theories started
to develop different researches tried to identify and develop the concept of
BPR. Michael Hammer (1990) simply claimed that most of the work done
in a production process doesn't add any value relating to the customers, so
these processes should be eliminated which is the basic concept of BPR
(Muthu et. al., 1999).
BPR according to Hammer and Champy (1993) is identified as "
business process re-engineering is "the fundamental rethinking and radical
redesign of business processes to achieve dramatic improvements in
critical, contemporary measures of performance, such as cost, quality,
service and speed", according to Davenport(1993)" Encompasses the
envisioning of new work strategies, the actual process design activity, and
the implementation of the change in all its complex technological, human,
and organizational dimensions", and according to Teng et al. (1994) " The
critical analysis and radical redesign of existing business processes to
achieve breakthrough improvements in performance measures".
The concept of re-engineering was first applied only on processes
but later expanded to organizations and any other foundations. BPR is used
under the concept of top-down research that means that the analysis starts

from the management at the top to the smallest process or employer at the
bottom (Muthu et. al., 1999
Considering BPR as an efficient tool came from the understanding
that it combines both theories and concept of any organization which
includes; organizational theory, marketing (competitiveness and driving
forces) and informatics. The idea of BP
are 4 dimensions; technology, strategy, people and processes to be studied
according to Leavitt's diamond ( figure
management, operation and supporting processes. These processes are
groups of linked activities that give any product its value that is the key
point in BPR (Simon, 1994
Figure (2.4): The four dimensions of an organization (Leavitt's diamond)1994).
Several methodologies was set for the BPR (Table
serves a type of organization or process but they all share the same concept
41
from the management at the top to the smallest process or employer at the
1999).
Considering BPR as an efficient tool came from the understanding
that it combines both theories and concept of any organization which
includes; organizational theory, marketing (competitiveness and driving
forces) and informatics. The idea of BPR is that for any organization there
dimensions; technology, strategy, people and processes to be studied
according to Leavitt's diamond ( figure 2.4), and three types of process;
management, operation and supporting processes. These processes are
groups of linked activities that give any product its value that is the key
1994).
: The four dimensions of an organization (Leavitt's diamond)
Several methodologies was set for the BPR (Table 2.4
serves a type of organization or process but they all share the same concept
from the management at the top to the smallest process or employer at the
Considering BPR as an efficient tool came from the understanding
that it combines both theories and concept of any organization which
includes; organizational theory, marketing (competitiveness and driving
R is that for any organization there
dimensions; technology, strategy, people and processes to be studied-
, and three types of process;
management, operation and supporting processes. These processes are
groups of linked activities that give any product its value that is the key
: The four dimensions of an organization (Leavitt's diamond) (Simon,
2.4), each one
serves a type of organization or process but they all share the same concept

42
which is to re think the process under consideration in order to find better
ones with higher values. Higher values process is found by value chain
analysis, that best suits the objective of the organization. These methods
mainly includes; identifying the objective, mapping and strategy definition,
analysis of the existing situation, re-engineering and implementation, and
monitoring (Muthu, et.al, 1999; Simon, 1994).

43
Ta
ble
(2.4
): M
eth
od
olo
gie
s of
BP
R
(Mu
thu
, et.al,
19
99)
(PR
LC
: P
roce
ss R
een
gin
eeri
ng L
ife
Cycl
e)
met
hodo
logy
no.
12
34
activ
ity n
o. 1D
evel
op v
isio
n &
stra
tegy
Det
erm
ine
Cus
tom
er R
equi
rem
ents
&G
oals
for t
he P
roce
ssSe
t Dire
ctio
nM
otiva
ting
Ree
ngin
eerin
g
2C
reat
e de
sire
d cu
lture
Map
and
Mea
sure
the
Exis
ting
Proc
ess
Base
line
and
Benc
hmar
k Ju
stify
ing
Ree
ngin
eerin
g
3In
tegr
ate
& Im
prov
e en
terp
rise
Anal
yze
and
Mod
ify E
xistin
g Pr
oces
sC
reat
e th
e Vi
sion
Pl
anni
ng R
eeng
inee
ring
4D
evel
op te
chno
logy
sol
utio
nsD
esig
n a
Ree
ngin
eere
d Pr
oces
s:La
unch
Pro
blem
Sol
ving
Proj
ects
Se
tting
up
for R
eeng
inee
ring
5Im
plem
ent t
he R
eeng
inee
red
Proc
ess
Des
ign
Impr
ovem
ents
As
Is D
escr
iptio
n &
Anal
ysis
6Im
plem
ent C
hang
e T
o-Be
Des
ign
and
Valid
atio
n
7Em
bed
Con
tinuo
us Im
prov
emen
t Im
plem
enta
tion
met
hodo
logy
no.
5co
nsol
idat
edPR
LCac
tivity
no. 1
Prep
arat
ion
Prep
are
for B
PREn
visio
ning
new
pro
cess
es
2Id
entif
icat
ion
Map
& A
nalyz
e As
-Is P
roce
ssIn
itiatin
g ch
ange
3Vi
sion
Des
ign
To-B
e Pr
oces
ses
Proc
ess
diag
nosi
s
4 T
echn
ical
& S
ocia
l des
ign
Impl
emen
t Ree
ngin
eere
d pr
oces
ses
Proc
ess
rede
sign
5 T
rans
form
atio
nIm
prov
e C
ontin
uous
lyR
econ
stru
ctio
n
6Pr
oces
s m
onito
ring

44
Several factors may affect the success and failure of PBR. Failure
may occur manly from the resist of change from the most benefit parts of
the reengineering, mainly the loss of power and control from some
management levels to others. Another reason for failure is the long time for
change to happen which will reduce the enthusiasm in the owners and
workers of the organization and expand the disturbance period until the full
change occur. On the other hand a well chosen reengineering team is the
first step in a successful PBR. Also an accepting staff of the organization is
a very important point in this change with an open mind for any new
changes and arrangements. A well designed and proven methodology will
ease the work and reduces the time and sudden problems in BPR process
which will lead to a successful PBR (Magutu. Et. al , 2009).
2.4.4 Application of BPR and VCA and coupling experience
Several researchers and companies applied the BPR and the VCA
separately. Most of the work was done on industries, agricultural products
and public services to add values for products using VCA or to re-arrange
and develop factories and businesses using BPR, Both of them started to
get very popular due to globalization and the increasing competitions in the
products and services which make the suppliers and owners want to
upgrade their work (Simon, 1994).
VCA can be applied to all of the service and production sectors as
shown from the experience all around the world mainly in industries. One
example is the use of VCA in agro-processing industries in India were they
45
used questionnaires collected from the factories in one district to find the
value adding process in the line of agro-processing in those factories.
Several recommendations resulted about the policy thrust and developing
row materials as it is the most value adding point for these industries
(Sharma et al., 2010).
Another application is in environmental management in urban Areas.
Environmental management had so many factors that is affected by any
decision specially in urban areas where the cost of land and services may
take the higher importance in that decision. The wide range of factors
requires a strategic approach, relevant to the sustainable development
principles along with the complex analysis of such a field required a
holistic approach to be used which VCA can provide. The methodology
was based on Applying several indexes for main environmental factors that
may be affected by any decision which lead to the value of each action and
by that the basic needs for any decision under the environmental
management (Karbownik et.al, 2011).
BPR is used in business development as general mainly in large
industries and companies when simple method are not enough, An example
of using BPR in major companies is the experience of General Motors in
the implementation of re-engineering to find a 3 year plan to consolidate
their multiple desktop systems into one and saving 5% on hardware and
60% on software license, and 25%on support cost (Sharma et al., 2010).

46
BPR and VCA are lately introduced for the public services and
governmental sectors manly for poverty reduction and cost minimization,
as an example is the use of VCA in Latin America for poverty reduction
due to the change in trading regime. The conclusion was some lessons on
using value chain analysis as a tool to augment the income of people in
rural areas. Value chain analysis chosen because it is the best economic
method for identifying the barriers as it takes all the sides of the problem
and uses no assumptions, just real data from questionnaires. (Mitchell et.al,
2009)
Coupling between BPR and VCA is familiar in the world. Most of
the experiences were in re-engineering the value chain of an industry, one
of the examples is Reengineering the Broadcasting Value Chain; this
industry is rapidly spreading and several broadcasting companies arises in
short time which rises the competitiveness to the max, so value chain
analysis was used to find the chain of this industry and then re-engineered
to transform it so that broadcasters remain competitive (TATA, 2010).
Most of the experience in VCA and BPR coupling regarding
wastewater comes from using it to re-engineer wastewater treatment plant
chains as an industry taking into account the efficiency as any other
industry, but one of the rare experiences for using the coupling from an
environmental side of view is using the value chain model as a method of
prioritizing green re-engineering efforts in the companies. In the 21 century
the environmental effect is the driving force of the end markets; a new

47
method of prioritizing process changes, using a synthesis of Business
Process Reengineering, Total Quality Management and Value Chain
analysis. That is called framework of Green Reengineering, value chain
analysis is first introduced to identify the chain of a company and the
processes in it and then determining the value of each process, after that the
value added processes are kept and the non value adding process are
eliminated or re-engineered under the business process re-engineering
methodology. (Schatzberg and Kumar, 2000)

48
Chapter Three
Methodology and Data preparation
49
Chapter Three
Methodology and Data preparation
Three objective should be achieved in this research, So a systematic
plan of eleven steps was planed and accomplished in order to cover these
objective where each one may be served by one or more steps.
The next sections describes in details the eleven steps of the
methodology that covers the objectives.
3.1 Methodology
In order to identify the main barriers against reclaimed wastewater in
Palestine and for the assessment of the reclaimed wastewater reuse
potential in Palestine, a general study of the Palestinian situation regarding
water and wastewater sectors was conducted. Also a literature review was
briefed for previous work and experience in wastewater reuse in Palestine,
neighboring countries and around the world.
3.1.1 Economics concepts and tool choice
In order to assess the reclaimed wastewater reuse potential in
Palestine a tool should be used. This tool is to assess the current situation
and any possible future scenarios. A brief study regarding the economics
concepts and tools that were used or might have been used for this type of
public service sector assessment was done. BPR coupled with VCA was
found to be the best economic concept that may deliver the objective of the
research.

50
Applying BPR and VCA may be done manually using the analytical
procedures or using software programs that process the data and give a
direct answer with identifying the problem and some solutions. Several
softwares are available in the market, each one uses a different method for
analysis, they ranges in its function from simple data analyzer for
questionnaires to full mapping, analyzing, problem founding and solving
software.
The choice of these software programs was based on that they serve
the objective and extent of the research VCA tool 3.1 (FAO) was selected
for the VCA and BPR was done manually.
VCA TOOL 3.1 (FAO) is "a software for carrying out Value-Chain
Analyses for agricultural and rural development policies. By storing
relevant data it can calculate flows of physical outputs and inputs, flows of
aggregated costs, value-added and net benefits. In addition, it allows users
to directly compare different hypothetical scenarios." (FAO, 2012)
3.1.2 The study area selection
A Case study of Nablus Governorate was chosen for assessing the
barriers and collecting the data since Nablus Governorate is one of the
largest districts in Palestine in respect to population, economic and
industrial activity. It has the largest number of treated wastewater plants in
the city and the villages around and it also contains industrial, agricultural
and urban potential uses of reclaimed treated wastewater.

51
Nablus Governorate is located in the north of the West Bank, 69
kilometers far from Jerusalem. It is bounded by Tulkarm and Qalqilya in
the west, Jenin and Nazareth in the north, and Jerusalem in the south. The
population in Nablus governorate totaled 336,380 in 2007 that includes
164,116in the city, 35,387 in 3 Refugee camps and 166,877 in 57 Villages.
(PCBS, 2010)
The agricultural sector in Nablus is growing bigger and bigger
through the years since Nablus have a natural diversity in soil and climate
due to the large extend of here lands from the mountains in the north to the
Jordan river. It covers 605 km2 from which 128.2 km2 are planted (PCBS,
2012).
Nablus is famous for its olives production where it produces around
25% of the West Bank olives, it is also known for figs, almonds, apricots,
pomegranates. It also produces orange, lemon and Clementine beside other
different types of ground vegetables of egg plant, potatoes and zucchini.
The table below shows the areas of agricultural land in Nablus Governorate
(NEOCT, 2011).
Table 3.1:the maximum and minimum cost for most of Nablus
governorate agricultural products. The data in table 3.1 was obtained throw
meetings with the MOA in Nablus in a meeting with Mr. Iyad Bitar, and
from the central market of fruit manager in Nablus Municipality Mr. Ali
Toqan.

52
Ta
ble
(3.1
): M
ax
imu
m a
nd
min
imu
m c
ost
for
mo
st o
f N
ab
lus
gov
ern
ora
te a
gri
cult
ura
l p
rod
uct
s.
Per
I d
un
um
s P
rod
uct
ivit
y N
IS
No
Pro
duct
W
ater
F
erti
lize
rs
seed
s or
pla
nts
am
ount
cost
in o
ne
yea
r
m3
in k
g w
ith
wat
er
in k
g w
ith
WW
no.
cost
tota
l N
IS
ton
max
m
indom
inan
t
1
Tom
atoes
400
150
60
1000
700
4
2
0.5
0.8
2
Cucu
mber
(nat
ura
l)
450
220
73.3
1200
800
4
5
2
2.2
3
Cucu
mber
(gre
en h
ouse
) 500
300
100
2000
1400
10
3
0.5
1
4
Egg p
lant
400
150
50
1200
600
4
4
0.5
1
5
Zucc
hin
i 350
120
40
1200
150
3
7
1.5
2
6
Cab
bag
e 250
100
33.3
2000
140
4
4
0.5
2
7
Bea
ns
300
80
26
2000
150
0.9
12
1
3
8
Span
ish
200
50
16.6
2000
100
0.8
8
0.7
1
9
Pota
to
500
250
83.3
150kg
750
4
5
2
2
10
Ora
nge
1200
210
70
40
400
3.5
5
1
2
11
Pea
ch
400
60
20
40
1200
3
7
3
2
12
Plu
m
400
60
20
40
1600
3
7.5
3
2
13
Nec
tari
ne
400
60
20
40
1600
3
6
2
2
14
Lem
on
400
210
70
40
400
5
9
2
2
15
Par
sley
(bag
) 300
50
16.6
5000
100
1
15
6
8
16
Min
t(bag
) 300
50
16.6
5000
100
1
14
7
8
17
Alm
ond
400
60
20
40
2000
4
5
5
5
18
Fig
250
20
7
40
160
0.8
3
3
3
19
Oli
ves
100
40
14
40
240
0.1
3
3
3

53
∗ aver. cost of 1 kg of different types of fertilizers =6 NIS
∗ cost of I dunums agricultural land= 8000 JD
∗ cost of I cubic meter of agricultural water from municipality= 2NIS
from agricultural wells =0.5 NIS
∗ each dunums needs 1 liter of pesticides costs= 400 NIS
∗ each dunums needs I man as labor for the whole year with 60 NIS/day
cost
Nablus occupies an important position in Palestinian industry. It has a
large variety of industries like manufacturing, food industry, furniture,
printing, textiles. The number of each type in shown in table 3.2, this table
was a result of meeting with the Chamber of trading and Commerce in
Nablus.
Table (3.2): Industries amount in Nablus
Type of industry Number of industries Food industry and packaging 167
Iron shaping 119
Aluminum shaping 63
Rocks and construction materials 100
Wood 204
Plastic and naillon 27
Fabrics and clothing 312
Paper and advertising 43
Soap, detergents, chemicals and cosmetics 27
Shoes and bags and leather 45
Jewelry shaping 64
Teeth laboratory 3
Glass and mirrors 8

54
These industries use fresh water from the domestic water share.
Table3.3 gives an indication about a few industries and thier water
consumption in Nablus Governarate (food industries are not listed). This
table is one of the results of the industrial questionnaire collesction.
Table (3.3): Some of the industries water consumption in Nablus Governarate
Type of industry
Size Description of
water use Amount m3/d
Stone cutting for marble
4 employees Colling 6.5 reused for 10 d
Stone cutting for marble
6 Colling 1.6 reused for 15 d
Concrete 15 Mixing 16
Concrete 25 Mixing and
colling 50
Printer 120 Cleaning 6-8
Clothes 10 Washing 30
Clothes 140 Washing 120-180
Painting 47 Washing and
mixing 1
Detergant 35 In the mix 10
Detergent 35 In mixing 15
Furniture 17 Cooling and
cleaning 1
Metal 20 Cooling and
cleaning 1
Nablus governorate uses 18 MCM for domestic purposes. The
average daily consumption per capita is 64 l. there is a deficit of about 7
MCM/yr in this governorate plus a 30% losses in the networks this makes
the available water very valuable and needs to be saved for only domestic
use. Table 3.4:the sources of water in Nablus governorate, (PWA, 2012a).
And Table 3.5: the water cost in Nablus governorate according to type of
use and quantity. (GIZ, 2012)

55
Table (3.4): The sources of water in Nablus governorate
Local Resources 14.31 (MCM)
Purchased Water
3.637 (MCM)
Municipal wells 6.55
Springs 6.135
JWU 0
PWA 0.771
Agricultural 0.853
Table (3.5): The water cost in Nablus municipality according to type of use and quantity.
Qu
an
tity
in
M
3
dom
esti
c
Co
mm
erci
al
Ag
ricu
ltu
ral
ma
ll
Fo
od
in
du
stri
es
Oth
er
ind
ust
ries
con
stru
ctio
ns
Pa
ckag
e b
uy
er
Up to5 3.98 6 4.69 6.5 6 6 9.92 2.8
6-10 3.98 6.5 6.55 6.5 6 6 9.92 2.8
11-15 6.7 8 6.55 6.5 6 8
16-30 8.7 10 8 10
More than30
11.5 11.5 8 12
About 95% of Nablus city is connected to the sewer system that
reaches about 150 km length, it goes either to wadi Al-Zemar at the west or
Al-Sajour at the east. Most of the villages around Nablus are either started
to construct a sewerage network or they still don't have one. the houses that
are not connected to the sewerage network dispose there wastewater in
cesspits or cesspools.(GCG, et al.2012).
One wastewater treatment plant was constructed at the western part
of the city it will serve300000 PE with an activated sludge system that will
be constructed on 3 phases to reach a 20/30 mg/l BOD5/TSS. (GCG, et
al.2012).

56
The eastern wastewater treatment plant was designed and funded and
waiting to start the construction, it will serve 200000 PE with a combined
technology of pre-anoxic treatment for (BOD, COD) followed by a
trickling filter for nitrification that will be constructed on 2 phases to reach
20/30 BOD5/TSS/N and 10/10/25 at the final stage. Several small treatment
units were installed in the villages by several NGOs to treat the wastewater
and reuse it in the neighboring areas. (GCG, et al., 2012)
3.1.3 Coupling between BPR &VCA methodology and application
The coupling tool consist of BPR as the major tool with VCA as the
assessment tool inside the BPR, both BPR and VCA have different
methodologies according to the targeted project but their main
methodology stays the same (Table 3.6).
Table (3.6): Methodologies of BPR and VCA
Methodology of BPR Methodology of VCA Preparing and data collection Value chain identification
Mapping and analysis of as is process Value chain mapping
Design and implement to be process Analysis
Monitoring & improving continuously Vetting
The new methodology for them that will help in the assessment of
the sector and the reengineering of it is as follows:
I. Prepare for BPR and Data collection: which includes field studies to
collect data by; meetings, questionnaires, field visits and workshops.
This step helps in the identification of the real barriers against the
reclaimed wastewater reuse in Palestine.

57
II. Map and Analyze As-Is Process using VCA- modeling and analysis of
the water-wastewater-reuse cycle- which include the following steps:
i. Value chain identification: to identify the basic stages of water-
wastewater cycle.
ii. Value chain mapping: to draw the water-wastewater-reuse cycle with
all attached activities
iii. Analysis :to find the added value activities of all the water-
wastewater cycle activities using FAO's VCA 3.1 tool
iv. Vetting the results as the final results of the assessment of the current
reclaimed wastewater reuse sector.
III. Design To-Be Processes (mitigation and solution for the problem) in
order to Re-engineer the reclaimed wastewater reuse sector: where the
modification on the water-wastewater-reuse cycle was done according
to the VCA vetting using Business Process Re-engineering and results
in the final model of the wastewater reuse sector.
IV. Monitor and improve continuously: by preparing a base line plan for
monitoring and mitigation and regulations.
3.2 Meeting preparation and data collection
The meetings was held mainly with PWA, Nablus Municipality,
Nablus Chamber of Industry and Commerce, Ministry of Agriculture,
Ministry of Environmental Affairs, non-governmental organizations that

58
are relative to the topic like PHG and others, These meetings was
conducted in order to discus operational, institutional, legal and economic
issues regarding the reclaimed wastewater reuse.
3.3 Questionnaire preparation and collection
Questionnaires are a systematic tool for collecting quantitative result
for an issue from an interested population by considering a representative
sample with a certain degree of error. In order to conduct a questionnaire
census several steps should be done; Clarify purpose, Decide on Methods,
Write Questionnaire, Prepare Sample, Pilot test/Revise questionnaire,
Collect the data, Analysis and results (THCU, 1999).
First: Clarify the purpose:
The purpose of this study is to collect data about the public
acceptability and willingness to buy products that reclaimed wastewater
was a part of its processing. Also to define the key element in that
acceptability and the factors that would eliminate any barriers against such
products.
And in order to cover all the sides of such acceptability all the
interested categories of the public that handling these products should be
under study whom are:
1- End users: buyers of both industrial and agricultural products.
2- Second users: Sellers or the owner of agricultural markets (including
car sellers and carriages) or industrial product stores.
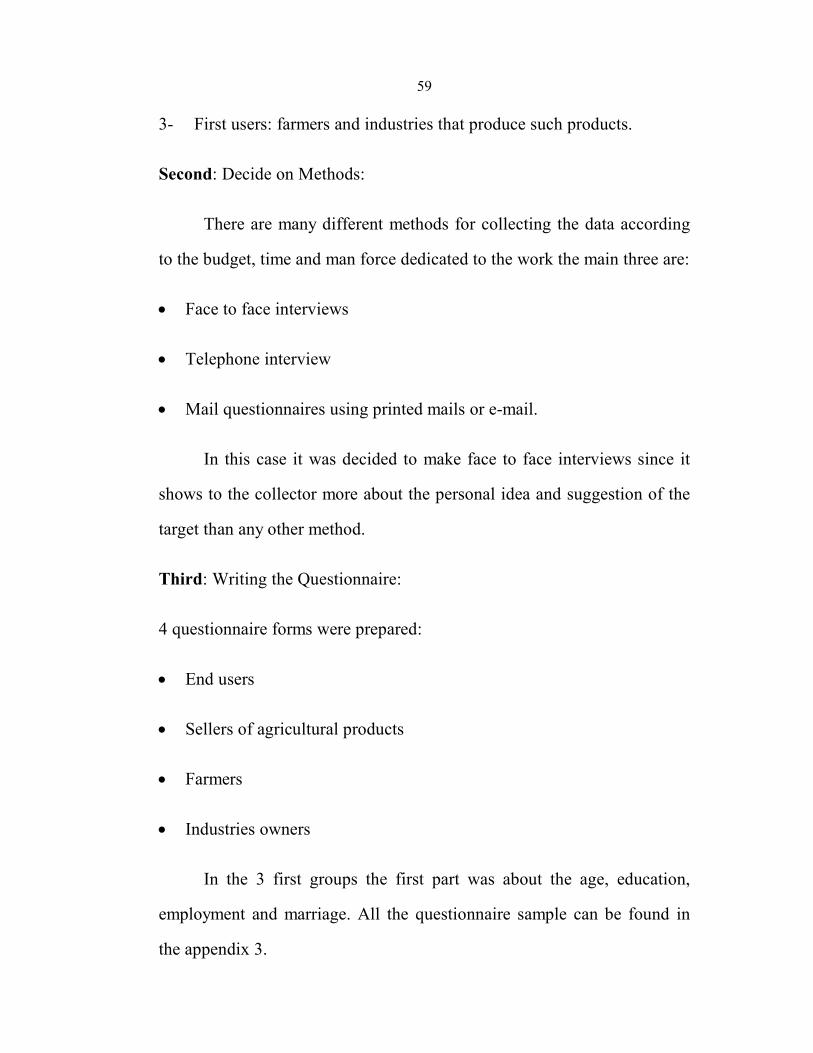
59
3- First users: farmers and industries that produce such products.
Second: Decide on Methods:
There are many different methods for collecting the data according
to the budget, time and man force dedicated to the work the main three are:
• Face to face interviews
• Telephone interview
• Mail questionnaires using printed mails or e-mail.
In this case it was decided to make face to face interviews since it
shows to the collector more about the personal idea and suggestion of the
target than any other method.
Third: Writing the Questionnaire:
4 questionnaire forms were prepared:
• End users
• Sellers of agricultural products
• Farmers
• Industries owners
In the 3 first groups the first part was about the age, education,
employment and marriage. All the questionnaire sample can be found in
the appendix 3.

60
Each group questions was different from the other. For the end users
the questions was about the regulatory of eating fruits and vegetables and
the method of cleaning them , also the place they buy them from and their
cost, and if the end users ask about their origin. Another idea is whether the
buyers know about any products that are watered buy treated and untreated
wastewater and their willingness to buy it.
As for the sellers, the questions was about the origin of their fruits
and vegetables and whether they know if there is any crops irrigated buy
treated or untreated wastewater and how much the cost is important in
respect to the quality and the amount of selling.
As for the farmers, the questions was about the quality of water they
use, the cost of it, what is the potential cost of reclaimed wastewater they
are willing to pay and the cost of the crops if they are irrigated with treated
wastewater. Several other questions was about using fertilizers and types of
crops they are planting and the method of irrigation and selling them.
For the industries owners, questions was about the size and
production of their industry and the quantities of water they use and in
which phases also their acceptability toward using treated wastewater in
their industries.
Fourth: Prepare Sample
• End users
The number of questionnaires that should be collected was calculated
by 2 ways; first 2 online calculators, second a statistical equation taken

61
from literature to be sure from the results taking into consideration the
following:
• The confidence level: 99% or 95%
• The confidence interval(margin of error):1% or 5%
• Response distribution factor: the most conservative π =50%
• The sample size is >30
The equation that should be used to find the sample size is:
� = ����������
���������������
Where:
n: is the sample size
z: is the normal distribution factor from statistical tables
α: is the 1-confidence level
π: response distribution factor
E: error or confidence interval
N: size of population
The two web sites are:
http://www.raosoft.com/samplesize.html
http://www.censussystem.com/sscalc.htm

62
According the PCBS latest census conducted during the year 2006,
the total population of Nablus governorate including all surrounding
localities is 336,380 distributed as follows:
Total Nablus city 134,166
Refugee camps 35,387
Villages 166,877
Total Nablus governorate 336,380
Case 1:
• The confidence level: 99%
• The confidence interval(margin of error):1%
• Nablus city
Case 2:
• The confidence level: 99%
• The confidence interval(margin of error):1%
• Nablus governorate
Case 3:
• The confidence level: 95%
• The confidence interval(margin of error):1%

63
• Nablus city
Case 4:
• The confidence level: 95%
• The confidence interval(margin of error):1%
• Nablus governorate
Case 5:
• The confidence level: 99%
• The confidence interval(margin of error):5%
• Nablus city
Case 6:
• The confidence level: 99%
• The confidence interval(margin of error):5%
• Nablus governorate
Case 7:
• The confidence level: 95%
• The confidence interval(margin of error):5%
• Nablus city

64
Case 8:
• The confidence level: 95%
• The confidence interval(margin of error):5%
• Nablus governorate
Table (3.7): The number of samples needed in each case
Method Case
1 Case
2 Case
3 Case
4 Case
5 Case
6 Case
7 Case
8 By equation 14763 15808 8963 9338 661 663 384 384
raosoft.com 14763 15808 8963 9338 661 663 384 384 censussystem
. com 14805 15857 8963 9337 662 664 383 384
Case 6 was chosen as 99% confidence level and 5% acceptable error
for Nablus governorate.
• Sellers
The sellers of the agricultural crops in Nablus governorate diverts by
the method of selling as follows:
1. Car seller: they move between houses by car to sell their crops
2. Carriage sellers: they move between streets of the city center to sell
their crops
3. Shop sellers: they own shops of crops in all over the governorate
4. Main crops markets: there is some sellers stay at 2 food markets the
eastern and the western

65
5. The central station of crops: it is located in the eastern part of Nablus
where all the sellers come to take their crops from .
There is no count of the number of the sellers in any group above so
100 questionnaires were collected from all the previous groups.
• Farmers
There is no count for the numbers of farmers in Nablus governorate
so it was hard to decide the sample size, in order to collect the data easily
without going to each and every village in Nablus governorate a workshop
was conducted for several reasons-that will be fully addressed in the next
section-one of them is to collect the farmers questionnaire.
The invitations were sent to every village or town council in order to
invite 10 persons from each on 5 farmers and 5 of the village council.
A total of 30 farmers questionnaires was collected
• Industry owners
According to the data from the chamber of trade and commerce in
Nablus governorate there is 1182 registered industries, removing food
industries and direct contact water industries that are not allowed to use
treated wastewater yet as food and packaging industries, cosmetics ,soap
and teeth production gives us a total of 700. on the other hands many
industries doesn’t use water like wood industries, sowing ,glass and mirrors
which is a huge number so considering to take one industry for each level
of industries for each type gives us a total of 20 industries.

66
Fifth: Pilot test/Revise questionnaire
In order to assure that the questionnaire will answer the questions
needed for the research a test should be conducted.
The test sample was 177 questionnaires which represents more than
25% (26.6%).the questionnaire was distributed through large companies
and in the city center markets in order to take different residents of the
governorate for the end users (city, villages and camps) and the result are
shown in table 3.8 and 3.9.
Table (3.8): The characteristics of the test sample Sex
66.1 Male 33.9 Female
Age
53.11 18-30 42.94 31-60 3.95 61 or more
Education
5.08 Illiterate 29.38 Tawjihi 61.58 B.Sc. 3.95 M.Sc. or higher
Location
81.36 City 12.99 Village 5.65 Camp
Status
55.36 Working
parent 6.21
Non-working parent
27.68 Responsible individual
10.73 Un-
responsible individual

67
Table (3.9): The answers of the questionnaire questions
How many times weekly do you eat fruits and vegetables
26.55 Two times maximum
24.29 Four times maximum
49.15 Daily
How do you clean the fruits and the vegetables
84.18 Only water 11.86 Water and
soap 3.39 Sterilizers
When do you clean the fruits and vegetables
74.01 Before use 25.99 Before
refrigerating
Where do you buy fruits and vegetables from
33.33 Any shop available
23.73 Specific shop 9.60 From the food
market in the city
30.51
From the eastern or western markets
1.13 Directly from
farmers or villages
1.69 From the car
Which type of fruit and vegetables do you buy
83.62
Normal fruits and vegetables
with normal cost
12.99
Organic fruits and
vegetables with high
cost
3.39
Untreated wastewater
irrigated fruits and vegetables with low cost
Do you ask about its source
44.07 Yes 55.93 No
Do you trust the sellers answer
35.03 Yes 64.97 No
Do you have any information about the water situation in Palestine
54.24 No 19.77 Yes it is sufficient
25.99 Yes it is in-sufficient
Which solutions are acceptable for you
4.94 Purchasing water from
Israel 2.62
Reduce agricultural water use
17.44 Reduce
residential water amount
6.69 Reduce
industrial water amount
4.94 Use of raw
wastewater in agriculture
11.05 Use of treated wastewater in
agriculture

68
15.99 Use of treated
wastewater in industry 13.66
Use of treated wastewater in municipal use like cleaning streets
19.77 Use of treated wastewater in
households 2.90
Use of enhanced irrigation methods
Which type of products will you buy if it was irrigated with treated wastewater
32.02 Nothing
mentioned 7.46 Fruits 15.35 Citruses
7.46 Cooking vegetables 19.30 Olives and almonds
4.39 Salad vegetables 14.04 Grains and peas
Do you prefer to separate fruits and vegetable according to irrigation water when
selling them
92.66 Yes 7.34 No
As the answers of the questionnaires are analyzed. it is noticed that
it offers the answers wanted about the social acceptability and economic
side for the treated wastewater reuse. no zero or 100% percentages are
found so the questionnaire is un biased and was distributed as it is.
The questionnaires were collected over a 4 month period by 1
individual.
3.4 Workshop preparation and Data collection
A workshop was a part of the data collection in the research it meant
to give the following:
• Less cost for collecting the farmers questionnaire
• To measure the knowledge and acceptance about the reclaimed
wastewater treatment reuse.

69
• To raise the awareness toward reclaimed wastewater
• To measure the deference in the awareness level after such a method
Within the framework of the Austrian project "Capacity Building
Project and institutional reform for the integrated management of water and
sanitation services in rural communities in the West Bank" and SWMED
project, and in collaboration with the Institute of Water and Environmental
Studies at the university, and the Palestinian Water Authority, the
workshop named Challenges and experiences in the field of reclamation of
treated wastewater in Palestine workshop in the conference hall of the
Korean Institute of excellence in Nablus, Palestinian, with 120 individuals
from the municipalities and villages councils in Nablus governorate,
scientist, farmers, Authority representatives and local organizations .
The workshop included three sessions, papers related to laws and
standards for wastewater treatment and reuse, and practical applications
and experiences of wastewater reuse in agriculture, as well as to discuss the
social acceptance of re-treated wastewater in agriculture. (Table 3.10) the
speakers, there institutes and papers name in the workshop. The
recommendations of the work shop are in section 4.2.3

70
Table (3.10): The speakers, there institutes and papers name in the workshop.
Paper name Position and institute Speaker
Welcoming and a preview about WESI
accomplishments
Director of the Institute for Water and Environmental
Studies at An-Najah National University
A.Pr.Dr. Marwan Haddad
role of PWA and the Palestinian civil society
organizations
Palestinian Water Authority
Engineer Hazem Katana
Hydroponics using treated wastewater
Director of the Institute for Water and Environmental
Studies at An-Najah National University
A.Pr.Dr. Marwan Haddad
The role of the Ministry of Agriculture in the use
of treated wastewater
the Ministry of Agriculture and the Palestinian Water
Authority
Mss. Ibtisam Abu Hija
Household wastewater treatment and re-use in irrigating home gardens
Areej Foundation Eng. Elias Abu Mohr
Managing sources of domestic water in a safe
and low-cost way
The Palestinian Center for Economic and social
Development
Eng. Jamal Burnat
Practical experience in the use of wastewater
for home irrigation
Lecturer at An-Najah University Dr. Hosni Audih
Wastewater collection and treatment plant in
Sarra
The Palestinian hydrological Group
Eng. Mohamed Marei
An overview of the western wastewater treatment plant and
reuse in Nablus
Nablus Municipality
Eng. Yousef Abu Jaffal and Eng.
Mohammed Humaidan
Social acceptance of re-use of treated wastewater in
agriculture
master's student at An-Najah University and a researcher at the Water
Authority, the coordinator of the workshop
Eng. Leen Arafat

71
Chapter Four
Outcomes, Results and Analysis of the field Data

72
Chapter four
Outcomes, Results and Analysis of the field Data
4.1 Questionnaire analysis and outcomes and results
The statistical analysis of the questionnaire was done using the Excel
program on the questions answers, and using the SPSS for the relation
between the question and the hypothesis testing which my indicate
seriousness in data collection or any sociological reasons for these answers.
Χ2-test-Pearson's chi-squared test is a statistical test applied to sets of
categorical data to evaluate how likely it is that any observed difference
between the sets arose by chance, It is suitable for unpaired data from large
samples- was done to find whether there is a relation between any of the
sample characteristics and the habits or knowledge in the other sections of
the questionnaires (Chernoff, H. and Lehmann, E. L,195).
4.1.1 End users Questionnaire outcomes
Tables 4.1-4.2-4.3-4.4: the outcomes of the End users questionnaires.
Table (4.1): Sample characteristics
Sex
62.12 Male 37.88 Female Age
28.53 18-30 68.40 31-60 3.07 61 or more
Education
3.83 Illiterate 38.50 Tawjihi 51.84 B.Sc. 5.83 M.Sc. or higher
Location
65.34 City 30.52 Village 4.14 Camp
Status
67.79 Working
parent 7.36
Non-working parent
17.79 Responsible individual
7.06 Un-
responsible individual

73
Table (4.2): Sample answers about the habits regarding fruit and vegetable use
How many times weekly do you eat fruits and vegetables
23.16 Two times maximum
24.23 Four times maximum 52.61 Daily
How do you clean the fruits and the vegetables
84.82 Only water 10.74 Water and
soap 4.45 Sterilizers
When do you clean the fruits and vegetables
73.93 Before use 26.07 Before
refrigerating
Table (4.3): Sample answers about purchasing fruit and vegetables habits
Where do you buy fruits and vegetables from
38.04 Any shop available
27.30 Specific shop 5.83 From the food market in the
city
25.46
From the eastern or western markets
0.61 Directly from
farmers or villages
2.76 From the car
Which type of fruit and vegetables do you buy
88.04
Normal fruits and
vegetables with normal
cost
9.05
Organic fruits and
vegetables with high cost
2.91
Untreated wastewater
irrigated fruits and vegetables with low cost
Do you ask about its source
41.10 Yes 58.90 No
Do you trust the sellers answer
35.12 Yes 64.88 No

74
Table (4.4): Sample answers regarding water and treated wastewater use in agriculture
Do you have any information about the water situation in Palestine
48.01 No 20.86 Yes it is sufficient
31.13 Yes it is in-sufficient
Which solutions are acceptable for you
3.70 Purchasing water from
Israel 2.39
Reduce agricultural water use
17.04 Reduce
residential water amount
5.09 Reduce
industrial water amount
5.55 Use of row
wastewater in agriculture
13.11 Use of treated wastewater in
agriculture
13.80 Use of treated
wastewater in industry 14.65
Use of treated wastewater in
municipal use like cleaning streets
2.70 Use of treated wastewater in
households 21.97
Use of enhanced irrigation methods
Which type of products will you buy if it was irrigated with treated wastewater
38.86 Nothing
mentioned 7.23 Fruits 15.64 Citruses
9.36 Cooking vegetables 17.65 Olives and almonds
3.08 Salad vegetables 8.18 Grains and peas
Do you prefer to separate fruits and vegetable according to irrigation water when
selling them
91.7 Yes 8.2 No
Several hypothesis was introduced and defended using the Χ 2 test to
find the relation between the question answers, an α<0.05 was the indicator
on the existence of a relation between the answers. The full analysis can be
found in appendix 4.
It was found that the sex factor affects the habits of fruit and
vegetable use regarding woman cleans them more often, while age factor

affects the habits of purchasing fruits and vegetables. But both of them
does not affect the habits and knowledge of
agriculture.
The Education factor doesn't affect any of the questionnaire answers
about the habits regarding fruit and vegetables use
answers regarding purchasing
about water situation in Palestine.
regarding the use of water and treated wastewater since
The location factor
purchasing the fruit and vegetables. It does affect the questions abo
habits of use as it decreases the times of eating and cleaning in the camps
against the villages and the city. And it affects the answers regarding the
knowledge and use of water and treated wastewater as it increases the
acceptability in the camps
Figur (4.1): Location vs. clean habits
village,
0.30
camp,
0.07
75
s the habits of purchasing fruits and vegetables. But both of them
does not affect the habits and knowledge of water and wastewater use in
The Education factor doesn't affect any of the questionnaire answers
about the habits regarding fruit and vegetables use but does affect the
purchasing it and the answers regarding the knowledge
r situation in Palestine. It doesn't also affects the answers
regarding the use of water and treated wastewater since.
The location factor(figure 4.1 and 4.2) doesn't affect the part of
purchasing the fruit and vegetables. It does affect the questions abo
habits of use as it decreases the times of eating and cleaning in the camps
against the villages and the city. And it affects the answers regarding the
use of water and treated wastewater as it increases the
acceptability in the camps against the villages and the city.
clean habits
city, 0.63,
63%
city
village
camp
s the habits of purchasing fruits and vegetables. But both of them
wastewater use in
The Education factor doesn't affect any of the questionnaire answers
but does affect the
it and the answers regarding the knowledge
It doesn't also affects the answers
doesn't affect the part of
purchasing the fruit and vegetables. It does affect the questions about the
habits of use as it decreases the times of eating and cleaning in the camps
against the villages and the city. And it affects the answers regarding the
use of water and treated wastewater as it increases the

Figure (4.2): Location vs.
The status factor
affect any of the questionnaire answers about the habits regarding fruit and
vegetables purchasing. It affects the questions regarding the use of water
and treated wastewater since, the acceptability toward the treated
wastewater use in agriculture
while decreases for the un responsible parent if the cost of theses
vegetables and fruits decrease.
village
50%
camp
%
76
buying untWW products
The status factor (figure4.3) does affect the use habits but
affect any of the questionnaire answers about the habits regarding fruit and
vegetables purchasing. It affects the questions regarding the use of water
and treated wastewater since, the acceptability toward the treated
wastewater use in agriculture increases responsible and working parent
while decreases for the un responsible parent if the cost of theses
vegetables and fruits decrease.
city
45%
camp
5%
does affect the use habits but doesn't
affect any of the questionnaire answers about the habits regarding fruit and
vegetables purchasing. It affects the questions regarding the use of water
and treated wastewater since, the acceptability toward the treated
increases responsible and working parent
while decreases for the un responsible parent if the cost of theses
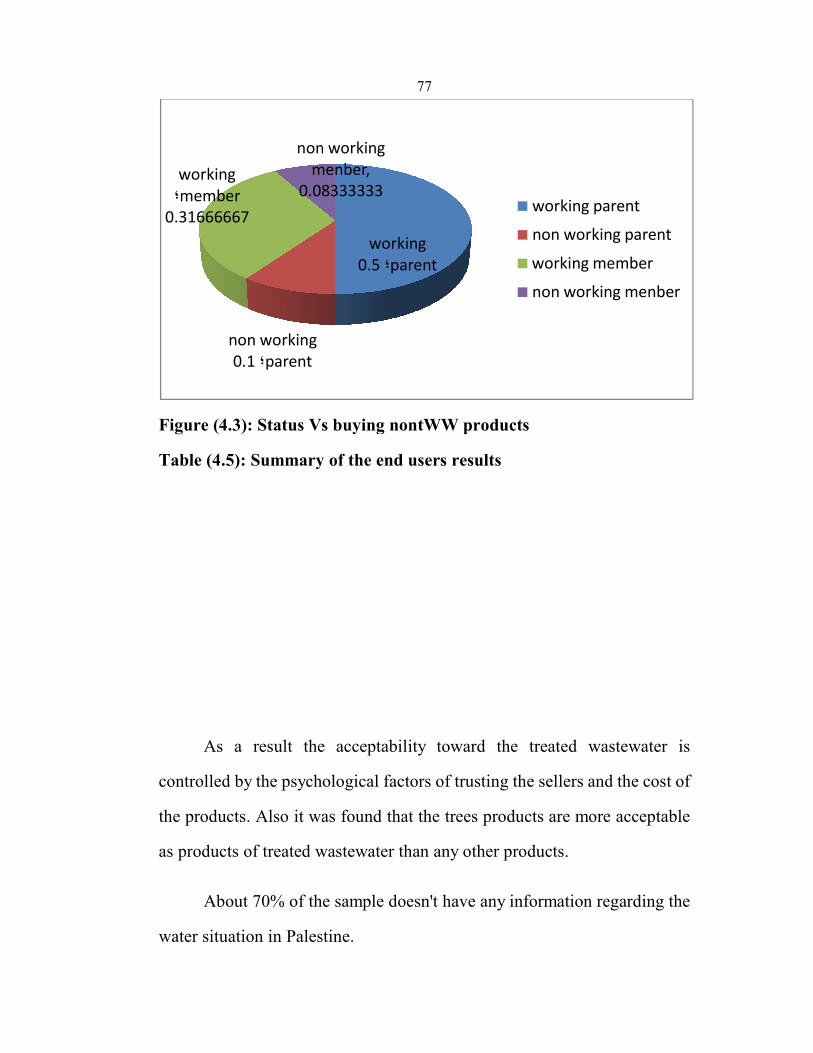
Figure (4.3): Status Vs buying nontWW products
Table (4.5): Summary of the end users results
As a result the acceptability toward the treated wastewater is
controlled by the psychological factors of trusting the sellers and the cost of
the products. Also it was found that t
as products of treated wastewater than any other
About 70% of the sample doesn't have any information regarding the
water situation in Palestine.
non working
parent 0.1؛
working
member ؛
0.31666667
non working
menber
0.08333333
77
Status Vs buying nontWW products
: Summary of the end users results
the acceptability toward the treated wastewater is
controlled by the psychological factors of trusting the sellers and the cost of
Also it was found that the trees products are more acceptable
as products of treated wastewater than any other products.
of the sample doesn't have any information regarding the
water situation in Palestine.
working
parent 0.5؛
non working
menber,
08333333working parent
non working parent
working member
non working menber
the acceptability toward the treated wastewater is
controlled by the psychological factors of trusting the sellers and the cost of
he trees products are more acceptable
of the sample doesn't have any information regarding the
working parent
non working parent
working member
non working menber
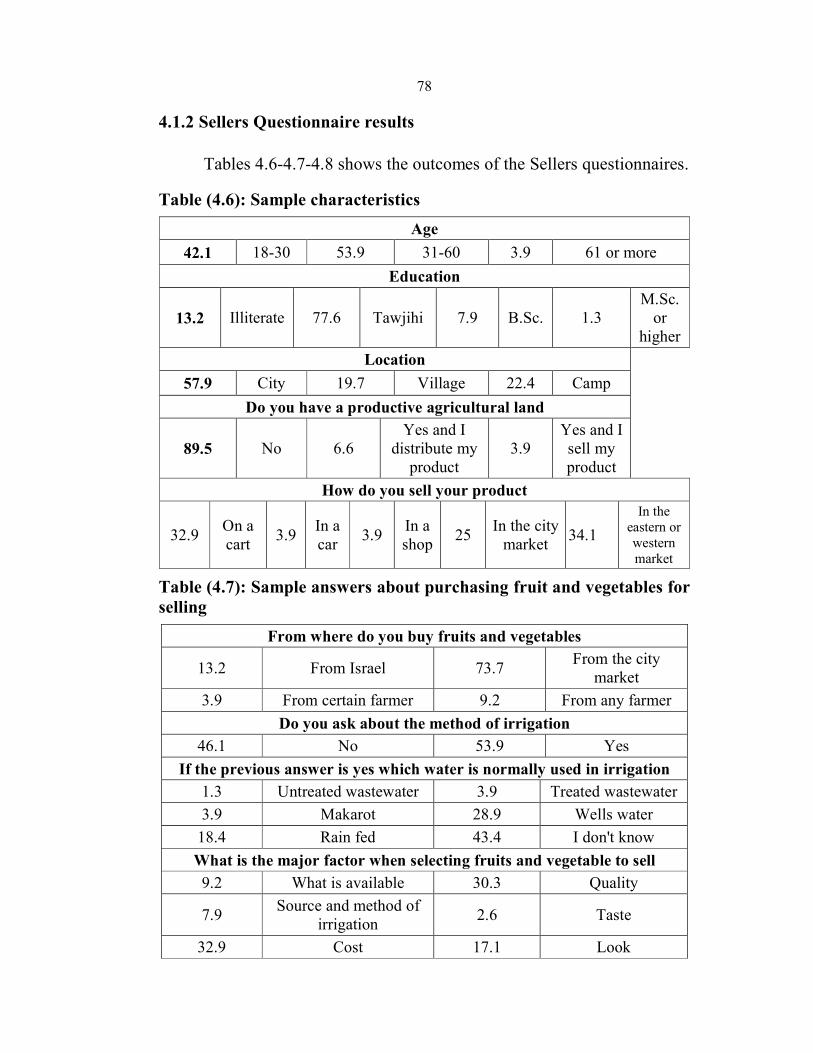
78
4.1.2 Sellers Questionnaire results
Tables 4.6-4.7-4.8 shows the outcomes of the Sellers questionnaires.
Table (4.6): Sample characteristics
Age
42.1 18-30 53.9 31-60 3.9 61 or more
Education
13.2 Illiterate 77.6 Tawjihi 7.9 B.Sc. 1.3 M.Sc.
or higher
Location
57.9 City 19.7 Village 22.4 Camp
Do you have a productive agricultural land
89.5 No 6.6 Yes and I
distribute my product
3.9 Yes and I sell my product
How do you sell your product
32.9 On a cart
3.9 In a car
3.9 In a shop
25 In the city
market 34.1
In the eastern or western market
Table (4.7): Sample answers about purchasing fruit and vegetables for selling
From where do you buy fruits and vegetables
13.2 From Israel 73.7 From the city
market
3.9 From certain farmer 9.2 From any farmer
Do you ask about the method of irrigation
46.1 No 53.9 Yes
If the previous answer is yes which water is normally used in irrigation
1.3 Untreated wastewater 3.9 Treated wastewater
3.9 Makarot 28.9 Wells water
18.4 Rain fed 43.4 I don't know
What is the major factor when selecting fruits and vegetable to sell
9.2 What is available 30.3 Quality
7.9 Source and method of
irrigation 2.6 Taste
32.9 Cost 17.1 Look

79
Table (4.8): Sample answers regarding the acceptability of selling treated wastewater products
Will you sell products of treated wastewater
69.7 No 30.3 Yes
Will you promote for treated wastewater products
64.5 No 35.5 Yes
Will you tell the buyers about the source of water irrigation
14.5 No 15.8 Yes even he didn't
ask 69.7 Yes if he asked
Do you know any products that is being irrigated with water else than fresh water 65.8 No 34.2 Yes
What products are those
51 Nothing
mentioned 5.1
Olives and almonds
10.2 Cooking vegetables
10.2 Citruses 6.1 Fruits 3.1 Grains
and peas 14.3
Salad vegetables
How much do you expect to get these products
67.1 Same as normal
products 27.6 less 5.3 More
What is the price that you will request for these products if you bought them by a lower cost than normal products
68.4 The same price as normal products
31.6 With just a small profit
Do you expect the people to buy it 36.8 No 63.2 Yes
What do you expect from the government to support these products • Monitoring and testing for treated wastewater crops and irrigation
methods and techniques
• Reduction of cost for treated wastewater to be less than fresh water
• Stop importing fruits from Israel
• Increase the awareness campaigns toward the buyers of treated wastewater products

After the analysis it was found that
sample characteristics does
wastewater reuse in agriculture.
As the age factor of the seller affects only the type of
they chose according to cost and quality while the location affects the
acceptability to sell treated wastewater
village: camp of acceptability of selling was found to be
Figure4.4
Figure (4.4): Location vs.
The factor of having a productive land does affect the water type
used for irrigation since the sellers whom doesn't have a productive lands
cares less to the type of water used.
The factor of how the sellers sell their products
the products and the water type used in irrigation.
village
1%
camp
40%
80
After the analysis it was found that only the education level
sample characteristics does not affect the acceptability of treated
wastewater reuse in agriculture.
As the age factor of the seller affects only the type of the product
they chose according to cost and quality while the location affects the
acceptability to sell treated wastewater products, the ratio in the city
village: camp of acceptability of selling was found to be
acceptability to tww products selling
The factor of having a productive land does affect the water type
used for irrigation since the sellers whom doesn't have a productive lands
cares less to the type of water used.
of how the sellers sell their products affects the origin of
the products and the water type used in irrigation.
city
59%
only the education level of the
affect the acceptability of treated
the product
they chose according to cost and quality while the location affects the
products, the ratio in the city:
village: camp of acceptability of selling was found to be 1/2:0:1/3.
The factor of having a productive land does affect the water type
used for irrigation since the sellers whom doesn't have a productive lands
affects the origin of

81
About 73% of the sample buy their products from the city market
(Al-Hissba) and about 50% of the sample asks about the origin and water
used in irrigation. Only 1.3% of the sample sells untreated wastewater
products. And 4% sells treated wastewater products.
The major factors regarding the types of products they sell is cost
and quality. Also 60% of the sample is not willing to promote or sell
treated wastewater products as they say people will not buy it and they will
lose their credibility if fresh water products were also on the same cart or
shop. figure 4.5
Figure (4.5): Types of product sell prefer
70% of the sample tells the buyer about the source of water that was
used in irrigation only if he asked. And 70% of the sample expects to pay
and sell the treated wastewater products as the fresh water products, and if
٠.٣٥٠.٥٧
٠.٠٩
٠.٢٨
٠.٦٨
٠.٠٤
٠.٥٠
٠.٤٣
٠.٠٧
٠.٠٠
٠.٢٠
٠.٤٠
٠.٦٠
٠.٨٠
١.٠٠
١.٢٠
١.٤٠
١.٦٠
١.٨٠
٣٠- ١٨ ٦٠*٣١ <٦١
look
cost
quality

they pay less for it they will not reduce its cost for the buyer which
indicates that they will not tell them about the source of it.
The sellers connect the acceptability of the treated wastewater
products with the awareness campaigns for the buyers (public), Support
these types of products to have a lower cost than fresh wa
monitoring of the quality of the products.
Table (4.9): summary of the sellers questionnaires
4.1.3 Farmers Questionnaire results
Tables 4.10-4.11
questionnaires.
Table (4.10): Sample characteristics
3.45 18-30 68.7
13.79 Illiterate 48.28
3.45 City 96.55
Do you have a productive agricultural land
6.90 No 41.38
82
they pay less for it they will not reduce its cost for the buyer which
ndicates that they will not tell them about the source of it.
The sellers connect the acceptability of the treated wastewater
products with the awareness campaigns for the buyers (public), Support
these types of products to have a lower cost than fresh water products and
monitoring of the quality of the products. summary table4.9
: summary of the sellers questionnaires
Farmers Questionnaire results
11-4.12 shows the outcomes of the Farmers
Sample characteristics
Age
31-60 27.59 61 or more
Education
48.28 Tawjihi 34.48 B.Sc. 3.45
Location
96.55 Village 0.00 Camp
Do you have a productive agricultural land
Yes and I
distribute my product
51.72 Yes and I sell my
product
they pay less for it they will not reduce its cost for the buyer which
The sellers connect the acceptability of the treated wastewater
products with the awareness campaigns for the buyers (public), Support
ter products and
shows the outcomes of the Farmers
or more
M.Sc. or higher
Yes and I sell my product

83
Table (4.11): Sample answers regarding the methods of farming
What are the products you plant
39.29 Olives & almonds
5.36 Cooking
vegetables 3.57
Salad vegetables
0.00 Citruses 8.93 Fruits 28.57 Grains &
peas 14.29
Barley & Feed
Which type of fertilizers do you use 41.38 Chemical 58.62 Organic
Which type of farming do you use
86.21 Covered (plastic
house) 13.79 Un-covered
Do you have any water problems
44.83 Water
shortage 20.69
Difficulty of access to the water source
34.48 High cost of water
From where do you get water
13.79 Public
agricultural well 0
Treated wastewater
3.45 Privet
agricultural well
48.28 rain 27.59
Palestinian water
department
0 Wastewater 6.90 Domestic water
Table (4.12): Sample answers about acceptability to use wastewater and treated wastewater in agriculture
Is it possible to use untreated wastewater to irrigate crops
24.14 Yes 75.86 No
Do you know anyone who uses untreated wastewater
31.03 Yes 68.97 No
In which products
16.00 Citruses 8.00 Fruits 16.00 Grains & peas
12.00 Barley &
Feed
8.00 Cooking
vegetables 8.00
Salad vegetables
32.00 Olives and almonds
Is it possible to use treated wastewater to irrigate crops
93.1 Yes 6.9 No
In which products
3.77 Cooking vegetables 1.89 Salad vegetables 37.74 Olives & almonds

84
11.32 Citruses 11.32 Fruits 11.32 Grains
and peas 22.64
Barley & Feed
Do you know anyone who uses treated wastewater
27.59 Yes 72.41 No
In which products
3.57 Cooking
vegetables 3.57 Salad vegetables 35.71
Olives and almonds
17.86 Citruses 7.14 Fruits 14.29 Grains &
peas 17.86
Barley and Feed
Will you promote for using treated wastewater
89.66 Yes 10.34 No
Will you tell people about the source of water irrigation
34.48 No 31.03 Yes even he didn't ask 34.48 Yes if he
asked
How much do you expect the treated wastewater products will cost
68.97 Same as normal
products 24.14 less 6.90 More
How much do you expect to sell these products
79.31 The same price as normal
products 20.69
With just a small profit
Do you expect the people to buy it 48.28
No 51.72
Yes
What do you expect from the government to support these products
• Monitoring for treated wastewater irrigation methods and techniques
• Reduction of cost for treated wastewater to be less than fresh water
• Increase the awareness campaigns toward the buyers of treated wastewater products
The cost of I cubic meter of fresh water ranges from 3-15 NIS according it's source with 5 NIS as the mode
Only one person stated that he buys row wastewater with 1 NIS for I cubic meter
People are willing to pay treated wastewater at a range of 0.3-15 NIS with 1 NIS as the mode
After the analysis it was found that neither of the sample
characteristics as age, education, location and land owning, or the methods
of farming does affect the acceptability of treated wastewater reuse in
agriculture.

45% of the farmers have shortage of water and
the high cost of fresh water. These numbers give the reason for the high
acceptability to use treated wastewater in irrigation
barely and feed.
90% of the sample says that they will promote for the treated
wastewater products but they were asked about whether they will tell the
buyer about the source of
asking,35% said yes if he asked and
the farmers are not sure from the acceptability of the buyers toward these
products.figure4.6
Figure (4.6): source of water
70% of the sample expects to pay and sell the treated wastewater
products as the fresh water products, and if it costs less they will not reduce
no 0.35؛
85
of the farmers have shortage of water and 35% complains about
the high cost of fresh water. These numbers give the reason for the high
acceptability to use treated wastewater in irrigation 93% mostly in trees and
of the sample says that they will promote for the treated
wastewater products but they were asked about whether they will tell the
buyer about the source of water the 30% said yes without the buyer
said yes if he asked and 35% said no. this results showed that
the farmers are not sure from the acceptability of the buyers toward these
source of water declaration
of the sample expects to pay and sell the treated wastewater
products as the fresh water products, and if it costs less they will not reduce
yes 0.3؛
yes if 0.35؛
complains about
the high cost of fresh water. These numbers give the reason for the high
mostly in trees and
of the sample says that they will promote for the treated
wastewater products but they were asked about whether they will tell the
said yes without the buyer
said no. this results showed that
the farmers are not sure from the acceptability of the buyers toward these
of the sample expects to pay and sell the treated wastewater
products as the fresh water products, and if it costs less they will not reduce
yes
yes if
no

86
its cost for the buyer which indicates that they will not tell them about the
source of it.
The farmers connect the acceptability of the treated wastewater
products with the awareness campaigns for the buyers (public), Support
these types of products to have a lower cost than fresh water products and
monitoring of the quality of the products.
4.2 Workshop analysis and outcomes
4.2.1 Workshop schedule and attendance
The work shop was done on 3/4/2013 at An-Najah National
university-Korean institute of excellence with 121 attendees ( Table 4.13).
Table (4.13): Attendance of the workshop
Attendee No.
State Administrations (PWA,MOA,....) 10
Local and Regional Authorities (municipalities, village councils,..)
45
Other public and semi-public bodies (universities, research centres,...)
19
Private sector actors( private companies, consultants,....) 1
Third sector actors (farmer organizations, consumer rights organization,....)
3
Civil society actors (farmers, consumers,...) 43
Partners 2
Other (media,...) 3
4.2.2 Workshop presentations summary
Within the framework of the Austrian project "Capacity Building
Project and institutional reform for the integrated management of water and

87
sanitation services in rural communities in the West Bank" and SWMED
project and in collaboration with the Institute of Water and Environmental
Studies at the university, and the Palestinian Water Authority, the
workshop named Challenges and experiences in the field of reclamation of
treated wastewater in Palestine workshop in the conference hall of the
Korean Institute of excellence in Nablus, Palestinian, with 120 individuals
from the municipalities and villages councils in Nablus governorates,
scientist, farmers, Authority representatives and local organization.
Dr. Marwan Haddad, director of the Institute for Water and
Environmental Studies at the university, Engineer Hazem Katana, a
representative for the Palestinian Water Authority, Dr. Abdel Fattah
Hassan, a lecturer in the Faculty of Engineering at the university, and
Engineer Leen Arafat participated in the workshop., as well as
representatives from various institutions dealing with water and
environmental affairs in also the local councils in Nablus governorate. The
workshop was facilitated by Dr. Noman Myzid.
At the beginning of the workshop Dr. Marwan Haddad, director of
the Institute of Water and Environmental Studies at the university
welcomed the attendance and pointed out in his speech to the (station
Zubaydat) in the Jericho area of desalination wastewater and solar-
powered, which was established for this purpose, in addition to the
definition of wastewater treatment facilities at the university. In his speech,
he also mentioned the free services offered by the institute for the benefit of
village councils, in addition to the political and economic challenges that
88
affect the subject of wastewater desalination, particularly Social and the
people acceptability for the idea of re-use of desalinated water.
Eng. Kittana, representative of the Palestinian Water Authority,
talked about the role of Palestinian civil society organizations, and the need
to intensify efforts to improve environmental protection in Palestine, and
support young projects, particularly graduate students in the field of
environment.
The workshop included three sessions, papers related to laws and
standards for wastewater treatment and reuse, and practical applications
and experiences of wastewater reuse in agriculture, as well as to discuss the
social acceptance of re-treated wastewater in agriculture.
The first lecture was for Dr. Marwan Haddad entitled hydroponics
using treated wastewater. he explained operation and requirements of this
type of agriculture and its success in growing plants like strawberries.
The second lecture of Mss. Ibtisam Abu Hija of the Ministry of
Agriculture and Water Authority entitled prospects for use of treated
wastewater in agriculture, were she spoke about the role of the Ministry of
Agriculture in the use of treated wastewater and the policy and strategy of
the Ministry of Agriculture on the subject of the Law of use of treated
wastewater in agriculture, she also talked about agriculture related
paragraphs in the law that determines the use of treated wastewater in
agriculture and the relationship between institutions, and her
recommendations were as follows:

89
• Capacity building and strengthening of institutions concerned with re-
use of treated wastewater And that would be through:
• Improve cooperation between the bodies and the parties concerned to
restore agricultural use
• Financing sewer projects, and wastewater treatment.
• Introduction of re-use in the overall strategies for the management of
water resources.
• Public awareness.
The third lecture was from Eng. Elias Abu Mohr from Areej
Foundation and was entitled household wastewater treatment and re-use in
irrigating home gardens. He talked about the sanitation situation in
Palestine and all the necessary processes for wastewater treatment and the
quality of the treated wastewater and he explained several real trials for
reuse in Palestine.
In the fourth lecture entitled managing sources of domestic water in a
safe and low-cost way, Eng. Jamal Burnat from the Palestinian Center for
Economic and social Development talked about how to separate black and
gray wastewater at home and how to prepare a treatment unit to use the
treated wastewater in agriculture. He also talked about the amount of water
and money saved in this way.
The fifth lecture was presented by Dr. Hosni Audih lecturer at An-
Najah University entitled practical experience in the use of wastewater for

90
home irrigation, where he spoke about the motives and justifications for the
re-use of household water and the techniques used locally and he talked
about his experience and the way he used to re-use household water in
agriculture and the problems that he faced during use and proposed ways to
solve them.
Eng. Mohamed Marei from the Palestinian hydrological Group
talked in the sixth lecture about the wastewater collection and treatment
plant in Sarra and all the stages of planning and implementation of the
collection network and wastewater treatment plant also spoke about the
quality of the water emerging from them.
The seventh lecture was from Nablus municipality it was presented
by engineers Yousef Abu Jaffal and Mohammed Humaidan and entitled An
overview of the western wastewater treatment plant and reuse in Nablus,
where they talked about the stages of planning and implementation of the
sewerage network and treatment plant and water quality expected at each
stage and the challenges and obstacles to the re-use of this water.
The final lecture titled Social acceptance of re-use of treated
wastewater in agriculture for Eng. Leen Arafat, the coordinator of the
workshop, a master's student at An-Najah University and a researcher at the
Water Authority, where she discussed the results of a questionnaire that
was distributed to citizens about their eating habits and the acceptance of
the idea of fruit and vegetables irrigated with treated wastewater.

91
4.2.3 Workshop recommendations and results
• The need to increase community awareness about the wastewater
treatment processes and re-used as a new source of water sources in
Palestine for different users:
1. Field visits and methods of use for farmers
2. General awareness campaigns for the seller and consumers
• The need for more research on the quality of the products of treated
wastewater.
• The need for more research regarding nutrition use.
• The need for lows to manage this new water resource that save the
rights of both farmers and consumers
4.2.4 Before and after analysis
This section intends to see the change in the awareness before and
after the workshop regarding the treated wastewater use in agriculture
4.2.4.1 End users
The comparison will be based on the last section in the questionnaire
regarding water and treated wastewater use in agriculture (Table 4.14).
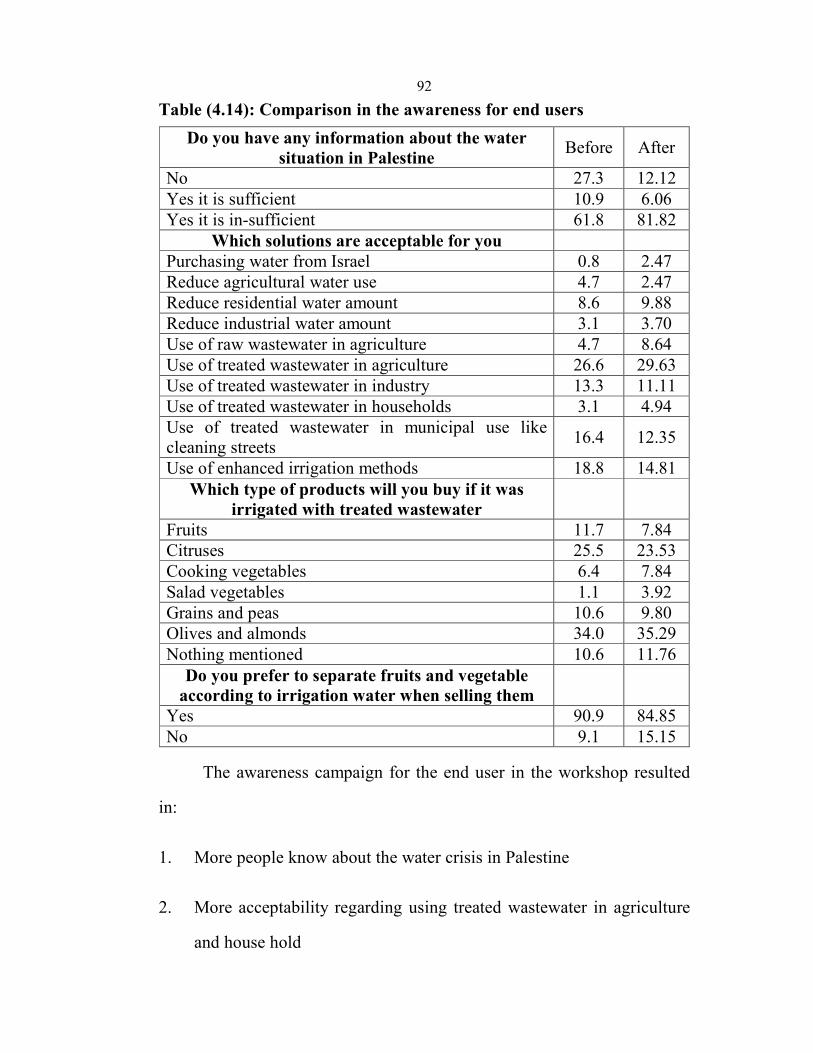
92
Table (4.14): Comparison in the awareness for end users
Do you have any information about the water situation in Palestine
Before After
No 27.3 12.12
Yes it is sufficient 10.9 6.06
Yes it is in-sufficient 61.8 81.82
Which solutions are acceptable for you
Purchasing water from Israel 0.8 2.47
Reduce agricultural water use 4.7 2.47
Reduce residential water amount 8.6 9.88
Reduce industrial water amount 3.1 3.70
Use of raw wastewater in agriculture 4.7 8.64
Use of treated wastewater in agriculture 26.6 29.63
Use of treated wastewater in industry 13.3 11.11
Use of treated wastewater in households 3.1 4.94
Use of treated wastewater in municipal use like cleaning streets
16.4 12.35
Use of enhanced irrigation methods 18.8 14.81
Which type of products will you buy if it was irrigated with treated wastewater
Fruits 11.7 7.84
Citruses 25.5 23.53
Cooking vegetables 6.4 7.84
Salad vegetables 1.1 3.92
Grains and peas 10.6 9.80
Olives and almonds 34.0 35.29
Nothing mentioned 10.6 11.76
Do you prefer to separate fruits and vegetable according to irrigation water when selling them
Yes 90.9 84.85
No 9.1 15.15
The awareness campaign for the end user in the workshop resulted
in:
1. More people know about the water crisis in Palestine
2. More acceptability regarding using treated wastewater in agriculture
and house hold

93
3. More acceptability of using the treated wastewater in irrigation of
vegetables, grains and peas , olive and almonds.
4. Less interest in dividing the product according to the source of
irrigation water which means more faith in treated wastewater.
4.2.4.2 Farmers
The comparison will be based on the last section in the questionnaire
the acceptability of using wastewater and treated wastewater in agriculture
(Table 4.15).

94
Table (4.15): comparison in the awareness for the farmers
Is it possible to use untreated wastewater to irrigate crops
Before After
Yes 25.00 24.14
No 75.00 75.86
Is it possible to use treated wastewater to irrigate crops
Yes 85.71 93.10
No 14.29 6.90
In which products
Fruits 7.02 11.32
Citruses 19.30 11.32
Cooking vegetables 5.26 3.77
Salad vegetables 1.75 1.89
Grains and peas 10.53 11.32
Olives and almonds 35.09 37.74
Barley and feed 21.05 22.64
Will you promote for using treated wastewater
Yes 71.43 89.66
No 28.57 10.34
Will you tell people about the source of water irrigation
Yes if he asked 32.14 34.48
Yes even he didn't ask 50.00 31.03
No 17.86 34.48
How much do you expect the treated wastewater products will cost
Same as normal products 68.97 71.43
Less 24.14 28.57
More 6.9 00
How much do you expect to sell these products
The same price as normal products 60.71 79.31
With just a small profit 39.29 20.69
Do you expect the people to buy it
Yes 51.72 78.57
No 48.28 27.43
The awareness campaign for the farmers in the workshop resulted in:
1. Less farmers are willing to use untreated wastewater.

95
2. More farmers are willing to use treated wastewater and promote for it.
3. Less farmers are willing to tell about the water source if the buyers
didn't ask.
4. More farmers think that the treated wastewater products will cost less.
5. More farmers think that they will sell they buy the normal products
cost.
6. More farmers think that people will buy these products.
4.3 Industrial data and outcomes
There are 13 different types of industries in Nablus Governorate, but
not all of them may use treated wastewater since it will be in direct contact
with consumers like food and raping industries. On the other hand some
industries do not use water in its processes like wooden industries. The
following industries were considered in the data collection:
1. Metal shaping and furniture
2. Rocks and construction materials
3. Plastic and naillon
4. Textile
5. Paper and paints
6. Detergents and chemicals

96
7. Shoes and bags and leather
Each type has 4 different categories according to the size of
production (excellent, 1st, 2nd, 3rd). (Table 4.16) the industrial questionnaire
outcomes for 20 industries.

97
Ta
ble
(4.1
6):
in
du
stri
al
qu
esti
on
na
ire
ou
tcom
es
Ty
pe
of
ind
ust
ry
Cat
ego
ry
Na
me
Pro
du
ct
Des
crip
tio
n
of
wa
ter
use
A
mo
un
t m
3/d
Acc
epta
bil
ity
of
usi
ng
trea
ted
w
aste
wa
ter
Rea
son
Met
al
shap
ing
an
d
furn
itu
re
Ex
cell
ent
Al
Dag
ani
com
pan
y
Met
al
chai
rs a
nd
tab
les
Mai
nly
d
om
esti
c,
coo
ling
and
cl
ean
ing
10
No,
nee
d f
or
scie
nti
fic
rese
arch
Dir
ect
con
tact
wit
h e
mplo
yee
an
d b
uy
ers,
may
chan
ge
the
colo
r o
f fi
nal
pro
du
ct w
hen
co
oli
ng i
n
Met
al
shap
ing
an
d
furn
itu
re
Ex
cell
ent
Tin
fac
tory
T
in
conta
iner
s
Mai
nly
d
om
esti
c,
coo
ling
and
cl
ean
ing
7
No,
nee
d f
or
scie
nti
fic
rese
arch
Dir
ect
con
tact
wit
h e
mplo
yee
an
d b
uy
ers,
may
chan
ge
the
colo
r o
f fi
nal
pro
du
ct w
hen
co
oli
ng i
n
Met
al
shap
ing
an
d
furn
itu
re
3rd
M
ayal
leh
fa
cto
ry
Bed
s,
chai
rs a
nd
tab
les
Mai
nly
d
om
esti
c,
coo
ling
and
cl
ean
ing
5
No,
nee
d f
or
scie
nti
fic
rese
arch
Dir
ect
con
tact
wit
h e
mplo
yee
an
d b
uy
ers,
may
chan
ge
the
colo
r o
f fi
nal
pro
du
ct w
hen
co
oli
ng i
n
Met
al
shap
ing
an
d
furn
itu
re
3rd
Ham
mo
z E
st.
for
indu
stry
an
d t
rad
e
Ste
el s
hee
t,
elec
tric
al
dev
ice
Mai
nly
d
om
esti
c,
coo
ling
and
cl
ean
ing
5
No,
nee
d f
or
scie
nti
fic
rese
arch
Dir
ect
con
tact
wit
h e
mplo
yee
an
d b
uy
ers,
may
chan
ge
the
colo
r o
f fi
nal
pro
du
ct w
hen
co
oli
ng i
n
Rock
s an
d
con
stru
ctio
n
mat
eria
ls
Ex
cell
ent
Bai
t A
l M
aqd
es
Co
ncr
ete
blo
cks
Mix
ing
th
e co
ncr
ete
70
No,
nee
d f
or
scie
nti
fic
rese
arch
Co
nta
ins
hea
vy m
etal
th
at
may
aff
ect
the
stre
ngth
an
d
pro
pri
etie
s o
f th
e b
lock
s
Rock
s an
d
con
stru
ctio
n
mat
eria
ls
1st
Al
Naj
ah
fact
ory
C
oncr
ete
blo
cks
Mix
ing
th
e co
ncr
ete
12
3
No,
nee
d f
or
scie
nti
fic
rese
arch
Co
nta
ins
hea
vy m
etal
th
at
may
aff
ect
the
stre
ngth
an
d
pro
pri
etie
s o
f th
e b
lock
s
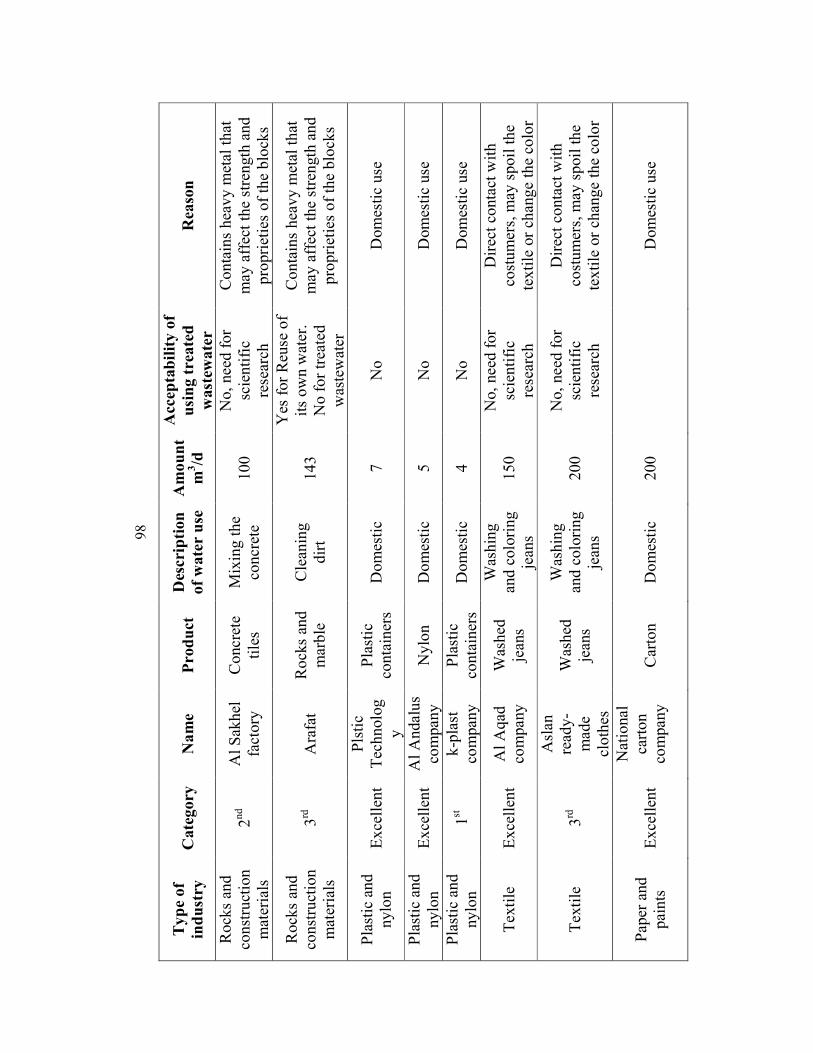
98
Ty
pe
of
ind
ust
ry
Cat
ego
ry
Na
me
Pro
du
ct
Des
crip
tio
n
of
wa
ter
use
A
mo
un
t m
3/d
Acc
epta
bil
ity
of
usi
ng
trea
ted
w
aste
wa
ter
Rea
son
Rock
s an
d
con
stru
ctio
n
mat
eria
ls
2n
d
Al
Sak
hel
fa
cto
ry
Co
ncr
ete
tile
s M
ixin
g t
he
con
cret
e 10
0
No,
nee
d f
or
scie
nti
fic
rese
arch
Co
nta
ins
hea
vy m
etal
th
at
may
aff
ect
the
stre
ngth
an
d
pro
pri
etie
s o
f th
e b
lock
s
Rock
s an
d
con
stru
ctio
n
mat
eria
ls
3rd
A
rafa
t R
ock
s an
d
mar
ble
C
lean
ing
d
irt
14
3
Yes
for
Reu
se o
f it
s o
wn w
ater
. N
o f
or
trea
ted
was
tew
ater
Co
nta
ins
hea
vy m
etal
th
at
may
aff
ect
the
stre
ngth
an
d
pro
pri
etie
s o
f th
e b
lock
s
Pla
stic
an
d
ny
lon
E
xce
llen
t P
lsti
c T
ech
nolo
gy
Pla
stic
co
nta
iner
s D
om
esti
c 7
N
o
Dom
esti
c use
Pla
stic
an
d
ny
lon
E
xce
llen
t A
l A
ndal
us
com
pan
y
Ny
lon
Do
mes
tic
5
No
Dom
esti
c use
Pla
stic
an
d
ny
lon
1
st
k-p
last
co
mpan
y
Pla
stic
co
nta
iner
s D
om
esti
c 4
N
o
Dom
esti
c use
Tex
tile
E
xce
llen
t A
l A
qad
co
mpan
y
Was
hed
je
ans
Was
hin
g
and
colo
rin
g
jean
s 15
0
No,
nee
d f
or
scie
nti
fic
rese
arch
Dir
ect
conta
ct w
ith
cost
um
ers,
may
sp
oil
th
e te
xti
le o
r ch
ang
e th
e co
lor
Tex
tile
3
rd
Asl
an
read
y-
mad
e cl
oth
es
Was
hed
je
ans
Was
hin
g
and
colo
rin
g
jean
s 20
0
No,
nee
d f
or
scie
nti
fic
rese
arch
Dir
ect
conta
ct w
ith
cost
um
ers,
may
sp
oil
th
e te
xti
le o
r ch
ang
e th
e co
lor
Pap
er a
nd
pai
nts
E
xce
llen
t
Nat
ional
ca
rto
n
com
pan
y
Car
ton
D
om
esti
c 20
0
D
om
esti
c use

99
Ty
pe
of
ind
ust
ry
Cat
ego
ry
Na
me
Pro
du
ct
Des
crip
tio
n
of
wa
ter
use
A
mo
un
t m
3/d
Acc
epta
bil
ity
of
usi
ng
trea
ted
w
aste
wa
ter
Rea
son
Pap
er a
nd
pai
nts
E
xce
llen
t A
l N
aser
pri
nte
r
Pri
nti
ng
p
aper
an
d
bo
oks
Cle
anin
g
pri
nte
rs
37
0
No,
nee
d f
or
scie
nti
fic
rese
arch
May
aff
ect
the
qu
alit
y o
f pap
er a
nd
colo
r an
d r
eact
w
ith t
he
pri
nte
rs
Pap
er a
nd
pai
nts
E
xce
llen
t A
rab
pai
nti
ng
com
pan
y
Pai
nts
U
sed
in
clea
nin
g
mac
hin
es
75
No,
nee
d f
or
scie
nti
fic
rese
arch
M
ay r
eact
wit
h t
he
mac
hin
es
Det
erg
ents
an
d
chem
ical
s 1
st
Hel
en
Cle
anin
g
pro
du
cts
In t
he
pro
duct
s 25
0
No,
nee
d f
or
scie
nti
fic
rese
arch
May
chan
ge
the
pro
du
ct
pro
pri
etie
s o
r sp
oil
it
Det
erg
ents
an
d
chem
ical
s 1
st
Al
Raj
eh
Cle
anin
g
pro
du
cts
In t
he
pro
duct
s 20
0
No,
nee
d f
or
scie
nti
fic
rese
arch
May
chan
ge
the
pro
du
ct
pro
pri
etie
s o
r sp
oil
it
Det
erg
ents
an
d
chem
ical
s 2
nd
Cle
an
ho
me
Cle
anin
g
pro
du
cts
In t
he
pro
duct
s 12
0
No,
nee
d f
or
scie
nti
fic
rese
arch
May
chan
ge
the
pro
du
ct
pro
pri
etie
s o
r sp
oil
it
Sh
oes
an
d
bag
s an
d
leat
her
E
xce
llen
t E
agle
W
hee
ls,
tire
s D
om
esti
c 3
N
o
Dom
esti
c use

100
As it is shown in the table 100% of the sample refused to use the
treated wastewater from the treatment plants and that was for the following
reasons:
• Direct contact with employees.
• Direct contact with consumers.
• Fear of reacting with the metal equipments.
• Fear of reacting with the ingredients of the product mix and spoiling it.
Most of them stated that when enough research and experiment are
done ensuring safe use of treated wastewater on their employee, equipment
and product they may use it.

101
Chapter Five
Wastewater reuse sector Modeling and Analysis using
VCA software and BPR

102
Chapter Fve
Wastewater reuse sector Modeling and Analysis using VCA software and BPR
5.1 Modeling, purpose and key players (current situation)
From the different meetings and the workshop it was noticed that in
order to model the wastewater reuse sector identifying its purpose and key
players is a major need to be able to understand it and overcome its
barriers.
The purpose of the wastewater reuse sector right now is mainly to
treat as much as possible of wastewater, and the miner purpose is to
introduce the reclaimed treated wastewater as a new water resource to
replace fresh water in some areas without any more detailing, and only with
minimum amount of regulations needed for such a purpose.
This purpose was only supported from the municipalities, PWA,
MOA and some NGOs as key players in this sector. The sector is working
right know as it is under construction phase which is not enough since
already some treatment plants are working and producing reclaimed treated
wastewater.
As a result of the meetings done with the key players, the model of
the reclaimed treated wastewater right now (Figure 5.1) was found. As it
is noticed, the only regulations that were enforced are the ones regarding
the distribution of water to house-holds. The regulations about the
treatment and reuse are not enforced properly yet with no responsibility
distribution on the key players or users.

Figure (5.1): The model of the reclaimed treated wastewater right now
5.2 VCA tool and application
As mentioned in chapter three applying VCA can be done manually
or buy using a software which will be more advanced and will need less
knowledge in professional economy to do, thus VCA TOOL
used - a software for carrying out value
rural development policies. By storing relevant data it can calculate flows
of physical outputs and inputs, flows of aggrega
net benefits. In addition, it allows users to directly compare different
hypothetical scenarios
reclaimed treated wastewater sector in agriculture and to analyze the
different scenarios possible.(FAO,
103
: The model of the reclaimed treated wastewater right now
VCA tool and application
As mentioned in chapter three applying VCA can be done manually
or buy using a software which will be more advanced and will need less
professional economy to do, thus VCA TOOL 3.1
a software for carrying out value-chain analyses for agricultural and
rural development policies. By storing relevant data it can calculate flows
of physical outputs and inputs, flows of aggregated costs, value
net benefits. In addition, it allows users to directly compare different
hypothetical scenarios –in order to find the value adding processes in the
reclaimed treated wastewater sector in agriculture and to analyze the
cenarios possible.(FAO,2012)
: The model of the reclaimed treated wastewater right now
As mentioned in chapter three applying VCA can be done manually
or buy using a software which will be more advanced and will need less
3.1(FAO) is
chain analyses for agricultural and
rural development policies. By storing relevant data it can calculate flows
ted costs, value-added and
net benefits. In addition, it allows users to directly compare different
in order to find the value adding processes in the
reclaimed treated wastewater sector in agriculture and to analyze the

5.2.1 Data entering and model building
The model of the value chain analysis will be based on the
wastewater-treated wastewater
flow expressed in currency (NIS). the chain of water
shown in figure 5.2.
Figure (5.2): Water-Wastewater
In order to enter the data into the VCA tool, the data is divided into
level:
1. Goods
2. Activities
Wastewater
• Collection
Treated Wastewater
• Treatment
Crops
• Farming :and treatedwastewater
•Tomatoes
•Zucchini
•Potato
•Nectarine
•Alamond
104
ata entering and model building
he model of the value chain analysis will be based on the
treated wastewater-product chain with physical component
flow expressed in currency (NIS). the chain of water-wastewater
Wastewater-Product chain.
In order to enter the data into the VCA tool, the data is divided into
Collection
Treatment
Farming : using municipality, agricultural well, makkarot water
and treatedwastewaterTomatoes Natural Cucumber Green House Cucumber
Egg Plant
Zucchini Cabbage BeansSpanish
Orange Peach Plum
Nectarine Lemon ParsleyMint
Alamond Fig Olives
he model of the value chain analysis will be based on the
product chain with physical component
wastewater-product is
In order to enter the data into the VCA tool, the data is divided into 3
using municipality, agricultural well, makkarot water
Green House Cucumber

105
3. Plans
The goods are the basic element in the chain, the activities are the
processes and the plans which are the framework or property of each group
of activities. Table 5.1shows a small part of the list of the goods, activities
and plans in the model. the full table can be seen in appendix 5
Table (5.1): List of the goods, activities and plans in the VCA model
Good Activities Plan water M WW treatment Tomatoes FWK Municipality profit
Water A WW collection Natural
Cucumber FWK
TWW farmers
Water K Tomatoes FTWW Green House
Cucumber FWK WA farmers
Wastewater Natural Cucumber
FTWW Egg Plant FWK WM farmers
WW collected Green House
Cucumber FTWW Zucchini FWK WK farmers
Treated wastewater
Egg Plant FTWW Cabbage FWK M:municipality
water A: agricultural wells K:palestiniane water
department water WW: wastewater S :seeds or splits
P: Product FTWW: farming
using treated waste water
FWA: farming using fresh water from agricultural
well FWK: farming
using fresh water from palestiniane water department FWM: farming
using fresh water from municipality
Fertilizers Zucchini FTWW Beans FWK
Labor Cabbage FTWW Spanish FWK
Tomatoes s Beans FTWW Potato FWK
Natural Cucumber s
Spanish FTWW Orange FWK
Green House Cucumber s
Potato FTWW Peach FWK
Egg Plant s Orange FTWW Plum FWK
Zucchini s Peach FTWW Nectarine FWK
Cabbage s Plum FTWW Lemon FWK
Beans s Nectarine FTWW Parsley FWK

106
In order to enter the data, first the program asks about the type of
prices that is going to be used in the analysis whether it is a reference price
or a market price (figure 5.3). Reference prices are prices based on past
history, prices for any product that may be affected by several factors and
usually set by economics experts in order to use in evaluating any new
product price. Where market prices are the used price for any product. In
this case and due to the lake of reference prices in Palestine for agricultural
products market prices will be used. See picture. (Putler,1992)
Figure (5.3): Reference price or Market price
The next step is to identify the parameters for the tool which are the
decimal digits for calculations and the forex data; which is the transfer rate
of different currency that will be used in advanced analysis, but the
program will not run without them, figure 5.4.
The scale factor will be 1, and 1 decimal will be used in order to ease
the calculations. The prices in the model will be all in NIS and three
currencies will be entered in the Forex table with values equal to its value
at the day the analysis was done as requested in order for the program to
calculate the Forex premium coefficient table 5.2

107
Table (5.2): Forex premium data.
Name of currency
Description of the currency
Official exchange
rate
Shadow exchange
rate
Forex premium coefficient
$ US Dollars International 3.7 3.68 0.995
JD Jordanian dinar
Regional 5 4.98 0.996
€ European euro
Other 4.9 4.88 0.996
Figure (5.4): Parameters of the model.
The model should be saved in order to start entering the data.
Starting from the goods, each good will be entered separately by filling the
table that appears in figure 5.5 below. But two things should be noticed;
whether the good is a value added item that whether it will add a value to
the final product (be used in the comparison) or not, and is it a depreciation
item which in our case neither one of our good is. The data for some of the
goods needed (table 5.3).The full table is in appendix 6

108
Figure (5.5): The goods data table.
Table (5.3): The data for some of the goods needed
Good Unit Value added
item Depreciati
on item Market
price NIS water M M3 Yes No 4.69
Water A M3 Yes No 2
Water K m3 Yes No 14
Wastewater m3 Yes No 0
WW collected m3 Yes No 1
Treated wastewater
m3 Yes No 1
Fertilizers Kg Yes No 4.5
After entering all the goods it is time to enter the activities in the
program where each activity have a separate table as shown in figure 5.6.
Each activity consists of one or more goods. (Table 5.4) the data needed for
entering some of the activity. The full table is in Appendix7

109
Figure (5.6): The activities data table

110
Table (5.4): The data needed for some of the activities.
Activity name
unit goods In/out Unit Amount
WW collection
m3
Wastewater In m3 -19152
Wastewater collected
out m3 19152
WW treatment
m3
Wastewater collected
in m3 -14000
Treated wastewater
out m3 14000
Tomatoes FTWW
1 dunums
fertilizers In Kg 60
Labor In Hand/day 1
Treated wastewater
In m3 400
Tomatoes s In Seeds or
splits 1000
Tomatoes p out Kg 4000
Tomatoes FWA
1 dunums
fertilizers In Kg 150
Labor In Hand/day 1
Water A In m3 400
Tomatoes s In Seeds or
splits 100
Tomatoes p out Kg 4000
Tomatoes FWK
1 dunums
fertilizers In Kg 150
Labor In Hand/day 1
Water k In m3 400
Tomatoes s In Seeds or
splits 100
Tomatoes p out Kg 4000
Tomatoes FWM
1 dunums
fertilizers In Kg 150
Labor In Hand/day 1
Water m In m3 400
Tomatoes s In Seeds or
splits 100
Tomatoes p out Kg 4000
The last part of entering the data is the plans, each plan have a
separate table (figure 5.7). Each plan consists of one or more activity or
goods. (Table 5.5) the data needed for entering one plan. The full data for

111
the plans is in appendix 8. The amount of all the activities is 1 since there
is no enough data on how much land is farmed with each type of plants so
it is assumed that I dunums daily is irrigated from each type.
Figure (5.7): The plan data table.

112
Table (5.5): One Plan data needed for the model.
Plan name
Plan long name
In/out Type Unit amount
TWW farmers
the profits for farmers from using
treated wastewater
Tomatoes FTWW
Activity I dunums 1
Natural Cucumber
FTWW Activity I dunums 1
Green House Cucumber
FTWW Activity I dunums 1
Egg Plant FTWW
Activity I dunums 1
Zucchini FTWW
Activity I dunums 1
Cabbage FTWW
Activity I dunums 1
Beans FTWW Activity I dunums 1
Spanish FTWW
Activity I dunums 1
Potato FTWW
Activity I dunums 1
Orange FTWW
Activity I dunums 1
Peach FTWW Activity I dunums 1
Plum FTWW Activity I dunums 1
Nectarine FTWW
Activity I dunums 1
Lemon FTWW
Activity I dunums 1
Parsley FTWW
Activity I dunums 1
Mint FTWW Activity I dunums 1
Almond FTWW
Activity I dunums 1
Fig FTWW Activity I dunums 1
Olives FTWW
Activity I dunums 1

113
5.2.2 Results of the model run
After running the cost and benefit analysis the plans results came as
shown in (figure 5.8): plans results, (Table5.6): result in NIS, (Table 5.7):
results in percentage, (figure 5.9): graphical representation of the results.
Figure (5.8): Plans results
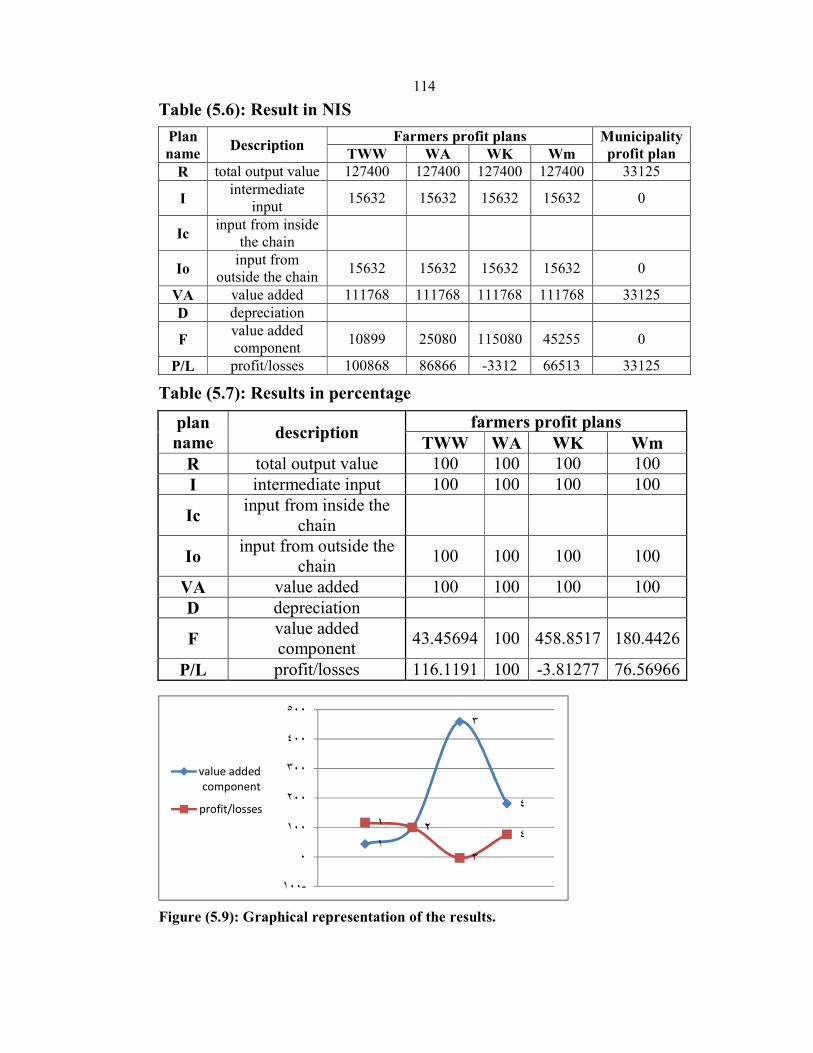
114
Table (5.6): Result in NIS
Plan name
Description Farmers profit plans Municipality
profit plan TWW WA WK Wm R total output value 127400 127400 127400 127400 33125
I intermediate
input 15632 15632 15632 15632 0
Ic input from inside
the chain
Io input from
outside the chain 15632 15632 15632 15632 0
VA value added 111768 111768 111768 111768 33125
D depreciation
F value added component
10899 25080 115080 45255 0
P/L profit/losses 100868 86866 -3312 66513 33125
Table (5.7): Results in percentage
plan name
description farmers profit plans
TWW WA WK Wm R total output value 100 100 100 100
I intermediate input 100 100 100 100
Ic input from inside the
chain
Io input from outside the
chain 100 100 100 100
VA value added 100 100 100 100
D depreciation
F value added component
43.45694 100 458.8517 180.4426
P/L profit/losses 116.1191 100 -3.81277 76.56966
Figure (5.9): Graphical representation of the results.
١
٢
٣
٤
١ ٢
٣
٤
-١٠٠
٠
١٠٠
٢٠٠
٣٠٠
٤٠٠
٥٠٠
value added
component
profit/losses

115
As a results of the five plans in the current situation- one plan for the
profit of the municipality and four plans for the profit of the farmers- for
the profit of the farmers plans, all the plans have the same product the
difference between them is the type of water used in irrigation which
affected the cost of the water, and results in less fertilizers used since
reclaimed treated wastewater contains more n and p.
The results of the plans showed that the difference in the four plans
results is in two items; the value added components and the profits as
shown in table 5.8
Table (5.8): Value added components and profits in the VCA plans.
Plan name Value added components Profits FTWW 10.899 100.868
FWA 25.080 86.688
FWK 115.080 -3.312
FWM 45.255 66.513
The maximum value adding process is the farming, in which water
and other components are added. the value added for the treated wastewater
is the minimum from all the others thus it makes the best profits for the
farmers since all the products are sold in the same price while palestiniane
water department water adds the highest value to the product thus the
products losses if it is sold in the same price.
As for the municipality profit plan it shows the profits of the
municipality if the current situation continuo, which is costing each 1m3 of
collected wastewater 1 NIS on producers of wastewater and selling 1 m3 of
treated wastewater with 1 NIS for farmers.

116
Scenarios data and results
In order to study the reuse of reclaimed treated wastewater in
agriculture as a commodity, different conditions may change that will
change the base situation that we studied earlier. So different scenarios of
possible and proposed conditions will be studied. These scenarios are
introduced as a management options that may be taken in order to start up
with this sector.
In this study the scenarios will be based on two perspectives; social
acceptability of the reuse, and the cost of different components in the
production process as the cost of the reclaimed treated wastewater, fresh
water which affects the profits of the municipalities and the farmers.
Cost and profit perspectives are divided into six scenarios as follows:
Scenario one: as a result for some regulation of supporting the new
resource of water the water Authorities increase the tariff of fresh water
from municipalities to 6 NIS/m3 and the same for agricultural wells this
will enforce more farmers to use the reclaimed treated wastewater as there
profit will decrees figure 5.10.

117
Figure (5.10): Scenario one results
Table (5.9): scenario one result.
Plan name Senario Value added componant
(due to cost of water) Profit /losses
Wm Farmers Base 45225 66513
ONE 55080 56688
Tww Farmers Base 10899 100686.7
ONE 10899 100686.7
Wa Farmers Base 25080 86688
ONE 55080 56688
From table (5.9): scenario one result the profit decrease for the
farmers if them kept on using the municipal or agricultural wells water
which will force them to use the TWW which gives them the higher profits.
Scenario two: as a result for some regulations that support the new
resources of water the water authorities decrease the cost of reclaimed
treated wastewater to its minimum which is 0 NIS and compensating the
municipalities with 1 NIS as a running cost. This will save the profits of the
municipality and increase the profits of the farmers as figure 5.11.

118
Figure (5.11): Scenario two results.
Scenario three: after 2-3 years the municipalities increased the cost
of reclaimed treated wastewater in order to cover its operation and
maintenance cost to 2 NIS/m3 this will reduce the farmers profit but it still
more than the profit from the municipality water and palestiniane water
department profits 5.12
Figure (5.12): Scenario three results
Scenario four: after 2-3 years the municipalities increased the cost of
reclaimed treated wastewater in order to cover its operation and
maintenance cost to 4 NIS/m3 this will maximize the profit of the

119
municipality and minimize the profit of the treated wastewater farmers but
not reaching the profits of the municipality water farmers 5.13:
Figure (5.13): Scenario four results
Scenario five: due to the change in seasons the products are sold in
their maximum cost which will give the maximum profit to all types of
farmers figure 5.14
Figure (5.14): Scenario five results

120
Scenario six: due to the change in seasons the products are sold in
their minimum cost which is counted as the minimum profits all types of
farmers may have figure 5.15:
Figure (5.15): Scenario six results
Public acceptability perspective have two side the high public
acceptability which will produce a huge profit which is the goal of the
research so it will not be analyzed, and low public acceptability which will
be analyzed.
Scenario seven: as a result of low public acceptability the cost of the
products will decrease to the minimum as the cost of the treated reclaimed
wastewater will also decrease to 0 NIS. The profits in figure 5.16

121
Figure (5.16): Scenario seven results
Scenario eight: as a result of low public acceptability the cost of the
products will decrease to the minimum but the cost of the treated reclaimed
wastewater will remain 1 NIS (the same as scenario six).
Scenario nine: as a result of low public acceptability the cost of the
products will decrease to the minimum but the cost of the treated reclaimed
wastewater will be 2 NIS to cover the running cost of the treatment plant
the farmers profits figure 5.17
Figure (5.17): Scenario nine results
Scenario ten: as a result of low public acceptability the cost of the
products will decrease to the minimum but the cost of the treated reclaimed
wastewater will be 4 NIS to cover the running cost of the treatment plant
the farmers profits figure 5.18

122
Figure (5.18): Scenario ten results
As a result of the scenarios analysis increasing the acceptability may
come from reduction of the reclaimed wastewater cost or increasing the
cost of fresh water or from an awareness campaigns, after that the
municipalities may increase the tariff of the reclaimed wastewater to start
getting profits and run the sector with independent economical plans. This
is a few mitigation majors or rules the Authorities and water suppliers may
enforce to support the reclaimed waste water sector.
5.3 BPR application
The application of Business Process Re-engineering starts by
applying it basic concepts and method on the aimed organization in the
current situation which in this case is the reclaimed treated wastewater
sector. Analyzing it starting from the top to the bottom to the smallest
fragment of the organization –in our case the reclaimed treated wastewater
sector-using the analysis tools that are available in order to reach the future
re-engineered model.
BPR combines both theories and concept of any organization (figure
5.19) which includes: (Simon, 1994) .

BPR Organization
informatics
organizational theory
• Organizational Theory
• Marketing
• Informatics
Figure (5.19): BPR organization
The organizational theory is expressed in our sector as the role of
each and every key player in order to achieve the wanted results and the
relationship between them and the regulations that regulate the entire
sector, that represents the lows the treatment and reclamation of treated
wastewater and the rights, responsibilities and disciplines for each key
player.
The marketing describes the customer needs which means the public
acceptability of the reclaimed treated wast
the reclaimed treated wastewater and its products, the quality of the
products and the support from the government if available.
123
BPR Organization
informatics
marketing
Organizational Theory
BPR organization
The organizational theory is expressed in our sector as the role of
each and every key player in order to achieve the wanted results and the
relationship between them and the regulations that regulate the entire
that represents the lows the treatment and reclamation of treated
wastewater and the rights, responsibilities and disciplines for each key
The marketing describes the customer needs which means the public
acceptability of the reclaimed treated wastewater that includes the cost of
the reclaimed treated wastewater and its products, the quality of the
products and the support from the government if available.
The organizational theory is expressed in our sector as the role of
each and every key player in order to achieve the wanted results and the
relationship between them and the regulations that regulate the entire
that represents the lows the treatment and reclamation of treated
wastewater and the rights, responsibilities and disciplines for each key
The marketing describes the customer needs which means the public
ewater that includes the cost of
the reclaimed treated wastewater and its products, the quality of the
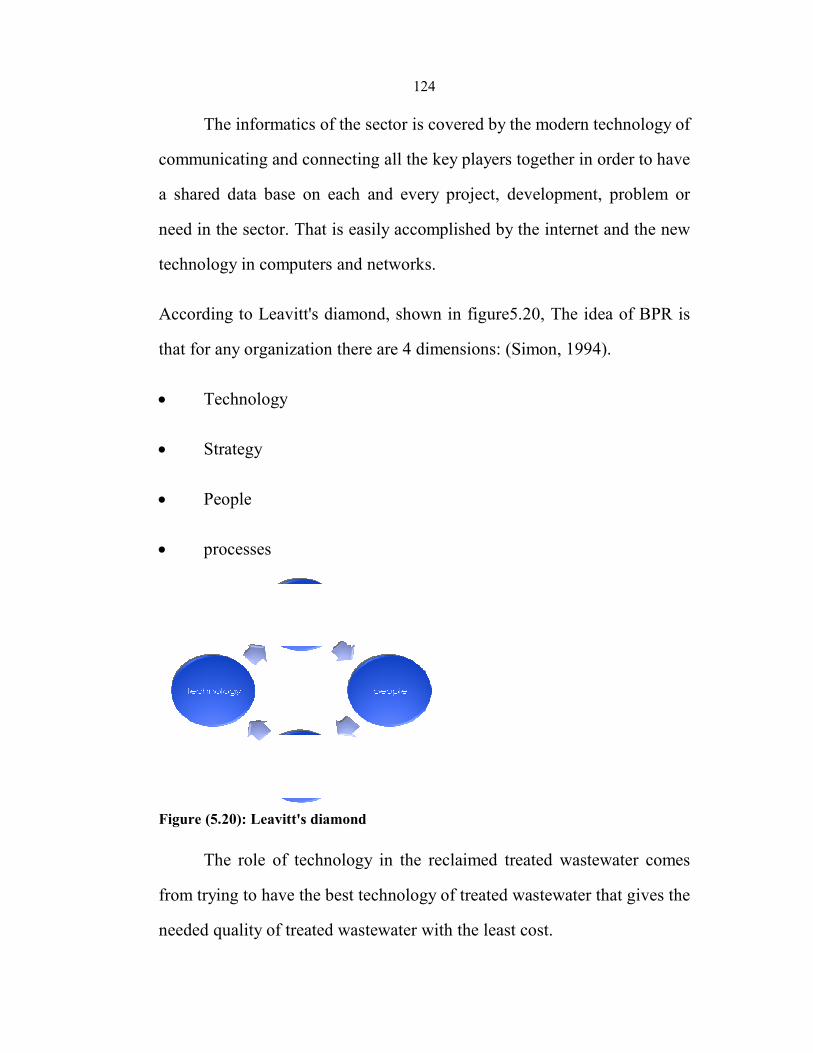
The informatics of the sector is covered by the modern technology of
communicating and connect
a shared data base on each and every project, development, problem or
need in the sector. That is easily accomplish
technology in computers and networks.
According to Leavitt's
that for any organization there are
• Technology
• Strategy
• People
• processes
Figure (5.20): Leavitt's diamond
The role of technology in the reclaimed treated wastewater comes
from trying to have the best technology of treated wastewater that gives the
needed quality of treated wastewater with the least cost.
124
The informatics of the sector is covered by the modern technology of
and connecting all the key players together in order to have
a shared data base on each and every project, development, problem or
need in the sector. That is easily accomplished by the internet and the new
technology in computers and networks.
diamond, shown in figure5.20, The idea of BPR is
that for any organization there are 4 dimensions: (Simon, 1994).
Leavitt's diamond
he role of technology in the reclaimed treated wastewater comes
from trying to have the best technology of treated wastewater that gives the
needed quality of treated wastewater with the least cost.
The informatics of the sector is covered by the modern technology of
together in order to have
a shared data base on each and every project, development, problem or
by the internet and the new
, The idea of BPR is
).
he role of technology in the reclaimed treated wastewater comes
from trying to have the best technology of treated wastewater that gives the

125
The strategy of the sector is identified by the intended purposes of
the sector that should be meet after the re-engineering is finished which are
1. Increase the amount of reclaimed treated wastewater used in
agriculture
2. Increase the amount of reclaimed treated wastewater used in industry
3. Increase the amount of reclaimed treated wastewater used in municipal
uses
4. Increase the acceptability of reclaimed treated wastewater agricultural
and industrial
5. Maintain a constant quality of the reclaimed treated wastewater
products
6. Regulate all aspects of treatment, distribution and use of reclaimed
treated wastewater
People of the sector are divided into two areas; the insiders whom
are the workers and supporters of the sector who have to be trained and
educated quiet well in order to run the sector properly, and the outsiders
like the stakeholders and the benefiters of the sector that forms the public
perception.
The people may also be called the key players of the sector and the
re-engineering process and can be classified according to their position and
need in the sector as follow:

126
7. Municipalities collection of wastewater, treatment, delivery
and costing
8. MOA regulation of irrigation and quality control
9. PWA regulation of treatment levels
10. Farmers irrigation of crops
11. Sellers selling crops
12. Consumers buying crops and products
13. NGO development and research
14. COTAC support, regulation of product costing and
quality control
15. Industry owners use of reclaimed treated wastewater
16. Publicity increase the awareness and acceptability
The processes in general may be defined as relation between two or
more activities and therefore can be divided into three types; management,
operation and supporting processes (Simon, 1994). At the reclaimed treated
wastewater sector as any other sector there is the decisions making
processes as the cost of the reclaimed treated wastewater, the operational
processes as collection and treatment of wastewater and the supporting
processes like regulation and law re-enforcement. All of these processes
may or may not add to the value of the products of the sector.
From the application of BPR theories and concepts on the reclaimed
wastewater sector the faults of the sector appeared and it was as follows:

I. The lack of a general frame work that regulates the key parties
responsibilities in the sector.
II. The lack of enforcement la
III. The lack of public acceptability toward
IV. The lack of a full prospective regarding the purpose of the sector and
the final product fait
Thus a recommended new re
previous purposes and overcome the previ
this new re-engineered sector model is
Figure (5.21): Re-engineered reclaimed wastewater sector
127
The lack of a general frame work that regulates the key parties
responsibilities in the sector.
The lack of enforcement laws that regulates the sector.
lack of public acceptability toward the sector products.
The lack of a full prospective regarding the purpose of the sector and
the final product fait
Thus a recommended new re-engineered sector that applies the
previous purposes and overcome the previous faults should be set to action
engineered sector model is shown in figure 5.21:
engineered reclaimed wastewater sector
The lack of a general frame work that regulates the key parties
the sector products.
The lack of a full prospective regarding the purpose of the sector and
engineered sector that applies the
lts should be set to action

128
Chapter Six
Conclusion and Recommendation and
Future Research Needs

129
Chapter Six
Conclusion and Recommendation and Future Research Needs
6.1. Conclusions and Recommendations:
Regarding identifying the main barriers against wastewater reuse in
Palestine
I. The barriers against treated wastewater was mainly the economical
and social factors.
II. The acceptability of the public is not affected by age, sex of
education it is only affected by the location of living.
III. The economical factor appears in the status factor where the working
parents are more acceptable to the new cheaper product sector.
IV. Increasing the acceptability toward the reclaimed wastewater sector
will increase the profits for the farmers and the suppliers for both
water and reclaimed wastewater.
Regarding assessing the reclaimed wastewater reuse in Palestine
I. A lack of information was obvious in the public sector regarding
water and wastewater issue
II. A lack of enforcing lows and order and complicated unclear
relations between the entities in the sector.
III. Lack of funding and operational cost was a major problem in raising
the sector.

130
IV. The lack of infrastructure for the agriculture and irrigation projects
that uses reclaimed waste water.
Regarding re-engineering the reclaimed wastewater reuse sector
I. A complete awareness campaign about the treated wastewater reuse
should be accomplished on all public scales.
II. A monitoring plan for the treatment, reuse, production and selling of
wastewater and treated wastewater products should be available and
announced to the public for gaining the public trust.
III. A full support from the government and the municipalities toward
the new re-source of water, that would be accomplished by
supporting the treated wastewater in cost issues.
IV. Increase the support for the infrastructure of the irrigation projects
with the reclaimed waste water that will enhance the agricultural
sector, which will provide for more jobs and increase the labour
assassinations.
V. Invest more money and effort throw the government and the NGOs
in research for new technologies and safe application of treated
wastewater in both industry and agriculture.
VI. A national wide cooperation should be available regarding the new
sector between the government the NGOs .

131
6.2. Further research suggestion
I. Reference pricing in Palestine.
II. The effect of using treated wastewater in the Palestine industries.
III. A detailed study about the type and pattern of agriculture in Nablus
Governorate.
IV. A detailed study about the types of Agricultural products sold in
Nablus Governorate emphasizing on its origin.

132
References
Abu Madi, M., Mimi, Z. And Abu-Rmeileh, N. Public Perceptions And
Knowledge Towards Wastewater Reuse In Agriculture In Deir
Debwan, 2007.
Al Masri And Mcneil, 2008. Mohammad N. Al Masri, Laurie S. Mcneil.
Optimal Planning Of Wastewater Reuse Using The Suitability
Approach: A Conceptual Framework For The West Bank, Palestine.
Al-Kharouf, S.M.F. Appraisal Of Socio-Economic And Cultural Factors
Affecting Wastewater Reuse In The West Bank, 2003.
Al-Momani, S.S. State Of The Wastewater Management In The Arab
Countries, 2011. The Hashemite Kingdom Of Jordan, Country
Report. Presented For Arab Water Council (AWC), Expert
Consultation, UAE-Dubai.
Al-Sa`Ed, R., Hind, M. And Tomaleh ,N.. Performance Assessment Of
Al Bireh Wastewater Treatment Plant With Special Emphasis On
Reliability Of Operation Reliability And Effluent Quality For
Reuse, 2008.
Al-Zeer, I. And Al-Khatib, I., Potential Reuse Of Treated Wastewater
For Irrigation In Hebron District Hebron Municipality, Palestine,
2008.
AMAN, 2009.Transparancy And Integrity Ambiance In The
Palestinian Water Sector. April 2009.

ARIJ, Applied Research Institute In Jerusalem, Activities In The Field
Of Wastewater Treatments, Special Report,
Brown, G. W. Value Chains, Value Streams, Value Nets, And Value
Delivery Chains,
Chernoff, H. and Lehmann, E. L.,
Estimates in
Mathematical Statistics,
DCLG :London, 2009
Government: London. January
Exact, 2001. Antea/
Support System On Wastewater
Small Communities, Exact, June
FAO, 2012. FAO VCA
Manual For Version
Organization Of The United Nations, FAO,
FAO, UN Water 2007
Twenty One Century
GCG, Et Al.2012.GITEC CONSULT Gmbh, WE Consult Ltd., CEC.
Consultancy Services For The Elaboration Of A Feasibility Study
For The Project 'Sewerage Nablus East'
133
Applied Research Institute In Jerusalem, Activities In The Field
Of Wastewater Treatments, Special Report, 2008.
. Value Chains, Value Streams, Value Nets, And Value
Delivery Chains, 2009.
and Lehmann, E. L., "The Use of Maximum Likelihood
Tests for Goodness of Fit". The
Mathematical Statistics, 1954.
2009. Department For Communities And Local
Government: London. January2009.
Euroconsult, Technical Report On Decision
Support System On Wastewater Treatment Technologies For
Small Communities, Exact, June 2001.
. FAO VCA-Tool: A Software For Value Chain Analysis
Manual For Version 3.1for The Food And Agriculture
Organization Of The United Nations, FAO, 2012.
, Coping With Water Scarcity-Challenge Of The
Twenty One Century.
.GITEC CONSULT Gmbh, WE Consult Ltd., CEC.
Consultancy Services For The Elaboration Of A Feasibility Study
For The Project 'Sewerage Nablus East'2012.
Applied Research Institute In Jerusalem, Activities In The Field
. Value Chains, Value Streams, Value Nets, And Value
"The Use of Maximum Likelihood
. The Annals of
Department For Communities And Local
Euroconsult, Technical Report On Decision
Treatment Technologies For
A Software For Value Chain Analysis
for The Food And Agriculture
Challenge Of The
.GITEC CONSULT Gmbh, WE Consult Ltd., CEC.
Consultancy Services For The Elaboration Of A Feasibility Study

134
GEC, In Coordination With UNEP/DTIE/IETC, WATER AND
WASTEWATER REUSE An Environmentally Sound Approach
For Sustainable Urban Water Management, 2010.
GIZ, 2012. Water And Wastewater Tariff Study For Nablus
Municipality. June, 2012.
Hayajneh, O.,AL-Sharif, M., Hijazi, A. Wastewater Reuse In Jordan:
USAID Initiative, 2004.
Http://Www.Docstoc.Com/Docs/34404176/Wastewater-Reuse-In-
Jordan
House Of Water And Environment (HWE), Funded By The Austrian
Development Cooperation Through Palestinian Water Authority
(PWA) Understanding And Analyzing The Current Israeli Wastewater
Practices For Trans-Boundary Wastewater Management From
Palestinian Final Report, 2011.
Isaed, R., Ghanem, M. And Abu-Madi, M. Willingness To Use Treated
Wastewater And To Pay For Its Irrigated Products In Dura –
Hebron, 2007.
IWS, Institute For Water Studies, Prospects Of Efficient Wastewater
Managements And Water Reuse In Palestine, Country Paper For
EMWATER Project, Birzeit University, 2006.
Kaplinsky, R. And Morris, M. A HANDBOOK FOR VALUE CHAIN
RESEARCH, 2000.

135
Karbownik Et.Al,2011. Karbownik Andrzej, Dohn Katarzyna,
Sienkiewicz-Małyjurek Katarzyna. Value Chain Analysis Of
Environmental Management In Urban Areas – Case Study:
Metropolitan Association Of Upper Silesia.2011.
LIDMAN,M. Wastewater Wonders, In The Jerusalem Post, 2010.
Http://Www.Jpost.Com/Magazine/Features/Article.Aspx?Id=183787.
Mccauley And Dennis-Perez, 2008. Mccauley Jim And Dennis-Perez
Lisa. Putting Recycled Water To Use In Washington State. Biocycle
May 2008, Vol. 49, No. 5, P. 56.
Mitchell, J., Coles, C. And Keane, J., Upgrading Along Value Chains:
Strategies For Poverty Reduction In Latin America. Trade And
Poverty In Latin America. Briefing Paper, 2009.
Mogheir, Et. Al, 2005. Mogheir Y., Abu Hujair T., Zomlot Z., Ahmed A.
And D. Fatta. Treated Wastewater Reuse In Palestine.
Magutu. Et. al , 2009.Business process reengineering for competitive
advantage, key factors that may lead to the success or failure of
the BPR Implementation (The Wrigley Company),Peterson
Obara Magutu, Stephen Onserio Nyamwange, Godwin Kiplimo
Kaptoge.
Murni Po, et.al, 2003. Murni Po, Juliane D. Kaercher And Blair E.
Nancarrow. Literature Review Of Factors Influencing Public

136
Perceptions Of Water Reuse. Csiro Land And Water Technical
Report 54/03, December 2003.
Muthu, S., Whitman, L., And Cheraghi, S.H. BUSINESS PROCESS
REENGINEERING: A CONSOLIDATED METHODOLOGY,
1999.
Nazer, D.W., Siebel, M.A., Van Der Zaag, P., Mimi, Z., And Gijzen, H.J..
WATER FOOTPRINT OF THE PALESTINIANS IN THE WEST
BANK. Paper No. JAWRA-07-0019-P Of The Journal Of The
American Water Resources Association (JAWRA) , 2007.
NEOCT, 2011. National Expert Optimum For Consultations And
Training. Study Of The Economic Opportunities In Nablus
Governorate And The North.2011.
PARC, Palestinian Agricultural Relief Committees. Presentation
Presented In First Scientific Day Organized By Moa, 2005.
PCBS, Palestinian Central Bureau Of Statistics, 2008. Www.Pcbs.Gov.Ps.
PCBS,2010. Palestinian Central Bureau Of Statistics, 2010. Nablus
Governorate Statistical Yearbook, No. 2. Ramallah – Palestine.
PCBS, 2011. Palestinian Central Bureau Of Statistics. Water Supply
Report, 2011.
PCBS, 2013. Palestinian Central Bureau Of Statistics, 2013,
Agricultural Census 2013, Final Results – Nablus Governorate.
Ramallah, Palestine.

137
PHG, Palestinian Hydrology Group. Decentralized Rural And Small
Community Sanitation And Reuse, 2008. Http://Www.Phg.Org.
PMNE, Palestinian Ministry Of National Economy, 2012.
www.Mne.Gov.Ps.
Porter, Michael E., "Competitive Advantage". 1985, Ch. 1, Pp 11-15.
The Free Press. New York.
Putler S. Daniel, 1992. Incorporating Reference Price Effects Into A
Theory Of Consumer Choice .Source: Marketing Science, Vol. 11,
No. 3 .Summer, 1992.
PWA 2014, Water Supply Report For 2014.
PWA 2012 B, Water And Waste Water Sector Plan.
PWA, BASIC NEEDS AND DEVELOPMENT ONGOING AND
PROPOSED PROJECTS BY GOVERNORATE, 2009.
PWA, Palestinian Water Authority (1998) Water Sector Strategic
Planning Study. Final Report, Volume IIIB. Focal Area 7 –Waste
Water Management & Re-Use.
PWA, Regional Experience On Wastewater Treatment And
Reuse,2013,PWA , Ramallah ,Palestine.
Rowe, Mason, Dickel, Mann, And Mockler. "Strategic Management: A
Methodological Approach". 4th Edition. Addison-Wesley; 1994.

138
Saleh ,M.A. Exploratory Study On The Performance Of Newly
Constructed Nablus West Waste Water Treatment Plant Under
Different Load Condition;2014.
Saleh, R.M. A BENEFIT-COST ANALYSIS OF TREATED
WASTEWATER REUSE FOR IRRIGATION IN TUBAS, 2009.
Samhan, Et Al.,2010. Samhan S, Al-Sa’ed R., Assaf K., Friese K.,
Afferden M., Muller R., Tumpling W., Ghanem M., Ali W., And
Zimmo O. Wastewater Management Overview in The Occupied
Palestinian Territory.
Schatzberg, L., Gupta, V.K.. Using The Value Chain Model As A
Method Of Prioritizing Green Reengineering Efforts, 2000.
Sharma, K.D., Pathania, M.S. And Lal, H., Booker 1994 , Value Chain
Analysis And Economical Viability Of Agro-Processing Industries
In Himachal Pradesh. Agricultural Economics Research Review
Vol. 23 (Conference Number) 2010 Pp 515-522
Simon, K.A., TOWARDS A THEORETICAL FRAMEWORK For
Business Process Reengineering, June 1994.
TATA Consultancy Services, Re Engineering The Broadcasting Value
Chain, 2010.
THCU,1999. The Health Communication Unit. Conducting Census
Research Version 2.0 March 31, 1999.

139
Trottier J,1999. Hydro politics in the west bank and Gaza strip.
Palestinian Academic Society for the Study of International
Affairs,1999.
Vigneswaran, S., Sundaravadivel, S., RECYCLE AND REUSE OF
DOMESTIC WASTEWATER, In Wastewater Recycle, Reuse And
Reclamation, 2004.[Http://Www.Eolss.Net]
WVDOH, 2004. Engineering Division Of Highways, West Virginia
Department Of Transportation. VALUE ENGINEERING
MANUAL. January 1, 2004
York, Et Al., 2010. York David W., Holden FL Robert, Sheikh CA
Bahman, CA Larry Parsons. SAFETY AND SUITABILITY OF
RECYCLED WATER FOR IRRIGATION OF EDIBLE CROPS.
Zimmo, O., Petta, G., Prospects Of Efficient Wastewater Management
And Water Reuse In Palestine, Country Study, Prepared Within
The Framework Of The Emwater-Project “Efficient Management
Of Wastewater, Its Treatment And Reuse In The Mediterranean
Countries”, 2005.

140
Appendices

141
Ap
pen
dix
I:
Jord
an
ex
isti
ng
trea
tmen
t P
lan
ts
Tre
atm
ent
Pa
lnt
Ow
ner
S
erv
ece
Lo
cati
on
Y
ear
of
con
stru
ctio
n
Dis
cha
rge
qu
anti
ty
Eff
luen
t d
isch
arge
re
use
Ab
u N
sair
Jo
rdan
Wat
er
Co
mp
any-
Miy
ahu
na
Abu
Nuse
ir a
rea
and
its
vic
init
y
19
86
(4
00
0 m
3)
per
day
W
adi
Bir
ein
p
arti
ally
use
d f
or
irri
gat
ion f
od
der
Alj
iza
an
d
Ta
lbiy
a
Jord
an W
ater
C
om
pan
y-
Miy
ahu
na
Alj
iza
po
pu
lati
on
and
Tal
biy
a C
amp
20
09
(4
000
-60
00
m
3)
per
day
n
eig
hb
ou
rin
g
lan
ds
safe
irr
igat
ion
Al-
Fh
ais
an
d
Ma
his
P
ub
lic
sect
ore
A
l-F
hai
s an
d
Mah
is
late
19
90s
(24
00
m3
) p
er d
ay
nei
gh
bou
rin
g
lan
ds
irri
gat
ion
an
d
fod
der
Alm
afr
aq
P
ub
lic
sect
ore
M
afra
q c
ity
19
88
(1
80
0 m
3)
per
day
n
eig
hb
ou
rin
g
lan
ds
irri
gat
ion
of
tree
s an
d f
odd
er
Aq
aba
Mec
ha
nic
al
Aq
aba
Wat
er
Co
mp
any
60
% o
f th
e w
atew
ater
of
aqab
a ci
ty
20
05
(1
20
00 m
3)
per
day
n
eig
hb
ou
rin
g
lan
ds
ind
ust
rial
use
fo
r p
ho
sph
ate
pla
nts
Aq
ab
a N
atu
ral
Aq
aba
Wat
er
Co
mp
any
40
% o
f th
e w
atew
ater
of
aqab
a ci
ty
19
86
(9
00
0 m
3)
per
day
n
eig
hb
ou
rin
g
lan
ds
irri
gat
ion
an
d W
ild
li
fe r
esto
rati
on
Ass
am
ra
Na
tura
l S
tab
iliz
ati
on
P
on
dsl
Pub
lic
sect
ore
A
mm
an,
Zar
qa
and R
uss
eifa
19
85
(6
8,0
00
m
3/d
ay)
Wad
i D
hle
il
area
an
d t
he
Jord
an V
alle
y's
do
wn
stre
am
Kin
g T
alal
R
eser
vo
ir
cro
p i
rrig
atio
n
Ass
am
ra
Mec
ha
nic
al
(exp
an
sion
) P
ub
lic
sect
ore
A
mm
an a
nd
Z
arqa
20
07
2
68
,00
0 m
3)
per
day

142
Tre
atm
ent
Pa
lnt
Ow
ner
S
erv
ece
Lo
cati
on
Y
ear
of
con
stru
ctio
n
Dis
cha
rge
qu
anti
ty
Eff
luen
t d
isch
arge
re
use
Ba
qa
'a
Bio
log
ica
l F
ilte
rs
Pub
lic
sect
ore
B
aqa'
a C
amp,
Ain
A
l-B
ash
a an
d t
he
surr
ou
nd
ing
are
as
19
88
up
dat
ed
20
00
(50
00
u
pd
ated
to
1
49
00
0 m
3)
per
day
wad
is t
o K
ing
T
alal
Dam
ir
rig
atio
n
Irb
id
Pub
lic
sect
ore
par
tial
ly s
erv
ing
Ir
bid
Go
ver
nora
te
and
the
surr
ou
nd
ing
are
as
19
87
(1
19
00
0 m
3)
per
day
N
ort
her
n G
ho
r ar
ea
irri
gat
ion
Ja
rash
P
ub
lic
sect
ore
par
t o
f Ja
rash
v
illa
ge
19
83
up
dat
e 19
98
(80
0 u
pd
ated
to
35
00 m
3)
per
day
Par
t o
f th
e ef
flu
ent
wat
er i
s use
d l
oca
lly a
t p
lan
t si
te ;
the
rem
ain
der
is
dra
ined
to
Kin
g
Tal
al D
am
irri
gat
ion
fo
dd
er,i
rrig
atio
n
afte
r m
ixin
g
Ko
ufr
an
jah
P
ub
lic
sect
ore
K
ou
fran
jah A
rea
19
90
(1
90
0 m
3)
per
day
Par
t is
d
isch
arg
ed i
nto
W
adi
Ku
fran
ja
irri
gat
ing
tre
es a
nd
cro
ps
wit
hin
th
e vic
init
y o
f th
e p
lant
Ma
'an
nat
ura
l A
qab
a W
ater
C
om
pan
y
Ma'
an c
ity
19
89
(1
59
0 m
3)
per
day
n
eig
hb
ou
rin
g
lan
ds
irri
gat
ing
tre
es a
nd
fod
der
Ma'
an
(
exp
an
sion
) A
qab
a W
ater
C
om
pan
y
Ma'
an c
ity
20
08
(7
00
0 m
3)
per
day
n
eig
hb
ou
rin
g
lan
ds
irri
gat
ion
Ma
da
ba
Pub
lic
sect
ore
M
adab
a ci
ty
19
88
up
dat
e 20
03
(7
60
00 m
3)
per
day
n
eig
hb
ou
rin
g
lan
ds
irri
gat
ion
of
tree
s an
d f
odd
er
Ra
mth
a
Pub
lic
sect
ore
R
amth
a ci
ty
19
88
(1
92
00 m
3)
per
day
n
eig
hb
ou
rin
g
lan
ds
irri
gat
ing
tre
es a
nd
cro
ps

143
Tre
atm
ent
Pa
lnt
Ow
ner
S
erv
ece
Lo
cati
on
Y
ear
of
con
stru
ctio
n
Dis
cha
rge
qu
anti
ty
Eff
luen
t d
isch
arge
re
use
Sal
t P
ub
lic
sect
ore
S
alt
city
1
980
up
dat
e 19
97
(30
00
u
pd
ated
to
76
00
m3
) p
er
day
nei
gh
bou
rin
g
land
s an
d w
adi
shu'ib
irri
gat
ion
of
tree
s an
d f
odd
er
Ta
fela
h
Pub
lic
sect
ore
P
art
of
al T
afel
ah
city
19
88
(1
60
0 m
3)
per
day
dis
char
ge
to
Gh
or
Fif
a
loca
l ir
rigat
ion o
f ra
ined
tre
es w
ith
in
the
pla
nt
Wa
di
Ara
b/D
oga
rah
P
ub
lic
sect
ore
par
t of
po
pu
lati
on
o
f Ir
bid
G
ov
erno
rate
an
d
surr
ou
nd
ing
area
s.
late
19
90s
(21
800 m
3)
per
day
N
ort
her
n G
ho
r ar
ea
irri
gat
ion
Wa
di
Ha
ssan
P
ub
lic
sect
ore
Ir
bid
pop
ula
tion
an
d t
he
nei
gh
bo
rin
g a
rea
20
01
(1
60
0 m
3)
per
day
n
eig
hb
ou
rin
g
lan
ds
safe
irr
igat
ion
reu
se
Wa
di
Mou
sa
Aq
aba
Wat
er
Co
mp
any
P
etra
an
d w
adi
mo
usa
20
01
(3
50
0 m
3)
per
day
n
eig
hb
ou
rin
g
lan
ds
irri
gat
ion
fo
r an
ar
ea o
f (1
00
0)
Do
nu
ms
of
agri
cult
ura
l la
nd
s p
rod
uci
ng
clo
ver
, fr
uit
tre
es a
nd
b
arle
y.
Wa
di
Sai
r Jo
rdan
Wat
er
Co
mp
any-
Miy
ahu
na
Wad
i A
s-S
ir a
nd
its
nei
ghb
ori
ng
pop
ula
tion
19
97
(4
00
0 m
3)
per
day
w
adis
to K
afre
in
Dam
in
dir
ect
irri
gat
ion

144
Appendix II
)a (المزارع ) سوف يتم في ورشة العمل توزيع الاستبيان(
معلومات عامة
:الجنس .1
انثى ذكر
:العمر .2
61اكثر من 60- 31 30- 18
:التحصيل العلمي .3
اعلى من ذلك بكالوريوس توجيهي أمي
:مكان السكن .4
-------------- :اسم المحافظة المخيم القرية المدينة
:هل لديك ارض منتجة .1
لا نعم و اوزع محصولي نعم وابيع محصولي
معلومات خاصة بالاستبيان
:ما هي المحاصيل الزراعية التي تزرعها .1
السلطة خضار خضار الطبخ الحمضيات فواكهه الشعير والاعلاف اللوزيات والزيتون الحبوب و البقول
:ما نوع الاسمدة التي تستعملها .2
----- :مثل،غير ذلك اسمدة عضوية اسمدة كيماوية
:ما هي طريقة الزراعة المستعملة .3
----- مثل،ذكرغير ما بيوت بلاستيك زراعة مكشوفة
:هل لديك اي مشكلات في المياه .4
صعوبة الوصول لمصدر المياه نقص في كميات المياه
تكلفة المياه عالية

145
:ما هو مصدر المياه لديك .5
الامطار بئر زراعي خاص بئر زراعي للدولة مكروت مياه عادمة معالجة مياه عادمة البلديمصدر المياه
:اصيل الزراعيةفي ري المح هل من الممكن ان تستعمل المياه العادمة الغير معالجة .6 لا نعم
لا نعم :هل تعرف من يستعملها .7
: في اي مزروعات .8
خضار السلطة خضار الطبخ الحمضيات فواكهه اللوزيات والزيتون الحبوب و البقول
الشعير و الاعلاف
ما هو اعلى سعر ممكن لكوب ------ والعادمة ----------- :النقية كم تشتري كوب المياه .9 ------- - المياه العادمة المعالجة
------- لا،لماذا نعم :في الزراعة هل من الممكن ان تستعمل المياه المعالجة .10 --------------
:في اي مزروعات .11
خضار السلطة خضار الطبخ الحمضيات فواكهه اللوزيات والزيتون الحبوب و البقول
الشعير و الاعلاف
لا نعم :هل تعرف من يستعملها .12
:في اي مزروعات .13
خضار السلطة خضار الطبخ الحمضيات فواكهه الزيتوناللوزيات و الحبوب و البقول الشعير و الاعلاف
--------- بسبب،لا نعم :هل ستروج المحاصيل الزراعية المسقية بالمياه المعالجة .14 ---------
):نوعية المياه(هل ستعلم الناس بمصدر المحاصيل الزراعية .15
لا حتى لو لم يسال،نعم اذا سأل،نعم

146
اقل نفس السعر العادي :كم تتوقع ان يكون سعر هذه المحاصيل الزراعية .16 اكثر
صبنف نفس السعر للمزروعات العادية :بكم ستبيع هذه المحاصيل الزراعية .17 مربح معقول مع)الاقل(سعرها
--------------اي انواع،نعم : هل تتوقع من الناس شراء هذه المحاصيل الزراعية .18 ------------
---------------------------------- لا،لماذا
.1 :ماذا تتوقع من الدولة لدعم هذا المنتج .19
2.
3.
)b( ك الاخير المستهل )عامة المجتمع(
معلومات عامة
:الجنس .1
انثى ذكر
:العمر .2
61اكثر من 60- 31 30- 18
:التحصيل العلمي .3
اعلى من ذلك بكالوريوس توجيهي أمي
:مكان السكن .4
-------------- :اسم المحافظة المخيم القرية المدينة
:الحالة الاسرية .5
فرد غير منفق فرد منفق رب اسرة غير عامل ة اسرة عامل/رب
معلومات خاصة بالاستبيان
:كم مره تأكل الخضراوات و الفواكه اسبوعيا .1
يوميا على الاكثر اربع مرات على الاكثر مرتين

147
:كيف تغسل الخضار و الفاكهه .2
مواد معقمة بالماء والصابون بالماء
:متى تغسل الخضار و الفاكهه .3
قبل وضعها بالثلاجه قبل الاكل مباشرة
:من اين تشتري الخضار و الفاكهه .4
من دكان خضار محدد من اي دكان خضار في الطريق
الشرقي او الغربيمن سوق الخضار من حسبة الخضار في المدينة
من السيارة المتنقلة من القرى او المزارعين مباشرة
:أي نوع من الخضار و الفواكهه تشتري .5
الخضار و الفاكهه العضوية بسعر عالي الخضار والفاكهه العادية بسعر متوسط
الخضار و الفاكهه المسقية بمياه عادمة غير معالجة بسعر رخيص
لا نعم :هل تسأل عن مصدرها .6
لا نعم :هل تثق بإجابة البائع .7
:لديك معلومات حول كميات المياه المتوفرة في فلسطينهل .8
نعم،وهي غير كافية نعم ،وهي كافية لا
:اي من هذه الحلول تقترح .9
التقليل من المياه للزراعة للزراعة شراء المياه من الاسرائيلين
التقليل من المياه المستعملة في الصناعة التقليل من المياه للاستعمال المنزلي استعمال المياه العادمة المعالجة في الزراعة استعمال المياه العادمة في الزراعة استعمال المياه العادمة المعالجة في الصناعة
المنزلي استعمال المياه العادمة المعالجة للاستهلاك
)مثلا تنظيف الشوارع(استعمال المياه العادمة المعالجة للاستهلاك البلدي
استعمال طرق الري الحديثة
:اي نوع من المحاصيل الزراعية توافق على شرائها في حالة ريها بالمياه العادمة المعالجة .10
خضار السلطة خضار الطبخ الحمضيات فواكهه لا شيء مما ذكر اللوزيات والزيتون الحبوب و البقول
لا نعم :المياه المسقية بها هل تفضل فصل المحاصيل الزراعية حسب مصدر .11

148
)c( المصانع والمحاجر )مقابلات ميدانية او بدعوتهم لورشة العمل(
اسم المصنع .1
مكان المصنع .2
المصنعةالسلع .3
القدرة الانتاجية اليومية .4
مساحة المصنع .5
العمليات الرئيسية في التصنيع .6
العمليات التي تدخل فيها المياه .7
كميات المياه المستهلكة .8
سعر كوب الماء .9
العمليات التي يمكن استعمال المياه المعالجة فيهه ولماذا .10
امكانية استعمال المياه المعالجة و توقعات الاسعار .11
التنظيفعمليات .12
كيفية دعم الدولة لهذه السلع .13
تأثير استعمال المياه على سعر السلعة او لا .14
)d( البائع
معلومات عامة
:العمر .2
61اكثر من 60- 31 30- 18
:التحصيل العلمي .3
اعلى من ذلك بكالوريوس توجيهي أمي
:مكان السكن .4
-------------- :اسم المحافظة المخيم القرية المدينة
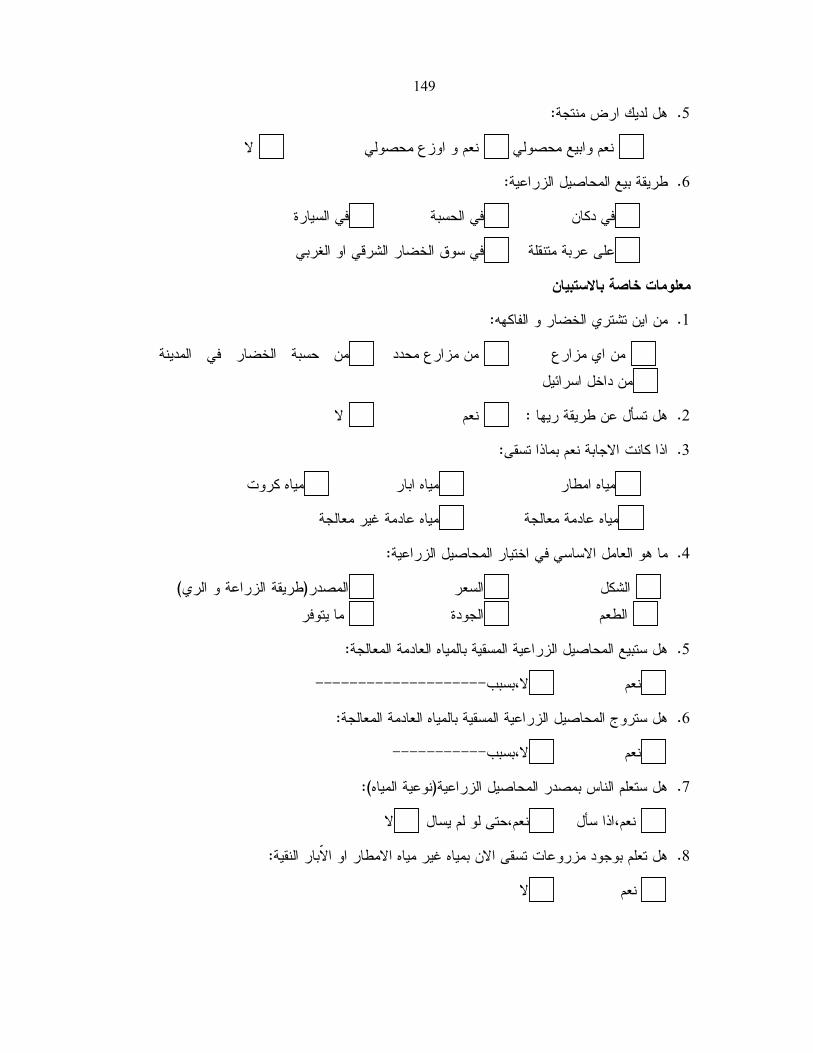
149
:هل لديك ارض منتجة .5
لا نعم و اوزع محصولي نعم وابيع محصولي
:طريقة بيع المحاصيل الزراعية .6
في السيارة في الحسبة في دكان
في سوق الخضار الشرقي او الغربي على عربة متنقلة
معلومات خاصة بالاستبيان
:من اين تشتري الخضار و الفاكهه .1
الخضار في المدينةمن حسبة من مزارع محدد من اي مزارع
من داخل اسرائيل
لا نعم :هل تسأل عن طريقة ريها .2
:اذا كانت الاجابة نعم بماذا تسقى .3
مياه كروت مياه ابار مياه امطار
مياه عادمة غير معالجة مياه عادمة معالجة
:ما هو العامل الاساسي في اختيار المحاصيل الزراعية .4
)طريقة الزراعة و الري(المصدر السعر الشكل
ما يتوفر الجودة الطعم
:المعالجة العادمة ستبيع المحاصيل الزراعية المسقية بالمياههل .5
-------------------- بسبب،لا نعم
:المعالجة العادمة لمحاصيل الزراعية المسقية بالمياههل ستروج ا .6
----------- بسبب،لا نعم
):نوعية المياه(هل ستعلم الناس بمصدر المحاصيل الزراعية .7
لا حتى لو لم يسال،نعم اذا سأل،نعم
:هل تعلم بوجود مزروعات تسقى الان بمياه غير مياه الامطار او الاّبار النقية .8
لا نعم

150
:ماذا يسقى بهذه المياه .9
خضار السلطة خضار الطبخ الحمضيات فواكهه
لا شيء مما ذكر زيتوناللوزيات وال الحبوب و البقول
:كم تتوقع ان يكون سعر هذه المحاصيل الزراعية .10
اكثر اقل نفس السعر العادي
:)ان كان سعرها اقل من العادية(بكم ستبيع هذه المحاصيل الزراعية .11
بنفس سعرها مع مربح معقول نفس السعر للمزروعات العادية
:هل تتوقع من الناس شراء هذه المحاصيل الزراعية .12
-------------------------- اي انواع،نعم
---------------------------------- لا،لماذا
..........................2.................. .1 :المنتجماذا تتوقع من الدولة لدعم هذا .13

151
Appendix III
:تحليل العلاقات بين الأسئلة والخصائص العامة للاستبان
)a (المزارع:
:النتائج المتعلقة بالفرضية الأولى .1
:ونصت الفرضية الأولى على
بين العمر، اسئلة الدارسة) α =0.05(لا توجد علاقة ذات دلالة إحصائية على مستوى
) 1(، ويوضح الجدول Chi Square testولفحص الفرضية، فقد تم استخدام اختبار مربع كاي
.نتائج فحص الفرضية
نتائج اختبار مربع كاي بين العمر، واسئلة الدراسة): "1(الجدول
اسئلة الدراسة
درجات العمرقيمة مربع
كاي
مستوى
- 18 الدلالة30
31 -60
اكثر
61من الحرية
ما نوع الاسمدة التي تستعملها
3 9 0 كيماوية اسمدة
5 11 1 اسمدة عضوية 0.649 0.864 2
0 0 0 غير ذلك
ماهي طريقة الزراعة المستعملة
7 17 1 مكشوفة زراعة
2 0.196 0.907 1 3 0 بيوت بلاستيك
غير ........ ماذكر،مثل
0 0 0
أي مشكلات في هل لديك المياة
كميات نقص في المياه
1 8 4
صعوبة الوصول 0.01 4.551 4 لمصدر المياه
0 3 3
1 9 0 تكلفة المياه عالية
0.549 6.888 8 4 3 1 مكروت ماهو مصدر المياه لديك

152
0 1 0 بئر زراعي للدولة
1 3 0 بئر زراعي خاص
3 11 0 الامطار
المياة البلديمصدر 0 2 0
0 0 0 مياه عادمة
0 0 0 مياة عادمة معالجة
هل من الممكن ان نستعمل المياه العادمة الغير معالجة
في ري المحاصيل الزراعية
2 5 0 نعم
2 0.330 0.848
6 15 1 لا
هل تعرف من يستعملها 3 6 0 نعم
2 0.616 0.735 5 14 1 لا
مزروعاتفي أي
1 1 0 فواكهه
12 10.069 0.610
0 3 1 الحمضيات
0 2 0 خضار الطبخ
1 1 0 خضار السلطة
1 3 0 الحبوب والبقول
3 5 0 اللوزيات والزيتون
0 3 0 والشعير والاعلاف
هل من الممكن ان نستعمل المياه المعالجة في الزراعة
8 18 1 نعم2 0.967 0.617
0 2 0 لا
هل تعرف من يستعملها 2 6 0 نعم
2 0.466 0.792 6 14 1 لا
في أي مزروعات
1 1 0 فواكهه
12 6.991 0.858
2 2 1 الحمضيات
0 1 0 خضار الطبخ
0 1 0 خضار السلطة
1 3 0 الحبوب والبقول
3 7 0 اللوزيات والزيتون
1 4 0 والاعلافالشعير
هل ستروج المحاصيل الزراعية المسقية بالمياة
المعالجة
8 17 1 نعم
2 1.506 0.471 0 3 0 ......لا،بسبب
هل ستعلم الناس بمصدر المحاصيل الزراعية
3 6 1 نعم اذا سال4 2.256 0.689
2 7 0 نعم حتى لو لم يسال

153
3 7 0 لا اذا سال،نعم) نوعية المياه(
كم تتوقع ان يكون سعر هذه المحاصيل الزراعة
4 15 1 نفس السعر العادي
3 4 0 اقل 0.704 2.175 4
1 1 0 اكثر
بكم ستبيع هذه المحاصيل الزراعية
نفس السعر للمزروعات العادية
1 16 6
2 0.357 0.839 ) الاقل(بنفس سعرها
مع مربح معقول0 4 2
من الناس شراء هل تتوقع هذه المحاصيل الزراعية
3 12 0 أي انواع، نعم2 2.268 0.322
5 8 1 لماذا، لا
)α =0.01(دالة إحصائياً عند مستوى الدلالة *
) .4(إلى وجود علاقة ذات دلالة احصائية بين العمر و الاسئلة رقم ) 1(يشير الجدول
:النتائج المتعلقة بالفرضية الثانية .2
:ونصت الفرضية الثانية على
بين التحصـيل العلمـي، اسـئلة ) α =0.05(لا توجد علاقة ذات دلالة إحصائية على مستوى
الدارسة
) 2(، ويوضح الجدول Chi Square testولفحص الفرضية، فقد تم استخدام اختبار مربع كاي
.نتائج فحص الفرضية
نتائج اختبار مربع كاي بين التحصيل العلمي، واسئلة الدراسة :)2(الجدول
اسئلة الدراسة
التحصيل العلمي
درجاتقيمة مربع
كاي
مستوى بكالوريوس توجيهي امي الدلالة
اعلى من ذلك
ما نوع الاسمدة التي
تستعملها
0 5 6 1 اسمدة كيماوية
1 5 8 3 عضوية اسمدة 0.690 1.467 3
1 0 0 0 ذلك غير
0.658 1.607 3 1 9 11 4 زراعة مكشوفةماهي

154
طريقة الزراعة المستعملة
0 1 3 0 بلاستيك بيوت
ماذكر، غير......
مثل0 0 0 0
هل لديك أي
مشكلات في المياة
نقص في كميات المياه
3 6 3 1
الوصول صعوبة 0.540 5.030 6 لمصدر المياه
1 2 3 0
0 0 6 0 المياه عالية تكلفة
ماهو مصدر المياه لديك
0 0 6 2 مكروت
12 16.505 0.01
0 0 1 0 زراعي للدولة بئر
0 1 2 1 زراعي خاص بئر
1 9 4 0 الامطار
0 0 1 1 المياة البلدي مصدر
1 0 0 0 عادمة مياه
0 0 0 0 عادمة معالجة مياة
هل من الممكن ان نستعمل المياه العادمة الغير معالجة في ري
المحاصيل الزراعية
0 2 3 2 نعم
3 1.929 0.587
1 8 11 2 لا
هل تعرف من
يستعملها
0 4 4 1 نعم
3 0.933 0.817 1 6 10 3 لا
في أي مزروعات
0 0 2 0 فواكهه
18 24.951 0.126
0 2 1 1 الحمضيات
0 0 1 1 الطبخ خضار
1 0 0 1 السلطة خضار
0 2 2 1 الحبوب والبقول
0 1 6 0 اللوزيات والزيتون

155
0 2 1 0 والشعير والاعلاف
هل من الممكن ان نستعمل المياه
المعالجة في
الزراعة
1 9 14 3 نعم
3 3.303 0.347 0 1 0 1 لا
هل تعرف من
يستعملها
0 3 4 1 نعم
3 0.430 0.934 1 7 10 3 لا
في أي مزروعات
0 0 1 1 فواكهه
18 18.184 0.444
0 3 2 0 الحمضيات
0 0 0 1 خضار الطبخ
0 0 1 0 خضار السلطة
0 2 1 1 الحبوب والبقول
0 4 5 1 اللوزيات والزيتون
1 1 3 0 الشعير والاعلاف
هل ستروج المحاصيلالزراعية المسقية بالمياة المعالجة
1 8 14 3 نعم
3 3.662 0.300 0 2 0 1 ......لا،بسبب
هل ستعلم الناس
بمصدر المحاصيل الزراعية
نوعية () المياه
اذا ،نعم سال
0 2 5 3 نعم اذا سال
6 7.029 0.318
نعم حتى لو لم يسال
0 5 3 1
0 5 4 1 لا
كم تتوقع ان يكون سعر هذه المحاصيل
الزراعة
1 6 11 2 نفس السعر العادي
6 6.862 0.334
0 4 1 2 اقل
0 0 2 0 اكثر

156
بكم ستبيع هذه
المحاصيل الزراعية
نفس السعر للمزروعات العادية
3 13 6 1
بنفس سعرها 0.246 4.144 3مع مربح ) الاقل(
معقول
1 1 4 0
هل تتوقع من الناس
هذه شراء المحاصيل الزراعية
1 3 8 3 أي انواع، نعم
3 3.856 0.277 0 7 6 1 لماذا، لا
)α =0.01(دالة إحصائياً عند مستوى الدلالة *
إلى وجود علاقة ذات دلالة احصائية بين التحصيل العلمي و الاسـئلة رقـم ) 2(يشير الجدول )5.( :النتائج المتعلقة بالفرضية الثالثة .3
:الفرضية الثالثة على ونصت
بين مكان السكن، اسئلة الدارسة) α =0.05(لا توجد علاقة ذات دلالة إحصائية على مستوى
) 3(، ويوضح الجدول Chi Square testولفحص الفرضية، فقد تم استخدام اختبار مربع كاي .نتائج فحص الفرضية
واسئلة الدراسةنتائج اختبار مربع كاي بين مكان السكن، :)3(الجدول
اسئلة الدراسة
مكان السكن
درجاتقيمة مربع
كاي
مستوى مخيم قرية مدينة الدلالة
ما نوع الاسمدة التي تستعملها
0 12 0 اسمدة كيماوية
0 16 1 عضوية اسمدة 0.393 0.731 1
0 24 0 ذلك غير
ماهي طريقة الزراعة المستعملة
0 4 1 زراعة مكشوفة
0 0 0 بلاستيك بيوت 0.684 0.166 1
0 0 0 ماذكر،مثل غير........
هل لديك أي مشكلات في المياة
0 12 1 نقص في كميات المياه
2 1.272 0.529 الوصول لمصدر صعوبة
المياه0 6 0
0 10 0 المياه عالية تكلفة

157
ماهو مصدر المياه لديك
0 7 1 مكروت
4 2.719 0.606
0 1 0 زراعي للدولة بئر
0 4 0 زراعي خاص بئر
0 14 0 الامطار
0 2 0 المياة البلدي مصدر
0 0 0 عادمة مياه
0 0 0 عادمة معالجة مياة
هل من الممكن ان نستعمل المياه العادمة الغير معالجة في ري المحاصيل الزراعية
0 6 1 نعم
1 3.255 0.071
0 22 0 لا
هل تعرف من يستعملها 0 9 0 نعم
1 0.466 0.495 0 19 1 لا
في أي مزروعات
0 2 0 فواكهه
6 2.214 0.899
0 4 0 الحمضيات
0 2 0 الطبخ خضار
0 2 0 السلطة خضار
0 4 0 الحبوب والبقول
0 7 1 اللوزيات والزيتون
0 3 0 والشعير والاعلاف
هل من الممكن ان نستعمل المياه المعالجة
في الزراعة
0 26 1 نعم
1 0.077 0.782 0 2 0 لا
هل تعرف من يستعملها 0 8 0 نعم
1 0.395 0.530 0 20 1 لا
في أي مزروعات
0 2 0 فواكهه
6 6.222 0.399
0 5 0 الحمضيات
0 1 0 خضار الطبخ
0 1 0 خضار السلطة
0 3 1 الحبوب والبقول
0 10 0 اللوزيات والزيتون
0 5 0 الشعير والاعلاف
هل ستروج المحاصيل الزراعية المسقية بالمياة
المعالجة
0 25 1 نعم
1 0.120 0.730 0 3 0 ......لا،بسبب

158
هل ستعلم الناس بمصدر المحاصيل الزراعية
اذا،نعم) نوعية المياه( سال
0 9 1 نعم اذا سال
2 1.968 0.374 0 9 0 نعم حتى لو لم يسال
0 10 0 لا
كم تتوقع ان يكون سعر هذه المحاصيل الزراعة
0 20 0 نفس السعر العادي
0 6 1 اقل 0.374 1.968 2
0 2 0 اكثر
بكم ستبيع هذه المحاصيل الزراعية
نفس السعر للمزروعات العادية
0 23 0
2 3.255 0.196 مع ) الاقل(بنفس سعرها
مربح معقول1 5 0
هل تتوقع من الناس شراء هذه المحاصيل
الزراعية
0 14 1 أي انواع، نعم
1 0.967 0.329 0 14 0 لماذا، لا
)α =0.01(دالة إحصائياً عند مستوى الدلالة *
إلى عدم وجود علاقة ذات دلالة احصائية بين مكان السكن و اسئلة الدراسة ) 3(يشير الجدول
:النتائج المتعلقة بالفرضية الرابعة.4
:ونصت الفرضية الرابعة على
بـين الارض المنتجـه، اسـئلة ) α =0.05(لا توجد علاقة ذات دلالة إحصائية على مستوى
الدارسة
) 4(، ويوضح الجدول Chi Square testولفحص الفرضية، فقد تم استخدام اختبار مربع كاي
.نتائج فحص الفرضية

159
نتائج اختبار مربع كاي بين الارض المنتجه، واسئلة الدراسة): 4(الجدول
اسئلة الدراسة
الارض المنتجه
درجاتقيمة مربع
كاي
مستوى نعم وابيع الدلالة
محصولي
واوزع نعم محصولي
لا
ما نوع الاسمدة التي تستعملها
0 7 5 اسمدة كيماوية
2 5 10 عضوية اسمدة 0.198 3.234 2
0 0 0 ذلك غير
ماهي طريقة الزراعة المستعملة
2 11 12 زراعة مكشوفة
0 1 3 بلاستيك بيوت 0.575 1.107 2
0 0 0 ماذكر،مثل غير........
أي مشكلات هل لديك في المياة
نقص في كميات المياه
7 5 1
الوصول صعوبة 0.698 2.0207 4 لمصدر المياه
2 3 1
0 4 6 المياه عالية تكلفة
ماهو مصدر المياه لديك
1 3 4 مكروت
8 2.926 0.939
0 0 1 زراعي للدولة بئر
0 1 3 زراعي خاص بئر
1 7 6 الامطار
0 1 1 المياة البلدي مصدر
0 0 0 عادمة مياه
0 0 0 عادمة معالجة مياة
هل من الممكن ان نستعمل المياه العادمة الغير معالجة في ري المحاصيل الزراعية
1 3 3 نعم
2 0.876 0.645
1 9 12 لا
هل تعرف من يستعملها
1 2 6 نعم2 2.057 0.358
1 10 9 لا
مزروعات في أي
0 0 2 فواكهه
12 14.911 0.246 1 2 1 الحمضيات
0 0 2 الطبخ خضار
0 2 0 السلطة خضار
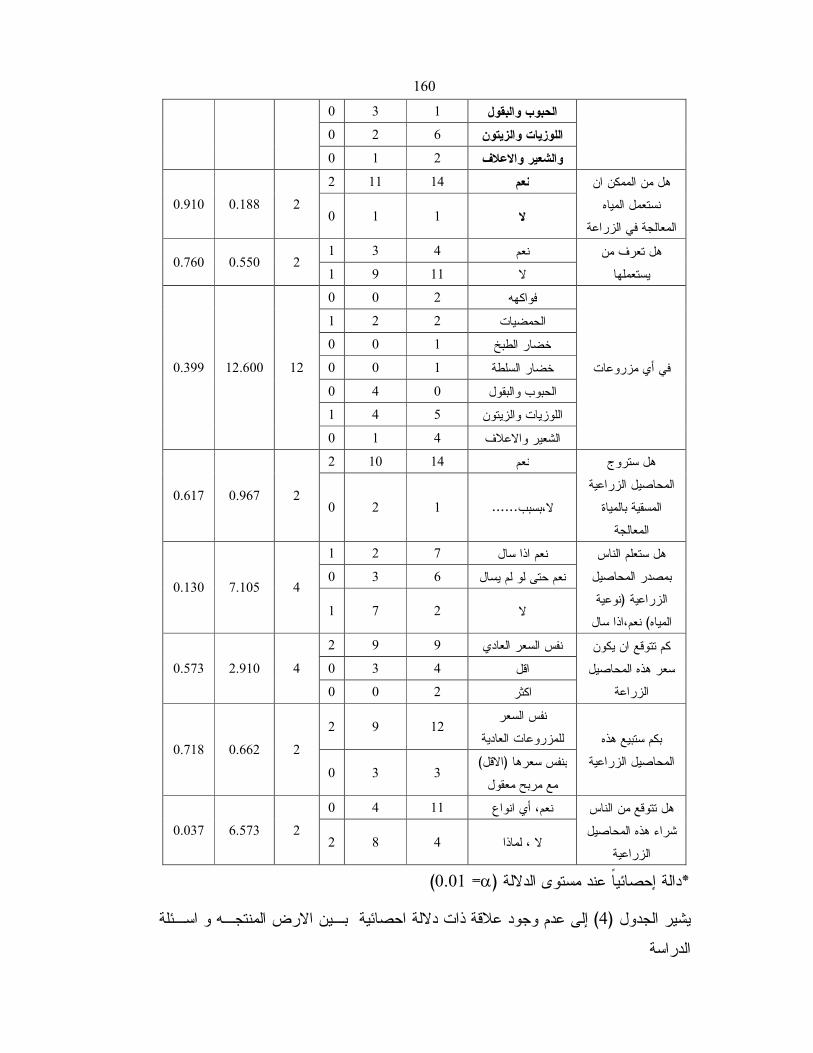
160
0 3 1 الحبوب والبقول
0 2 6 اللوزيات والزيتون
0 1 2 والشعير والاعلاف
هل من الممكن ان نستعمل المياه
المعالجة في الزراعة
2 11 14 نعم
2 0.188 0.910 0 1 1 لا
هل تعرف من يستعملها
1 3 4 نعم2 0.550 0.760
1 9 11 لا
في أي مزروعات
0 0 2 فواكهه
12 12.600 0.399
1 2 2 الحمضيات
0 0 1 خضار الطبخ
0 0 1 خضار السلطة
0 4 0 الحبوب والبقول
1 4 5 اللوزيات والزيتون
0 1 4 والاعلافالشعير
هل ستروج المحاصيل الزراعية
المسقية بالمياة المعالجة
2 10 14 نعم
2 0.967 0.617 0 2 1 ......لا،بسبب
هل ستعلم الناس بمصدر المحاصيل
نوعية (الزراعية اذا سال،نعم) المياه
1 2 7 نعم اذا سال
4 7.105 0.130 0 3 6 نعم حتى لو لم يسال
1 7 2 لا
كم تتوقع ان يكون سعر هذه المحاصيل
الزراعة
2 9 9 نفس السعر العادي
0 3 4 اقل 0.573 2.910 4
0 0 2 اكثر
بكم ستبيع هذه المحاصيل الزراعية
نفس السعر للمزروعات العادية
12 9 2
2 0.662 0.718 ) الاقل(بنفس سعرها
مع مربح معقول3 3 0
من الناس هل تتوقع شراء هذه المحاصيل
الزراعية
0 4 11 أي انواع، نعم
2 6.573 0.037 2 8 4 لماذا، لا
)α =0.01(دالة إحصائياً عند مستوى الدلالة *
إلى عدم وجود علاقة ذات دلالة احصائية بـين الارض المنتجـه و اسـئلة ) 4(يشير الجدول
الدراسة

161
)a (عامة الناس:
:المتعلقة بالفرضية الأولى النتائج .1
:ونصت الفرضية الأولى على
بين الجنس، اسئلة الدارسة) α =0.05(لا توجد علاقة ذات دلالة إحصائية على مستوى
) 1(، ويوضح الجدول Chi Square testولفحص الفرضية، فقد تم استخدام اختبار مربع كاي
.نتائج فحص الفرضية
مربع كاي بين الجنس، واسئلة الدراسةنتائج اختبار ): 1(الجدول
اسئلة الدراسة
قيمة درجات الجنسمربع كاي
مستوى الحرية انثى ذكر الدلالة
مرة تأكل الخضروات كم والفواكه اسبوعيا
مرتين على
الاكثر97 54
2 9.058 0.011
اربع مرات على
الاكثر112 46
147 196 يوميا
195 358 بالماء الخضار والفاكههتغسل كيف
2 20.126 0.000
بالماء
والصابون40 30
22 7 مواد معقمة
تغسل الخضار والفاكهه متىقبل الأكل مباشرة
296 186
1 0.391 0.532
قبل وضعها بالثلاجة
109 61
اين تشتري الخضار من والفاكهه
من أي دكان خضار في
الطريق167 81
5 10.207 0.070
من دكان خضار محدد
95 83
11 27من حسبة

162
الخضار في المدينة
من سوق الخضار الشرقي
الغربي او103 63
من القرى او
المزارعين مباشرة
2 2
من السيارة المتنقلة
11 7
نوع من الخضار أي والفواكهه تشتري
الخصار العاديةوالفاكهه
بسعر متوسط350 224
2 2.762 0.251
الخضار والفاكهه
بسعر العضوية عالي
41 18
الخضار والفاكهه
بمياه المسقيةعادمة غير
معالجة بسعر
رخيص
14 5
100 168 نعم تسأل عن مصدرها هل 1 0.063 0.802
147 237 لا
90 139 نعم تثق بإجابة البائع هل 1 0.302 0.583
157 266 لا
لديك معلومات حول هلكميات المياة المتوفرة في
فلسطين
112 201 لا 2 0.90 0.234
60 76 نعم،وهي كافية
نعم،وهي غير
كافية128 75
)α =0.01(دالة إحصائياً عند مستوى الدلالة *
) .2-1(بين الجنس و الاسئلة رقم إلى وجود علاقة ذات دلالة احصائية) 1(يشير الجدول

163
:النتائج المتعلقة بالفرضية الثانية .2
:ونصت الفرضية الثانية على
بين العمر، اسئلة الدارسة) α =0.05(لا توجد علاقة ذات دلالة إحصائية على مستوى
) 2(، ويوضح الجدول Chi Square testولفحص الفرضية، فقد تم استخدام اختبار مربع كاي
.نتائج فحص الفرضية
نتائج اختبار مربع كاي بين العمر، واسئلة الدراسة): 2(الجدول
اسئلة الدراسة
قيمة درجات العمرمربع كاي
مستوى 30-18 الدلالة
31-60
اكثر 61من
الحرية
مرة تأكل الخضروات كم والفواكه اسبوعيا
مرتين على الاكثر
36 112 3
4 4.96 0.288
اربع مرات على الاكثر
49 106 3
14 228 101 يوميا
16 383 154 بالماء تغسل الخضار والفاكهه كيف
4 6.595 0.159
بالماء والصابون
27 41 2
2 22 5 مواد معقمة
تغسل الخضار والفاكهه متىقبل الأكل مباشرة
134 334 14
2 0.716 0.699
قبل وضعها بالثلاجة
52 112 6
اين تشتري الخضار من والفاكهه
من أي دكان خضار في
الطريق56 182 10
10 25.652 0.004
من دكان خضار محدد
55 116 7
من حسبة
الخضار في المدينة
17 20 1
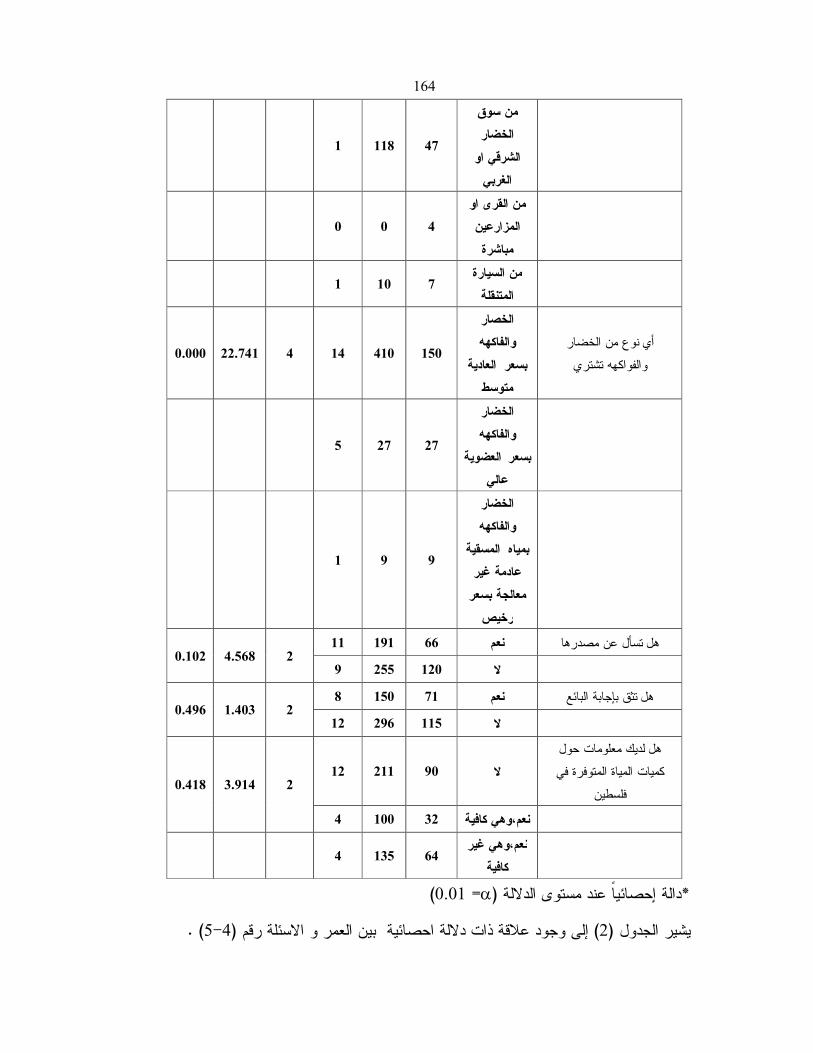
164
من سوق الخضار
الشرقي او الغربي
47 118 1
من القرى او المزارعين مباشرة
4 0 0
من السيارة المتنقلة
7 10 1
نوع من الخضار أي والفواكهه تشتري
الخصار والفاكهه
بسعر العادية متوسط
150 410 14 4 22.741 0.000
الخضار والفاكهه
بسعر العضوية عالي
27 27 5
الخضار والفاكهه
بمياه المسقيةعادمة غير
معالجة بسعر
رخيص
9 9 1
11 191 66 نعم تسأل عن مصدرها هل2 4.568 0.102
9 255 120 لا
8 150 71 نعم تثق بإجابة البائع هل2 1.403 0.496
12 296 115 لا
لديك معلومات حول هلكميات المياة المتوفرة في
فلسطين
12 211 90 لا2 3.914 0.418
4 100 32 نعم،وهي كافية
نعم،وهي غير كافية
64 135 4
)α =0.01(إحصائياً عند مستوى الدلالة دالة *
) .5-4(إلى وجود علاقة ذات دلالة احصائية بين العمر و الاسئلة رقم ) 2(يشير الجدول

165
:النتائج المتعلقة بالفرضية الثالثة .3
:ونصت الفرضية الثالثة على
اسـئلة بين التحصـيل العلمـي، ) α =0.05(لا توجد علاقة ذات دلالة إحصائية على مستوى
الدارسة
) 3(، ويوضح الجدول Chi Square testولفحص الفرضية، فقد تم استخدام اختبار مربع كاي
.نتائج فحص الفرضية
نتائج اختبار مربع كاي بين التحصيل العلمي، واسئلة الدراسة): 3(الجدول
اسئلة الدراسة درجات التحصيل العلمي
الحريةقيمة
مربع كايمستوى جامعي ثانوي اساسي الدلالة
مرة تأكل كمالخضروات والفواكه اسبوعيا
مرتين على الاكثر
8 71 68 4
6 11.593 0.072
اربع مرات على
الاكثر5 62 79 12
22 191 118 12 يوميا
6 13.221 0.040 تغسل كيف
الخضار والفاكهه
27 281 225 20 بالماء
بالماء
والصابون3 17 41 9
2 16 9 2 مواد معقمة
تغسل متىالخضار والفاكهه
قبل الأكل مباشرة
16 177 261 28
3 4.693 0.196
قبل وضعها
بالثلاجة9 74 77 10
اين تشتري منالخضار والفاكهه
من أي دكان
خضار في
الطريق13 112 113 10 15 33.237 0.004
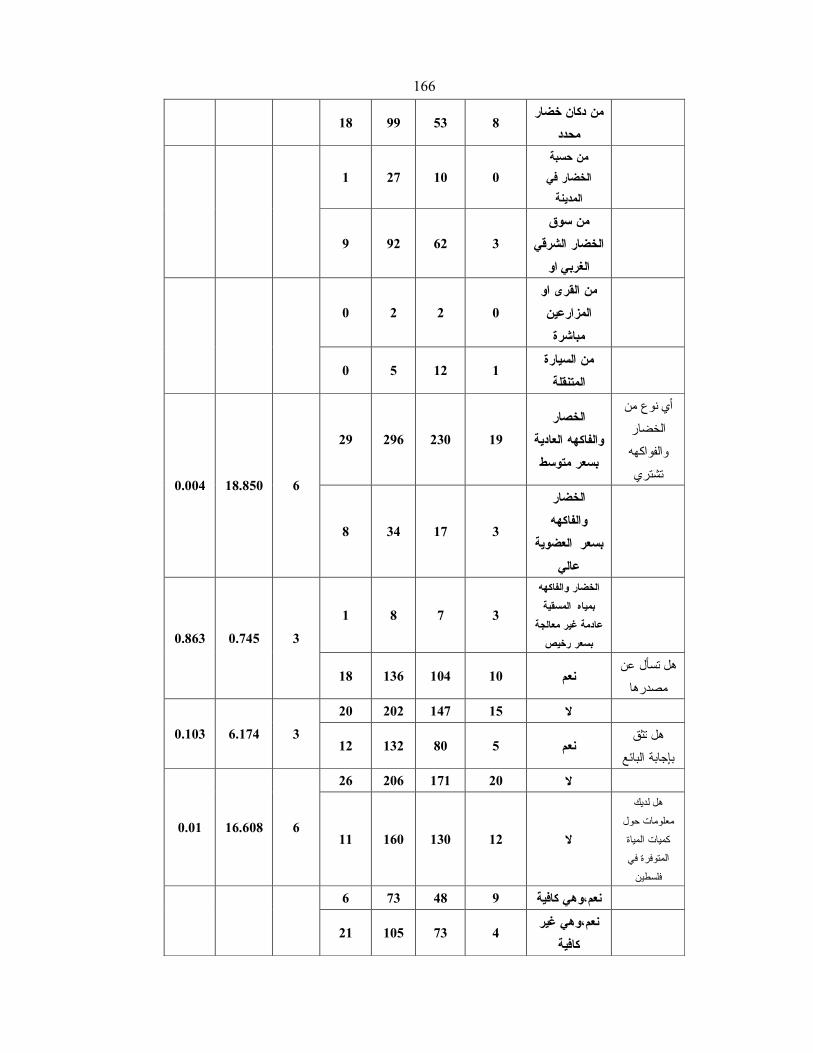
166
من دكان خضار
محدد8 53 99 18
من حسبة الخضار في
المدينة0 10 27 1
من سوق الخضار الشرقي
الغربي او3 62 92 9
من القرى او المزارعين
مباشرة
0 2 2 0
من السيارة
المتنقلة1 12 5 0
نوع من أيالخضار والفواكهه
تشتري
الخصار والفاكهه العادية
بسعر متوسط19 230 296 29
6 18.850 0.004
الخضار
والفاكهه بسعر العضوية
عالي
3 17 34 8
الخضار والفاكهه بمياه المسقية
عادمة غير معالجة بسعر رخيص
3 7 8 1
3 0.745 0.863
تسأل عن هل مصدرها
18 136 104 10 نعم
20 202 147 15 لا
تثق هل 0.103 6.174 3 بإجابة البائع
12 132 80 5 نعم
26 206 171 20 لا
6 16.608 0.01
لديك هلمعلومات حول كميات المياة المتوفرة في
فلسطين
11 160 130 12 لا
6 73 48 9 نعم،وهي كافية
نعم،وهي غير كافية
4 73 105 21

167
)α =0.01(دالة إحصائياً عند مستوى الدلالة *
احصائية بين التحصيل العلمي و الاسـئلة رقـم إلى وجود علاقة ذات دلالة ) 3(يشير الجدول
)4-5-8 . (
:النتائج المتعلقة بالفرضية الرابعة.4
:ونصت الفرضية الرابعة على
بين مكان السكن، اسئلة الدارسة) α =0.05(لا توجد علاقة ذات دلالة إحصائية على مستوى
) 4(، ويوضح الجدول Chi Square testولفحص الفرضية، فقد تم استخدام اختبار مربع كاي
.نتائج فحص الفرضية
نتائج اختبار مربع كاي بين مكان السكن، واسئلة الدراسة): 4(الجدول
اسئلة الدراسة
قيمة درجات مكان السكنمربع كاي
مستوى الحرية مخيم قرية مدينة الدلالة
مرة تأكل كمالخضروات والفواكه اسبوعيا
9 46 96 مرتين على الاكثر4 18.671 0.001
10 30 1188 اربع مرات على الاكثر
8 123 212 يوميا
تغسل كيفالخضار والفاكهه
24 154 375 بالماء4 13.384 0.001
2 34 34 بالماء والصابون
1 11 17 مواد معقمة
تغسل متىالخضار والفاكهه
17 134 331 قبل الأكل مباشرة2 9.313 0.009
10 65 95 قبل وضعها بالثلاجة

168
اين تشتري منالخضار والفاكهه
10 83 155 الطريق من أي دكان خضار في10 39.79 0.000
11 58 109 من دكان خضار محدد
2 13 23 المدينة من حسبة الخضار في
من سوق الخضار الشرقي او
الغربي133 29 4
من القرى او المزارعين
مباشرة2 2 0
0 14 4 من السيارة المتنقلة
نوع من أيالخضار والفواكهه
تشتري
بسعر الخصار والفاكهه العادية متوسط
380 168 26 4 6.751 0.150
الخضار والفاكهه العضوية
بسعر عالي37 21 1
بمياه الخضار والفاكهه المسقية
عادمة غير معالجة بسعر رخيص
9 10 0
تسأل عن هل مصدرها
11 84 173 نعم2 0.145 0.930
16 118 253 لا
تثق بإجابة هل البائع
10 73 146 نعم2 0.391 0.822
17 126 280 لا
لديك هلمعلومات حول كميات المياة المتوفرة في
فلسطين
14 87 212 لا4 36.288 0.000
10 22 104 نعم،وهي كافية
غير كافية نعم،وهي 110 90 3
)α =0.01(دالة إحصائياً عند مستوى الدلالة *
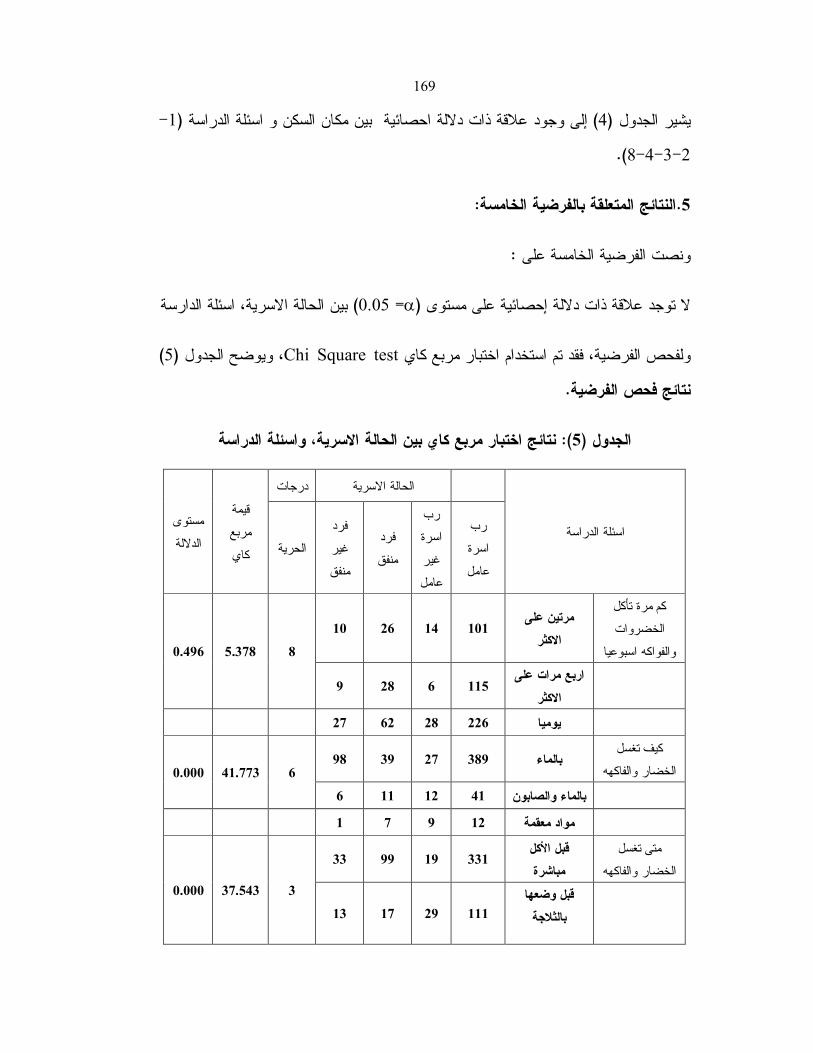
169
-1(إلى وجود علاقة ذات دلالة احصائية بين مكان السكن و اسئلة الدراسة ) 4(يشير الجدول
2-3-4-8.(
:النتائج المتعلقة بالفرضية الخامسة.5
:ونصت الفرضية الخامسة على
بين الحالة الاسرية، اسئلة الدارسة) α =0.05(دلالة إحصائية على مستوى لا توجد علاقة ذات
) 5(، ويوضح الجدول Chi Square testولفحص الفرضية، فقد تم استخدام اختبار مربع كاي
.نتائج فحص الفرضية
نتائج اختبار مربع كاي بين الحالة الاسرية، واسئلة الدراسة): 5(الجدول
اسئلة الدراسة
درجات الحالة الاسرية
قيمة مربع كاي
مستوى الدلالة
رب اسرة عامل
رب اسرة غير عامل
فرد منفق
فرد غير منفق
الحرية
مرة تأكل كمالخضروات
والفواكه اسبوعيا
مرتين على الاكثر
101 14 26 10
8 5.378 0.496
اربع مرات على
الاكثر115 6 28 9
27 62 28 226 يوميا
تغسل كيف الخضار والفاكهه
98 39 27 389 بالماء6 41.773 0.000
6 11 12 41 بالماء والصابون
1 7 9 12 مواد معقمة
تغسل متى الخضار والفاكهه
قبل الأكل مباشرة
331 19 99 33
3 37.543 0.000
قبل وضعها بالثلاجة
111 29 17 13

170
اين تشتري من الخضار والفاكهه
من أي دكان خضار في
الطريق175 17 42 14
15 24.462 0.058
من دكان خضار
محدد116 21 29 12
من حسبة
الخضار في المدينة
22 3 10 3
من سوق الخضار الشرقي
الغربي او116 6 31 13
من القرى او المزارعين
مباشرة
1 0 1 2
من السيارة
المتنقلة12 1 3 2
نوع من أيالخضار
والفواكهه تشتري
الخصار والفاكهه
بسعر العادية متوسط
400 42 95 37 6 16.773 0.010
الخضار والفاكهه بسعر العضوية
عالي
30 5 19 5
الخضار والفاكهه بمياه المسقية
عادمة غير معالجة بسعر
رخيص
12 1 2 4
تسأل عن هل مصدرها
21 46 19 182 نعم3 0.540 0.910
25 70 29 260 لا
تثق بإجابة هل البائع
21 37 24 147 نعم3 8.105 0.044
25 79 24 295 لا
لديك معلومات هلحول كميات المياة
المتوفرة في فلسطين
0.118 10.171 6 24 49 20 220 لا

171
6 33 7 90 نعم،وهي كافية
نعم،وهي غير كافية
132 21 34 16
)α =0.01(دالة إحصائياً عند مستوى الدلالة *
إلى وجود علاقة ذات دلالة احصائية بين الحالة الاسرية و اسئلة الدراسـة ) 5(يشير الجدول
)2-3-5(
)c (البائع:
:النتائج المتعلقة بالفرضية الأولى .1
:ونصت الفرضية الأولى على
بين العمر، اسئلة الدارسة) α =0.05(على مستوى لا توجد علاقة ذات دلالة إحصائية
) 1(، ويوضح الجدول Chi Square testولفحص الفرضية، فقد تم استخدام اختبار مربع كاي
.نتائج فحص الفرضية

172
نتائج اختبار مربع كاي بين العمر، واسئلة الدراسة): 1(الجدول
اسئلة الدراسة
قيمة درجات العمرمربع كاي
مستوى 30-18 الدلالة
31-60
اكثر 61من
الحرية
من اين تشتري الخضار والفاكهة
1 6 0 من أي مزارع
6 7.663 0.264 0 1 2 من مزارع محدد
من حسبة الخضار
في المدينة25 29 2
0 5 5 من داخل اسرائيل
1 22 18 نعم هل تسأل عن طريقة ريها2 0.583 0.747
2 19 14 لا
1 9 4 مياه الامطار بماذا تسقى
10 5.362 0.866
0 11 11 مياه ابار
0 1 2 مياه مكيروت
0 2 1 مياه عادمة معالجة
مياه عادمة غير
معالجة14 18 2
ما هو العامل الاساسي في اختيار المحاصيل
الزراعية 0 6 7 الشكل
10 16.794 0.009
1 17 7 السعر
0 0 6 المصدر
0 0 2 الطعم
2 13 8 الجودة
0 5 2 ما يتوفر
هل ستبيع المحاصيل الزراعية المسقية بالمياه
العادمة المعالجة 1 13 9 نعم
2 0.123 0.940
2 28 23 لا
هل ستروج المحاصيل الزراعية المسقية بالمياه
العادمة المعالجة 0.786 0.481 2 1 16 10 نعم
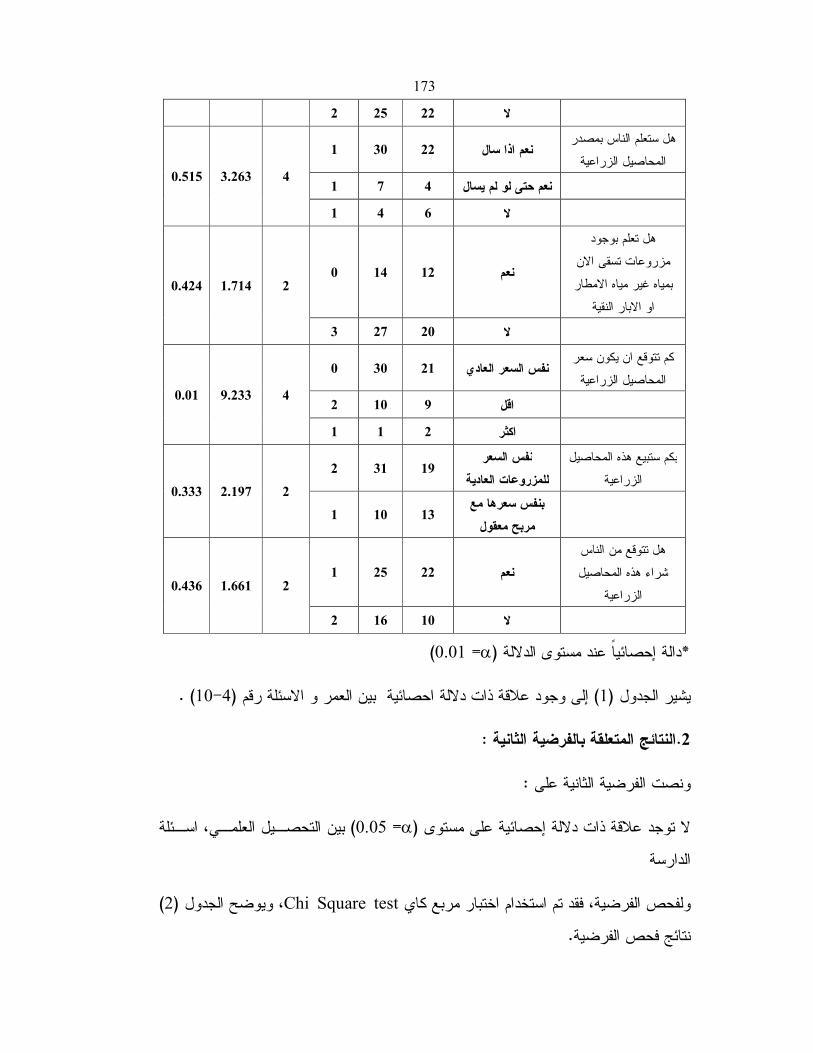
173
2 25 22 لا
هل ستعلم الناس بمصدر المحاصيل الزراعية
1 30 22 نعم اذا سال
4 3.263 0.515 1 7 4 نعم حتى لو لم يسال
1 4 6 لا
هل تعلم بوجود مزروعات تسقى الان بمياه غير مياه الامطار
او الابار النقية
0 14 12 نعم2 1.714 0.424
3 27 20 لا
كم تتوقع ان يكون سعر المحاصيل الزراعية
0 30 21 نفس السعر العادي
4 9.233 0.01 2 10 9 اقل
1 1 2 اكثر
بكم ستبيع هذه المحاصيل الزراعية
نفس السعر للمزروعات العادية
19 31 2
2 2.197 0.333
بنفس سعرها مع
مربح معقول13 10 1
هل تتوقع من الناس شراء هذه المحاصيل
الزراعية 1 25 22 نعم
2 1.661 0.436
2 16 10 لا
)α =0.01(دالة إحصائياً عند مستوى الدلالة *
) .10-4(إلى وجود علاقة ذات دلالة احصائية بين العمر و الاسئلة رقم ) 1(يشير الجدول
:النتائج المتعلقة بالفرضية الثانية .2
:على ونصت الفرضية الثانية
بين التحصـيل العلمـي، اسـئلة ) α =0.05(لا توجد علاقة ذات دلالة إحصائية على مستوى
الدارسة
) 2(، ويوضح الجدول Chi Square testولفحص الفرضية، فقد تم استخدام اختبار مربع كاي
.نتائج فحص الفرضية
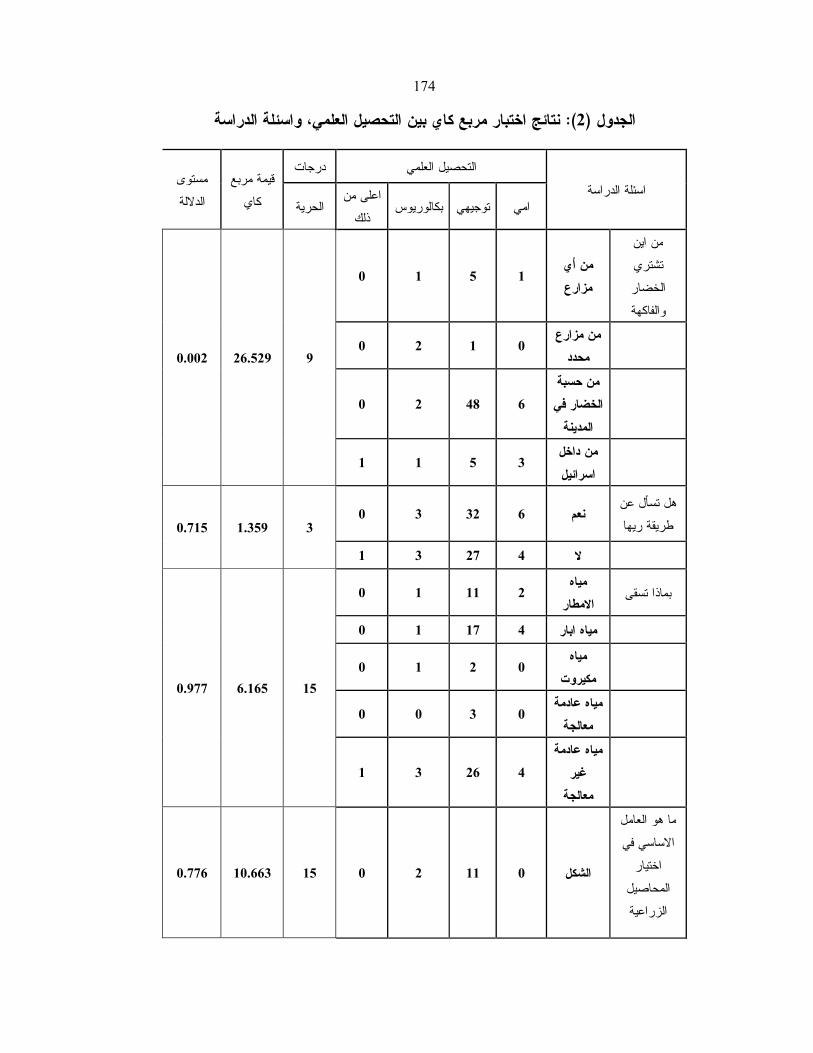
174
الدراسةنتائج اختبار مربع كاي بين التحصيل العلمي، واسئلة ): 2(الجدول
اسئلة الدراسة
درجات التحصيل العلميقيمة مربع
كاي
مستوى بكالوريوس توجيهي امي الدلالة
اعلى من ذلك
الحرية
من اين تشتري الخضار والفاكهة
من أي مزارع
1 5 1 0
9 26.529 0.002
من مزارع محدد
0 1 2 0
من حسبة الخضار في
المدينة6 48 2 0
من داخل
اسرائيل3 5 1 1
هل تسأل عن طريقة ريها
0 3 32 6 نعم3 1.359 0.715
1 3 27 4 لا
بماذا تسقىمياه الامطار
2 11 1 0
15 6.165 0.977
0 1 17 4 مياه ابار
مياه مكيروت
0 2 1 0
مياه عادمة
معالجة0 3 0 0
مياه عادمة
غير معالجة
4 26 3 1
هو العامل ما الاساسي في
اختيار المحاصيل الزراعية
0.776 10.663 15 0 2 11 0 الشكل

175
1 2 19 3 السعر
0 1 3 2 المصدر
0 0 2 0 الطعم
0 1 19 3 الجودة
0 0 5 2 ما يتوفر
هل ستبيع المحاصيل الزراعية
المسقية بالمياه العادمة المعالجة
1 3 15 4 نعم3 4.516 0.211
0 3 44 6 لا
هل ستروج المحاصيل الزراعية
المسقية بالمياه العادمة المعالجة
0 4 17 6 نعم3 6.867 0.076
1 2 42 4 لا
هل ستعلم الناس بمصدر المحاصيل الزراعية
نعم اذا سال
5 43 4
6 3.173 0.787
نعم حتى
لو لم يسال2 9 1 1
0 1 7 3 لا
تعلم هلبوجود
مزروعات تسقى الان
بمياه غير مياه الامطار او الابار النقية
0 1 22 3 نعم3 1.668 0.644
1 5 37 7 لا
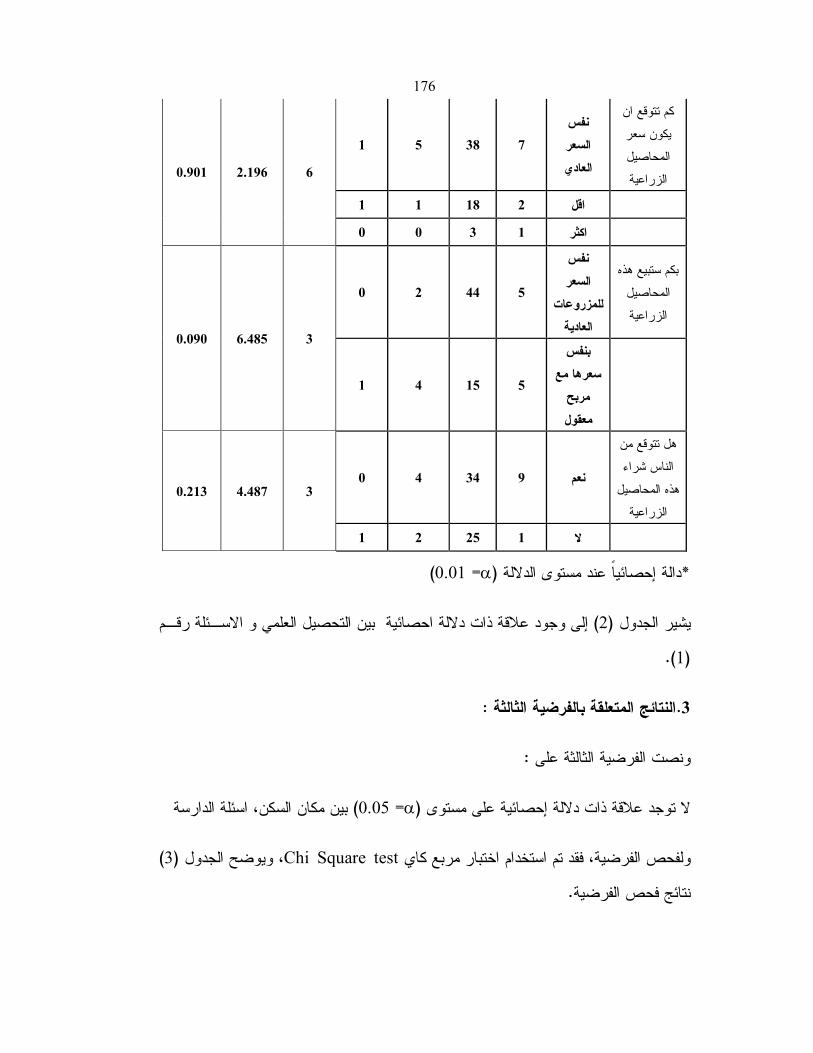
176
كم تتوقع ان يكون سعر المحاصيل الزراعية
نفس السعر
العادي7 38 5 1
6 2.196 0.901
1 1 18 2 اقل
0 0 3 1 اكثر
بكم ستبيع هذه المحاصيل الزراعية
نفس
السعر للمزروعات
العادية
5 44 2 0
3 6.485 0.090
بنفس
سعرها مع مربح معقول
5 15 4 1
هل تتوقع من الناس شراء
هذه المحاصيل الزراعية
0 4 34 9 نعم3 4.487 0.213
1 2 25 1 لا
)α =0.01(دالة إحصائياً عند مستوى الدلالة *
إلى وجود علاقة ذات دلالة احصائية بين التحصيل العلمي و الاسـئلة رقـم ) 2(يشير الجدول
)1.(
:النتائج المتعلقة بالفرضية الثالثة .3
:ونصت الفرضية الثالثة على
بين مكان السكن، اسئلة الدارسة) α =0.05(لا توجد علاقة ذات دلالة إحصائية على مستوى
) 3(، ويوضح الجدول Chi Square testبار مربع كاي ولفحص الفرضية، فقد تم استخدام اخت
.نتائج فحص الفرضية

177
نتائج اختبار مربع كاي بين مكان السكن، واسئلة الدراسة): 3(الجدول
اسئلة الدراسة
قيمة مربع درجات مكان السكن كاي
مستوى الحرية مخيم قرية مدينة الدلالة
من اين تشتري الخضار والفاكهة
مزارعمن أي 4 1 2
6 1.619 0.951
0 1 2 من مزارع محدد
من حسبة الخضار في المدينة
33 11 12
3 2 5 من داخل اسرائيل
هل تسأل عن طريقة ريها
9 8 24 نعم2 0.016 0.992
8 7 20 لا
2 3 9 مياه الامطار بماذا تسقى
10 5.785 0.833
5 5 12 مياه ابار
مكيروتمياه 2 0 1
1 0 2 مياه عادمة معالجة
مياه عادمة غير معالجة
19 7 18
ما هو العامل الاساسي في
اختيار المحاصيل الزراعية
3 1 9 الشكل
5 15.835 0.104
7 2 16 السعر
1 1 4 المصدر
0 2 0 الطعم
5 8 10 الجودة
1 1 5 ما يتوفر

178
ستبيع هل المحاصيل الزراعية
المسقية بالمياه العادمة المعالجة
4 1 18 نعم2 6.686 0.009
13 14 26 لا
هل ستروج المحاصيل الزراعية
المسقية بالمياه العادمة المعالجة
4 3 20 نعم2 4.540 0.103
13 12 24 لا
هل ستعلم الناس بمصدر
المحاصيل الزراعية
10 7 36 نعم اذا سال
4 8.728 0.068
نعم حتى لو لم
يسال4 5 3
4 3 4 لا
تعلم بوجود هلمزروعات
تسقى الان بمياه غير مياه
الامطار او الابار النقية
5 8 13 نعم2 3.037 0.219
12 7 31 لا
كم تتوقع ان يكون سعر المحاصيل الزراعية
13 9 29 نفس السعر العادي
4 1.780 0.776
4 5 12 اقل
0 1 3 اكثر

179
بكم ستبيع هذه المحاصيل الزراعية
نفس السعر للمزروعات العادية
27 10 15
2 4.125 0.127
بنفس سعرها مع
مربح معقول17 5 2
هل تتوقع من الناس شراء هذه
المحاصيل الزراعية
11 11 26 نعم2 0.998 0.607
6 4 18 لا
)α =0.01(إحصائياً عند مستوى الدلالة دالة *
إلى وجود علاقة ذات دلالة احصائية بين التحصيل مكان السكن و الاسـئلة ) 3(يشير الجدول
) . 5(رقم
:النتائج المتعلقة بالفرضية الرابعة.4
:ونصت الفرضية الرابعة على
ارض منتجه، اسـئلة بين وجود ) α =0.05(لا توجد علاقة ذات دلالة إحصائية على مستوى
الدارسة
) 4(، ويوضح الجدول Chi Square testولفحص الفرضية، فقد تم استخدام اختبار مربع كاي
.نتائج فحص الفرضية

180
نتائج اختبار مربع كاي بين وجود ارض منتجه، واسئلة الدراسة): 4(الجدول
اسئلة الدراسة
درجات وجود ارض منتجهقيمة مربع
كاي
مستوى نعم وابيع الدلالة
محصولي
نعم واوزع محصولي
الحرية لا
من اين تشتري الخضار والفاكهة
من أي مزارع
0 2 5
6 8.098 0.231
من مزارع محدد
0 0 3
من حسبة الخضار في
المدينة2 2 52
من داخل
اسرائيل1 1 8
هل تسأل عن طريقة
ريها
36 2 3 نعم2 2.980 0.225
32 3 0 لا
11 2 1 مياه الامطار بماذا تسقى
10 12.399 0.01
21 0 1 مياه ابار
مياه مكيروت
1 0 2
مياه عادمة معالجة
0 0 3
مياه عادمة غير معالجة
0 3 30
ما هو العامل
الاساسي في اختيار
المحاصيل الزراعية
12 0 1 الشكل10 9.282 0.506
22 2 1 السعر

181
6 0 0 المصدر
1 1 0 الطعم
20 2 1 الجودة
7 0 0 ما يتوفر
هل ستبيع المحاصيل الزراعية المسقية بالمياه العادمة المعالجة
22 0 1 نعم2 2.324 0.313
46 5 2 لا
هل ستروج المحاصيل
الزراعية المسقية بالمياه العادمة المعالجة
24 2 1 نعم0.052 2 0.975
44 3 2 لا
هل ستعلم الناس بمصدر
المحاصيل الزراعية
48 3 2 نعم اذا سال
1.313 4 0.859
نعم حتى لو لم يسال
1 1 10
10 1 0 لا
تعلم هلبوجود
مزروعات تسقى الان بمياه غير
مياه الامطار او الابار
النقية
0.01 4.994 2 21 4 1 نعم

182
47 1 2 لا
كم تتوقع ان يكون سعر المحاصيل الزراعية
نفس السعر العادي
3 4 44
4 5.451 0.244
21 0 0 اقل
3 1 0 اكثر
بكم ستبيع هذه
المحاصيل الزراعية
نفس السعر
للمزروعات العادية
2 4 46
2 0.333 0.846
بنفس سعرها مع
مربح معقول
1 1 22
هل تتوقع من الناس شراء هذه المحاصيل الزراعية
41 4 3 نعم2 2.599 0.273
27 1 0 لا
)α =0.01(دالة إحصائياً عند مستوى الدلالة *
إلى وجود علاقة ذات دلالة احصائية بين وجود ارض منتجه و الاسئلة رقم ) 4(يشير الجدول
)3-8 . (
:النتائج المتعلقة بالفرضية الخامسة.5
:الخامسة على ونصت الفرضية
بـين طريقـة بيـع المحاصـيل ) α =0.05(لا توجد علاقة ذات دلالة إحصائية على مستوى
الزراعية، اسئلة الدارسة

183
) 5(، ويوضح الجدول Chi Square testولفحص الفرضية، فقد تم استخدام اختبار مربع كاي
.نتائج فحص الفرضية
بيع المحاصيل الزراعية، واسئلة الدراسةنتائج اختبار مربع كاي بين طريقة ): 5(الجدول
اسئلة الدراسة
طريقة بيع المحاصيل الزراعية
درجات الحرية
قيمة مربع كاي
مستوى في الدلالة
دكان
في الحسبة
في السيارة
على عربة متنقلة
في سوق الخضار الشرقي او الغربي
من اين تشتري الخضار والفاكهة
من أي مزارع
0 5 1 0 1
12 41.471 0.000
من مزارع
محدد1 0 0 1 1
من حسبة
الخضار في المدينة
2 6 2 23 23
من داخل اسرائيل
0 8 0 1 1
هل تسأل عن طريقة
ريها
16 11 3 9 2 نعم4 4.686 0.321
10 14 0 10 1 لا
بماذا تسقىمياه الامطار
1 5 2 3 3
20 27.526 0.009*
ياه ابارم 0 3 1 7 11
مياه مكيروت
0 0 0 1 2
مياه عادمة
معالجة1 1 0 0 2
مياه عادمة
غير معالجة
1 10 0 14 8

184
ما هو العامل
الاساسي في اختيار المحاصيل الزراعية
2 7 0 1 3 الشكل
20 49.506 0.000*
لسعرا 0 9 2 12 2
6 0 0 0 0 المصدر
1 1 0 0 0 الطعم
11 5 0 7 0 الجودة
4 0 1 2 0 ما يتوفر
هل ستبيع المحاصيل الزراعية المسقية بالمياه العادمة المعالجة
8 6 0 8 1 نعم4 3.046 0.550
18 19 3 11 2 لا
هل ستروج المحاصيل
الزراعية المسقية بالمياه العادمة المعالجة
11 5 1 9 1 نعم4 4.329 0.363
15 20 2 10 2 لا
هل ستعلم الناس بمصدر
المحاصيل الزراعية
نعم اذا سال
3 15 2 22 11
8 16.498 0.01*
عم حتى ن
لو لم يسال0 2 1 1 8
7 2 0 2 0 لا

185
تعلم هلبوجود
مزروعات تسقى الان بمياه غير
مياه الامطار او الابار النقية
8 10 2 6 0 نعم4 3.532 0.473
18 15 1 13 3 لا
كم تتوقع ان يكون سعر
المحاصيل الزراعية
نفس
السعر العادي
2 14 1 17 17
8 5.933 0.655
قلا 1 4 1 7 8
1 1 1 1 0 اكثر
بكم ستبيع هذه
المحاصيل الزراعية
نفس السعر
للمزروعات العادية
2 16 1 22 11
4 16.547 0.002*
نفس بسعرها مع
مربح معقول
1 3 2 3 15
هل تتوقع من الناس شراء هذه المحاصيل الزراعية
14 14 3 16 1 نعم4 8.035 0.090
12 11 0 3 2 لا
)α =0.01(دالة إحصائياً عند مستوى الدلالة *
إلى وجود علاقة ذات دلالة احصائية بين طريقة بيع المحاصيل الزراعيـة ) 5(يشير الجدول
) . 11-7-4-2-1(والاسئلة رقم

186
Appendix IV
List of the goods, activities and plans in the VCA model
Good Activities plan
water M WW treatment Tomatoes FWK Municipality
profit
Water A WW collection Natural
Cucumber FWK TWW farmers
Water K Tomatoes FTWW
Green House Cucumber FWK
WA farmers
Wastewater Natural
Cucumber FTWW
Egg Plant FWK WM farmers
WW collected Green House
Cucumber FTWW
Zucchini FWK WK farmers
Treated wastewater
Egg Plant FTWW
Cabbage FWK M:municipality water
A: agricultural wells
K:palestiniane water department
water WW: wastewater S :seeds or splits
P: Product FTWW: farming
using treated waste water
FWA: farming using fresh water from agricultural
well FWK: farming
using fresh water from palestiniane
water department FWM: farming
using fresh water
Fertilizers Zucchini FTWW
Beans FWK
labor Cabbage FTWW Spanish FWK
Tomatoes s Beans FTWW Potato FWK
Natural Cucumber s
Spanish FTWW Orange FWK
Green House Cucumber s
Potato FTWW Peach FWK
Egg Plant s Orange FTWW Plum FWK
Zucchini s Peach FTWW Nectarine FWK
Cabbage s Plum FTWW Lemon FWK
Beans s Nectarine FTWW
Parsley FWK
Spanish s Lemon FTWW Mint FWK
Potato s Parsley FTWW Almond FWK
Orange s Mint FTWW Fig FWK
Peach s Almond FTWW Olives FWK
Plum s Fig FTWW Tomatoes FWM
Nectarine s Olives FTWW Natural
Cucumber FWM
Lemon s Tomatoes FWA Green House

187
Cucumber FWM from municipality
Parsley s Natural
Cucumber FWA Egg Plant FWM
Mint s Green House
Cucumber FWA Zucchini FWM
Almond s Egg Plant FWA Cabbage FWM
Fig s Zucchini FWA Beans FWM
Olives s Cabbage FWA Spanish FWM
Tomatoes p Beans FWA Potato FWM
Natural Cucumber p
Spanish FWA Orange FWM
Green House Cucumber p
Potato FWA Peach FWM
Egg Plant p Orange FWA Plum FWM
Zucchini p Peach FWA Nectarine FWM
Cabbage p Plum FWA Lemon FWM
Beans p Nectarine FWA Parsley FWM
Spanish p Lemon FWA Mint FWM
Potato p Parsley FWA Almond FWM
Orange p Mint FWA Fig FWM
Peach p Almond FWA Olives FWM
Plum p Fig FWA
Nectarine p Olives FWA
Lemon p
Parsley p
Mint p
Almond p
Fig p
Olives p

188
Appendix V
The data for all the goods needed
Good unit Value added
item Depreciation
item Market
price NIS water M m3 Yes No 4.69
Water A m3 Yes No 2
Water K m3 Yes No 14
Wastewater m3 Yes No 0
WW collected m3 Yes No 1
Treated wastewater
m3 Yes No 1
Fertilizers Kg Yes No 4.5
labor Hand/day No No 70
Tomatoes s Seed or
split No No 0.7
Natural Cucumber s
Seed or split
No No 2.2
Green House Cucumber s
Seed or split
No No 0.7
Egg Plant s Seed or
split No No 0.5
Zucchini s Seed or
split No No 0.07
Cabbage s Seed or
split No No 0.01
Beans s Seed or
split No No 0.08
Spanish s Seed or
split No No 0.05
Potato s Kg No No 5
Orange s Seed or
split No No 10
Peach s Seed or
split No No 30
Plum s Seed or
split No No 40
Nectarine s Seed or
split No No 40
Lemon s Seed or No No 10

189
split
Parsley s Seed or
split No No 0.02
Mint s Seed or
split No No 0.02
Almond s Seed or
split No No 50
Fig s Seed or
split No No 4
Olives s Seed or
split No No 6
Tomatoes p Kg No No 0.8
Natural Cucumber p
Kg No No 2.2
Green House Cucumber p
Kg No No 1
Egg Plant p Kg No No 1
Zucchini p Kg No No 2
Cabbage p Kg No No 2
Beans p Kg No No 3
Spanish p Kg No No 1
Potato p Kg No No 2
Orange p Kg No No 2
Peach p Kg No No 2
Plum p Kg No No 2
Nectarine p Kg No No 2
Lemon p Kg No No 2
Parsley p Kg No No 8
Mint p Kg No No 8
Almond p Kg No No 5
Fig p Kg No No 3
Olives p Kg No No 3

190
Appendix VI
the data needed for all the activities.
Activity name
unit goods In/out unit amount
WW collection
m3
Wastewater In m3 -19152
Wastewater collected
out m3 19152
WW treatment
m3
Wastewater collected
in m3 -14000
Treated wastewater
out m3 14000
Tomatoes FTWW
1 dunums
fertilizers In Kg 60
Labor In Hand/day 1
Treated wastewater
In m3 400
Tomatoes s In Seeds or
splits 1000
Tomatoes p out kg 4000
Natural Cucumber
FTWW 1 dunums
fertilizers In Kg 73.3
Labor In Hand/day 1
Treated wastewater
In m3 450
Natural Cucumber s
In Seeds or
splits 1200
Natural Cucumber p
out kg 4000
Green House
Cucumber FTWW
1 dunums
fertilizers In Kg 100
Labor In Hand/day 1
Treated wastewater
In m3 500
Green House Cucumber s
In Seeds or
splits 2000
Green House Cucumber p
out kg 10000
Egg Plant FTWW
1 dunums
fertilizers In Kg 50
Labor In Hand/day 1
Treated wastewater
In m3 40
Egg Plant s In Seeds or
splits 1200
Egg Plant p out kg 4000
Zucchini FTWW
1 dunums
fertilizers In Kg 40
Labor In Hand/day 1
Treated wastewater
In m3 350

191
Zucchini s In Seeds or
splits 1200
Zucchini p out kg 3000
Cabbage FTWW
1 dunums
fertilizers In Kg 33.3
Labor In Hand/day 1
Treated wastewater
In m3 250
Cabbage s In Seeds or
splits 2000
Cabbage p out kg 4000
Beans FTWW
1 dunums
fertilizers In Kg 26
Labor In Hand/day 1
Treated wastewater
In m3 300
Beans s In Seeds or
splits 2000
Beans p out kg 900
Spanish FTWW
1 dunums
fertilizers In Kg 16.6
Labor In Hand/day 1
Treated wastewater
In m3 200
Spanish s In Seeds or
splits 2000
Spanish p out kg 800
Potato FTWW
1 dunums
fertilizers In Kg 83.3
Labor In Hand/day 1
Treated wastewater
In m3 500
Potato s In Seeds in kg 150
Potato p out kg 4000
Orange FTWW
1 dunums
fertilizers In Kg 70
Labor In Hand/day 1
Treated wastewater
In m3 1200
Orange s In Seeds or
splits 40
Orange p out kg 3500
Peach FTWW
1 dunums
fertilizers In Kg 20
Labor In Hand/day 1
Treated wastewater
In m3 400
Peach s In Seeds or
splits 40
Peach p out kg 3000
Plum FTWW
1 dunums
fertilizers In Kg 20
Labor In Hand/day 1
Treated wastewater
In m3 400

192
Plum s In Seeds or
splits 40
Plum p out kg 3000
Nectarine FTWW
1 dunums
fertilizers In Kg 20
Labor In Hand/day 1
Treated wastewater
In m3 400
Nectarine s In Seeds or
splits 40
Nectarine p out kg 3000
Lemon FTWW
1 dunums
fertilizers In Kg 70
Labor In Hand/day 1
Treated wastewater
In m3 400
Lemon s In Seeds or
splits 40
Lemon p out kg 5000
Parsley FTWW
1 dunums
fertilizers In Kg 16.6
Labor In Hand/day 1
Treated wastewater
In m3 300
Parsley s In Seeds or
splits 5000
Parsley p out kg 1000
Mint FTWW
1 dunums
fertilizers In Kg 16.6
Labor In Hand/day 1
Treated wastewater
In m3 300
Mint s In Seeds or
splits 5000
Mint p out kg 1000
Almond FTWW
1 dunums
fertilizers In Kg 20
Labor In Hand/day 1
Treated wastewater
In m3 400
Almond s In Seeds or
splits 40
Almond p out kg 4000
Fig FTWW 1 dunums
fertilizers In Kg 7
Labor In Hand/day 1
Treated wastewater
In m3 250
Fig s In Seeds or
splits 40
Fig p out kg 800
Olives FTWW
1 dunums
fertilizers In Kg 14
Labor In Hand/day 1
Treated In m3 100

193
wastewater
Olives s In Seeds or
splits 40
Olives p out kg 100
Tomatoes FWA
1 dunums
fertilizers In Kg 150
Labor In Hand/day 1
Water A In m3 400
Tomatoes s In Seeds or
splits 100
Tomatoes p out kg 4000
Natural Cucumber
FWA 1 dunums
fertilizers In Kg 220
Labor In Hand/day 1
Water A In m3 450
Natural Cucumber s
In Seeds or
splits 1200
Natural Cucumber p
out kg 4000
Green House
Cucumber FWA
1 dunums
fertilizers In Kg 300
Labor In Hand/day 1
Water A In m3 500
Green House Cucumber s
In Seeds or
splits 2000
Green House Cucumber p
out kg 10000
Egg Plant FWA
1 dunums
fertilizers In Kg 150
Labor In Hand/day 1
Water A In m3 400
Egg Plant s In Seeds or
splits 1200
Egg Plant p out kg 4000
Zucchini FWA
1 dunums
fertilizers In Kg 120
Labor In Hand/day 1
Water A In m3 350
Zucchini s In Seeds or
splits 1200
Zucchini p out kg 3000
Cabbage FWA
1 dunums
fertilizers In Kg 100
Labor In Hand/day 1
Water A In m3 250
Cabbage s In Seeds or
splits 2000
Cabbage p out kg 4000
Beans FWA 1 dunums
fertilizers In Kg 80
Labor In Hand/day 1
Water A In m3 300
Beans s In Seeds or
splits 2000

194
Beans p out kg 900
Spanish FWA
1 dunums
fertilizers In Kg 50
Labor In Hand/day 1
Water A In m3 200
Spanish s In Seeds or
splits 2000
Spanish p out kg 800
Potato FWA
1 dunums
fertilizers In Kg 250
Labor In Hand/day 1
Water A In m3 500
Potato s In Seeds in kg 150
Potato p out kg 4000
Orange FWA
1 dunums
fertilizers In Kg 210
Labor In Hand/day 1
Water A In m3 1200
Orange s In Seeds or
splits 40
Orange p out kg 3500
Peach FWA 1 dunums
fertilizers In Kg 60
Labor In Hand/day 1
Water A In m3 400
Peach s In Seeds or
splits 40
Peach p out kg 3000
Plum FWA 1 dunums
fertilizers In Kg 60
Labor In Hand/day 1
Water A In m3 400
Plum s In Seeds or
splits 40
Plum p out kg 3000
Nectarine FWA
1 dunums
fertilizers In Kg 60
Labor In Hand/day 1
Water A In m3 400
Nectarine s In Seeds or
splits 40
Nectarine p out kg 3000
Lemon FWA
1 dunums
fertilizers In Kg 210
Labor In Hand/day 1
Water A In m3 400
Lemon s In Seeds or
splits 40
Lemon p out kg 5000
Parsley FWA
1 dunums
fertilizers In Kg 50
Labor In Hand/day 1
Water A In m3 300
Parsley s In Seeds or
splits 5000

195
Parsley p out kg 1000
Mint FWA 1 dunums
fertilizers In Kg 50
Labor In Hand/day 1
Water A In m3 300
Mint s In Seeds or
splits 5000
Mint p out kg 1000
Almond FWA
1 dunums
fertilizers In Kg 60
Labor In Hand/day 1
Water A In m3 400
Almond s In Seeds or
splits 40
Almond p out kg 4000
Fig FWA 1 dunums
fertilizers In Kg 20
Labor In Hand/day 1
Water A In m3 250
Fig s In Seeds or
splits 40
Fig p out kg 800
Olives FWA
1 dunums
fertilizers In Kg 40
Labor In Hand/day 1
Water A In m3 100
Olives s In Seeds or
splits 40
Olives p out kg 100
Tomatoes FWK
1 dunums
fertilizers In Kg 150
Labor In Hand/day 1
Water k In m3 400
Tomatoes s In Seeds or
splits 100
Tomatoes p out kg 4000
Natural Cucumber
FWK 1 dunums
fertilizers In Kg 220
Labor In Hand/day 1
Water k In m3 450
Natural Cucumber s
In Seeds or
splits 1200
Natural Cucumber p
out kg 4000
Green House
Cucumber FWK
1 dunums
fertilizers In Kg 300
Labor In Hand/day 1
Water k In m3 500
Green House Cucumber s
In Seeds or
splits 2000
Green House Cucumber p
out kg 10000
Egg Plant FWK
1 dunums fertilizers In Kg 150
Labor In Hand/day 1

196
Water k In m3 400
Egg Plant s In Seeds or
splits 1200
Egg Plant p out kg 4000
Zucchini FWK
1 dunums
fertilizers In Kg 120
Labor In Hand/day 1
Water k In m3 350
Zucchini s In Seeds or
splits 1200
Zucchini p out kg 3000
Cabbage FWK
1 dunums
fertilizers In Kg 100
Labor In Hand/day 1
Water k In m3 250
Cabbage s In Seeds or
splits 2000
Cabbage p out kg 4000
Beans FWK 1 dunums
fertilizers In Kg 80
Labor In Hand/day 1
Water k In m3 300
Beans s In Seeds or
splits 2000
Beans p out kg 900
Spanish FWK
1 dunums
fertilizers In Kg 50
Labor In Hand/day 1
Water k In m3 200
Spanish s In Seeds or
splits 2000
Spanish p out kg 800
Potato FWK
1 dunums
fertilizers In Kg 250
Labor In Hand/day 1
Water k In m3 500
Potato s In Seeds in kg 150
Potato p out kg 4000
Orange FWK
1 dunums
fertilizers In Kg 210
Labor In Hand/day 1
Water k In m3 1200
Orange s In Seeds or
splits 40
Orange p out kg 3500
Peach FWK 1 dunums
fertilizers In Kg 60
Labor In Hand/day 1
Water k In m3 400
Peach s In Seeds or
splits 40
Peach p out kg 3000
Plum FWK 1 dunums fertilizers In Kg 60
Labor In Hand/day 1

197
Water k In m3 400
Plum s In Seeds or
splits 40
Plum p out kg 3000
Nectarine FWK
1 dunums
fertilizers In Kg 60
Labor In Hand/day 1
Water k In m3 400
Nectarine s In Seeds or
splits 40
Nectarine p out kg 3000
Lemon FWK
1 dunums
fertilizers In Kg 210
Labor In Hand/day 1
Water k In m3 400
Lemon s In Seeds or
splits 40
Lemon p out kg 5000
Parsley FWK
1 dunums
fertilizers In Kg 50
Labor In Hand/day 1
Water k In m3 300
Parsley s In Seeds or
splits 5000
Parsley p out kg 1000
Mint FWK 1 dunums
fertilizers In Kg 50
Labor In Hand/day 1
Water k In m3 300
Mint s In Seeds or
splits 5000
Mint p out kg 1000
Almond FWK
1 dunums
fertilizers In Kg 60
Labor In Hand/day 1
Water k In m3 400
Almond s In Seeds or
splits 40
Almond p out kg 4000
Fig FWK 1 dunums
fertilizers In Kg 20
Labor In Hand/day 1
Water k In m3 250
Fig s In Seeds or
splits 40
Fig p out kg 800
Olives FWK
1 dunums
fertilizers In Kg 40
Labor In Hand/day 1
Water k In m3 100
Olives s In Seeds or
splits 40
Olives p out kg 100
Tomatoes 1 dunums fertilizers In Kg 150

198
FWM Labor In Hand/day 1
Water m In m3 400
Tomatoes s In Seeds or
splits 100
Tomatoes p out kg 4000
Natural Cucumber
FWM 1 dunums
fertilizers In Kg 220
Labor In Hand/day 1
Water m In m3 450
Natural Cucumber s
In Seeds or
splits 1200
Natural Cucumber p
out kg 4000
Green House
Cucumber FWM
1 dunums
fertilizers In Kg 300
Labor In Hand/day 1
Water m In m3 500
Green House Cucumber s
In Seeds or
splits 2000
Green House Cucumber p
out kg 10000
Egg Plant FWM
1 dunums
fertilizers In Kg 150
Labor In Hand/day 1
Water m In m3 400
Egg Plant s In Seeds or
splits 1200
Egg Plant p out kg 4000
Zucchini FWM
1 dunums
fertilizers In Kg 120
Labor In Hand/day 1
Water m In m3 350
Zucchini s In Seeds or
splits 1200
Zucchini p out kg 3000
Cabbage FWM
1 dunums
fertilizers In Kg 100
Labor In Hand/day 1
Water m In m3 250
Cabbage s In Seeds or
splits 2000
Cabbage p out kg 4000
Beans FWM
1 dunums
fertilizers In Kg 80
Labor In Hand/day 1
Water m In m3 300
Beans s In Seeds or
splits 2000
Beans p out kg 900
Spanish FWM
1 dunums
fertilizers In Kg 50
Labor In Hand/day 1
Water m In m3 200
Spanish s In Seeds or 2000

199
splits
Spanish p out kg 800
Potato FWM
1 dunums
fertilizers In Kg 250
Labor In Hand/day 1
Water m In m3 500
Potato s In Seeds in kg 150
Potato p out kg 4000
Orange FWM
1 dunums
fertilizers In Kg 210
Labor In Hand/day 1
Water m In m3 1200
Orange s In Seeds or
splits 40
Orange p out kg 3500
Peach FWM
1 dunums
fertilizers In Kg 60
Labor In Hand/day 1
Water m In m3 400
Peach s In Seeds or
splits 40
Peach p out kg 3000
Plum FWM 1 dunums
fertilizers In Kg 60
Labor In Hand/day 1
Water m In m3 400
Plum s In Seeds or
splits 40
Plum p out kg 3000
Nectarine FWM
1 dunums
fertilizers In Kg 60
Labor In Hand/day 1
Water m In m3 400
Nectarine s In Seeds or
splits 40
Nectarine p out kg 3000
Lemon FWM
1 dunums
fertilizers In Kg 210
Labor In Hand/day 1
Water m In m3 400
Lemon s In Seeds or
splits 40
Lemon p out kg 5000
Parsley FWM
1 dunums
fertilizers In Kg 50
Labor In Hand/day 1
Water m In m3 300
Parsley s In Seeds or
splits 5000
Parsley p out kg 1000
Mint FWM 1 dunums
fertilizers In Kg 50
Labor In Hand/day 1
Water m In m3 300
Mint s In Seeds or 5000

200
splits
Mint p out kg 1000
Almond FWM
1 dunums
fertilizers In Kg 60
Labor In Hand/day 1
Water m In m3 400
Almond s In Seeds or
splits 40
Almond p out kg 4000
Fig FWM 1 dunums
fertilizers In Kg 20
Labor In Hand/day 1
Water m In m3 250
Fig s In Seeds or
splits 40
Fig p out kg 800
Olives FWM
1 dunums
fertilizers In Kg 40
Labor In Hand/day 1
Water m In m3 100
Olives s In Seeds or
splits 40
Olives p out kg 100
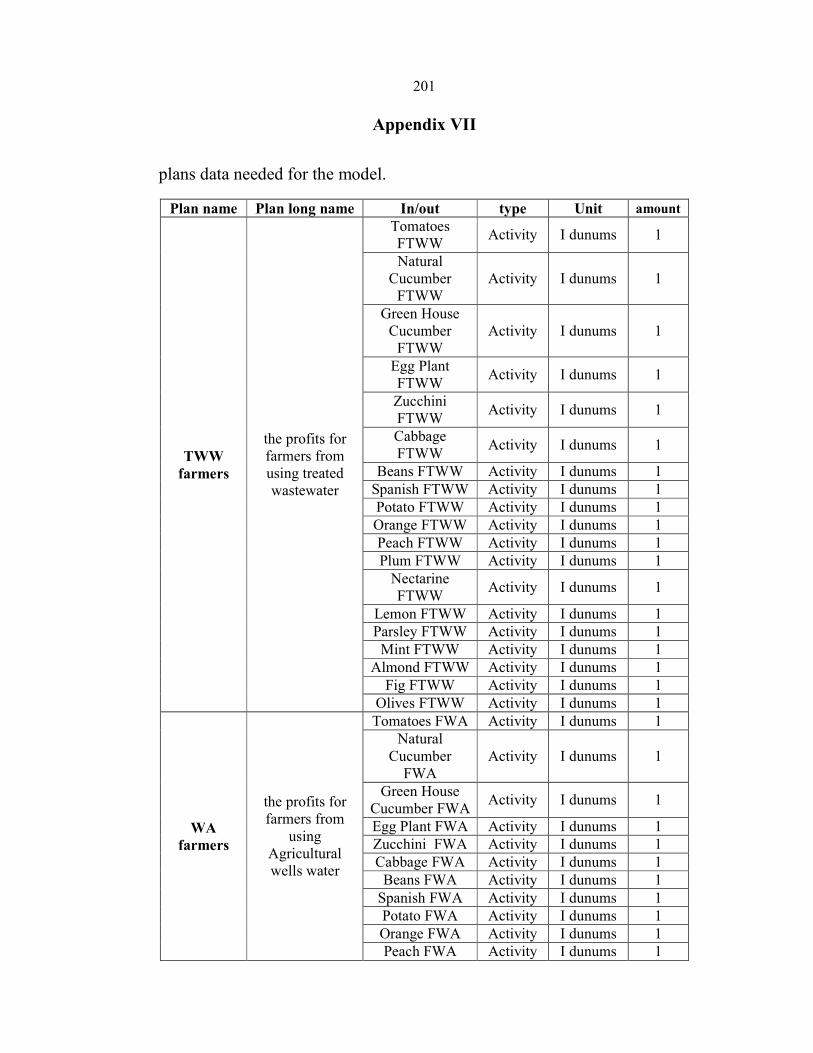
201
Appendix VII
plans data needed for the model.
Plan name Plan long name In/out type Unit amount
TWW farmers
the profits for farmers from using treated wastewater
Tomatoes FTWW
Activity I dunums 1
Natural Cucumber
FTWW Activity I dunums 1
Green House Cucumber
FTWW Activity I dunums 1
Egg Plant FTWW
Activity I dunums 1
Zucchini FTWW
Activity I dunums 1
Cabbage FTWW
Activity I dunums 1
Beans FTWW Activity I dunums 1
Spanish FTWW Activity I dunums 1
Potato FTWW Activity I dunums 1
Orange FTWW Activity I dunums 1
Peach FTWW Activity I dunums 1
Plum FTWW Activity I dunums 1
Nectarine FTWW
Activity I dunums 1
Lemon FTWW Activity I dunums 1
Parsley FTWW Activity I dunums 1
Mint FTWW Activity I dunums 1
Almond FTWW Activity I dunums 1
Fig FTWW Activity I dunums 1
Olives FTWW Activity I dunums 1
WA farmers
the profits for farmers from
using Agricultural wells water
Tomatoes FWA Activity I dunums 1
Natural Cucumber
FWA Activity I dunums 1
Green House Cucumber FWA
Activity I dunums 1
Egg Plant FWA Activity I dunums 1
Zucchini FWA Activity I dunums 1
Cabbage FWA Activity I dunums 1
Beans FWA Activity I dunums 1
Spanish FWA Activity I dunums 1
Potato FWA Activity I dunums 1
Orange FWA Activity I dunums 1
Peach FWA Activity I dunums 1

202
Plum FWA Activity I dunums 1
Nectarine FWA Activity I dunums 1
Lemon FWA Activity I dunums 1
Parsley FWA Activity I dunums 1
Mint FWA Activity I dunums 1
Almond FWA Activity I dunums 1
Fig FWA Activity I dunums 1
Olives FWA Activity I dunums 1
WK farmers
the profits for farmers from
using palestiniane
water department
water
Tomatoes FWK Activity I dunums 1
Natural Cucumber
FWK Activity I dunums 1
Green House Cucumber FWK
Activity I dunums 1
Egg Plant FWK Activity I dunums 1
Zucchini FWK Activity I dunums 1
Cabbage FWK Activity I dunums 1
Beans FWK Activity I dunums 1
Spanish FWK Activity I dunums 1
Potato FWK Activity I dunums 1
Orange FWK Activity I dunums 1
Peach FWK Activity I dunums 1
Plum FWK Activity I dunums 1
Nectarine FWK Activity I dunums 1
Lemon FWK Activity I dunums 1
Parsley FWK Activity I dunums 1
Mint FWK Activity I dunums 1
Almond FWK Activity I dunums 1
Fig FWK Activity I dunums 1
Olives FWK Activity I dunums 1
WM farmers
the profits for farmers from
using municipality
water
Tomatoes FWM Activity I dunums 1
Natural Cucumber
FWM Activity I dunums 1
Green House Cucumber
FWM Activity I dunums 1
Egg Plant FWM Activity I dunums 1
Zucchini FWM Activity I dunums 1
Cabbage FWM Activity I dunums 1
Beans FWM Activity I dunums 1
Spanish FWM Activity I dunums 1
Potato FWM Activity I dunums 1
Orange FWM Activity I dunums 1
Peach FWM Activity I dunums 1
Plum FWM Activity I dunums 1
Nectarine FWM Activity I dunums 1
Lemon FWM Activity I dunums 1

203
Parsley FWM Activity I dunums 1
Mint FWM Activity I dunums 1
Almond FWM Activity I dunums 1
Fig FWM Activity I dunums 1
Olives FWM Activity I dunums 1
Municipality profit
municipality profit from treatment
WW collection Activity md 1
WW treatment Activity md 1

جامعة النجاح الوطنية كلية الدراسات العليا
تقييم إمكانية إعادة استخدام المياه العادمة في فلسطينا وتحليل سلاسل القيم باستخدام إعادة هندسة العمليات تجاري
محافظة نابلسل حالة دراسية: كأدوات
إعداد
لين يحيى امين عرفات
إشراف
الفتاح حسن الملاح عبد .د
قدمت هذه الأطروحة استكمالاً لمتطلبات درجة الماجستير في هندسة المياه والبيئة بكلية
.الدراسات العليا في جامعة النجاح الوطنية في نابلس، فلسطين م2015

ب
ا باستخدام إعادة هندسة العمليات تجاري تقييم إمكانية إعادة استخدام المياه العادمة في فلسطين
محافظة نابلسحالة دراسية ل: كأدوات وتحليل سلاسل القيم إعداد
لين يحيى امين عرفات
إشراف الفتاح حسن الملاح عبد
الملخص
المشكلات المائيه و البيئيه هي الاكثر شيوعا هذا القرن، بسبب الكميات المتناقصه من
تعاني من فلسطين هي واحدة من الدول التي . مياه الشرب و البئه الظيفة للاجيال المستقبلية
.المشكلتين و تحتاج الى حلول جوهريه لهما
عدم القدرة على البحصول على المياه في فلسطين و الطلب المتزايد عليها يجبر
ان . الحكومة و العلماء على البحشث عن مصادر جدبيدة للمياه و منها المياه العادمة المعالجة
المياه الصالحه للشرب المستعملة في الزراعه استعمال المياه العادمة المعالجة سيقلل من كميات
وايضا سيحل مسكلة بيئية خطيرة وهي تلوث المياه الجوفية بالمياه العادمة الغير معالجة الملقه
.في الوديان
سيتم دراسة المياه العادمة المعالجة في فلسطين من ناحية ليس فقط بيئية و ايضا كسلعة
.المعيقات امامها وايجاد حلول لها لتطوير هذا القطاع اقتصادية و ذلك للتعرف على جميع
إعادة :تم دمج مفهومين اقتصاديين جديدين همامن اجل تحقيق جميع اهداف البحث
ا وتحليل سلاسل القيم كأدوات لتققيم المعيقات امام اعادة استخدام المياه هندسة العمليات تجاري
.العادمه المعالجة بشكل فعال
العديد من الابحاث و الدراسات الميدانية و المقابلات وورش العمل وفق مناهج تم القيام ب
علمية للتأكد من مصداقية النتائج التي اظهرت ان العاملان القتصادي و الاجتماعي هما اكبر
.المعيقات امام هذا القطاع

ج
على اوضحت النتائج الرئيسية للدراسة ان العمر و الجنس و التعليم ليس له اي اثر
التقبل المجتمعي للمياه العادمة المعالجة و منتجاتها، و ان فقط الحالة الاجتماعي من حيث
هذه النتائج و غيرها تم .الزواج وعدمة ا اعالة اسرة ام لا هو ما له اثر على التقبل الاجتماعي
ستعمالها في استعمالها كمدخلات لنموذج تحليل سلاسل القيم لنمذجة قطاع المياه العادمة المعاد ا
ونتج عن ذلك وصف وضع القطاع بالضعيف و . الزراعة، وذلك لتقييم وضع القطاع الحالي
.الفتقار الى الدعم في الاتجاه الصحيح و التنظيم
تم استعمال النتائج من نموذج تحليل سلاسل القيم لادخالها الى نموذج اعادة هندسة
المياه العادمة المعالجة و ذلك لاعادة هندسته مما اعطى العمليات تجاريا لقطاع اعادة استعمال
.كيانات جديدة منظمه للنموذج الجديد المعاد هندسته لهذا القطاع
من ناحية هندسية فان الزيادة في التقبل الاجتماعي لاستعمال المياه العادمة المعالجة و
اه و المياه العادمة المعالجة، و منتجاتها سيزيد ارباح المزارعين المستخدمين لها و مزودي المي
هذا سيحدث في حالة تطبيق النموذج الجديدي المعاد هندسته للقطاع مع القوانين و الانظمة و
.الاصلاحات المناسبة
ينصح الباحث بعمل حملات توعية عن استعمال المياه العادمة المعالجة و منتجاتها على
لغ اكبر من المال في دعم النموذج الجديد لهذا نطاق وطني واسع، كما و ينصح باستثمار مبا
القطاع الذي سيشجع على القيام بمشاريع جديدة في مجالات البنية التحتية و الزراعة و خلق
.فرص عمل جديدة