ASSESSING THE IMPACT OF WILDFIRES ON THE CALIFORNIA ...A Report for: California’s Fourth Climate...
79
ASSESSING THE IMPACT OF WILDFIRES ON THE CALIFORNIA ELECTRICITY GRID A Report for: California’s Fourth Climate Change Assessment Prepared By: Larry Dale, Michael Carnall, and Max Wei 1 , Gary Fitts 2 , Sarah Lewis McDonald 3 1 Lawrence Berkeley National Laboratory 2 Greenware Technologies 3 Envision Geo DISCLAIMER This report was prepared as the result of work sponsored by the California Energy Commission. It does not necessarily represent the views of the Energy Commission, its employees, or the State of California. The Energy Commission, the State of California, its employees, contractors, and subcontractors make no warrant, express or implied, and assume no legal liability for the information in this report; nor does any party represent that the uses of this information will not infringe upon privately owned rights. This report has not been approved or disapproved by the California Energy Commission; nor has the California Energy Commission passed upon the accuracy or adequacy of the information in this report. Edmund G. Brown, Jr., Governor August 2018 CCCA4-CEC-2018-002
Transcript of ASSESSING THE IMPACT OF WILDFIRES ON THE CALIFORNIA ...A Report for: California’s Fourth Climate...
ASSESSING THE IMPACT OF WILDFIRES ON THE CALIFORNIA ELECTRICITY GRID
A Report for:
California’s Fourth Climate Change Assessment
Prepared By: Larry Dale, Michael Carnall, and Max Wei1, Gary Fitts2, Sarah Lewis McDonald3 1Lawrence Berkeley National Laboratory 2Greenware Technologies 3Envision Geo
DISCLAIMER
This report was prepared as the result of work sponsored by the California Energy Commission. It does not necessarily represent the views of the Energy Commission, its employees, or the State of California. The Energy Commission, the State of California, its employees, contractors, and subcontractors make no warrant, express or implied, and assume no legal liability for the information in this report; nor does any party represent that the uses of this information will not infringe upon privately owned rights. This report has not been approved or disapproved by the California Energy Commission; nor has the California Energy Commission passed upon the accuracy or adequacy of the information in this report.
Edmund G. Brown, Jr., Governor
August 2018
CCCA4-CEC-2018-002

i
ACKNOWLEDGEMENTS
We appreciate this opportunity to thank the many people who assisted us on this project. These include the administrative staff at Lawrence Berkeley National Laboratory. They helped us write our proposal, manage our budget, and deal with day-to-day frustrations with tireless grace. Research staff at Lawrence Berkeley Laboratory gave us much unpaid advice about the California electricity system. We would particularly like to thank Nikit Abhyankar, Guilia Gallo, Xinguang Cui, and Jeffrey Greenblatt for their help in modeling the California grid.
Special mention must be given to several university and state or federal agency people on the project. These include Joshia Johnston at U.C. Berkeley and Matthias Fripp at the University of Hawaii. We would never have won this contract nor completed this work without their guidance and support early on in this project. Jon Keeley at the USGS helped drive home for us some of the complexities of wildfire science. We are grateful to Leroy Westerling at the University of California, Merced for helping to explain the wildfire simulations used in this analysis. Ben Sleeter at the United States Geologic Survey provided similar assistance with the population projections.
Our Technical Advisory Committee deserves special thanks for patiently listening and providing feedback about our ideas for evaluating wildfires impacts. Joe Eto, a staff scientist at Lawrence Berkeley National Laboratory, explained the difference between outages and interruptions. Brian Biancardi at Pacific Gas and Electric and Troy Whitman at Southern California Edison provided a utility perspective and valuable time in the midst of a hectic wildfire season. Tim Beach summarized 15 years of California Independent System Operator (CAISO) logs to help shed light on transmission wildfire impacts.
Finally, we would like to formally thank David Stoms, our project manager at the California Energy Commission, for being so patient with us throughout the long time we worked together on this study.
ii
PREFACE
California’s Climate Change Assessments provide a scientific foundation for understanding climate-related vulnerability at the local scale and informing resilience actions. These assessments contribute to the advancement of science-based policies, plans, and programs to promote effective climate leadership in California. In 2006, California released its First Climate Change Assessment, which shed light on the impacts of climate change on specific sectors in California and was instrumental in supporting the passage of the landmark legislation Assembly Bill 32 (Núñez, Chapter 488, Statutes of 2006), California’s Global Warming Solutions Act. The Second Assessment concluded that adaptation is a crucial complement to reducing greenhouse gas emissions (2009), given that some changes to the climate are ongoing and inevitable, motivating and informing California’s first Climate Adaptation Strategy released the same year. In 2012, California’s Third Climate Change Assessment made substantial progress in projecting local impacts of climate change, investigating consequences to human and natural systems, and exploring barriers to adaptation.
Under the leadership of Governor Edmund G. Brown, Jr., a trio of state agencies jointly managed and supported California’s Fourth Climate Change Assessment: California’s Natural Resources Agency (CNRA), the Governor’s Office of Planning and Research (OPR), and the California Energy Commission (Energy commission). The Climate Action Team Research Working Group, through which more than 20 state agencies coordinate climate-related research, served as the steering committee, providing input for a multi-sector call for proposals, participating in selection of research teams, and offering technical guidance throughout the process.
California’s Fourth Climate Change Assessment (Fourth Assessment) advances actionable science that serves the growing needs of state and local-level decision-makers from a variety of sectors. It includes research to develop rigorous, comprehensive climate change scenarios at a scale suitable for illuminating regional vulnerabilities and localized adaptation strategies in California; datasets and tools that improve integration of observed and projected knowledge about climate change into decision-making; and recommendations and information to directly inform vulnerability assessments and adaptation strategies for California’s energy sector, water resources and management, oceans and coasts, forests, wildfires, agriculture, biodiversity and habitat, and public health.
The Fourth Assessment includes 44 technical reports to advance the scientific foundation for understanding climate-related risks and resilience options, nine regional reports plus an oceans and coast report to outline climate risks and adaptation options, reports on tribal and indigenous issues as well as climate justice, and a comprehensive statewide summary report. All research contributing to the Fourth Assessment was peer-reviewed to ensure scientific rigor and relevance to practitioners and stakeholders.
For the full suite of Fourth Assessment research products, please visit www.climateassessment.ca.gov. This report contributes to our understanding of energy sector resilience by analyzing risks posed by wildfires to electricity transmission and distribution in California.

iii
ABSTRACT
This report focuses on the risk posed by wildfires to 40 transmission “paths” and seven urban “fringe” distribution areas. These transmission paths and fringe areas were chosen to illustrate different functions served by California’s complex electricity grid.
The urban “fringe” regions in Southern California, including the Los Angeles Basin and San Diego, face the highest risk from wildfires compared to other regions in the state. The wildfire model used in this study projects a slight decrease in future wildfire area in Southern California. Other model projections cited in this paper suggest that wildfire area will increase.
The mountainous parts of Northern California face a rapidly growing wildfire threat from climate change and urban growth. Adaptation options to decrease this threat to the grid should be considered. These options may include locating transmission in low fire risk zones, undergrounding lines, and encouraging urban infill to shrink urban perimeters.
Over the 2000-2016 period, wildfires in parts of California cost utilities more than $700 million in transmission and distribution related damages. Total wildfire damages to all sectors of the economy were naturally much larger. These damages would have been even higher without active wildfire protection. Recently, most wildfires caused only minor damage to transmission and distribution assets. A relatively small number of catastrophic wildfires were responsible for a disproportionate share of the transmission and distribution related damages. These wildfires are difficult to defend against and very hard to predict—as evidenced by the massive wildfires that occurred in 2017.
Keywords: wildfires, climate change, electricity grid, economic cost, transmission, and distribution
Please use the following citation for this paper:
Dale, Larry, Michael Carnall, Gary Fitts, Sarah Lewis McDonald, and Max Wei. (Lawrence Berkeley National Laboratory). 2018. Assessing the Impact of Wildfires on the California Electricity Grid. California’s Fourth Climate Change Assessment, California Energy Commission. Publication Number: CCCA4-CEC-2018-002.
iv
HIGHLIGHTS
Climate change is expected to increase wildfire risk to electrical transmission and distribution assets in Northern California, an impact made worse by the anticipated new transmission paths in the Sierra Nevada mountains.
Over the 2000-2016 period, wildfire damages to the transmission and distribution system in selected areas exceeded $700 million. Total wildfire damages to all sectors of the economy were much larger. Damage to distribution from wildfires during this period was significantly higher than wildfire-mediated damage to transmission.
The principal wildfire model used in this study suggests that future midcentury wildfire damages to distribution and transmission will, on average, remain close to the 2000-2016 levels. However, this model also suggests that there will be a significant increase in the number of extreme wildfire years similar to those experienced in the recent past. Nevertheless, overall there remains significant disagreement between wildfire models about future wildfire risk.
Future wildfire risk is expected to increase rapidly in many parts of the state, including some of the mountainous areas near Santa Barbara and Sacramento.
Recently, most wildfires caused no damage or only minor damage to transmission and distribution assets. A relatively small number of wildfires caused much of the transmission and distribution damages evaluated in this study.
Projected land use changes result in more compact urban development in parts of Southern California. This development pattern may help insulate urban fringe areas in the region from future wildfire risk.
Glossary: some readers of this report may not be familiar with the distinction between the “transmission” and the “distribution” portions of the electrical grid. Generally:
Transmission lines carry high voltage current on metal towers over undeveloped land. The transmission network is well mapped (although some state agency maps are out of date) and, with few exceptions, is controlled by the California Independent System Operator (CAISO, www.caiso.com).
Distribution lines carry lower voltages, usually on wooden poles, to structures within developed areas. There are many distribution networks owned and controlled by the different electric utilities. These utilities generally do not release maps of their networks.
The urban fringe, often called the wildland-urban interface, is the border between developed land on the one hand and forest, grass, or shrub land on the other. Distribution assets most at risk from wildfire damage lie within the urban fringe. Given the difficulty of mapping distribution networks, this report uses wildfire risk to the fringe as a proxy for risk to distribution assets.
v
TABLE OF CONTENTS
ACKNOWLEDGEMENTS .......................................................................................................................... i
PREFACE ....................................................................................................................................................... ii
ABSTRACT .................................................................................................................................................. iii
HIGHLIGHTS ............................................................................................................................................. iv
TABLE OF CONTENTS .............................................................................................................................. v
1: Introduction ............................................................................................................................................... 1
1.1 Methodology, Data Sources and Literature Review ....................................................................... 3
1.1.1 General Methodology ................................................................................................................... 3
1.1.2 Report Organization ..................................................................................................................... 4
1.1.3 Identify Electricity Grid Focus Areas ......................................................................................... 4
1.1.4 Measure Fire Exposure ................................................................................................................. 4
1.1.5 Estimate Fire Impacts ................................................................................................................... 5
1.2 Data Sources ......................................................................................................................................... 5
1.3 Models ................................................................................................................................................... 6
2: Wildfire Risk to Current Transmission ................................................................................................ 6
2.1 Identify Transmission Paths ............................................................................................................... 6
2.1.1 State Map of Transmission Paths ................................................................................................ 7
2.1.2 Characteristics of Transmission Paths ....................................................................................... 9
2.2 Fire Exposure of Transmission Paths .............................................................................................. 11
2.2.1 Regional Fire Exposure .............................................................................................................. 12
2.2.2 Transmission Path Fire Exposure Statistics ............................................................................. 14
2.3 Fire Impact and Cost .......................................................................................................................... 14
2.3.1 Path Fire Severity Ranking ........................................................................................................ 14
2.3.2 Cost of Path Interruption ........................................................................................................... 16
3: Wildfire Risk to Future Transmission ................................................................................................ 19
3.1 Identify Future Transmission Paths ................................................................................................ 19
3.1.1 Future Transmission Paths ........................................................................................................ 19
3.1.2 Transmission Path Adaptation Options .................................................................................. 21

vi
3.1.3 Future Transmission Path Characteristics ............................................................................... 22
3.2 Future Fire Risk to Transmission Paths .......................................................................................... 23
3.2.1 Future Path Fire Risk .................................................................................................................. 23
3.2.2 Future Path Fire Risk Statistics .................................................................................................. 24
3.3. Future Path Fire Impact and Cost ................................................................................................... 27
3.3.1 Future Path Wildfire Impact ...................................................................................................... 27
3.3.2 Cost of Future Path Interruption .............................................................................................. 28
4: Wildfire Risk to Current Distribution ................................................................................................ 30
4.1 Identify Urban Fringe Areas ............................................................................................................. 31
4.1.1 Characteristics of Fringe Study Areas ...................................................................................... 32
4.2 Exposure of Fringe Areas to Wildfires ............................................................................................ 34
4.2.1 Fringe Area Fire Statistics .......................................................................................................... 37
4.3 Fringe Area Fire Impact and Cost .................................................................................................... 37
4.3.1 Fringe Area Fire Severity ........................................................................................................... 37
4.3.2 Fringe Area Fire Costs ................................................................................................................ 40
5: Future Wildfire Risk to the Distribution System ............................................................................. 41
5.1 Identify Future Fringe Areas ............................................................................................................ 41
5.1.1 Adaptation Options for Future Fringe Areas .......................................................................... 43
5.1.2 Characteristics of Future Fringe Areas..................................................................................... 44
5.2 Fire Risk to the Future Fringe Areas ................................................................................................ 47
5.2.1 Risk to Future Fringe Areas ....................................................................................................... 47
5.2.2 Fire Risk to Future LA Basin Fringe ......................................................................................... 48
5.2.3 Fire Risk to Alternative Foothills Fringe Area ........................................................................ 48
5.2.4 Future Urban Fringe Area Fire Statistics ................................................................................. 49
5.3 Future Fire Impact and Costs ........................................................................................................... 51
5.3.1 Impact of Future Fires on Fringe Areas ................................................................................... 51
5.3.2 Adaptation to Fringe Area Fire Risk ........................................................................................ 52
6: Conclusion ............................................................................................................................................... 53
7: References ................................................................................................................................................ 54
vii
APPENDIX A: Estimated Benefits to California of Adaptation Options Identified in “Assessing the Impact of Wildfires on the California Electricity Grid” ............................................................ A-1
A.1 Estimate Statewide Social Cost of Wildfires .............................................................................. A-2
A.2 Estimate Benefit of Transmission Adaptation ........................................................................... A-6
A.3 Estimate Benefits of Distribution Adaptation ............................................................................ A-6
A.4 Summary: Quantitative Estimate of Proposed Measures to Protect T&D assets from Wildfires ................................................................................................................................................. A-7
A.5 References ....................................................................................................................................... A-8
APPENDIX B: Fire Risk to Distribution Fringe Areas—Figures and Tables ................................ B-1
APPENDIX C: Fire Risk to Transmission Paths—Figures and Tables ........................................... C-1

1
1: Introduction
Concerns about wildfires are mounting due to climate change and the noticeable and, in some cases, dramatic increase in recent wildfire activity in California. Wildfires affect society in ways that go far beyond the impacts they have on the electricity grid. Wildfire impacts on the grid are, nevertheless, significant and can be both large and widespread. In rural areas, wildfires threaten portions of the transmission grid and can, in some cases, threaten the stability of the grid itself. In urban fringe areas, wildfires threaten both structures and the distribution grid assets that supply electricity to those structures.
The purpose of this report is to describe and, to the degree possible, quantify these past and potential wildfire damages to California’s electricity grid. To accomplish this task, we (1) identify portions of the transmission and distribution grid facing high wildfire risk, (2) map locations of recent fires that threatened these portions of the grid, (3) evaluate the impact of these recent fires on electric utility transmission and distribution assets, and (4) project changes into the future in wildfire risk to the grid.
The 2017 wildfires in Napa and Sonoma may help explain what is included (and not included) in this report (Figure 1). One thing should be made clear at the start--although news media accounts suggest that transmission lines may have helped to ignite these fires, that issue is not covered in this report. Our report is focused on fire impacts to the grid, not grid impacts on fires.
More specifically, we concentrate on two grid related damages: fire damages to transmission and fire damages to distribution. The 2017 North Bay fires affected transmission lines in the region, leading to line outages and widespread service disruption. Our report includes information about similar outages and disruptions and their impact on electricity generation costs.
The fires also burned thousands of homes and structures in the region—indicated by dark red urban “fringe” cells in Figure 1. Along with structures in these areas, the fires also destroyed valuable distribution equipment, including poles, lines, and substations. Our report includes information about the cost of these distribution-related impacts. The benefits section in the appendix includes a rough estimate of the much larger cost of wildfires to California as a whole.

2
Figure 1: 2017 Wildfires in Napa and Sonoma Counties

3
1.1 Methodology, Data Sources and Literature Review
1.1.1 General Methodology Our analysis of the impact of wildfires on the electricity grid covered the following seven steps:
1. Transmission and distribution mapping
2. Wildfire exposure
3. Impact severity ranking
4. Future T&D map
5. Future wildfire risk
6. Cost impacts
7. Adaptation
In Step 1, mapping, we located the transmission and distribution (T&D) assets at high risk from wildfires including 40 transmission "paths" and seven distribution "fringe" areas. In Step 2, we drew upon a historical wildfire database to measure the exposure of these "path" and "fringe" areas to wildfires. Between 2001 and 2016, transmission paths were exposed to over 250 wildfires and urban fringe areas were exposed to over 700 wildfires of all sizes (Step 2).
Some of these wildfires had no impact while others had severe impacts to the grid. We developed an ordinal ranking system from 1 to 5 to measure the severity of these wildfire impacts. Most wildfires had little or no impact, a small number of wildfires had large impacts, and a very small number, between 1-7% of all wildfires depending on the region, had major impacts on T&D assets (Step 3).
Thirty years from now, urbanization will affect the location of T&D assets and global warming will change the exposure of these assets to wildfires. In Steps 4 and 5, we used models of urban growth (Sleeter et. al. 2017), transmission system growth (Fripp 2012), and future wildfires (Westerling 2018) to map the 2050 T&D assets and their exposure to wildfires. Our map of the 2050 grid includes additional paths (to achieve aggressive renewable energy goals) and a growing urban fringe (reflecting urban infill and expansion). Including 2050 wildfire risk projections, we estimate that T&D assets in Northern California will be exposed to significantly more wildfires and T&D assets in Southern California will be exposed to slightly fewer wildfires, compared to current levels, depending upon the region and asset type.
The change in wildfire exposure will affect grid-operating costs in a lot of ways. In Step 6, we estimated the cost to transmission (generation costs) using a grid power flow model (PLEXOS 2012). We estimated the cost to distribution (damages and replacement cost), using wildfire re- imbursement claims data (CPUC 2011).
These cost estimates assume a 2050 T&D grid that is similar to the 2015 T&D grid. In Step 7, we explored adaptation options to decrease future T&D exposure costs--locating transmission paths in low risk fire areas, undergrounding, and changing urban growth to encourage more infill. These options could substantially decrease wildfire costs to the grid.

4
1.1.2 Report Organization This report is organized into four chapters or sections describing wildfire impacts (1) to current transmission, (2) to future transmission, (3) to current distribution, and (4) to future distribution. Each section consists of three subsections that, in turn, identify the T&D assets in question, measure T&D exposure to wildfires, and quantify wildfire impacts and costs (Table 1).
Table 1: Organization of the Report
1.1.3 Identify Electricity Grid Focus Areas We used electricity manuals, personal communication, existing Energy Commission grid maps, and a future grid study to identify important transmission paths to evaluate in this study (WECC1 2013; Fripp, 2012; Southern California Edison 2016; LADWP 2017; CEC 2009, Nelson et. al, 2014). State land-use projections were used as a proxy for locating current and future distribution assets vulnerable to wildfires (Sleeter et al, 2017; Wilson et al. 2017).
1.1.4 Measure Fire Exposure We relied heavily on the CAL FIRE and National Interagency Fire Center wildfire data sets to measure historical fire risk to the focus areas (CAL FIRE 2018; National Interagency Fire Center 2017). The CPUC fire map identified high fire risk zones and helped confirm what we learned from the wildfire data sets (CPUC 2017). To project future fire risk, we used UC Merced wildfire model projections of wildfire probability (adapted from Westerling et. al 2011). Wildfire modeling is complicated and the UC Merced model projections are not necessarily consistent with other
1The Western Electricity Coordinating Council (WECC) is a non-profit corporation that exists to assure electric system reliability in a geographic area comprising 14 western states including California, British Columbia, Alberta, and northern Baja Mexico
5
forecasts of wildfire activity in the literature. Jin et al., for example, project more rapid increases in future wildfire risk in some regions (Jin et al. 2015, Jin et. al. 2014). Wildfire models differ importantly in their handling of key variables, including the size of wildfires and changes in vegetation. For example, the UC Merced model assumes a fixed distribution of wildfire size and Jin et al. (2015) allow wildfire size to vary in response to changes in wind speed.
1.1.5 Estimate Fire Impacts The California Independent System Operator (CAISO) provided both general guidance and characterizations of wildfire impacts to transmission paths for 268 wildfires occurring between 2003 and 2016 (Beach, 2017). We evaluated the cost impacts of a select subset of these fires with a CAISO electricity system production-cost model for the western North America Power Grid (WECC region1) in 2020 (WECC 2012; PLEXOS 2012). We also estimated the impact of wildfires on structures burned from National Interagency Fire Center (Redbook) data (NIFC 2018) and estimated the cost damages of these wildfires from Catastrophic Event Memorandum Account (CEMA) documents (CPUC 2011).
1.2 Data Sources
As mentioned above, we relied on CAL FIRE and National Interagency Fire Center primary wildfire databases for much of our quantitative analysis. These primary databases are referred to as FRAP and REDBOOK, respectively. The Redbook statistics are compiled by the National Interagency Fire Center. This database is limited to fires fought by CAL FIRE (National Interagency Fire Center 2018). REDBOOK includes information about the number of structures burned in fires but has no GIS information about fire locations. The FRAP database is more comprehensive than the REDBOOK database. It includes GIS locational information but does not have information about structures burned (CAL FIRE 2017).
We used the FRAP and REDBOOK primary databases to create the following three datasets:
Wildfire-Path dataset (2000-2016; 2003-2016)
Wildfire-Fringe dataset (2001-2016)
Wildfire-Structure dataset (2006-2015)
The Wildfire-Path Dataset includes 336 large (>400 acres) FRAP wildfires that approached any of the 40 transmission paths in our study between 2000 and 2016. This data set was used to determine the exposure of transmission paths to wildfires. Of these, grid performance data available after 2003 allowed us to evaluate the impact of 268 wildfires on transmission path performance between 2003 and 2016.
The Wildfire-Fringe dataset includes information about 360 large (>400 acres) FRAP wildfires located in or near the seven urban fringe areas in our study. This data set was used to gauge fringe area exposure to wildfires and their impact on distribution assets. The 2001-2016 time period corresponds to period of available GIS land use information.
Finally, the Wildfire-Structure dataset includes 291 matching wildfires included in both the FRAP and REDBOOK databases between 2006 and 2015. This data set was used to determine the number of structures burned in wildfires of varying size and proximity to fringe areas.

6
1.3 Models
The wildfire, land use, and electricity grid models used in the report provided key inputs and contain some important assumptions. The UC Merced wildfire model was used to project the probability of future period wildfires and exposure of the electricity grid to those fires. The UC Merced wildfire model was modified from earlier versions to use the USGS land use data described below (Westerling et. al 2011; Bryant and Westerling, 2014). The model estimates wildfire risk as a function of climate related variables, including rainfall, temperature, wind speed, and humidity. However, the model does not include the impacts of changes in fuel loading (vegetation) or wind speed in response to climate change.
The USGS Land Use and Carbon Simulator model (LUCAS) provided GIS information identifying, among other things, urban areas adjacent to burnable wild land, i.e., fringe areas (Sleeter et. al 2017). The model also projects future urban area development patterns consistent with historical trends and constraints. Spatial multipliers used in the model for this purpose tend to concentrate future development inside core urban areas. This development pattern tends to reduce the size of the urban-wildland interface in some areas.
A WECC model of the 2020 western North America power grid, run on PLEXOS software, was used to forecast generation cost impacts from wildfire disruptions to the grid (PLEXOS 2012). The WECC model includes many important generation and transmission path details and constraints. However, it is a direct current (DC) power flow model and it excludes potentially important grid stability constraints. Thus, there is potential for this model to underestimate the generation cost impacts of wildfire that caused disruptions to the grid.
Finally, we used the SWITCH model of the western US grid to locate new transmission paths in California needed to match midcentury generation and load patterns (Nelson et al., 2014). The SWITCH model determines cost minimizing transmission paths needed to link projected future generation with future load (Fripp, 2012). However, the grid constraints in the model are stylized, and its transmission path projections are not precisely located. We used the model to indicate the general location of new transmission paths and we used other geographical information to locate these paths on maps provided in this report.
2: Wildfire Risk to Current Transmission
2.1 Identify Transmission Paths
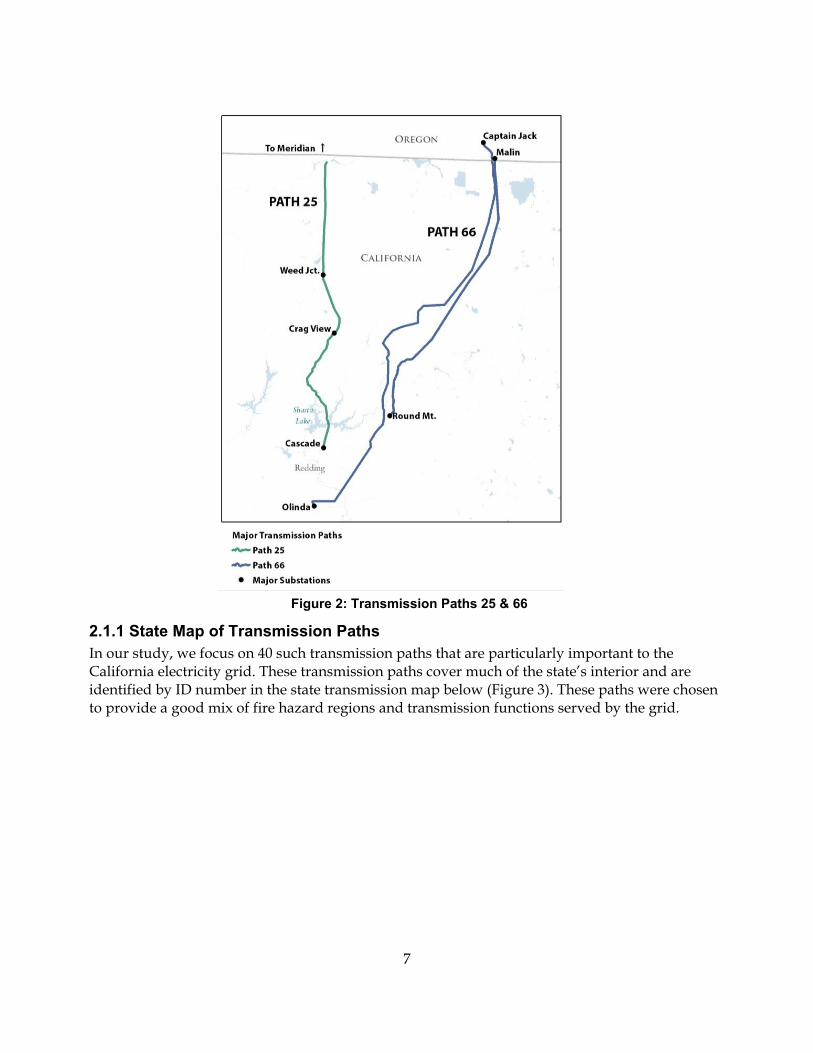
In this section, we first identify the portions of the state’s transmission grid that are most vulnerable to wildfires—either due to their importance or to their location near wildfire-prone areas. For example, Paths 25 and 66 are two important WECC-defined transmission paths located in Northern California (Figure 2). Both paths allow large imports of inexpensive hydropower from the Pacific Northwest. Path 66, in particular, travels through forested areas subject to wildfires.
7
Figure 2: Transmission Paths 25 & 66
2.1.1 State Map of Transmission Paths In our study, we focus on 40 such transmission paths that are particularly important to the California electricity grid. These transmission paths cover much of the state’s interior and are identified by ID number in the state transmission map below (Figure 3). These paths were chosen to provide a good mix of fire hazard regions and transmission functions served by the grid.

8
Figure 3: State Map of Transmission Paths Evaluated in this Report
For the purposes of this study, we have identified three types of transmission paths: (1) those that have been defined as numbered “Transfer Paths” by the WECC, (2) those with links to isolated generation, and (3) those with links to isolated urban areas. WECC Transfer Paths involve movement of bulk electricity and are defined in the WECC Path Rating Catalog. These WECC paths are identified as numbered paths on the state map in Figure 3. The paths that have links to isolated generation are identified with either “LADWP” for Los Angeles Department of Water and Power or “H” for hydropower. Lastly, those paths with links to isolated urban areas include

9
Santa Barbara (SB). Fire related outages at any of these locations have high potential to disrupt electricity service in the state.
Identification of transmission paths is important for the evaluation of fire risk. A fire anywhere along the path will have the same “de-rating” effect on the entire path. The appropriate measure of fire risk is, therefore, the probability or frequency of fires occurring anywhere along the path.2
2.1.2 Characteristics of Transmission Paths The 40 transmission paths included in our study include a mix of high voltage (500kV) and lower voltage (<500kV) lines. Twenty-three of the paths have lower voltage lines (<500kV) and seventeen paths have high voltage lines (500kV), including many of the numbered WECC paths. The 23 lower voltage paths include 2,300 miles of transmission lines while the higher voltage paths include 4324 miles.
The paths are located in four major geographical regions of the state. Almost half (19) of the transmission paths span mountainous regions in the Sierra and along the north coast (North), twelve paths cross the Southeastern desert (Desert), eight paths are located largely in Southern Coastal mountains stretching from Monterey to San Diego (South), and one path is located in the Central Valley (Table 2).
2 Paths identified with a number and appended “X” are extensions of WECC identified paths. Outages along these extensions would have similar effects on the grid to outages along the WECC identified portions of the paths.

10
Table 2: Description of Transmission Paths
Sources: WECC 2013; WECC 2012; Fripp, 2012; Southern California Edison 2016; LADWP 2017; CEC 2009, University of California 2013.

11
Note: A “cell” in the table measures 1/16º (3-4 miles) on a side and covers roughly 9000 acres. This corresponds to the spatial units used for the wildfire scenarios by UC Merced.
2.2 Fire Exposure of Transmission Paths
Wildfires are common in California. In one Northern California subregion, over 100 wildfires occurred between 2000 and 2016, covering 15-20% of the land area (CAL FIRE 2017) (Figure 4). Of those, 19 fires approached within a quarter mile of Paths 25 and 66.3 Wildfires near transmission paths may force the California Independent System Operator (CAISO) to cut power to those paths (line outages). This can increase generation costs and may disrupt customer service.
Figure 4: Transmission Paths 25 & 66 and Nearby Fires 2000-2016
3 These fires exceeded 10 acres in burned area.
12
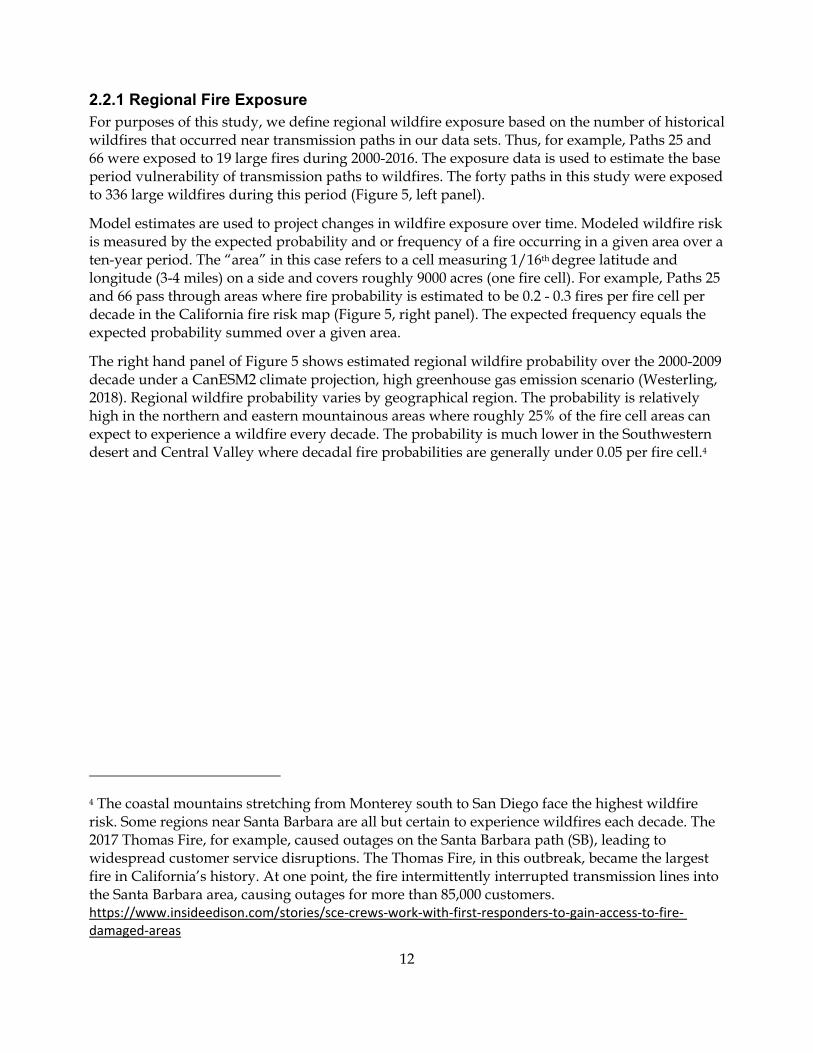
2.2.1 Regional Fire Exposure For purposes of this study, we define regional wildfire exposure based on the number of historical wildfires that occurred near transmission paths in our data sets. Thus, for example, Paths 25 and 66 were exposed to 19 large fires during 2000-2016. The exposure data is used to estimate the base period vulnerability of transmission paths to wildfires. The forty paths in this study were exposed to 336 large wildfires during this period (Figure 5, left panel).
Model estimates are used to project changes in wildfire exposure over time. Modeled wildfire risk is measured by the expected probability and or frequency of a fire occurring in a given area over a ten-year period. The “area” in this case refers to a cell measuring 1/16th degree latitude and longitude (3-4 miles) on a side and covers roughly 9000 acres (one fire cell). For example, Paths 25 and 66 pass through areas where fire probability is estimated to be 0.2 - 0.3 fires per fire cell per decade in the California fire risk map (Figure 5, right panel). The expected frequency equals the expected probability summed over a given area.
The right hand panel of Figure 5 shows estimated regional wildfire probability over the 2000-2009 decade under a CanESM2 climate projection, high greenhouse gas emission scenario (Westerling, 2018). Regional wildfire probability varies by geographical region. The probability is relatively high in the northern and eastern mountainous areas where roughly 25% of the fire cell areas can expect to experience a wildfire every decade. The probability is much lower in the Southwestern desert and Central Valley where decadal fire probabilities are generally under 0.05 per fire cell.4
4 The coastal mountains stretching from Monterey south to San Diego face the highest wildfire risk. Some regions near Santa Barbara are all but certain to experience wildfires each decade. The 2017 Thomas Fire, for example, caused outages on the Santa Barbara path (SB), leading to widespread customer service disruptions. The Thomas Fire, in this outbreak, became the largest fire in California’s history. At one point, the fire intermittently interrupted transmission lines into the Santa Barbara area, causing outages for more than 85,000 customers.
https://www.insideedison.com/stories/sce‐crews‐work‐with‐first‐responders‐to‐gain‐access‐to‐fire‐ damaged‐areas

13
Figure 5: The Exposure of California Transmission Paths to Wildfires
Figure 5 Fire Risk to California Transmission Paths
Modeled Fires 2000‐2009
Historic Fires 2000‐2016
Source: Westerling, 2018 CANESM2 RCP8.5 model
This is here To eliminate This legend OK?
This is here to cover t
Source: FRAP 2017

14
2.2.2 Transmission Path Fire Exposure Statistics Regional fire probability statistics for paths within these regions are provided in Table 3.
Table 3: Path Fire Exposure
Sources: Wildfire-Path data set (CAL FIRE 2017) and WECC path rating catalog (WECC 2013).
Paths crossing desert areas and Central Valley farmland have a low fire risk because there are so few wildfires in those regions. Paths crossing the Southern California Mountains, which are particularly prone to wildfires, have a high wildfire risk.
2.3 Fire Impact and Cost
2.3.1 Path Fire Severity Ranking Wildfires near paths can disrupt the electricity grid in various ways. As mentioned earlier, wildfires may cause a path outage, forcing CAISO to utilize different generation sources to avoid dependence on the threatened path. In other cases, where a single path serves an area, customer electricity service may be disrupted.
CAISO assisted us with this stage of the analysis. We provided CAISO with a dataset of 336 wildfires that approached transmission paths between 2001 and 2016. CAISO accessed logs describing actions taken by CAISO to deal with these fires and applied the following impact rating system (Table 4):
15
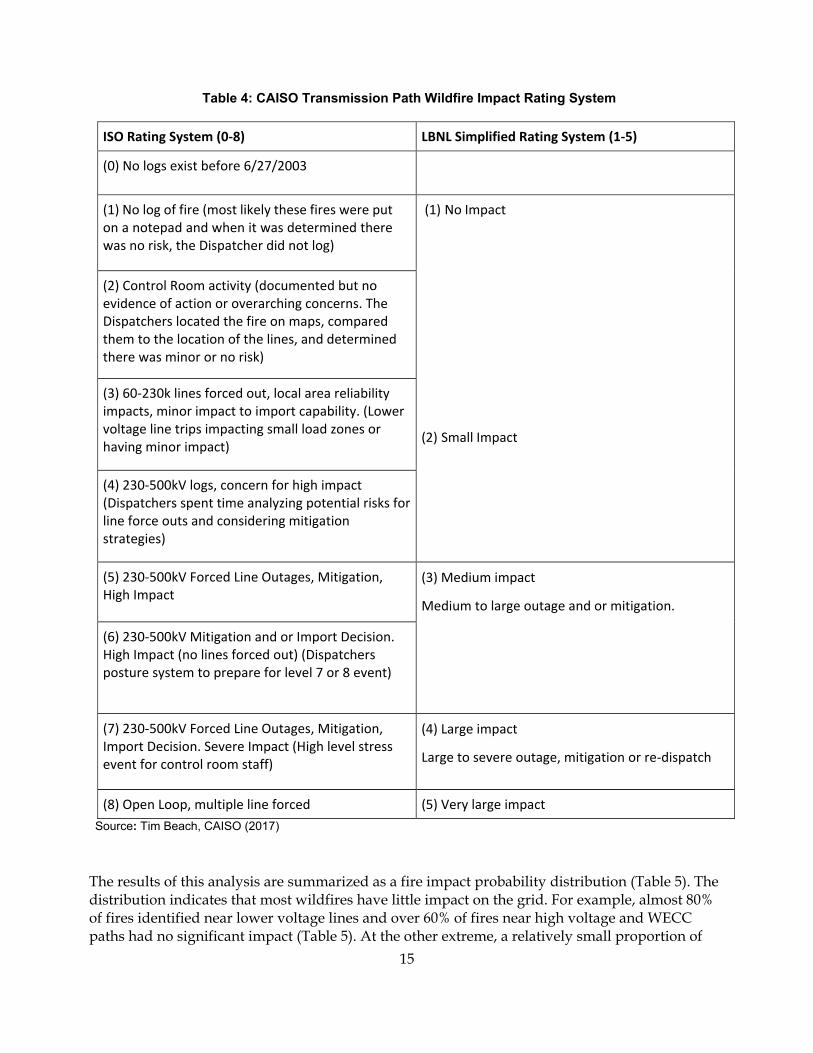
Table 4: CAISO Transmission Path Wildfire Impact Rating System
ISO Rating System (0‐8) LBNL Simplified Rating System (1‐5)
(0) No logs exist before 6/27/2003
(1) No log of fire (most likely these fires were put on a notepad and when it was determined there was no risk, the Dispatcher did not log)
(1) No Impact
(2) Small Impact
(2) Control Room activity (documented but no evidence of action or overarching concerns. The Dispatchers located the fire on maps, compared them to the location of the lines, and determined there was minor or no risk)
(3) 60‐230k lines forced out, local area reliability impacts, minor impact to import capability. (Lower voltage line trips impacting small load zones or having minor impact)
(4) 230‐500kV logs, concern for high impact (Dispatchers spent time analyzing potential risks for line force outs and considering mitigation strategies)
(5) 230‐500kV Forced Line Outages, Mitigation, High Impact
(3) Medium impact
Medium to large outage and or mitigation.
(6) 230‐500kV Mitigation and or Import Decision. High Impact (no lines forced out) (Dispatchers posture system to prepare for level 7 or 8 event)
(7) 230‐500kV Forced Line Outages, Mitigation, Import Decision. Severe Impact (High level stress event for control room staff)
(4) Large impact
Large to severe outage, mitigation or re‐dispatch
(8) Open Loop, multiple line forced (5) Very large impact
Source: Tim Beach, CAISO (2017)
The results of this analysis are summarized as a fire impact probability distribution (Table 5). The distribution indicates that most wildfires have little impact on the grid. For example, almost 80% of fires identified near lower voltage lines and over 60% of fires near high voltage and WECC paths had no significant impact (Table 5). At the other extreme, a relatively small proportion of

16
wildfires near paths pose major threats to grid stability. These wildfires, less than 10% of the total, resulted in either significant outages or costly changes in generation and dispatch.
Table 5: Path Fire Impact Severity Ranking
Sources: Tim Beach (2017) and the Wildfire-Path dataset (CAL FIRE 2017)
2.3.2 Cost of Path Interruption We identified several economic costs linked to wildfire events including increased generation costs, cleaning costs, and customer losses from service interruptions. Of these, we focused on increased generation costs to utilities due to uncertainty about these costs and their impact on utility revenue.5 Utility service interruptions impose very large consumer impacts but their impact on utility revenue is indirect for the most part (Hamachi La Commare and Eto 2006).
Wildfires raise generation costs by forcing users to draw electricity from relatively expensive sources that do not use threatened transmission lines. The size of the cost increase to utilities depends on a number of variables, including the price of the electricity source (price increment), the duration of the outage (duration), and the load (utilization). Below, a spreadsheet model with estimated values of these variables is used to give a sense of this cost increase.
Based on PLEXOS model runs described below, we chose $25 per MWh as the price increment for the high capacity transmission paths in our study and $10 per MWh as the price increment for the lower capacity paths in our study (Table 6). The average outage duration is set at one day for
5We estimated generation costs at the utility or state level, rather than at the national or western grid level.
2003‐2016 WECC and Non WECC Path FTotal WECC PathsTotal Non WECC Paths
Percent FiresTotal WECC PathsTotal Non WECC Paths
2003‐2016 Regional Fires by Impact SevDesert and Central ValleyNorthern California MountainsSouthern California Mountains
Percent FiresDesert and Central ValleyNorthern California MountainsSouthern California Mountains
Fire Count All Fires
Fires by Impa
103165
100.0%100.0%
verity Level3
132133
100.0%
100.0%100.0%
1 2 3 4 5
No Impact
Small line impact
Medium Impact
Large Impact
Very Large Impact
ct Severity Level64 2 19 16 2130 6 24 5 0
62% 2% 18% 16% 2%79% 4% 15% 3% 0%
3 0 0 0 0
116 6 8 2 074 2 36 19 2
100.0% 0.0% 0.0% 0.0% 0.0%
87.9% 4.5% 6.1% 1.5% 0.0%55.6% 1.5% 27.1% 14.3% 1.5%
17
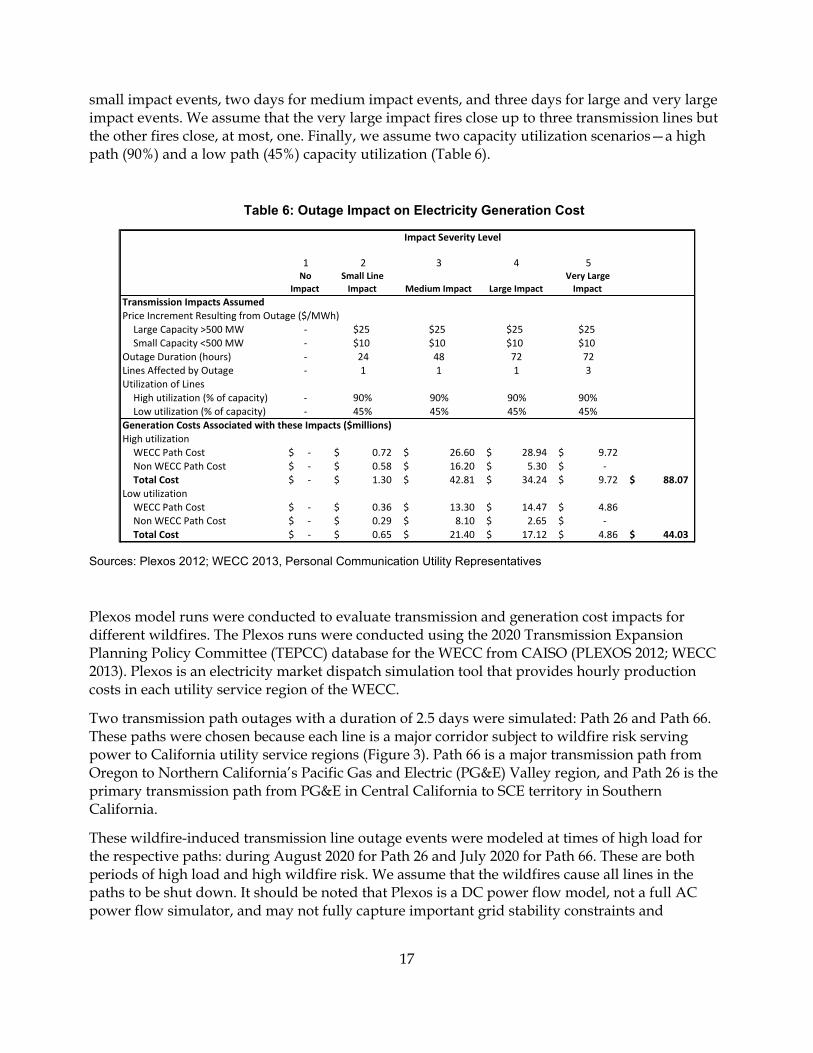
small impact events, two days for medium impact events, and three days for large and very large impact events. We assume that the very large impact fires close up to three transmission lines but the other fires close, at most, one. Finally, we assume two capacity utilization scenarios—a high path (90%) and a low path (45%) capacity utilization (Table 6).
Table 6: Outage Impact on Electricity Generation Cost
Sources: Plexos 2012; WECC 2013, Personal Communication Utility Representatives
Plexos model runs were conducted to evaluate transmission and generation cost impacts for different wildfires. The Plexos runs were conducted using the 2020 Transmission Expansion Planning Policy Committee (TEPCC) database for the WECC from CAISO (PLEXOS 2012; WECC 2013). Plexos is an electricity market dispatch simulation tool that provides hourly production costs in each utility service region of the WECC.
Two transmission path outages with a duration of 2.5 days were simulated: Path 26 and Path 66. These paths were chosen because each line is a major corridor subject to wildfire risk serving power to California utility service regions (Figure 3). Path 66 is a major transmission path from Oregon to Northern California’s Pacific Gas and Electric (PG&E) Valley region, and Path 26 is the primary transmission path from PG&E in Central California to SCE territory in Southern California.
These wildfire-induced transmission line outage events were modeled at times of high load for the respective paths: during August 2020 for Path 26 and July 2020 for Path 66. These are both periods of high load and high wildfire risk. We assume that the wildfires cause all lines in the paths to be shut down. It should be noted that Plexos is a DC power flow model, not a full AC power flow simulator, and may not fully capture important grid stability constraints and
1 2 3 4 5No
Impact
Small Line Impact Medium Impact Large Impact
Very Large Impact
Transmission Impacts AssumedPrice Increment Resulting from Outage ($/MWh)
Large Capacity >500 MW ‐ $25 $25 $25 $25Small Capacity <500 MW ‐ $10 $10 $10 $10
Outage Duration (hours) ‐ 24 48 72 72Lines Affected by Outage ‐ 1 1 1 3Utilization of Lines
High utilization (% of capacity) ‐ 90% 90% 90% 90%Low utilization (% of capacity) ‐ 45% 45% 45% 45%
Generation Costs Associated with these Impacts ($millions)High utilization
WECC Path Cost ‐$ 0.72$ 26.60$ 28.94$ 9.72$ Non WECC Path Cost ‐$ 0.58$ 16.20$ 5.30$ ‐$ Total Cost ‐$ 1.30$ 42.81$ 34.24$ 9.72$ 88.07$
Low utilizationWECC Path Cost ‐$ 0.36$ 13.30$ 14.47$ 4.86$ Non WECC Path Cost ‐$ 0.29$ 8.10$ 2.65$ ‐$ Total Cost ‐$ 0.65$ 21.40$ 17.12$ 4.86$ 44.03$
Impact Severity Level
18
transients. Thus, there is potential for this model to underestimate the generation cost impacts of wildfire caused disruptions.
Key results for these path outages are as follows:
1 The cost to serve load (power cost * load) of a path outage of 2.5 days is between $2-4 million dollars (about $2.1M for Path 26 in SCE, and $3.9M for Path 66 in PG&E Valley). These costs are incurred because higher cost power than the power that was imported must be procured within these regions during the fire outage.
2 At the same time, the net cost impact across the combined PG&E Valley and Bonneville Power Administration (BPA) service region in Oregon for Path 66 and across California overall (CAISO) for the Path 26 outage is essentially neutral. This is because, while the power costs in PG&E Valley and SCE increase for Path 66 and Path 26 outages respectively, the cost of power in the adjacent regions decreases because of higher supply.
3 The “marginal electricity cost” for PG&E Valley within-region electricity that is needed to replace the lost power from the BPA region when Path 66 is down is estimated to be $20.42/MWh in Day 1 of the outage and $10.26/MWh in Day 2 of the outage. The higher cost occurs in the higher load day.
4 The marginal electricity cost to serve load for SCE within-region electricity that is needed to replace the lost power from Path 26 is estimated to be $36.58/MWh in Day 1 of the outage and $24.17/MWh in Day 2 of the outage. Again, the higher cost occurs in a higher demand day.
These simulations help support the assumptions used in our own evaluation of wildfire costs (Table 6). The price increment in the simulations is between $20 and $37 for a large path on a high demand day, close to the price increment assumed in our model for large paths. The price increment on the lower demand days is close to $10, the figure assumed in our model for smaller capacity paths serving a smaller load. The total generation cost impact of wildfire outages in the Plexos is estimated at between $1 and $2 million per 24-hour outage.
We applied the price increment and other assumptions in a simple spreadsheet model to estimate generation cost impacts of wildfires between 2003 and 2016 (Table 6). The total estimated cost is $88.1 million for the high capacity utilization scenario and $44 million for the low capacity utilization scenario. The largest single impact resulted from two “very large impact” fires that increased local generation costs between $4.9 and $9.7 million. However, the bulk of the wildfire related costs were due to medium-to-large impact fires in our study (Table 6). These cost estimates are based on assumptions about wildfire duration and other variables that may need to be revised given additional information. The estimates hopefully provide an idea of the magnitude of wildfire costs and the direction of change in wildfire costs. For other purposes, these cost estimates should be considered very preliminary.

19
3: Wildfire Risk to Future Transmission
3.1 Identify Future Transmission Paths
We estimate wildfire exposure to the midcentury grid in two steps. First, we determine the configuration of the future grid and second, we project the change in wildfire risk to that grid between 2003 and 2050. Below, we describe these two steps in our analysis, beginning with a short list of changes we anticipate for the midcentury grid. Following, we estimate fire risk to that future grid based on model projections described earlier in the paper.
3.1.1 Future Transmission Paths Opinions vary about the makeup of the future transmission grid—from a completely transformed grid (e.g., due to wide-scale distributed generation) to a grid quite similar to what we see today.
Our projection of the future grid is relatively conservative, including only the addition of two new east-west transmission paths linking the central portion of California’s grid to renewable wind energy generation in the upper Midwest. The general location of these paths across the central Sierra Nevada is based on an Energy Commission study of the 2050 WECC grid, assuming a large increase in wind energy generation (Nelson et al., 2014). One of these paths connects the current Tracy, NV substation with the East Bay area. The other connects the same Tracy, NV substation with Path 15 at Los Banos (Figure 6).

20
Figure 6: New Transmission Paths and Path Options
Of the three alternate routes for the second path, the route along Highway 108 over Carson pass has the lowest fire risk, though the difference between paths is small (Table 6a).

21
Table 6a: New Transmission Paths & Options
3.1.2 Transmission Path Adaptation Options Additional changes to the future grid include alternative paths to replace or backup portions of existing paths 15, 15x, and 66x. The existing paths traverse regions exposed to many wildfires and the alternative paths cross the Central Valley where wildfires are infrequent. We selected low risk alternative paths as needed to both minimize wildfire exposure and to maintain transmission functionality. These paths are chosen to represent low risk adaption options in our analysis. Another adaptation option—placing existing transmission lines underground, may be a more cost effective option, at least in the near term. The cost effectiveness of this option is explored in the benefits section in the Appendix to this report.
22
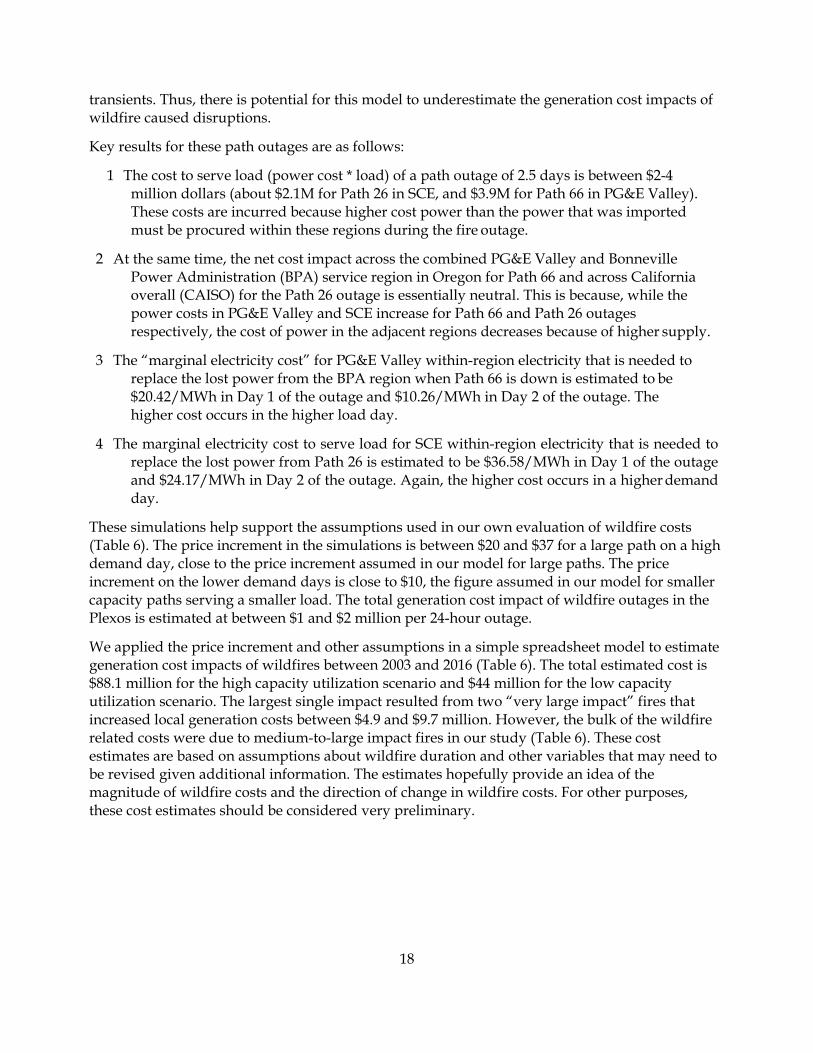
Figure 7: Low Fire Risk Path Alternatives
3.1.3 Future Transmission Path Characteristics To summarize the above sections, there are two new paths and three alternative paths included in our future transmission grid. The two new transportation paths include a series of 500 kV lines that span about 400 miles of largely mountainous terrain. These paths improve grid access to wind power in the Midwest that is needed to help California achieve its 2050 renewable energy goals (Nelson et al., 2014). The three alternative paths include 500 kV lines that cross 278 miles of largely agricultural land. They might replace similar paths that now cross 278 miles of land in the Coastal Mountains and Sierra foothills (Table 7).

23
Table 7: New and Alternative Path Characteristics
Source: GIS analysis applied to WECC 2013
3.2 Future Fire Risk to Transmission Paths
3.2.1 Future Path Fire Risk Our wildfire risk forecast is taken from University of California Merced wildfire model projections (Westerling 2018). The UC Merced wildfire model, described above in the introductory section, includes projections for a number of climate model and emission scenarios. Following, we report fire risk to transmission paths for one climate model and emission scenario (CanESM2-RCP8.5) (Figure 8). Fire risk projections for other climate models and emission scenarios are presented in the Appendix to this report.6 The wildfire risk forecasts associated with all climate models and emission scenarios project increased midcentury wildfire risk in Northern California but little or no change in midcentury fire risk in much of Southern California, except for Santa Barbara.
The model projections of 2040-2049 wildfire risk are similar in important respects to 2000-2009 wildfire risk. In both cases, risk is high in mountainous areas and low in the desert and Central Valley regions. The biggest change is apparent in parts of the eastern Sierra and northern Cascade
6It is important to note that fire risk may be changing in much of the state in ways not captured in the fire model used in this study. In 2017 alone, major fire events in both Southern California and Northern California have been added to the list of catastrophic fires. Note that we only carried out our analysis to midcentury. The UC Merced model shows the statewide area burned accelerating over the second half of the century and we recommend future research into wildfire impacts covering the 2050-2100 period.

24
Mountains where risk probabilities nearly double. Transmission paths in these regions face dramatically higher future fire risk.
Figure 8: Projected Change in Future Fire Risk
These high fire risk future paths also include the two new paths that cross the Sierra to access Midwestern wind. These paths span regions where wildfires are extremely likely.
3.2.2 Future Path Fire Risk Statistics Table 8 includes model estimates of current and midcentury fire risk for 40 current transmission paths, two new paths, and three alternative paths (Table 8). The table includes an estimate of the expected number of fires associated with each path for each period. The expected number of fires variable in the table is calculated as the estimated probability of a fire summed across all cells crossed by a transmission path in each decade.
It is worth noting that the “modeled” prediction of fire numbers can be compared against the historical fire count data over a similar period. The model “predicts” 318 fires near transmission paths in the 2000-2009 decade (Table 8). The historical data identifies 336 fires near transmission paths in the 2001-2016 period (Table 5). This suggests that the UC Merced Fire model is reasonably well-calibrated with the historical data.
The change in fire risk in different parts of the state is worth noting. At the beginning of this century, the paths located in the South Coast Mountains tended to have the highest wildfire risk (dark red and purple portions of Figure 8). Interestingly, the midcentury projections indicate that

25
fire risk for most of these paths will either not change or decline somewhat from current levels. Note, however, that not all studies of fire risk to the region support this conclusion. For example, Jin and others (2015) project a rapid increase in wildfire risk in future decades, particularly in Southern California (Jin et. al. 2015).
However, in any case, fire risk in the Sierra Nevada and Cascade mountains is projected to increase more dramatically. By midcentury, some paths crossing those regions may face a higher risk from wildfires than paths in Southern California.

26
Table 8: Projected Change in Transmission Path Fire Risk
Sources: UC Merced Fire Model (CanESM2-RCP8.5) (modified from Westerling (2018), (WECC 2013; Fripp, 2012; Southern California Edison 2016; LADWP 2017; CEC 2009 and University of California 2013).
27
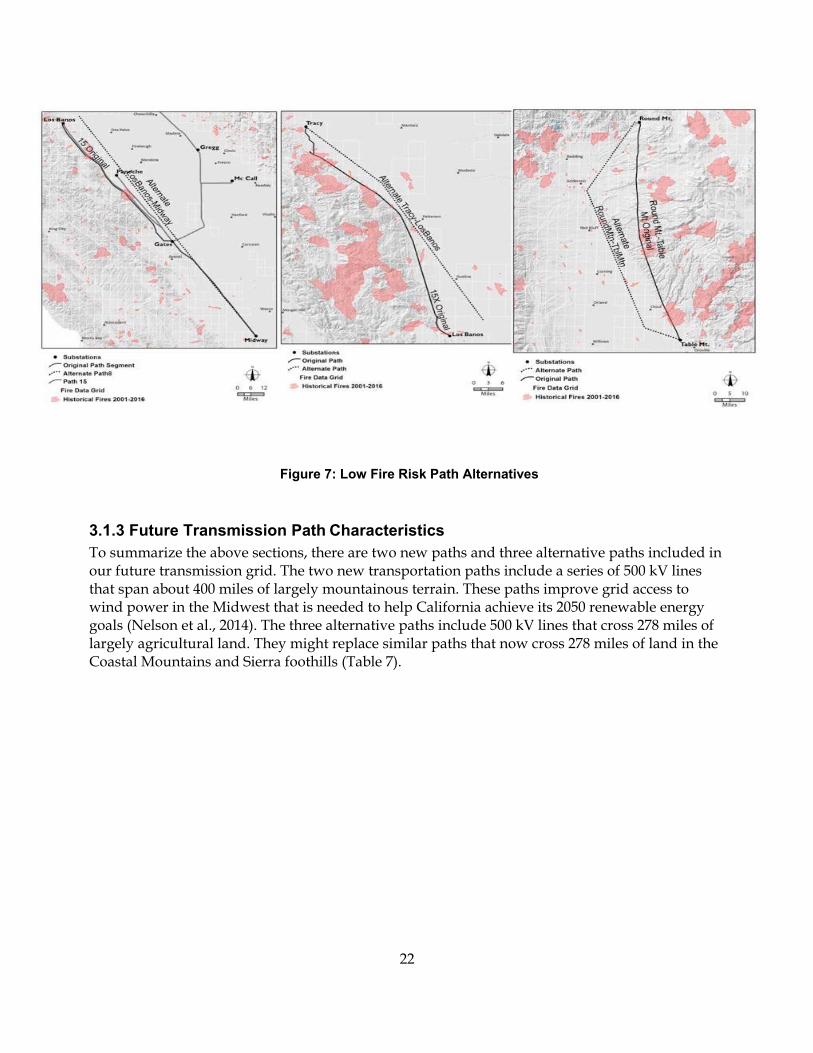
Our projections indicate that overall path fire risk, measured by a change in expected fire frequency, will increase by 26% on average by midcentury with most of the increase predicted to occur near non-WECC paths (Table 9).
Table 9: Future Path Fire Risk
Source: Summarized from Table 8
3.3. Future Path Fire Impact and Cost
3.3.1 Future Path Wildfire Impact We estimate midcentury fire impacts in two steps: first, estimating the change in frequency of future fires (Table 9) and second, estimating the impact of those fires on the grid (Table 10). We assume in this analysis that future wildfires will impact the future grid to the same degree that past wildfires impacted the existing grid.
As noted above, the fire path risk analysis projects a small increase in wildfires near WECC paths and a larger increase near non-WECC paths. Applying the statistics to historical fire counts on a path by path basis results in an estimated 66 wildfires near WECC paths and 174 wildfires near non-WECC paths in the 2040-2053 period. We conclude that the midcentury grid will experience a significant increase in wildfires near transmission paths and that of those fires, between 10 and 15 percent will cause significant grid disruption (Table 10).

28
Table 10: Predicted Impacts of Future Fires
Source: Tim Beach (2017) and Table 9 (CAL FIRE 2017)
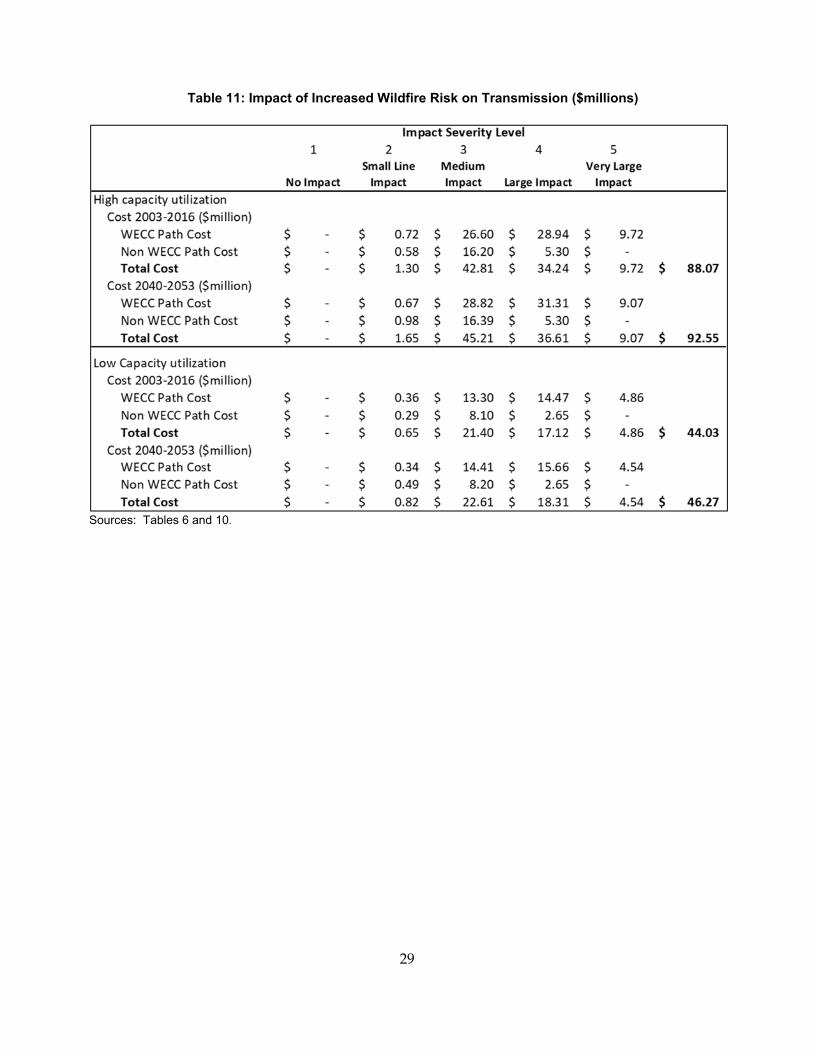
3.3.2 Cost of Future Path Interruption Drawing together information about fire frequency changes from the fire modeling, path impacts from the impact severity analysis, and impact costs from the PLEXOS analysis allows us to estimate the cost of fire risk to the grid. Cost impacts of these fires in the high capacity utilization scenario are estimated to be $88.1 million in the base period and $92.6 million in the midcentury period. The corresponding costs in the low capacity utilization scenario are $44.0 and $46.3 million (Table 11). It bears repeating that these cost estimates are approximate and based on assumptions about wildfire duration and impacts that need additional review.
29
Table 11: Impact of Increased Wildfire Risk on Transmission ($millions)
Sources: Tables 6 and 10.

30
4: Wildfire Risk to Current Distribution
The second part of this report deals with wildfire impacts to the distribution system, which includes electrical lines, poles, and substations that supply electricity to customers residing in various business and residential structures. For the most part, distribution assets are located near the residential, commercial, and industrial structures that they serve. This has two implications for our study: (1) distribution assets are spatially matched to urban structures (Figure 9) and (2) wildfire risk to these structures represents a wildfire risk to the distribution system.
Figure 9: Distribution Assets and Urban Structures. Distribution today often looks remarkably similar to distribution in the 1920s
In our analysis, we take advantage of this spatial matching and use wildfire risk to structures as a proxy for wildfire risk to the distribution system.
31
4.1 Identify Urban Fringe Areas
In this section we identify those parts of the state’s distribution grid that are most vulnerable to wildfires—due to their importance or to their location near wildfire prone areas—and lay the groundwork for our analysis of wildfire impacts.
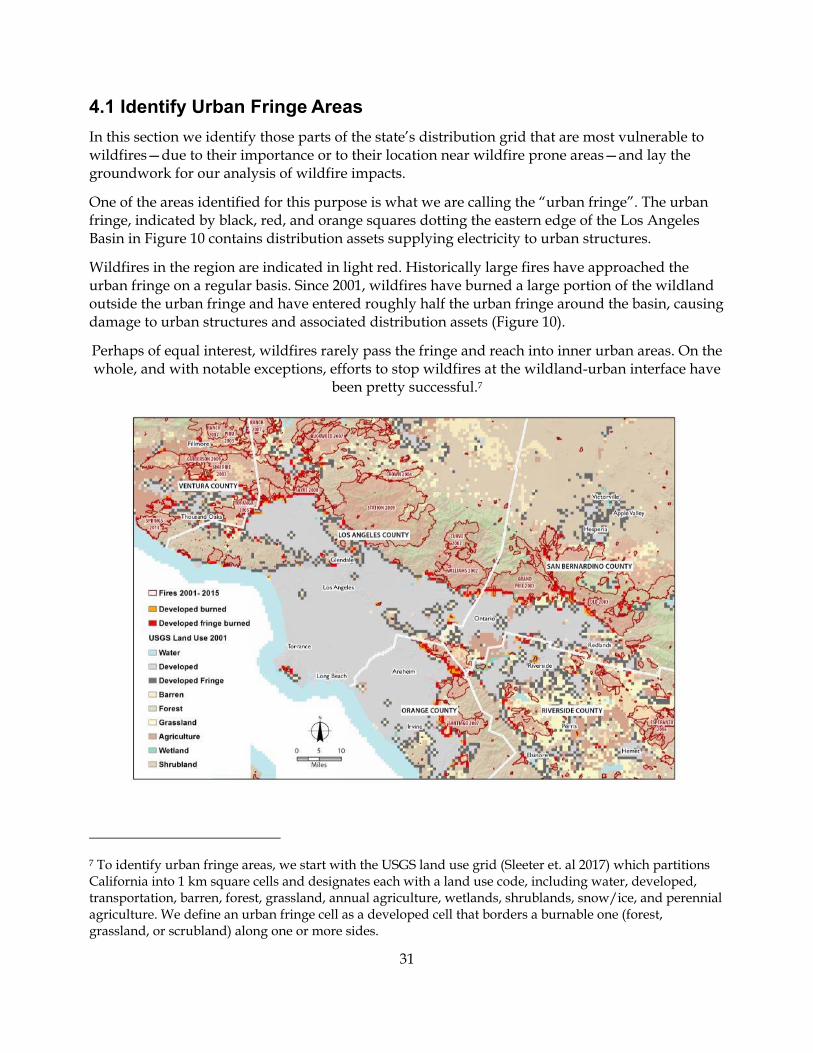
One of the areas identified for this purpose is what we are calling the “urban fringe”. The urban fringe, indicated by black, red, and orange squares dotting the eastern edge of the Los Angeles Basin in Figure 10 contains distribution assets supplying electricity to urban structures.
Wildfires in the region are indicated in light red. Historically large fires have approached the urban fringe on a regular basis. Since 2001, wildfires have burned a large portion of the wildland outside the urban fringe and have entered roughly half the urban fringe around the basin, causing damage to urban structures and associated distribution assets (Figure 10).
Perhaps of equal interest, wildfires rarely pass the fringe and reach into inner urban areas. On the whole, and with notable exceptions, efforts to stop wildfires at the wildland-urban interface have
been pretty successful.7
7 To identify urban fringe areas, we start with the USGS land use grid (Sleeter et. al 2017) which partitions California into 1 km square cells and designates each with a land use code, including water, developed, transportation, barren, forest, grassland, annual agriculture, wetlands, shrublands, snow/ice, and perennial agriculture. We define an urban fringe cell as a developed cell that borders a burnable one (forest, grassland, or scrubland) along one or more sides.
32
Figure 10: Los Angeles Basin Burnable Fringe
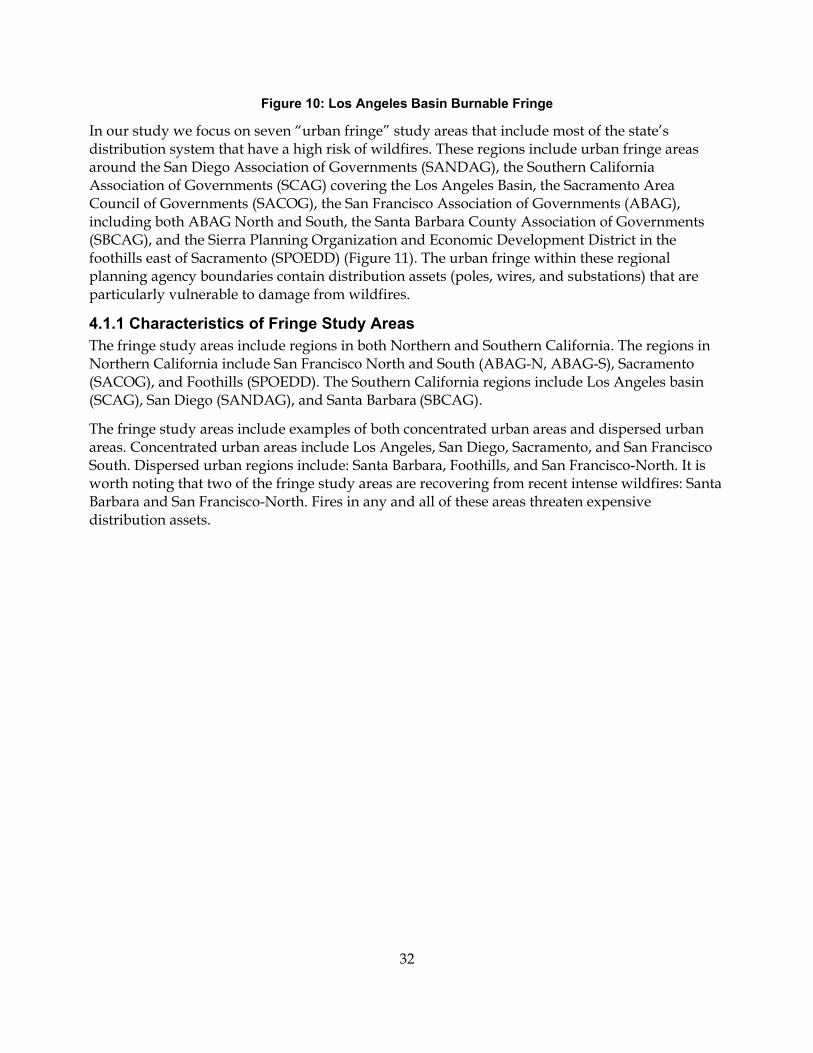
In our study we focus on seven “urban fringe” study areas that include most of the state’s distribution system that have a high risk of wildfires. These regions include urban fringe areas around the San Diego Association of Governments (SANDAG), the Southern California Association of Governments (SCAG) covering the Los Angeles Basin, the Sacramento Area Council of Governments (SACOG), the San Francisco Association of Governments (ABAG), including both ABAG North and South, the Santa Barbara County Association of Governments (SBCAG), and the Sierra Planning Organization and Economic Development District in the foothills east of Sacramento (SPOEDD) (Figure 11). The urban fringe within these regional planning agency boundaries contain distribution assets (poles, wires, and substations) that are particularly vulnerable to damage from wildfires.
4.1.1 Characteristics of Fringe Study Areas The fringe study areas include regions in both Northern and Southern California. The regions in Northern California include San Francisco North and South (ABAG-N, ABAG-S), Sacramento (SACOG), and Foothills (SPOEDD). The Southern California regions include Los Angeles basin (SCAG), San Diego (SANDAG), and Santa Barbara (SBCAG).
The fringe study areas include examples of both concentrated urban areas and dispersed urban areas. Concentrated urban areas include Los Angeles, San Diego, Sacramento, and San Francisco South. Dispersed urban regions include: Santa Barbara, Foothills, and San Francisco-North. It is worth noting that two of the fringe study areas are recovering from recent intense wildfires: Santa Barbara and San Francisco-North. Fires in any and all of these areas threaten expensive distribution assets.
33
Figure 11: State Map of Developed Fringe Areas
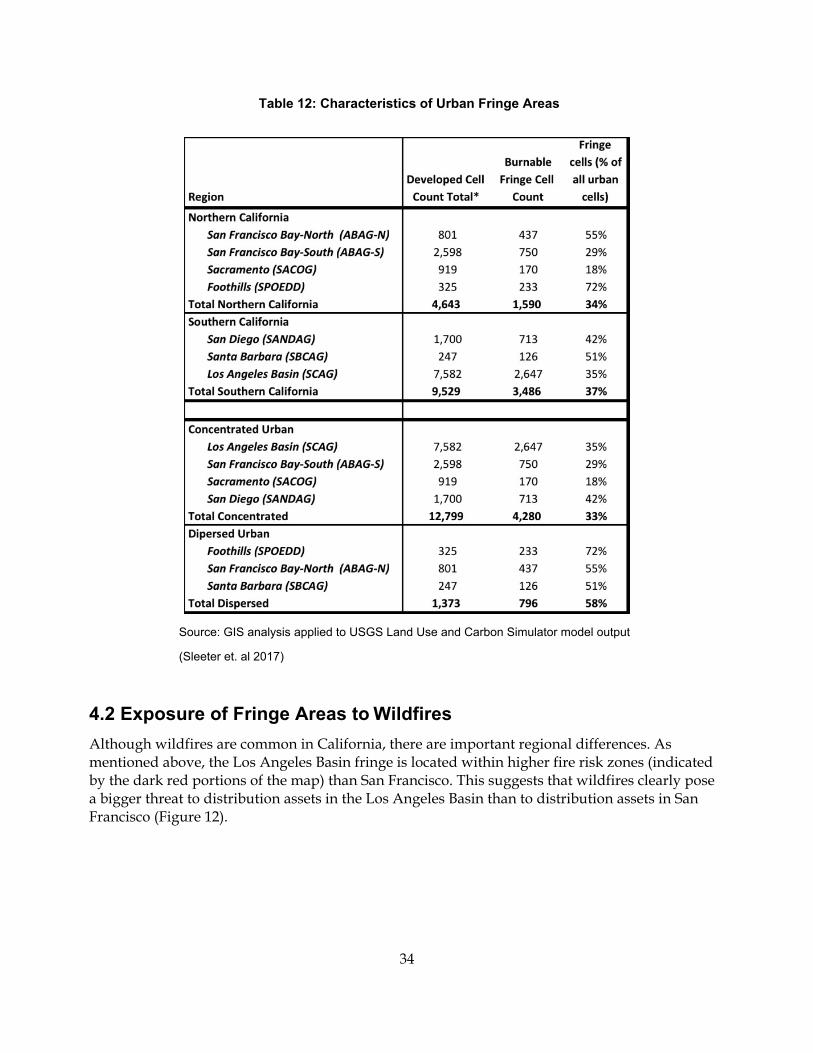
The aforementioned regional distinctions are important to an analysis of developed fringe wildfire risk. Concentrated urban areas including the LA Basin (SCAG), Southern San Francisco (ABAG South), and Sacramento (SCAG) have a lower proportion of fringe cells and may be more successful at preventing wildfire access to developed land. On the other hand, the southern California areas, in general, including Santa Barbara (SBCAG), the LA Basin (SCAG), and San Diego (SANDAG), experience many more wildfires. Regional fire frequencies are discussed in the following section of the report (Table 12).
34
Table 12: Characteristics of Urban Fringe Areas
Source: GIS analysis applied to USGS Land Use and Carbon Simulator model output
(Sleeter et. al 2017)
4.2 Exposure of Fringe Areas to Wildfires
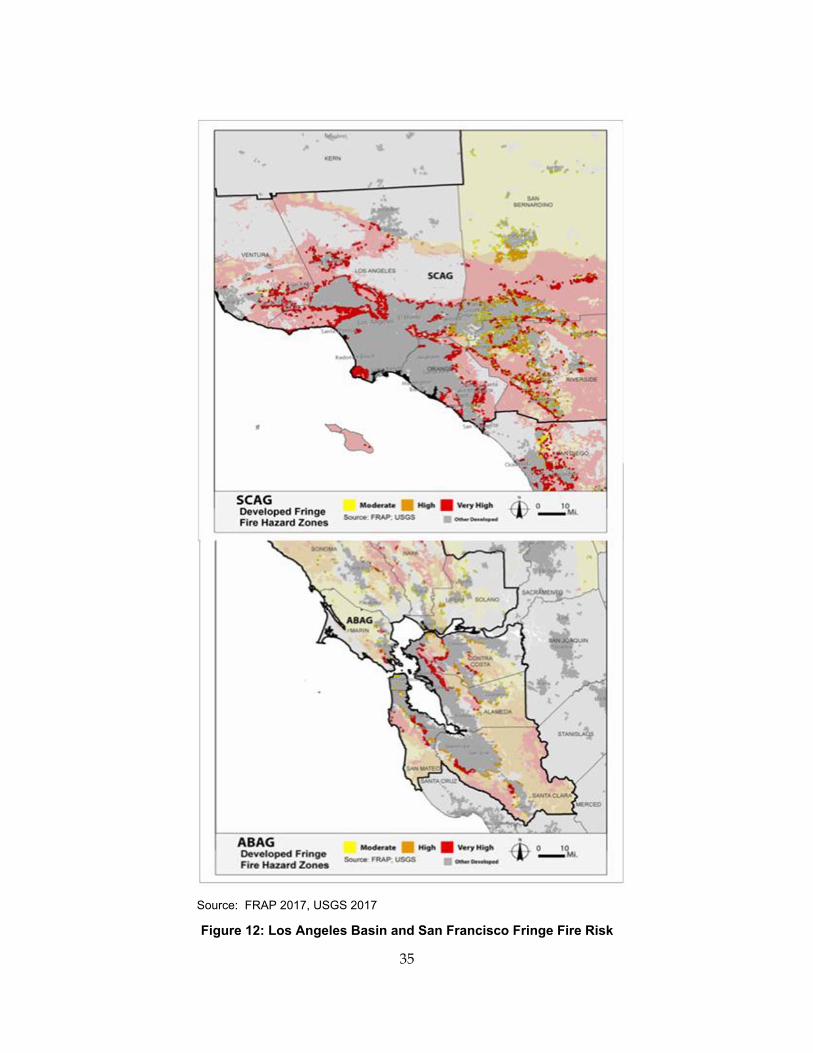
Although wildfires are common in California, there are important regional differences. As mentioned above, the Los Angeles Basin fringe is located within higher fire risk zones (indicated by the dark red portions of the map) than San Francisco. This suggests that wildfires clearly pose a bigger threat to distribution assets in the Los Angeles Basin than to distribution assets in San Francisco (Figure 12).
35
Source: FRAP 2017, USGS 2017
Figure 12: Los Angeles Basin and San Francisco Fringe Fire Risk
36
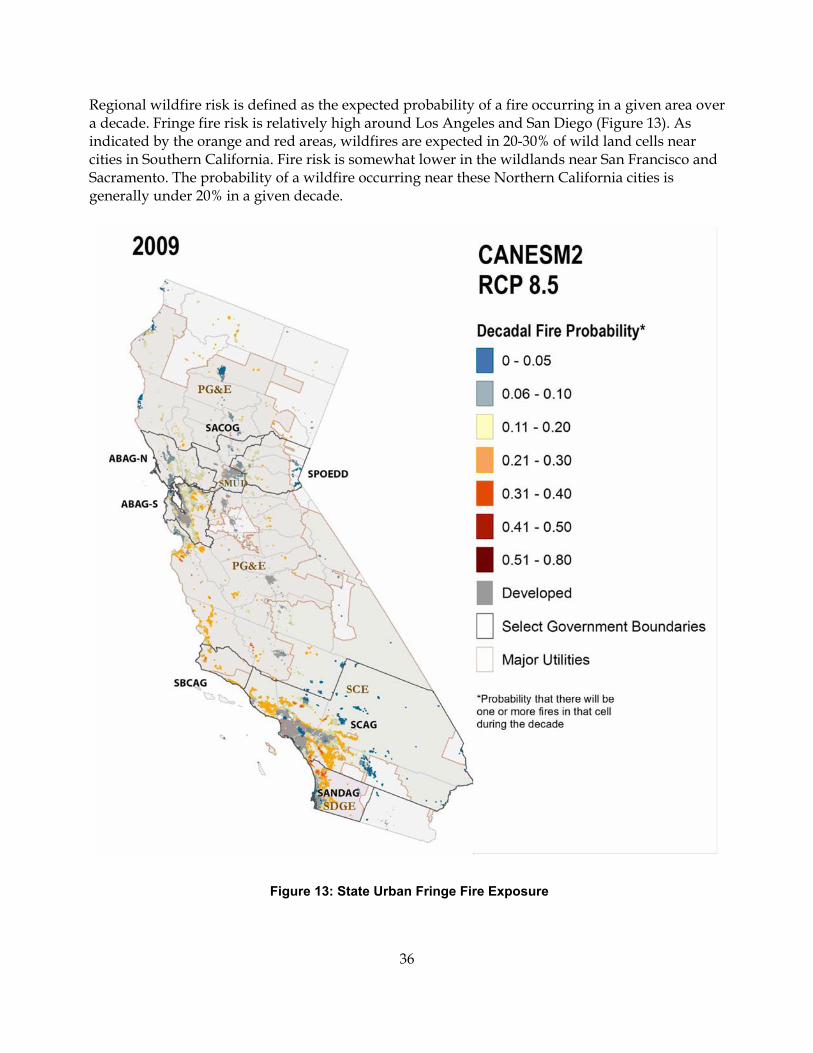
Regional wildfire risk is defined as the expected probability of a fire occurring in a given area over a decade. Fringe fire risk is relatively high around Los Angeles and San Diego (Figure 13). As indicated by the orange and red areas, wildfires are expected in 20-30% of wild land cells near cities in Southern California. Fire risk is somewhat lower in the wildlands near San Francisco and Sacramento. The probability of a wildfire occurring near these Northern California cities is generally under 20% in a given decade.
Figure 13: State Urban Fringe Fire Exposure

37
4.2.1 Fringe Area Fire Statistics The historical fire exposure statistics confirm these model estimates of fire risk. The historical fire counts from the 2001-2016 period indicate that there were over two and a half times as many fires in Southern California (257) as in Northern California (103) (Table 13). The historical statistics also provide information about fire severity not available from modeled projections.
For example, a higher percentage of wildfires that approach near to the urban fringe penetrate into the urban fringe in Southern California (42%) than in Northern California (16%). The high frequency and severity of Southern California wildfires makes them particularly damaging to distribution assets.
Table 13: Urban Fringe Fire Count 2001 – 2016
Source: Wildfire-Fringe data set from CAL FIRE 2017
4.3 Fringe Area Fire Impact and Cost
4.3.1 Fringe Area Fire Severity Wildfires damage both distribution and transmission infrastructure. Information submitted by utilities to recover catastrophic wildfire damages identifies distribution assets destroyed in past wildfires (CPUC 2013). For example, PG&E submitted claims for damages caused by 24 wildfires between 2013 and 2015 (Table 14). These fires are referred to as Catastrophic Event Management Account (CEMA) fires. These CEMA wildfires burned 359,000 acres of land and destroyed 2,480 structures. Distribution assets burned in those fires include poles, transformers, cross arms, and miles of distribution lines. This data indicates that most of the wildfires did not penetrate urban

38
fringe areas. It also indicates that the fraction of wildfires that did penetrate fringe areas caused most of the distribution impacts, including 80% of distribution equipment burned and 90% of transformers damaged.
Utilities submit estimates of distribution costs from CEMA fires to the CPUC for reimbursement. This data indicates distribution damages associated with different fires, including fires that that penetrate into fringe cells and those that do not. Almost 90% of the CEMA related distribution costs were attributed to fires that burn into fringe cells. Per structure burned, the cost differences were particularly stark. Fires that burned fringe cells caused distribution cost damages equal to $39,000 per structure burned and fires that did not burn into fringe cells cost $21,000 per structure burned.
Table 14: Fringe Fire Impacts to Distribution and Cost per Structure Burned
Source: Wildfire-Structures dataset from CAL FIRE (2017) and the National Interagency Fire Center (2018).
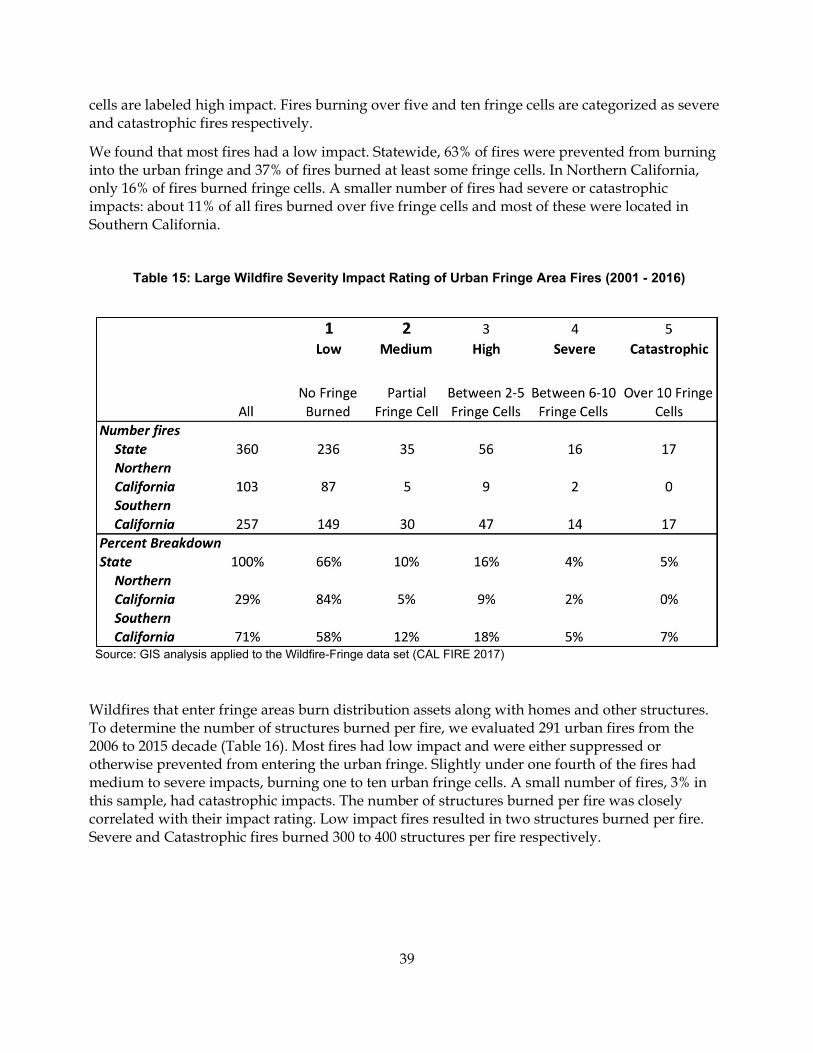
We evaluated 360 wildfires approaching urban fringe areas between 2001 and 2016 (NIFC 2018). We restricted analysis to large (>400 acres) fires within a quarter of a mile of an urban fringe cell. We sorted these fires into five severity impact categories, according to the number of fringe cells impacted by the fires. Fires that did not burn any fringe cells are labeled low impact, fires that burned partial fringe cells are labeled medium impact, and those that burned one to five fringe
39
cells are labeled high impact. Fires burning over five and ten fringe cells are categorized as severe and catastrophic fires respectively.
We found that most fires had a low impact. Statewide, 63% of fires were prevented from burning into the urban fringe and 37% of fires burned at least some fringe cells. In Northern California, only 16% of fires burned fringe cells. A smaller number of fires had severe or catastrophic impacts: about 11% of all fires burned over five fringe cells and most of these were located in Southern California.
Table 15: Large Wildfire Severity Impact Rating of Urban Fringe Area Fires (2001 - 2016)
Source: GIS analysis applied to the Wildfire-Fringe data set (CAL FIRE 2017)
Wildfires that enter fringe areas burn distribution assets along with homes and other structures. To determine the number of structures burned per fire, we evaluated 291 urban fires from the 2006 to 2015 decade (Table 16). Most fires had low impact and were either suppressed or otherwise prevented from entering the urban fringe. Slightly under one fourth of the fires had medium to severe impacts, burning one to ten urban fringe cells. A small number of fires, 3% in this sample, had catastrophic impacts. The number of structures burned per fire was closely correlated with their impact rating. Low impact fires resulted in two structures burned per fire. Severe and Catastrophic fires burned 300 to 400 structures per fire respectively.

40
Table 16: Structures Burned per Fire and Costs per Structure Burned
Source: Wildfire-Structures dataset (National Interagency Fire Center (2018) and the Catastrophic Event Memorandum Account Memorandum (CPUC 2013).
4.3.2 Fringe Area Fire Costs Finally, we combined the fire frequency data (Table 13) with the structural impact data (Table 14 and Table 15) to derive total wildfire distribution system costs (Table 17). The total estimated cost of fires to the distribution system during the 15-year period was $690 million, a sum far exceeding the generation cost impact of $35 million. Well over half of this cost resulted from a relatively small number of severe and catastrophic fires in Southern California. The remaining fire costs are attributed to a large number of medium and high impact fires evenly split between Northern and Southern California.
Table 17: Urban Fringe Area Fire Costs (2002 – 2016)
Source: Tables 13, 14, 15 and 16

41
5: Future Wildfire Risk to the Distribution System
There is enormous concern about the impacts of climate change to fires in California, a concern highlighted by recent (2017) major fire events in Ventura, Santa Barbara, Napa, and Sonoma Counties. This section of the paper includes projections of midcentury fire risk to seven regions in the state. In this section of the report, we estimate the potential impact and cost of future fires with a focus on impacts to and cost of distribution assets destroyed in these fires.
The approach we follow is similar to the approach we used to study the impacts of fires to the midcentury transmission system. We first determine changes to the location of midcentury distribution system assets in urban fringe areas. Then we estimate the midcentury risk and frequency of fires to these distribution assets. Finally, we evaluate the impacts and costs of projected fires to the midcentury distribution system.
5.1 Identify Future Fringe Areas
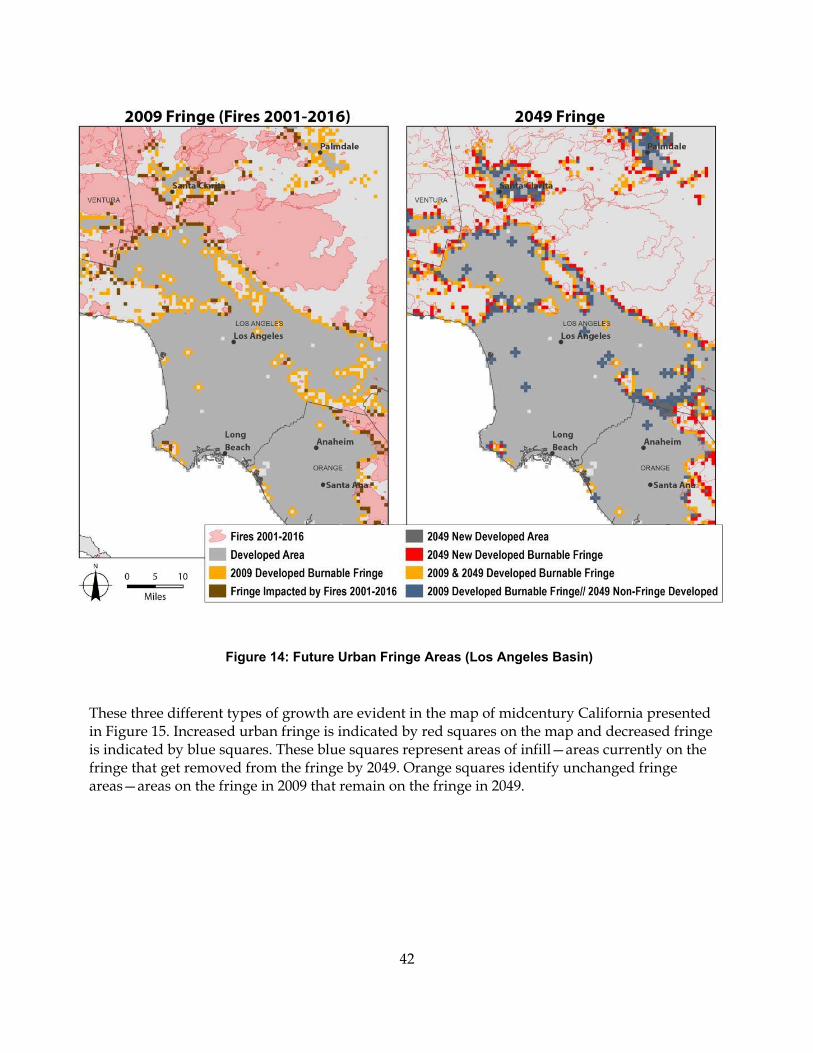
Most planners forecast robust urban growth in California over the next few decades. The Los Angeles Basin provides a good example of three different growth impacts projected to occur (Sleeter et al. 2017). These include growth that adds fringe cells (expansive growth), growth that subtracts fringe cells (infill growth), and growth that leaves fringe cells unchanged (neutral growth).8
Some of the growth in the LA Basin is “expansive” growth occurring at the outer edge of the urbanized basin. This growth is identified by the red fringe cells in the midcentury map (Figure 14). Much of the growth is infill growth inside the urbanized basin. The midcentury urban infill is represented by blue colored crosses in the map. Finally, much if not most of the growth is projected by the USGS LUCAS model to be neutral and will leave fringe cells unchanged. The orange colored cells on the midcentury map represent neutral growth.
8 This growth classification terminology is our own and may differ from the terminology used by the USGS.
42
Figure 14: Future Urban Fringe Areas (Los Angeles Basin)
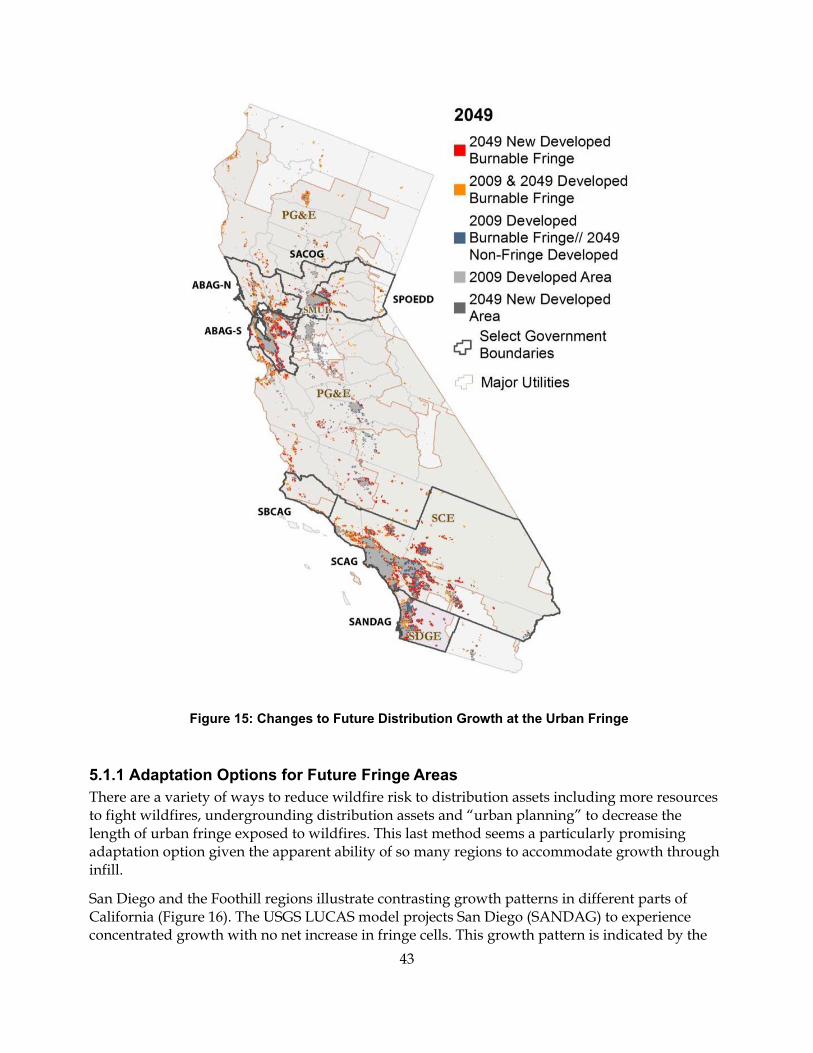
These three different types of growth are evident in the map of midcentury California presented in Figure 15. Increased urban fringe is indicated by red squares on the map and decreased fringe is indicated by blue squares. These blue squares represent areas of infill—areas currently on the fringe that get removed from the fringe by 2049. Orange squares identify unchanged fringe areas—areas on the fringe in 2009 that remain on the fringe in 2049.
43
Figure 15: Changes to Future Distribution Growth at the Urban Fringe
5.1.1 Adaptation Options for Future Fringe Areas There are a variety of ways to reduce wildfire risk to distribution assets including more resources to fight wildfires, undergrounding distribution assets and “urban planning” to decrease the length of urban fringe exposed to wildfires. This last method seems a particularly promising adaptation option given the apparent ability of so many regions to accommodate growth through infill.
San Diego and the Foothill regions illustrate contrasting growth patterns in different parts of California (Figure 16). The USGS LUCAS model projects San Diego (SANDAG) to experience concentrated growth with no net increase in fringe cells. This growth pattern is indicated by the

44
predominance of blue “infill” squares over red “fringe growth” squares in that region (Figure 16). The Foothills region (SPOEDD), by contrast, is forecast to experience dispersed growth with an additional 42 new fringe cells added by midcentury.
The Foothills region and other mountainous areas in Northern California are likely to face increased wildfire risk by midcentury (Figure 17). As a result, we anticipate a need for additional zoning restrictions and a decline in midcentury fringe cell growth below the levels described in the next section.
Figure 16 Urban Fringe Growth in San Diego and Sierra Foothills
5.1.2 Characteristics of Future Fringe Areas The projected impact of growth on developed and fringe areas varies by region. Rapid growth is projected for all regions. Northern California urban area is projected to grow 43% (Sleeter et al. 2017) (Table 18). Southern California urban area is projected to increase only slightly less (40%).
Interestingly, fringe areas increase much less rapidly in both parts of the state. In Northern California, fringe cells increase only 9%. The corresponding figure in Southern California is a

45
surprising negative 8%. Due to infill in this region, only one fringe cell is added for every additional 14 new developed cells. This results when fringe cells become surrounded by development and cease being fringe cells. Thus, in both areas of the state, projected regional growth results in a more concentrated urban footprint with fewer fringe cells in proportion to total urban area (Sleeter et. al 2017). The trend toward more concentrated urban growth is also predicted in other regional growth studies (SCAG 2016). This future increase in regional density will protect urban areas to some degree and lessen their exposure to wildfires.
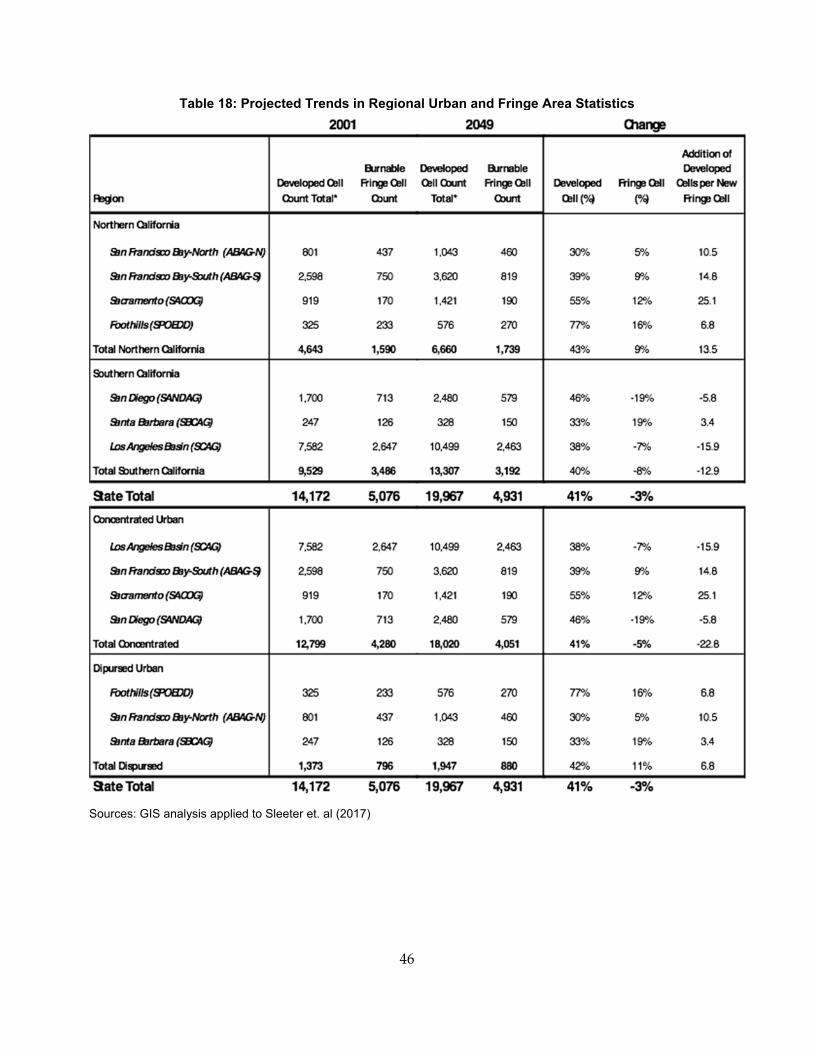
46
Table 18: Projected Trends in Regional Urban and Fringe Area Statistics
Sources: GIS analysis applied to Sleeter et. al (2017)

47
5.2 Fire Risk to the Future Fringe Areas
5.2.1 Risk to Future Fringe Areas As with the transmission path fire risk projections above, our forecast of wildfire risk to urban fringe areas incorporates UC Merced wildfire model projections for different climate change models. Following, we use this wildfire model to estimate fire risk to each of the urban fringe areas. The results are reported under one climate model and emission scenario (CanESM2- RCP8.5). As noted above, all the climate models and emission scenarios’ projections in the UC Merced fire model suggest a rise in midcentury wildfire risk in Northern California and a slight decline or no change in midcentury fire risk in Southern California. (Fire risk projections for other climate models and emission scenarios are presented in the Appendix).
In much of the state, the fire risk to the midcentury urban fringe is similar to fire risk to existing fringe areas. The risk of fire remains high in the mountainous areas of the state and low in the desert and Central Valley (Figure 17). The risk also continues to be high around the Los Angeles Basin and San Diego areas. The mountainous areas along the central Coast and in the Sierra east of Sacramento appear to have an increased fire risk, as indicated by a map color change from mid-range yellow to higher probability red. It is more difficult to perceive the direction of change in fire risk to Southern Coastal areas including San Diego and Los Angeles Basin.
Figure 17: Fire Risk to Future Fringe Areas
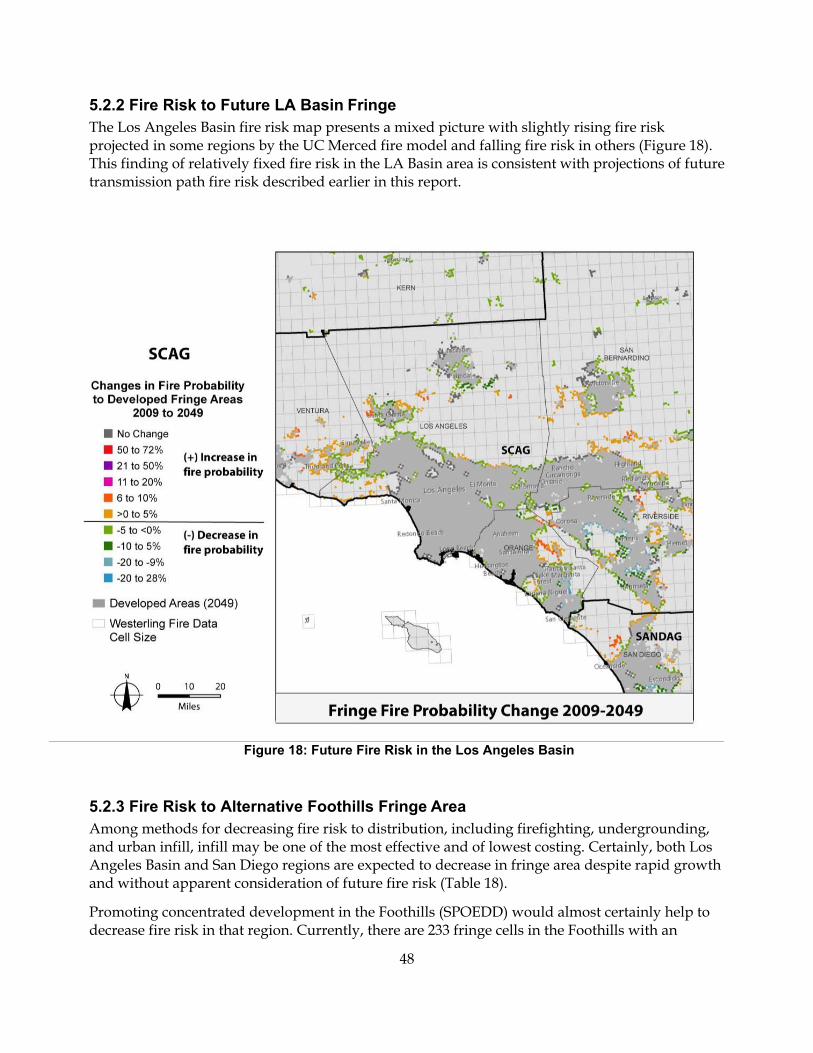
48
5.2.2 Fire Risk to Future LA Basin Fringe The Los Angeles Basin fire risk map presents a mixed picture with slightly rising fire risk projected in some regions by the UC Merced fire model and falling fire risk in others (Figure 18). This finding of relatively fixed fire risk in the LA Basin area is consistent with projections of future transmission path fire risk described earlier in this report.
Figure 18: Future Fire Risk in the Los Angeles Basin
5.2.3 Fire Risk to Alternative Foothills Fringe Area Among methods for decreasing fire risk to distribution, including firefighting, undergrounding, and urban infill, infill may be one of the most effective and of lowest costing. Certainly, both Los Angeles Basin and San Diego regions are expected to decrease in fringe area despite rapid growth and without apparent consideration of future fire risk (Table 18).
Promoting concentrated development in the Foothills (SPOEDD) would almost certainly help to decrease fire risk in that region. Currently, there are 233 fringe cells in the Foothills with an
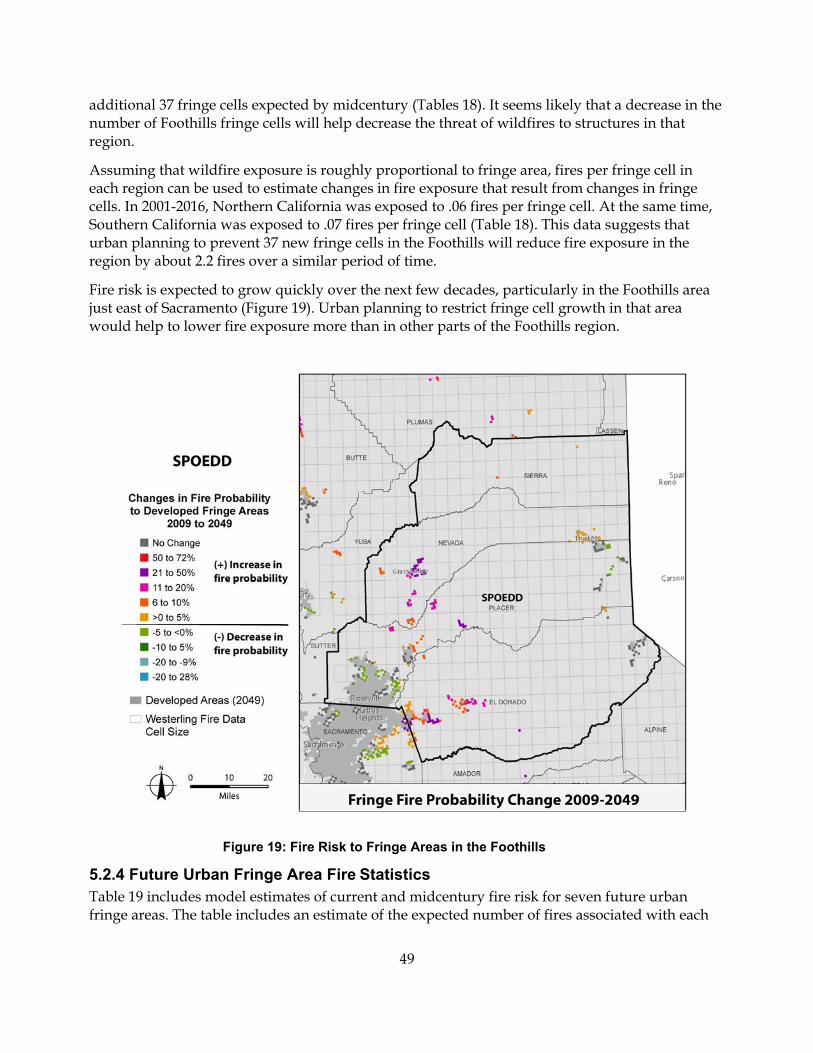
49
additional 37 fringe cells expected by midcentury (Tables 18). It seems likely that a decrease in the number of Foothills fringe cells will help decrease the threat of wildfires to structures in that region.
Assuming that wildfire exposure is roughly proportional to fringe area, fires per fringe cell in each region can be used to estimate changes in fire exposure that result from changes in fringe cells. In 2001-2016, Northern California was exposed to .06 fires per fringe cell. At the same time, Southern California was exposed to .07 fires per fringe cell (Table 18). This data suggests that urban planning to prevent 37 new fringe cells in the Foothills will reduce fire exposure in the region by about 2.2 fires over a similar period of time.
Fire risk is expected to grow quickly over the next few decades, particularly in the Foothills area just east of Sacramento (Figure 19). Urban planning to restrict fringe cell growth in that area would help to lower fire exposure more than in other parts of the Foothills region.
Figure 19: Fire Risk to Fringe Areas in the Foothills
5.2.4 Future Urban Fringe Area Fire Statistics Table 19 includes model estimates of current and midcentury fire risk for seven future urban fringe areas. The table includes an estimate of the expected number of fires associated with each

50
fringe area for each period. The expected number of fires variable in the table is calculated as the estimated probability of fires in fringe cells each decade summed across fringe cells in each area.
As with transmission, model fire number estimates can be compared with historical period fire counts. The model forecasts 1184 fires in urban fringe areas in the 2000-2009 decade (Table 19). The historical data count identifies 360 fires near urban fringe areas in 2001-2016 (Table 15). Note that the model counts each burned cell as a separate fire, while the historical fire data groups adjacent burned cells into a single fire, so the two are not directly comparable. This difficulty in comparing model and historical fires is one justification for our use of the historical fire data to estimate fire impacts and our use of the model fire projections to estimate relative changes in fire frequency.
State fire frequency projections suggest an overall increase (11%) in fire frequency in Northern California and a slight decrease (9%) in Southern California. The decrease in projected fire frequency in Southern California is not supported in all regional fire studies. For example, Jin et. al. (2015) project large increases in future Southern California wildfire risk.
The rise in fire frequency in Northern California aligns with the increased fire frequency projections in the Sierra and Coastal mountains as described in the transmission section of the report. The increase in fire frequency is projected to be particularly high in the dispersed
regions, including Santa Barbara (32%) and the Foothills (61%). This rise in frequency may, in part, reflect the dispersed development pattern anticipated in these regions as well as a warming climate lengthening the fire season and increased ignition opportunities from increased population (Table 19).
Table 19: Future Fire Risk Summary
Source: (Westerling 2018)

51
5.3 Future Fire Impact and Costs
5.3.1 Impact of Future Fires on Fringe Areas Working through changes in fire frequency, impact and cost suggests that on average climate change will impose only a moderate impact on the midcentury grid. In this section, midcentury wildfire frequency is projected on average to decrease slightly in Southern California so that distribution damages in that region are projected to decrease as well (Table 20). Wildfire frequency is anticipated to grow in some areas, notably in the more dispersed urban foothill area in Northern California and Santa Barbara in Southern California. We project that fire related costs and impacts will be growing in these areas.
It bears repeating the degree to which these cost estimates are linked to the wildfire risk projections (Westerling 2018). We show a decline in costs based largely on projected declines in average mid-21st century wildfire risk or area burned in Southern California. Obviously, other projections of wildfire risk would lead to other cost estimates. For example, despite the expected decline in average area burned, our wildfire model projects a corresponding increase in rare but extremely damaging wildfire years (Westerling 2018). This suggests that California electric utilities need to be prepared for increased financial uncertainty due to wildfires in the future. Although wildfire costs may decline slightly on average, in the bad years wildfire costs are likely to go up significantly.
In addition, Jin et. al. (2015) anticipate a large increase in mid-21st century Southern California wildfire area burned. Relying on that forecast, we would have projected a similar increase in damages to Southern California distribution.
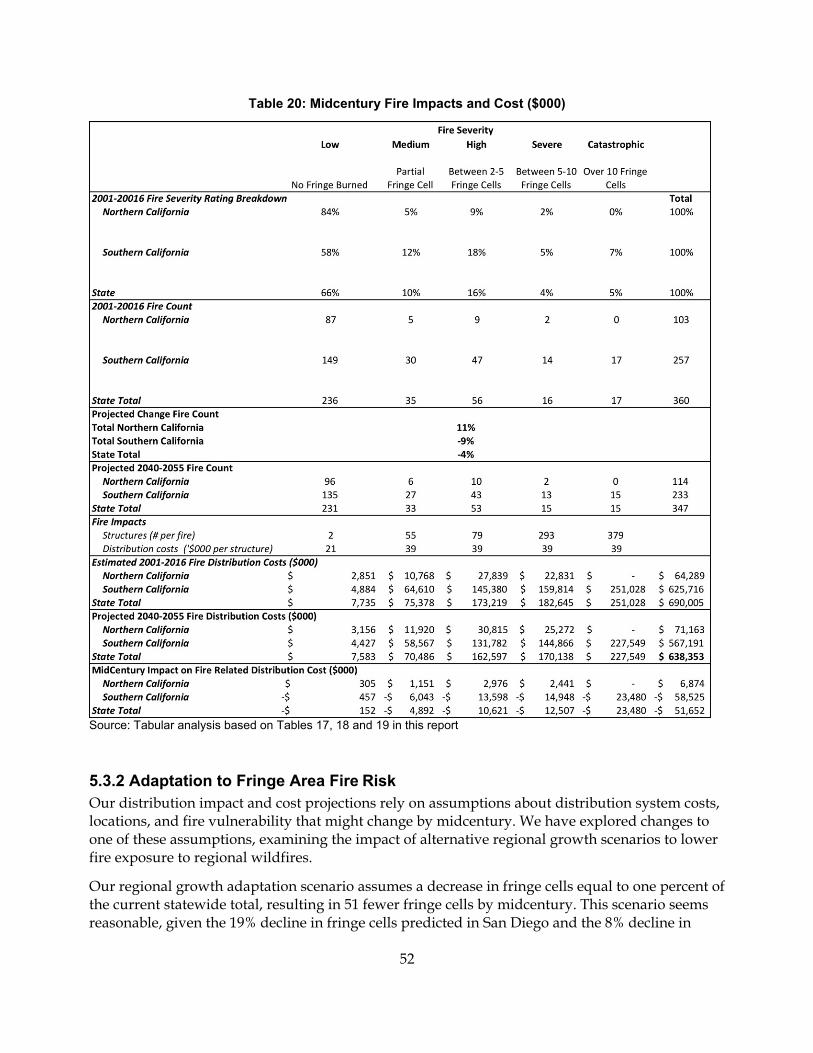
52
Table 20: Midcentury Fire Impacts and Cost ($000)
Source: Tabular analysis based on Tables 17, 18 and 19 in this report
5.3.2 Adaptation to Fringe Area Fire Risk Our distribution impact and cost projections rely on assumptions about distribution system costs, locations, and fire vulnerability that might change by midcentury. We have explored changes to one of these assumptions, examining the impact of alternative regional growth scenarios to lower fire exposure to regional wildfires.
Our regional growth adaptation scenario assumes a decrease in fringe cells equal to one percent of the current statewide total, resulting in 51 fewer fringe cells by midcentury. This scenario seems reasonable, given the 19% decline in fringe cells predicted in San Diego and the 8% decline in
53
fringe cells predicted for Southern California over the same period. This scenario would help to decrease fire exposure by about two fires per decade at current fire risk levels and between two and three fires per decade by midcentury in the regions studied in this report. The financial impact of this scenario on wildfire damages is explored further in the Appendix (Benefits section).
6: Conclusion
This report focuses on the risk posed by wildfires to 40 selected transmission paths and seven urban “fringe” distribution systems. The transmission paths traverse many ecological zones and face differing wildfire risks. In the desert, the risk is low. The risk is higher in forested and chaparral regions of the state.
The urban “fringe” regions in Southern California, including the Los Angeles Basin and San Diego, currently face the highest risk from wildfires. Climate change is expected to increase fire risk to transmission and distribution assets in Northern California, an impact made worse by new transmission paths anticipated in the Sierra Nevada Mountains.
In Southern California, climate change, in conjunction with projected urban growth patterns, may bring slightly lower fire risk. Distribution assets in the Los Angeles Basin and San Diego are further insulated from wildfires by projected urban infill. In these and other urban areas, infill may shrink urban perimeters and decrease wildfire risk to distribution assets.
Nevertheless, wildfires continue to threaten transmission and distribution assets across the state. Over the 2001-2016 period, wildfires, as modeled in this study, cost utilities more than $700 million. In the future, wildfire damages will remain close to this level in some model scenarios and go much higher in others.
These damages would have been much higher without active wildfire protection. In the recent past, roughly 75% of wildfires caused no damage or only minor damage to transmission and distribution assets. At the other extreme, a relatively small number of wildfires caused very large damages to the electricity grid. Large, catastrophic wildfires are difficult to defend against and very hard to predict as evidenced by the two massive wildfires that occurred in 2017.

54
7: References
B.P. Bryant, A.L Westerling 2014: Scenarios for future wildfire risk in California: links between changing demography, land use, climate, and wildfire, Environmetrics 25(6):454-471
Beach, Tim 2017. Personal Communication with Tim Beach, CAISO Shift Manager. “Path List assigned Severity Level.” October 19 2017 email. Includes severity rating and a list of 268 fire path intersections that occurred between June 2003 and 2015.
CAL FIRE 2017, Online database of wildfire locations. http://frap.fire.ca.gov/data/frapgisdata-subset.
California Energy Commission 2009. Energy Commissioncompiled technical and location‐specific information (e.g., power plant/transmission line/substation location, latitude and longitude, online capacity, type) (personal communication, Jacque Gilbreath, CEC 2009).
CPUC 2013. “Decision Authorizing Pacific Gas and Electric Company to Recover Costs Recorded in the Catastrophic Event Memorandum Account Related to Certain Disasters.” Decision 13-06-007 June 27, 2013. Application 11-09-014. Filed September 21, 2011.
CPUC 2017. Mapping Environmental Influences on Utility Fire Threat. A report to the California Public Utilities Commission Pursuant to R.08 – 11-005 and R.15-05-006,
Fripp, Matthias (2012), Switch: A Planning Tool for Power Systems with Large Shares of Intermittent Renewable Energy, Environmental Science & Technology 46(11): 6371-6378.
J. Nelson, A. Mileva, J. Johnston, D.M. Kammen, M. Wei, J.B. Greenblatt, “Planning Power Systems with Deep Emission Reductions by 2050 using the SWITCH Model (Vol. II, California’s Carbon Challenge Phase 2),” California Energy Commission PIER Report, November 2014.
J.E. Keeley and A. D. Syphard. Climate Change and Future Fire Regimes: Examples from California. Geosciences. 2016, 6, 37; doc 10. 3390/geosciences
K. Hamachi LaCommare and J. Eto. (2006). “Cost of Power Interruptions to Electricity Consumers in the United States.” Energy, the International Journal. 31:1509-1519
LADWP 2017. Personal Communication,
National Interagency Fire Center (2018). Online database of wildfire locations and other information covering 2000 to 2016 period. https://www.nifc.gov/fireInfo/fireInfo_statistics.html
PLEXOS 2012. PLEXOS software is a product of Energy Exemplar, LLC, http://www.energyexemplar.com/
SCAG 2016. 2016-2040 RTP/SCS Final Growth Forecast by Jurisdiction.
Sleeter, B.M., Wilson, T.S., Sharygin, E., and J. Sherba (2017) Future scenarios of land change based on empirical data and demographic trends. Earth’s Future 5(8) DOI:10.1002/2017EF000560.

55
Southern California Edison 2016. Personal Communication with Eric Takayesu of Southern California Edison. Meeting held on September 27, 2016.
WECC (2012) Database of generators, transmission lines, and load for year 2020 by the Transmission Expansion Planning Policy Committee (TEPPC) of the Western Electricity Coordinating Council (WECC). Database made available by Energy Exemplar Inc.
WECC 2013. Path rating catalog. Western Electricity Coordinating Council, Salt Lake City, UT. Westerling, A.L. 2018: "Wildfire simulations for the Fourth California Climate Assessment: projecting changes in extreme wildfire events with a warming climate." Publication pending by the California Energy Commission.
Wilson, T.S., Sleeter, B.M., and D.R. Cameron (2017). Mediterranean California’s water use future under scenarios of developed and agricultural land use change. PLOS One 12(10): e0187181 https://doi.org/10.1371/journal.
Yufang Jin, Goulden, M, N. Faivre, S. Veraverbeke, F. Sun, M. Hand, S. Hook and J. Randerson. “Identification of two distinct fire regimes in Southern California: Implications for economic impact and future change. Environmental Research Letters. 10 094005
Yufing Jin, J. Randerson, N. Faivre, S. Capps, A. Hall and M. Goulden. Contrasting controls on wildland fires in Southern California during periods with and without Santa Ana winds. Journal of Geophysical Research: Biogeosciences. March 2014.
A-1
APPENDIX A: Estimated Benefits to California of Adaptation Options Identified in “Assessing the Impact of Wildfires on the California Electricity Grid”
In this section, we provide a very rough estimate of the social cost of wildfires in California and evaluate two measures to decrease these costs.
Perhaps the most striking finding is the large estimated cost—from $1-$2 billion per year today to $1-$3 billion by midcentury. Although we consider these costs to be rough, order of magnitude estimates there is little doubt about their overall scale—some 30 times the reported costs to utilities in “Assessing the Impact of Wildfires on the California Electricity Grid”.
Four adjustments account for the large difference between total social costs and utility sample costs. The utility costs in the paper were estimated for a sample of transmission paths and distribution regions rather than for the state as a whole. The first adjustment was applied to convert wildfire costs for this sample to wildfire costs for the whole state. This adjustment was relatively small, increasing the transmission sample costs about 30% and the distribution sample costs about 33%. After this adjustment, we estimate annual utility distribution and transmission costs to be $70 million by midcentury (Table A-2).
A second adjustment was applied to transform costs to utilities from wildfires into costs to other economic sectors (social costs). In addition to transmission and distribution costs, social costs include the cost of lost service and destroyed structures. Our analysis suggests that the social costs are about 14 times larger than the utility costs. This adjustment increased annual midcentury wildfire costs to $1.0 billion (Table A-2, Low Scenario).
A third adjustment was made to show the impact of higher wildfire risk projected in some wildfire models. Our assessment used UC Merced wildfire model risk projections as officially adopted for this assessment (Westerling 2017). However, other models project significantly higher wildfire risk due to future wind speed changes during Santa Ana events (Jin et. al. 2017). To reflect this higher risk, we increased distribution costs 70% in our Medium scenario. This increased midcentury wildfire costs to $1.6 billion (Table A-2, Medium Scenario).
A fourth adjustment was made to incorporate the impact of the 2017 wildfires on our damage estimates. Our impact assessment focused on wildfires between 2000 and 2016. Unfortunately, this sample may understate the scale of wildfire impacts in extreme wildfire years, as evidenced by the enormous impact of the wildfires in 2017. The wildfires in that year alone destroyed almost as many structures as were burned in all wildfires between 2000 and 2016. An adjustment to incorporate 2017 impacts raised midcentury costs to $2.8 billion, a roughly $1 billion increase (Table A-2, High Scenario).
These high damage estimates are used to help justify fairly expensive measures to adapt the future grid to future wildfires. For example, the adaptation measure evaluated for transmission system was putting transmission lines underground. This expensive measure is not frequently undertaken, but it turns out to have potentially high benefits, after accounting for large damages that may result from future wildfires without this measure. Similarly, we evaluated zoning ordinances to restrict new fringe development around urban areas. Although this type of zoning

A-2
is never popular, our analysis suggests that, in some cases, zoning may more than pay for itself by helping to decrease future wildfire related expenses—not just to electric utilities but to customers whose structures would have been otherwise destroyed without the zoning.
Our rough estimate of adaptation savings from these measures comes to $1.1 billion. Of this, only a small fraction ($42 million) represents utility savings in the form of lower generation and distribution costs. The bulk of the savings would go to utility customers and the state as a whole.
This Benefits section includes the following topics:
1. Estimate statewide Social Costs of Wildfires
2. Estimate Benefits of Selected Transmission Adaptation Measure
3. Estimate Benefits of Selected Distribution Adaptation Measure
4. Summary: Net Benefit of Measures to Protect T&D assets from Wildfires
A.1 Estimate Statewide Social Cost of Wildfires
In order to estimate statewide damages from wildfires we need to:
Convert Study Sample T&D Wildfire Damages into statewide T&D Damages
Estimate Direct Transmission and Distribution Wildfire Costs ($/annum)
Estimate Customer Social Cost of Wildfires
Evaluate alternative wildfire risk scenarios
Convert Study Sample T&D Wildfire Damages into Statewide T&D damages
Transmission
The CEC transmission line data we used contains approximately 35,500 miles of transmission lines. Our designated paths, including both WECC and non-WECC paths, contain approximately 6,500 miles or roughly 18% of transmission line miles. This is for all lines, including those that fall in areas with no fire estimates such as urban areas, agricultural areas, and desert areas (roughly 33% of the state). The study paths also include a disproportionate share of the state’s higher capacity transmission lines in fire vulnerable areas (roughly 66%). Thus, we believe that 1.67 is a reasonable if perhaps conservative estimate of the ratio of state to study area wildfire damages.
Distribution
The fringe varies over time, but in 2009 there were 11,155 square kilometers of fringe cells in California located next to burnable wild land. Our study sample included about 60% of this area: 6,700 square kilometers (Table A1).
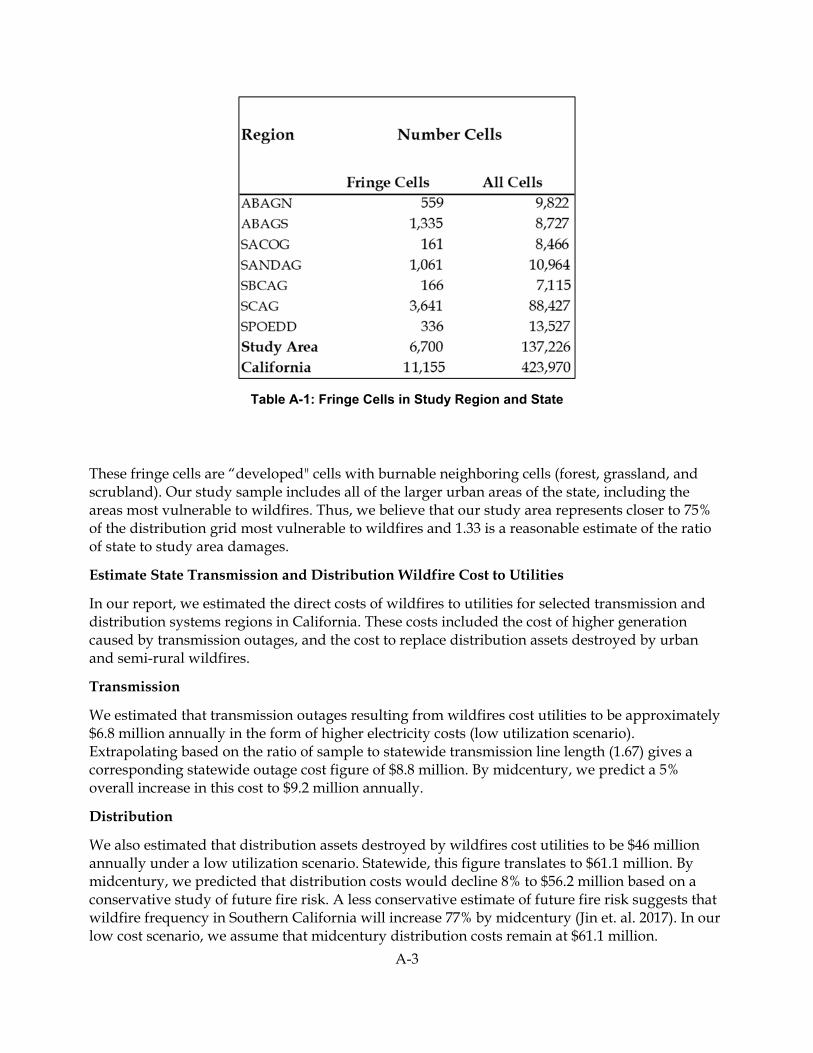
A-3
Table A-1: Fringe Cells in Study Region and State
These fringe cells are “developed" cells with burnable neighboring cells (forest, grassland, and scrubland). Our study sample includes all of the larger urban areas of the state, including the areas most vulnerable to wildfires. Thus, we believe that our study area represents closer to 75% of the distribution grid most vulnerable to wildfires and 1.33 is a reasonable estimate of the ratio of state to study area damages.
Estimate State Transmission and Distribution Wildfire Cost to Utilities
In our report, we estimated the direct costs of wildfires to utilities for selected transmission and distribution systems regions in California. These costs included the cost of higher generation caused by transmission outages, and the cost to replace distribution assets destroyed by urban and semi-rural wildfires.
Transmission
We estimated that transmission outages resulting from wildfires cost utilities to be approximately $6.8 million annually in the form of higher electricity costs (low utilization scenario). Extrapolating based on the ratio of sample to statewide transmission line length (1.67) gives a corresponding statewide outage cost figure of $8.8 million. By midcentury, we predict a 5% overall increase in this cost to $9.2 million annually.
Distribution
We also estimated that distribution assets destroyed by wildfires cost utilities to be $46 million annually under a low utilization scenario. Statewide, this figure translates to $61.1 million. By midcentury, we predicted that distribution costs would decline 8% to $56.2 million based on a conservative study of future fire risk. A less conservative estimate of future fire risk suggests that wildfire frequency in Southern California will increase 77% by midcentury (Jin et. al. 2017). In our low cost scenario, we assume that midcentury distribution costs remain at $61.1 million.
A-4
Including Customer Social Cost
Transmission
Customer service interruptions are an important indirect cost linked to transmission outages caused by wildfires. A somewhat dated study suggests that electric outages cost California over $8 billion annually (Hamachi LaCommare and Eto, 2004). About 1% of electricity outages result from wildfires according to Mills (2012). This data is used to estimate the cost of wildfire related transmission disruptions to California equal to $80 million annually. By midcentury, we project this cost will increase 5% to $84 million annually.
Distribution Costs
Burned and destroyed structures represent perhaps the largest economic cost of wildfires. The recent wine country fires destroyed 8,990 structures and cost insurance companies an estimated $9.4 billion. The 1991 Oakland hills fires burned 3,500 structures and cost insurance companies an estimated $2.8 billion (2017 USD) (Sacramento Bee 2017; San Francisco Chronicle 2017). On a per structure basis, these fires cost about $1 million per structure. Applying this figure to the 10,319 structures destroyed by wildfires between 2002 and 2016 suggests that annual customer social costs from wildfires are $642 million for the report sample and $852 million for the state as a whole for the current period.
Summing the customer social and utility costs in the current period gives $89 million for transmission plus interruption cost, $914 million for distribution plus structure cost, and about $1.0 billion for total cost. Midcentury costs remain close to $1.0 billion. This cost total is included as our “low” estimate of wildfire damages (Table A-2, Low Scenario).

A-5
Table A-2: Cost of California Wildfires (million USD per year)
Sources:
http://www.sacbee.com/news/state/california/fires/article188377854.html
https://www.sfgate.com/bayarea/article/Wine-Country-fires-destroyed-8-889-structures-12328007.php
http://www.fire.ca.gov/current_incidents/incidentdetails/Index/1922
Numbers may not add up due to rounding.
Including Rising Midcentury Fire Risk
As described above, a less conservative assessment of midcentury wildfire risk, including additional climate change impacts on fire size, raises midcentury distribution costs to $1.5 billion and midcentury total costs to $1.6 billion (Jin et. al 2015).
All these wildfire damage estimates are based on a study period ending in 2016. The following year turned out to be one of the most damaging wildfire fire years on record for distribution systems. Including damages from the headline, wine country and Ventura wildfires in that year more than double the annual average number of structures burned and boosts annual state wildfire costs to $1.8 billion. Under a high-risk midcentury wildfire scenario, this would increase total wildfire damages to some $2.8 billion (Table A-2, high estimate).
Cost to Utilities (State Total)Transmission (low utilization, 2003‐2016) ($M)Distribution, 2001‐2016 ($M)
Customer Social CostTransmission‐Interuption Cost ($M)Distribution‐ Structure Costs ($M)
1. Total Cost, Including Customer Social Cost (Low STransmission‐Interuption Cost ($M)Distribution‐ Structure Costs ($M)
2. Total Cost, Including High Fire Risk Model Impact
Transmission‐Interuption Cost ($M)Distribution‐ Structure Costs; Jin et al (2015) midc
3. Total Cost, Including 2017 Impact (High Scenario)Transmission‐Interuption Cost ($M)
Distribution‐ Structure Costs; Jin et al (2015) midcentury fire projections; 2017 wine country and Ventura fires included.
Current Midcentury
8.8$ 9.2$ 61.1$ 61.1$ 69.9$ 70.3$
80$ 84$ 852$ 852$
Scenario)89$ 93$ 914$ 914$
1,002$ 1,007$ t (Medium Scenario)
89$ 93$ 914$ 1,471$
1,002$ 1,565$ )
89$ 93$
1,625$ 2,718$ 1,714$ 2,811$
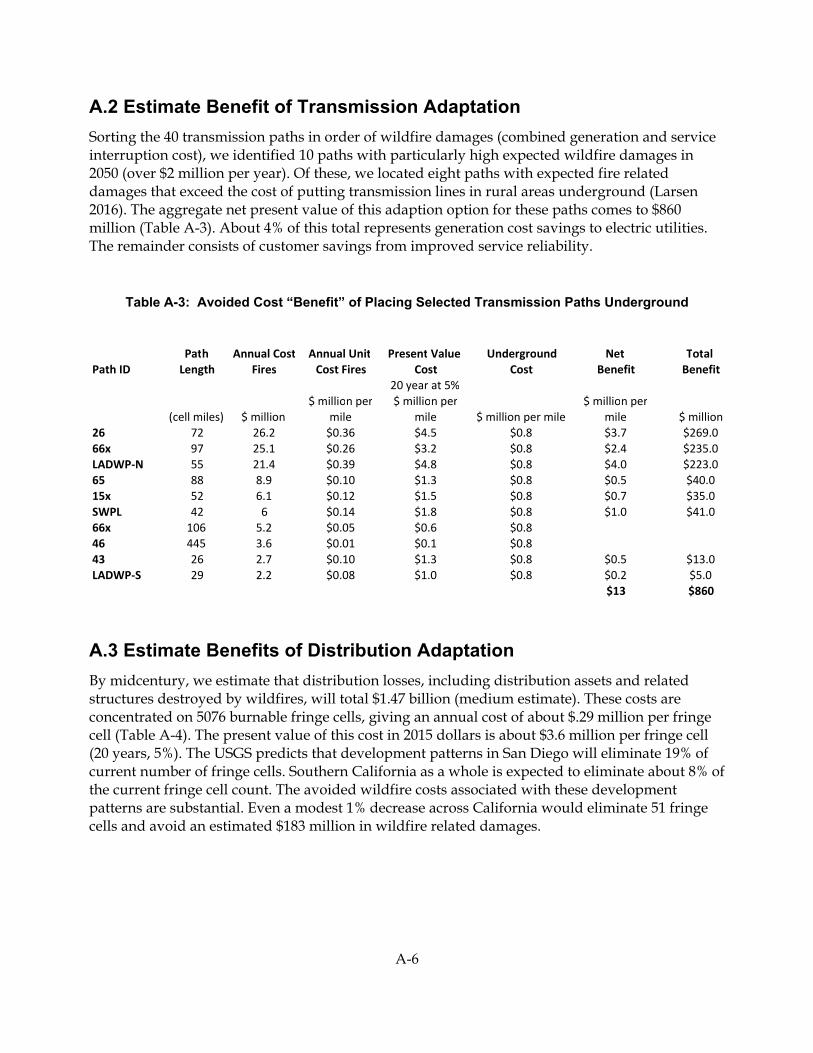
A-6
A.2 Estimate Benefit of Transmission Adaptation
Sorting the 40 transmission paths in order of wildfire damages (combined generation and service interruption cost), we identified 10 paths with particularly high expected wildfire damages in 2050 (over $2 million per year). Of these, we located eight paths with expected fire related damages that exceed the cost of putting transmission lines in rural areas underground (Larsen 2016). The aggregate net present value of this adaption option for these paths comes to $860 million (Table A-3). About 4% of this total represents generation cost savings to electric utilities. The remainder consists of customer savings from improved service reliability.
Table A-3: Avoided Cost “Benefit” of Placing Selected Transmission Paths Underground
A.3 Estimate Benefits of Distribution Adaptation
By midcentury, we estimate that distribution losses, including distribution assets and related structures destroyed by wildfires, will total $1.47 billion (medium estimate). These costs are concentrated on 5076 burnable fringe cells, giving an annual cost of about $.29 million per fringe cell (Table A-4). The present value of this cost in 2015 dollars is about $3.6 million per fringe cell (20 years, 5%). The USGS predicts that development patterns in San Diego will eliminate 19% of current number of fringe cells. Southern California as a whole is expected to eliminate about 8% of the current fringe cell count. The avoided wildfire costs associated with these development patterns are substantial. Even a modest 1% decrease across California would eliminate 51 fringe cells and avoid an estimated $183 million in wildfire related damages.
Path ID
26
66xLADWP‐N6515x
SWPL66x46
43LADWP‐S
Path Annual Cost Annual Unit Present Value Underground Net Total Length Fires Cost Fires Cost Cost Benefit Benefit
20 year at 5%
(cell miles) $ million$ million per
mile$ million per
mile $ million per mile$ million per
mile $ million72 26.2 $0.36 $4.5 $0.8 $3.7 $269.0
97 25.1 $0.26 $3.2 $0.8 $2.4 $235.055 21.4 $0.39 $4.8 $0.8 $4.0 $223.088 8.9 $0.10 $1.3 $0.8 $0.5 $40.052 6.1 $0.12 $1.5 $0.8 $0.7 $35.0
42 6 $0.14 $1.8 $0.8 $1.0 $41.0106 5.2 $0.05 $0.6 $0.8445 3.6 $0.01 $0.1 $0.8
26 2.7 $0.10 $1.3 $0.8 $0.5 $13.029 2.2 $0.08 $1.0 $0.8 $0.2 $5.0
$13 $860
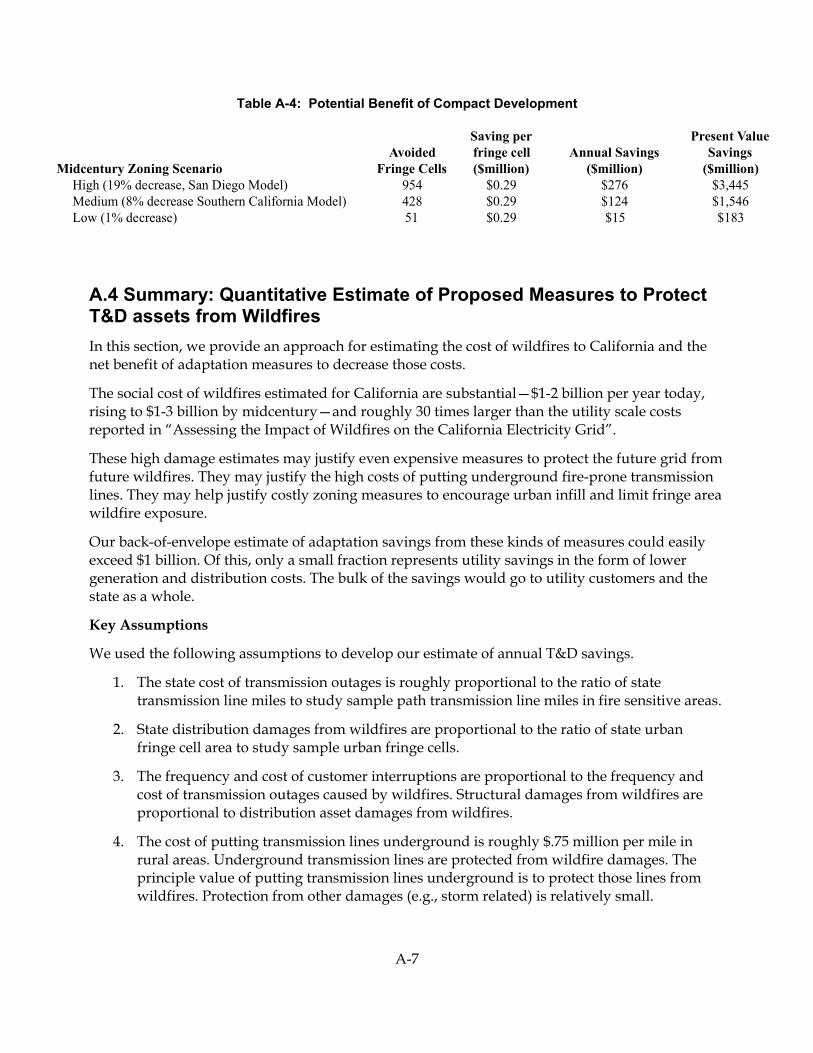
A-7
Table A-4: Potential Benefit of Compact Development
A.4 Summary: Quantitative Estimate of Proposed Measures to Protect T&D assets from Wildfires
In this section, we provide an approach for estimating the cost of wildfires to California and the net benefit of adaptation measures to decrease those costs.
The social cost of wildfires estimated for California are substantial—$1-2 billion per year today, rising to $1-3 billion by midcentury—and roughly 30 times larger than the utility scale costs reported in “Assessing the Impact of Wildfires on the California Electricity Grid”.
These high damage estimates may justify even expensive measures to protect the future grid from future wildfires. They may justify the high costs of putting underground fire-prone transmission lines. They may help justify costly zoning measures to encourage urban infill and limit fringe area wildfire exposure.
Our back-of-envelope estimate of adaptation savings from these kinds of measures could easily exceed $1 billion. Of this, only a small fraction represents utility savings in the form of lower generation and distribution costs. The bulk of the savings would go to utility customers and the state as a whole.
Key Assumptions
We used the following assumptions to develop our estimate of annual T&D savings.
1. The state cost of transmission outages is roughly proportional to the ratio of state transmission line miles to study sample path transmission line miles in fire sensitive areas.
2. State distribution damages from wildfires are proportional to the ratio of state urban fringe cell area to study sample urban fringe cells.
3. The frequency and cost of customer interruptions are proportional to the frequency and cost of transmission outages caused by wildfires. Structural damages from wildfires are proportional to distribution asset damages from wildfires.
4. The cost of putting transmission lines underground is roughly $.75 million per mile in rural areas. Underground transmission lines are protected from wildfire damages. The principle value of putting transmission lines underground is to protect those lines from wildfires. Protection from other damages (e.g., storm related) is relatively small.
Midcentury Zoning Scenario Avoided
Fringe Cells
Saving per fringe cell ($million)
Annual Savings ($million)
Present Value Savings
($million)High (19% decrease, San Diego Model) 954 $0.29 $276 $3,445Medium (8% decrease Southern California Model) 428 $0.29 $124 $1,546Low (1% decrease) 51 $0.29 $15 $183

A-8
5. There is no cost to zoning needed to limit the growth of urban fringe cells as populations expand.
Additional Intangible Benefits
Qualitative benefits to ratepayers include making the grid more resilient by helping to direct T&D lines away from high fire risk areas. This project will also provide intangible benefits to ratepayers, including improved health and safety outcomes of people living in areas that have a more reliable electricity grid.
A.5 References
B.P. Bryant, A.L Westerling 2014: Scenarios for future wildfire risk in California: links between changing demography, land use, climate, and wildfire, Environmetrics 25(6):454-471.
California Energy Commission 2009. Energy Commission-compiled technical and location-specific information (e.g., power plant/transmission line/substation location, latitude and longitude, online capacity, type) (personal communication, Jacque Gilbreath, CEC 2009).
Hamachi LaCommare and J. Eto. (2006). “Cost of Power Interruptions to Electricity Consumers in the United States.” Energy, the International Journal. 31:1509-1519 Sacramento Bee 2017 http://www.sacbee.com/news/state/california/fires/article188377854.html.
Hamachi LaCommare, K., and J. Eto, 2004. Understanding the Cost of Power Interruptions to U.S. Electricity Consumers. Lawrence Berkeley National Laboratory. LBNL – 55718.
Mills, E. “Electric Grid Disruptions – and Extreme Weather.” Lawrence Berkeley National Laboratory. US Disaster Reanalysis Workshop National Climatic Data Center, Asheville, North Carolina May 3-4, 2012 (updates August 30, 2012). San Francisco Chronicle. https://www.sfgate.com/bayarea/article/Wine-Country-fires-destroyed-8-889-structures-12328007.php. http://www.fire.ca.gov/current_incidents/incidentdetails/Index/1922
Sleeter, B.M., Wilson, T.S., Sharygin, E., and J. Sherba (2017) Future scenarios of land change based on empirical data and demographic trends. Earth’s Future 5(8) DOI:10.1002/2017EF000560.
Westerling, A.L. 2018: "Wildfire simulations for the Fourth California Climate Assessment: projecting changes in extreme wildfire events with a warming climate." Publication pending by the California Energy Commission.
Wilson, T.S., Sleeter, B.M., and D.R. Cameron (2017). Mediterranean California’s future water use under scenarios of developed and agricultural land use change. PLOS One 12(10): e0187181 https://doi.org/10.1371/journal.
Yufang Jin, Goulden, M, N. Faivre, S. Veraverbeke, F. Sun, M. Hand, S. Hook and J. Randerson. “Identification of two distinct fire regimes in Southern California: Implications for economic impact and future change. Environmental Research Letters. 10 094005

A-9
Yufing Jin, J. Randerson, N. Faivre, S. Capps, A. Hall and M. Goulden. Contrasting controls on wildland fires in Southern California during periods with and without Santa Ana winds. Journal of Geophysical Research: Biogeosceinces. March 2014.
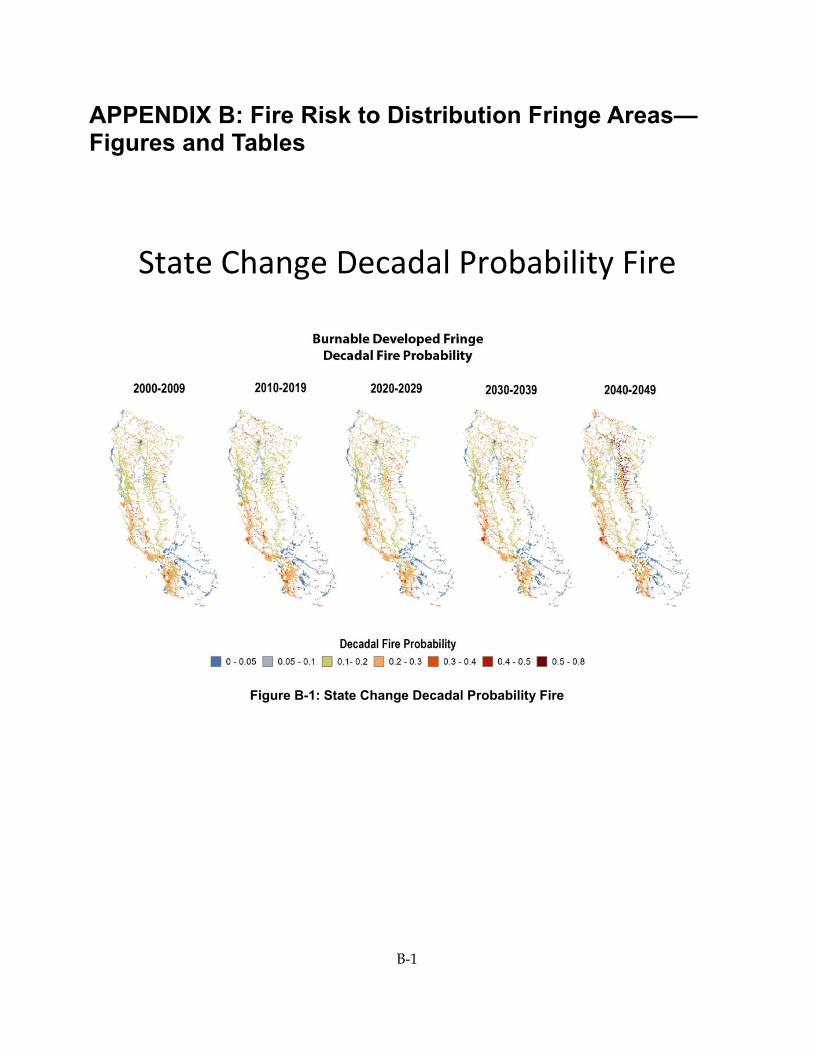
B-1
APPENDIX B: Fire Risk to Distribution Fringe Areas—Figures and Tables
Figure B-1: State Change Decadal Probability Fire
State Change Decadal Probability Fire
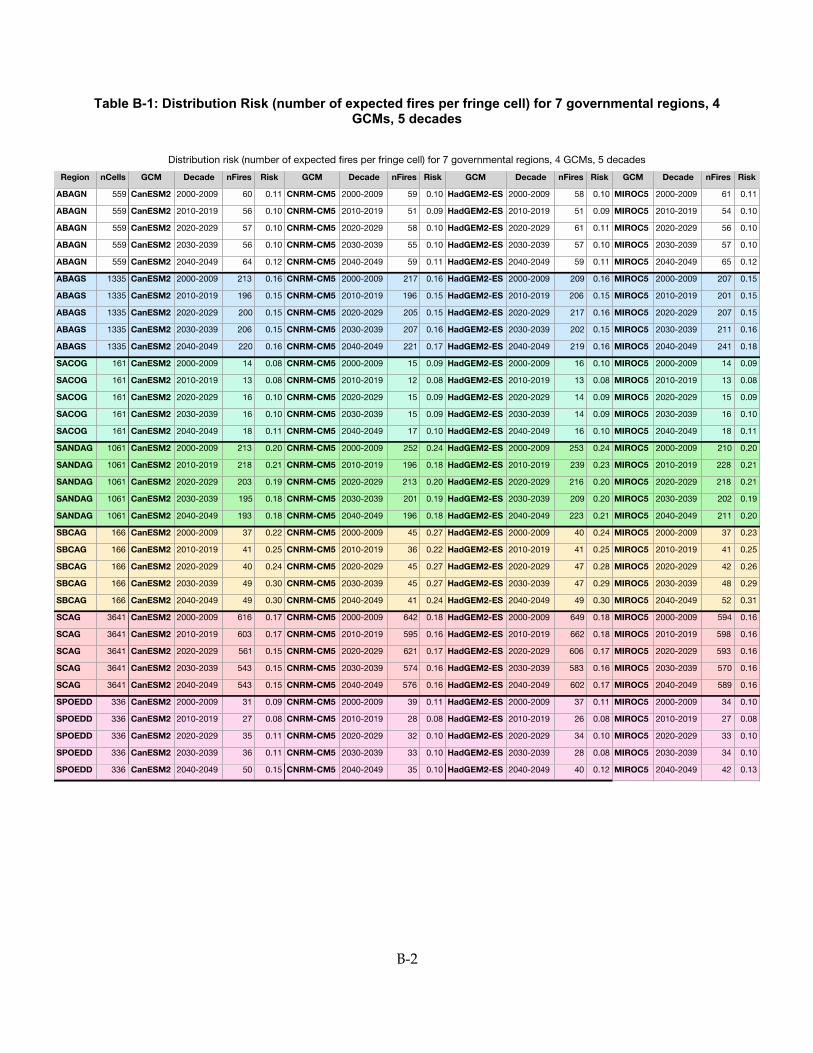
B-2
Table B-1: Distribution Risk (number of expected fires per fringe cell) for 7 governmental regions, 4 GCMs, 5 decades

C-1
APPENDIX C: Fire Risk to Transmission Paths—Figures and Tables
Decadal Fire Probability

C-2
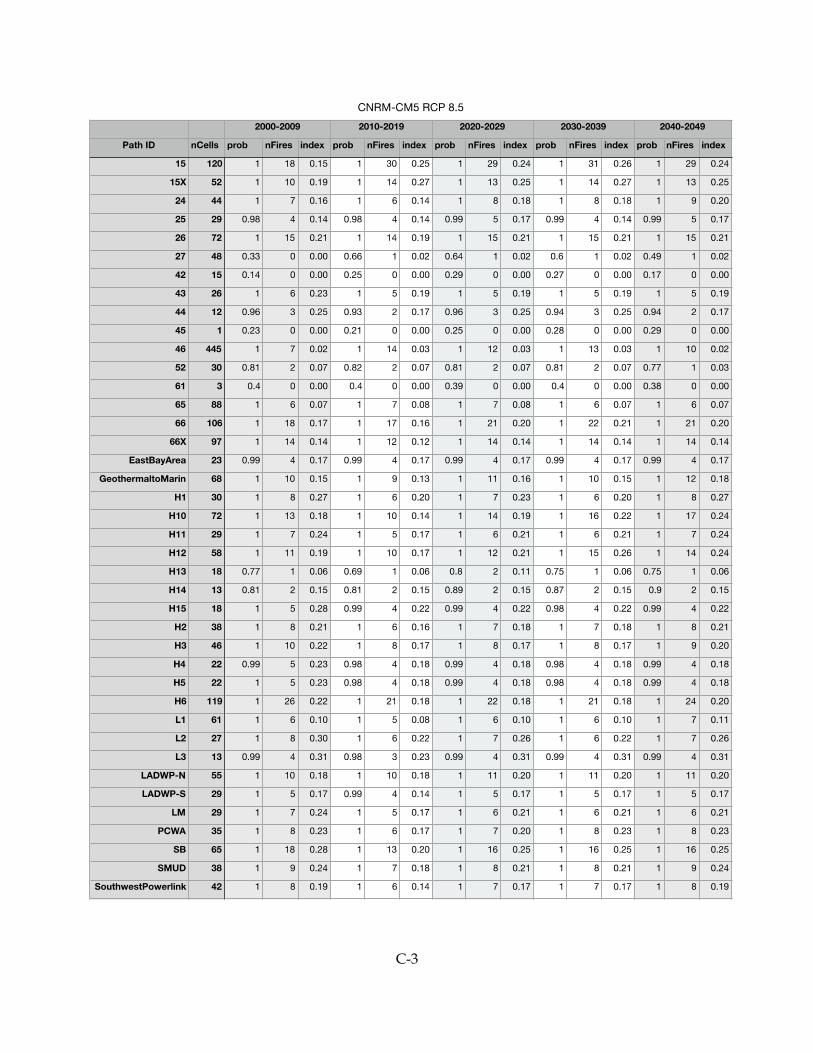
C-3

C-4

C-5