Assessing the Economic Case for Patents: New Title … · Perspectives from the ICT Industry ......
18
Department Of Industrial Policy Promotion—India New Title To Go Here Assessing the Economic Case for Patents: Perspectives from the ICT Industry GMU-CPIP IP and Global Prosperity 2016 Dr. Kirti Gupta Qualcomm Inc.
Transcript of Assessing the Economic Case for Patents: New Title … · Perspectives from the ICT Industry ......

Department Of Industrial Policy Promotion—India
New Title To Go HereAssessing the Economic Case for Patents:
Perspectives from the ICT Industry
GMU-CPIP IP and Global Prosperity 2016
Dr. Kirti Gupta
Qualcomm Inc.

The Fundamental Challenge of Wireless Communications
Wireless communications involve transmitting and receiving radio signals over portions of radio frequency spectrum allocated by regulatory bodies
The technologies incorporated from 1G to 4G standards are all targeted towards optimizing usage of scarce spectrum
Efficient usage of radio frequency spectrum

Investment in Technology Standards Years in AdvanceEach new generation of mobile devices and networks takes roughly a decade of risky R&D to invent,
and then collaboration among engineers from across the industry who jointly develop the standards
1980 1988 1995 2002 20142008 2020
• Regional Systems
• Digital Voice
• Simple Data
• First Global Systems
• Mobile Broadband (High-speed Internet)
• Apps Enabled
• Streaming Media
R&D Commercial
1G
2G<0.5 Mbps
Enhanced voice
Email and mobile internet
Applications enabled
NOT POSSIBLE: Roaming, text, email, apps, or streaming media
2010: 5G TECHNOLOGY
Millions and billions of small devices
wirelessly connected. Smart cities,
smart homes, mobile enhanced
infrastructure, and more.
• New Paradigm
• Internet of Things (IoT)
New business modelsFirst data ratesStreaming media at high speeds
Digital voice + textInternational roaming enabled
Analog voice
3G63+ Mbps
4G300+ Mbps
5G
2002: OFDM2009: LTE REL 8
2011: REL-A 10
2000: CDMA 2000 1X2000: WCDMA REL99
2002: EV-DO REL 02006: HSDPA REL 52007: HSUPA REL 62009: HSPA + REL 7
1997: EV-DO
1998: EV-DV
1995: CDMA
IS-95A
1987: GSM
1988: CONCEPTION OF
CELLULAR CDMA
• Non-Interoperable Systems
• Analog Communications

As Wireless Technology Advances to Increase Supply of Broadband…
Demand for Mobile Transmission Evolves Toward a World of Data
Source: Ericsson's Mobility Report (2007-2015)Source: Compiled from major 3GPP releases including: GSM/EDGE, WCDMA Rel-99,
HSPA, HSPA+, LTE Rel-8-12 at www.3gpp.org
00
500
1,000
1,500
2,000
2,500
3,000
3,500
2,000
3,000
1,000
4,000
5,000
6,000
2007 2008 2009 2012 2013 2014 2015 20161996 1998 2000 2002 2004 2006 2008 2010 2012 2014 2016
Voice Data
~12,000X peak download speeds between 2G and 4G
Voice and Data Usage in Mobile Networks 2007-2016Peak Data Rates for Mobile Networks in Mbps
14.4 28 42100
300
600
3000Mbps
6,246% growth in data traffic between 2007 and 2016
0.40.2
2010 2011

Case Studies: Wireless System Inventions Enable New Platforms
• Assisted GPS
• High Data Rates• Mobile Payments
• Multimedia, Audio,
Video, Graphics• Cellular Modem 3G/4G
• Camera
YouTube($1.65 Billion)
Phone Base Station Servers in Cloud
Uber($62.5 Billion)
• Multimedia, Audio,
Video Graphics• High Data Rates
• GPS Positioning
• Camera
Pokemon Go($160 Million)
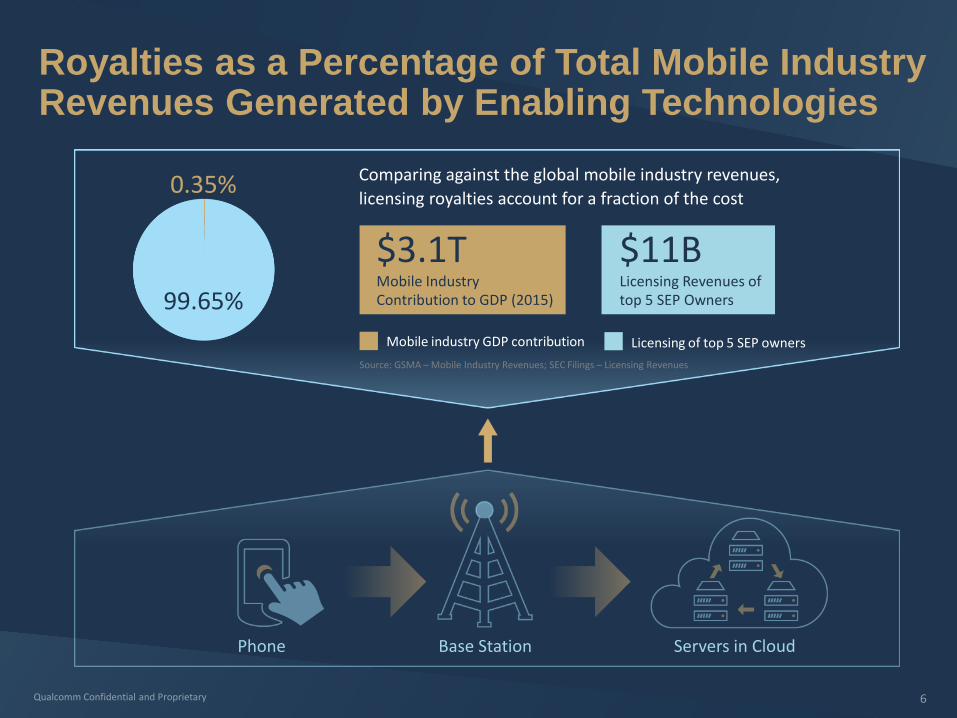
Royalties as a Percentage of Total Mobile Industry Revenues Generated by Enabling Technologies
Phone Base Station Servers in Cloud
Licensing of top 5 SEP ownersMobile industry GDP contribution
Comparing against the global mobile industry revenues,
licensing royalties account for a fraction of the cost
Source: GSMA – Mobile Industry Revenues; SEC Filings – Licensing Revenues
$3.1TMobile Industry Contribution to GDP (2015)
$11BLicensing Revenues of top 5 SEP Owners99.65%
0.35%

Types of standards

Types of standards (but of a very different kind)
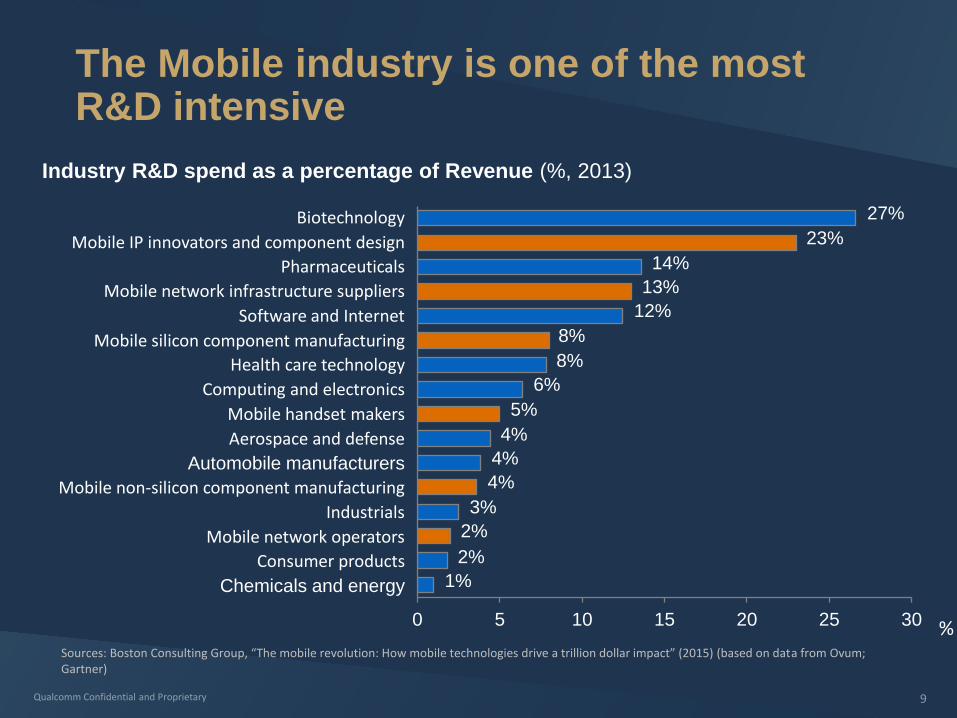
The Mobile industry is one of the most R&D intensive
27%
23%
14%
13%
12%
8%
8%
6%
5%
4%
4%
4%
3%
2%
2%
1%
0 5 10 15 20 25 30
Mobile non-silicon component manufacturing
Health care technology
Mobile silicon component manufacturing
Software and Internet
Mobile network infrastructure suppliers
Pharmaceuticals
Mobile IP innovators and component design
Biotechnology
%
Chemicals and energy
Consumer products
Mobile network operators
Industrials
Automobile manufacturers
Aerospace and defense
Mobile handset makers
Computing and electronics
Industry R&D spend as a percentage of Revenue (%, 2013)
Sources: Boston Consulting Group, “The mobile revolution: How mobile technologies drive a trillion dollar impact” (2015) (based on data from Ovum; Gartner)

The Mobile Industry Technology Development Stages
The stages of development in this industry include:
Investment Risk:
Medium RiskMarket adoption unknown
Lower RiskMarkets adopt technology
Highest RiskInter-standards competition& market adoption unknown
Standardized technologyis developed
Standards-compliant productsare developed
Interoperable networksare deployed
Gupta, Kirti. "Technology Standards and Competition in the Mobile Wireless Industry." Geo. Mason L. Rev. 22 (2014): 865.
R&D Investment is risky

Some Highlights of the SEP/FRAND DebateSuggested theories of harm
R&D and Patenting
SSOs set Standards
Manufacturers Invest
Patent holders set
royalties
Product market
competition
STAGE 1 STAGE 2 STAGE 3 STAGE 4 STAGE 5
• Patent owners make a commitment to license their SEPs on Fair Reasonable and Non Discriminatory (FRAND) terms.
• However, under this model, concerns have been raised about patent holders charging “excessive royalties” at Stage 4.
The Premise for “Patent hold-up” and “Royalty Stacking”
Source: Gelatovic and Haber (2016)

Some Highlights of the SEP/FRAND DebateSuggested theories of harm
R&D and Patenting
SSOs set Standards
Manufacturers Invest
Patent holders set
royalties
Product market
competition
STAGE 1 STAGE 2 STAGE 3 STAGE 4 STAGE 5
Ex- Ante Ex- Post
Patent holder
faces competition
Competition
is eliminated
“Patent hold-up”
“Royalty Stacking”
Ex-post Opportunism
Standard is Established (SEPs)
Manufacturers have sunk costs

Some Highlights of the SEP/FRAND DebateSuggested theories of harm – Problem 1: Issue with underlying premise
R&D and Patenting
SSOs set Standards
Patent holders set
royalties
Manufacturers Invest
Product market
competition
STAGE 1 STAGE 2 STAGE 3 STAGE 4 STAGE 5
The Premise of ex-post licensing rates is incorrect
For e.g.: Royalty rates for 4G LTE were announced prior to widespread deployment of the technology
Source: Stasik (2010), ETSI (2010)

Some Highlights of the SEP/FRAND DebateSuggested theories of harm - Problem 2: Limited Model
R&D and Patenting
SSOs set Standards
Manufacturers Invest
Patent holders set
royalties
Product market
competition
STAGE 1 STAGE 2 STAGE 3 STAGE 4 STAGE 5
Ex- Ante Ex- Post
Patent holder
faces competition
Competition
is eliminated
“Patent hold-up”
“Royalty Stacking”
Ex-post Opportunism
Standard is Established (SEPs)
Manufacturers have sunk costs

Some Highlights of the SEP/FRAND DebateSuggested theories of harm - Problem 2: Limited Model
R&D and Patenting
SSOs set Standards
Manufacturers Invest
Patent holders set
royalties
Product market
competition
STAGE 1 STAGE 2 STAGE 3 STAGE 4 STAGE 5
Ex- Ante Ex- Post
Risk before R&D sunk
cost: Will the standard
succeed?
Competition
across and
within SSOs
A particular
standard
succeeds
Standard is Established (SEPs)
Manufacturers have sunk costs
Standards adoption unknown
Inventors have sunk costs
“Patent hold-out”
Ex-post Opportunism
“Reduced Royalties”

Some Highlights of the SEP/FRAND DebateSuggested theories of harm – Problem 3: Evidence from the market?
R&D and Patenting
SSOs set Standards
Manufacturers Invest
Patent holders set
royalties
Product market
competition
Patent holder
faces competition
Competition
is eliminated
“Patent hold-up”
“Royalty Stacking”
Ex-post Opportunism
Standard is Established (SEPs)
Manufacturers have sunk costs
Ex- Ante Ex- Post
Should see
impact on
product market
competition

Evidence From the Mobile IndustryReducing consumer prices as number of SEP owners increase
Average Selling Price and Number of SEP Owners (1994-2013)
0
50
100
150
200
250
300
350
400
450
19
94
19
95
19
96
19
97
19
98
19
99
20
00
20
01
20
02
20
03
20
04
20
05
20
06
20
07
20
08
20
09
20
10
20
11
20
12
20
13
Average Selling Price of Handset SEP Owners
130
123
116
110
105101
95
8984
74
68
58
49
38
3230
19
742
Source: Gelatovic and Gupta (2015), “Royalty Stacking and Standard Essential Patents: Theory and Evidence from the Mobile Wireless Industry:, Hoover IP2 Working Paper

Evidence From the Mobile IndustryIncreasing market entry and reducing concentration as number of SEP owners increase
Number of firms and average sales per firm (1992-2013, thousands of 2013 $)
19
94
19
95
19
96
19
97
19
98
19
99
20
00
20
01
20
02
20
03
20
04
20
05
20
06
20
07
20
08
20
09
20
10
20
11
20
12
20
13
19
93
19
92
0
5,000,000
10,000,000
15,000,000
20,000,000
25,000,000
Ave
rage
sal
es p
er f
irm
3G Cell phones
introduced
iPhoneintroduced
4G Cell phones
introduced
2G Cell phones
introduced0
5
10
15
20
25
30
35
40
45
50
Average Sales per Phone Manufacturer Number of Phone Manufacturers
Nu
mb
er o
f fi
rms
Source: Gelatovic and Gupta (2015), “Royalty Stacking and Standard Essential Patents: Theory and Evidence from the Mobile Wireless Industry:, Hoover IP2 Working Paper