Assessing the Costs of on-Site Sanitation · PDF file4.2.3. Substructure vs. superstructure...
27
Eawag: Swiss Federal Institute of Aquatic Science and Technology Eawag Überlandstrasse 133 P.O. Box 611 8600 Dübendorf Switzerland Phone +41 (0)44 823 55 11 Fax +41 (0)44 823 50 28 www.eawag.ch Assessing the Costs of on-Site Sanitation Facilities Study Report Lukas Ulrich, Prit Salian, Caroline Saul, Stefan Jüstrich & Christoph Lüthi March 2016
Transcript of Assessing the Costs of on-Site Sanitation · PDF file4.2.3. Substructure vs. superstructure...

Eawag: Swiss Federal Institute of Aquatic Science and Technology
Eawag
Überlandstrasse 133
P.O. Box 611
8600 Dübendorf
Switzerland
Phone +41 (0)44 823 55 11
Fax +41 (0)44 823 50 28
www.eawag.ch
Assessing the Costs of on-Site
Sanitation Facilities
Study Report
Lukas Ulrich, Prit Salian, Caroline Saul, Stefan Jüstrich & Christoph Lüthi
March 2016

Assessing the Costs of on-Site Sanitation Facilities
2/27
Contents
1. Summary .......................................................................................................................................... 4
2. Introduction ....................................................................................................................................... 5
3. Methods ............................................................................................................................................ 6
3.1. Comparing the cost of on-site sanitation facilities across countries ............................................ 6
3.1.1. Ensuring comparability ............................................................................................................. 6
3.1.2. Selection of technologies ......................................................................................................... 6
3.2. Cost items included in the country comparison ........................................................................... 7
3.3. Data collection and analysis ......................................................................................................... 8
3.3.1. Development of a bill of quantities (BoQ) based model for cost estimation ............................ 9
4. Results ........................................................................................................................................... 10
4.1. Key factors that determine local costs ....................................................................................... 10
4.1.1. Material market....................................................................................................................... 11
4.1.1. Quality of material and resulting material efficiency............................................................... 11
4.1.2. Roads / accessibility / traffic ................................................................................................... 11
4.1.3. Labour market ........................................................................................................................ 12
4.1.4. Labour productivity ................................................................................................................. 12
4.2. Cost analysis across countries................................................................................................... 12
4.2.1. Local design differences ........................................................................................................ 12
4.2.2. Cost breakdown: material vs. labour costs ............................................................................ 13
4.2.3. Substructure vs. superstructure costs .................................................................................... 16
5. Conclusions and Recommendations ............................................................................................. 16
5.1. Reasons for high construction costs .......................................................................................... 16
5.2. Possibilities to reduce the sanitation hardware costs ................................................................ 17
5.2.1. Design optimization ................................................................................................................ 18
5.2.2. Prefabrication and mass production ...................................................................................... 18
5.2.3. Using alternative construction materials ................................................................................ 19
5.3. Possibilities to facilitate access to sanitation infrastructure and services .................................. 20
5.3.1. Promoting market innovations for on-site solutions ............................................................... 20
5.3.2. Providing adequate financing mechanisms ........................................................................... 20
5.3.3 Reducing information asymmetry in sanitation services ............................................................. 21
6. Outlook ........................................................................................................................................... 22
7. Acknowledgements ........................................................................................................................ 22
8. References ..................................................................................................................................... 22
Annex: Market Innovations for On-Site Sanitation ................................................................................. 24
Assessing the Costs of on-Site Sanitation Facilities
3/27
Assessing the Costs of on-Site Sanitation Facilities
Study Report by
Lukas Ulrich, Prit Salian, Caroline Saul, Stefan Jüstrich & Christoph Lüthi
This report was published under the Eawag research program ‘Wings’ (Water and sanitation innovations for non-grid solutions). Wings is an inter- and transdisciplinary strategic research program that strives to develop novel non-grid-connected water and sanitation systems that can function as comparable alternatives to network based systems.
This research was funded by the Swiss Agency for Development and Cooperation (SDC)
and Eawag, the Swiss Federal Institute of Aquatic Science and Technology.
Please cite as:
Ulrich et al, 2016. Assessing the Costs of on-Site Sanitation Facilities, Study Report by
Eawag-Sandec, Sanitation, Water and Solid Waste for Development, Dübendorf,
Switzerland.
Assessing the Costs of on-Site Sanitation Facilities
4/27
1. Summary
Why are sanitation facilities like ventilated improved pit (VIP) latrines and other dry toilets so much
more expensive in sub-Saharan Africa than in Asia? This report compiles the findings of a multi-
country study comparing costs of on-site sanitation infrastructure in Asia and sub-Saharan Africa. It
attempts to provide answers to the question why hardware costs for on-site sanitation are so much
higher in Sub-Saharan Africa than in Asia and examines the main factors that lead to these high costs.
The report specifically looks at the capital costs of household-level, on-site sanitation technologies
which are prevalent in most cities and rural areas of Africa and Asia. The report does not attempt to
quantify software costs (e.g. public support to promote sanitation coverage and create demand).
Engineers and project managers struggle to provide site-specific cost estimates that allow for sound
technology decision-making and budget planning in sanitation programming. Estimating capital and
operational infrastructure costs is not easy, especially considering all the context-specific and variable
factors that determine the total costs. It is notoriously difficult to compare costs of different sanitation
facilities as these facilities can be built in different sizes and using different technologies, depending
on the number of people they are designed to serve and the level of service they are designed to
provide. The authors have decided to focus on the two most widespread on-site technologies found in
low-income urban contexts: the VIP latrine and the single pit latrine. This multi-country comparative
assessment analyses data obtained from Sandec’s field research between 2012 and 2015 as well as
data on the costs of on-site sanitation infrastructure found in related literature. As an output of this
study, a simple and adaptable bill of quantities (BoQ) based costing tool was developed (see chapter
3.3.1).
This report provides a detailed analysis of the reasons for cost differences between the countries
studied. It also gives specific and field-tested recommendations on how the problem of high costs can
be addressed (including prefabrication to increase productivity and decrease construction time, the
development and use of material alternatives, as well as financing mechanisms like microcredits and
subsidies).
The following points highlight the main findings of the study:
For the on-site toilet technologies analysed, African sanitation facilities are on average three
times more expensive than Asian examples, due to the high material costs (esp. cement and
bricks), lack of prefabricated or mass produced toilet components (which are common in
Asia), and the informality of the construction sector dominated by micro-entrepreneurs.
Costs of the analysed on-site options (VIP latrines and lined single pit latrines) are greater
than households’ willingness to pay in urban sub-Saharan Africa and financing mechanisms
like public subsidies will be required if substantial progress is to be made in sanitation uptake.
Labour costs are very low: less than a third of the overall toilet costs both in Africa and Asia
are labour costs, reflecting the low remuneration in the informal building sector.
Conversely, high material costs (ranging from 55% to 86% of total hardware costs) are the
common feature of all on-site sanitation technologies analysed in this study. Therefore, efforts
to lower on-site facility costs must focus on material costs, not labour inputs.
As most sanitation facilities in Africa’s low-income areas are built as outhouse structures, the
cost of a durable superstructure constitutes about a third of the overall toilet cost.
Due to difficult accessibility of informal settlements, transport costs can also significantly
increase costs by 5% to 7% of overall capital expenditure.
A further reason for the high toilet costs is the information asymmetry in sanitation services:
because there are no standard toilet designs and the construction sector is informally
organised, clients (mainly landlords) find it difficult to make informed market-based decisions.

Assessing the Costs of on-Site Sanitation Facilities
5/27
2. Introduction
Low ability and willingness to pay are among the main reasons why access to adequate sanitation
infrastructure remains low in both rural and urban areas of low and middle-income countries. In
Uganda’s capital Kampala, for instance, a ventilated improved pit (VIP) toilet costs over USD 5001,
which is equal to the average annual
income of a slum dweller (Günther et
al. 2011). Are people willing to
acquire improved sanitation facilities
even if they are so expensive? A
detailed analysis of the willingness to
pay (WTP) for improved sanitation in
Kampala (Horst 2015, survey
conducted in 2010) revealed that the
stated demand or willingness to pay
was much lower than the actual
market price of improved sanitation
facilities (The mean WTP is about
25% of the market price for an
improved VIP toilet as built by the U-
ACT project). This finding excludes
owners with existing improved
access to a sanitation facility (16% of
the sample) (Fig. 2-1). The Kampala
case is characteristic for the challenges in sub-Saharan Africa, where a clear mismatch between the
willingness to pay and the market price for improved sanitation hardware results in the widespread use
of sub-standard simple pit latrines (Figure 2-2).
The urban poor in Kampala currently need to spend their
annual per capita income to own an improved VIP toilet
(Günther et al., 2011). A simple VIP latrine with a 3 m
deep pit costs between US$ 400 (unlined pit) to US$ 800
(lined pit) in informal settlement areas. To obtain a depth
of 3 m in high water table areas, the pit has to be
elevated, adding further construction costs.
Asia, however, reveals a different situation with
sanitation infrastructure components often available at
relatively low prices and thus within the means of poorer
households. A frequently cited example of low-cost
toilets comes from rural Bangladesh: after a social
mobilisation campaign in the mid-1990s, the demand for
toilets rose considerably. Since then, thousands of small
private workshops sell latrines (pan, slab and rings) for
less than US$ 100 (BRAC & IRC, 2015, Heierli et al.
2011, Sijbesma 2008).
This report aims to take a closer look at the striking cost differences for sanitation hardware between
Sub-Saharan Africa and Asia as revealed by the Uganda and Bangladesh comparison. In order to
analyse the reasons behind the regional variations of costs, the study aims to identify the factors
determining the capital costs of specific on-site sanitation options in different African and Asian
1 2011 exchange rate
Figure 2-1: Willingness to pay for a new sanitation facility for landlords in Kampala. Source: Horst, A. (2015)
Figure 2: Sub-standard pit latrine in
Kampala, Uganda.
0
1000000
2000000
UG
X
0 20 40 60 80 100
Percentage of respondents
WTP Mean WTP Median WTP Market price
(excluding owners currently with improved access)
Owners' Demand for Improved Sanitation

Assessing the Costs of on-Site Sanitation Facilities
6/27
countries. The comparative assessment includes field data and literature from Bangladesh, Nepal,
India, Kenya, Tanzania and Uganda. Finally, practical solutions how the prohibitive costs of
household-level sanitation infrastructure (particularly in sub-Saharan Africa) could be reduced are
proposed based on the findings. This includes an evaluation of the potential of non-conventional
construction materials, but also the exploration whether some of the experiences from Asia can be
transferred.
3. Methods
This multi-country comparative assessment analyses data obtained from Sandec’s field research
between 2012 and 2015 as well as data on the costs of on-site sanitation infrastructure found in
related literature.
For the comparative costing study of on-site technologies three focus countries were selected based
on the availability of data and the experience from previous Sandec projects: Nepal, Uganda and
some cost data available from a case study in Mauritania was also used. A large amount of cost
figures and existing bills of quantities were compared from the focus countries to analyse and
compare the different cost factors.
3.1. Comparing the cost of on-site sanitation facilities across countries
3.1.1. Ensuring comparability
This study does not include a cost comparison across technologies (e.g. VIP vs. septic tank), because
different technologies may provide different levels of service. The focus of the comparative
assessment is on different contexts in which a given technology is used (e.g. VIP in a sub-Saharan vs.
Asian country). This report does not aim to compare the costs of different sanitation system
alternatives. The costs in different contexts can only be compared if the same system boundaries are
used. Differences in the underlying conditions and cost calculations are analysed and taken into
consideration. The fact that different materials have different lifetimes also has to be taken into
consideration. For costs to be comparable, they have to be related to a specific facility performing
during a defined time span for a given number of users.
3.1.2. Selection of technologies
In order to be able to compare technologies across continents and different countries, two common
on-site sanitation technologies were chosen: the ventilated improved pit toilet (VIP latrine) and urine-
diverting dehydration toilets (UDDTs). Both are well known and popular sanitation technologies in all
of the study countries. The single VIP toilet (U.1 and S.3 in the Compendium, see Tilley et al. 2014) is
appropriate for arid and water scarce contexts and works in rural and medium dense peri-urban
contexts. dehydration vaults (U.2 and S.7 in the Compendium) is also a dry toilet technology well
adapted to water scarce environments and has the advantage that the dehydrated faeces can be self-
emptied and the risk of groundwater pollution is low.
Figure 3-1 below explains the main features of the two of the technologies compared in this study.

Assessing the Costs of on-Site Sanitation Facilities
7/27
VIP toilet (S.3)
Main advantages
+ flies & odours are significantly
reduced
+ can be built and repaired with locally
available materials
+ small land area required
Main disadvantages
- low reduction in BOD and pathogens with
possible contamination of groundwater
- costs to empty may be significant compared
to capital costs
- sludge requires secondary treatment and/or
appropriate discharge
Dehydration Vaults (S.7)
Main advantages
+ simple and robust technology
+ can be built with locally available materials
+ no or low operating costs if self-emptied
+ requires training and acceptance to be used
correctly
Main disadvantages
- requires constant source of cover material like
ash
- manual removal of dried faeces is required
Figure 3-1: main features of VIP latrines (left) and dehydration vaults (right)
3.2. Cost items included in the country comparison
An integrated economic analysis needs to take into account the costs occurring during the entire life
cycle of a facility (see Figure 3-2). Since the present study looks at the differences in hardware costs
across countries, the focus is on capital expenditures only (one-time upfront investment costs).
However, related life cycle cost are also discussed where applicable (e.g. implications of material
choice on operation and maintenance (O&M) requirements or expected lifetime). Especially when
analysing the cost reduction potential, not only material costs and expected lifetimes should be taken
into consideration but the entire life cycle costs, including O&M expenditures.

Assessing the Costs of on-Site Sanitation Facilities
8/27
Figure 3-2: Life cycle cost of providing a sustainable level of service (Source: Fonseca et al. 2011)
Capital expenditure includes all costs that accrue during the construction phase of a sanitation facility,
namely:
i. Material cost = material rates x material quantities + transport cost
ii. Labour cost = labour rates x labour quantities
iii. Land cost
iv. Cost of planning and construction supervision, etc.
iii. and iv. are in grey because they are usually less of interest for on-site sanitation infrastructure and
are excluded from this study for the following reasons:
o Costs for land acquisition are site-specific and in most cases the person commissioning an
on-site sanitation facility already owns the land.
o Planning and supervision costs are not commonly documented for on-site facilities because
o either not much planning is involved for simple designs and supervision is managed
by the builder or client (e.g. VIP toilet),
o or it is part of a building contract and difficult to allocate separately (e.g. septic tank).
3.3. Data collection and analysis
After analysing existing costing tools developed by different organisations (e.g. WASHCost by IRC,
the CLARA simplified planning tool or the Economics of Sanitation Initiative (ESI) Toolkit) the authors
decided to focus on a detailed sanitation technology cost analysis based on disaggregated cost data
collected from implemented sanitations projects. However, getting access to reliable and comparable
data across different countries proved to be one of the most difficult endeavours of this study. Data is
often very specific to one project or context, and material and labour costs are not documented in
detail (lump sum aggregate rather than unit rates and quantities for individual components), making it
difficult to analyse the various costs.

Assessing the Costs of on-Site Sanitation Facilities
9/27
3.3.1. Development of a bill of quantities (BoQ) based model for cost estimation
Data availability is still a key constraint for practitioners aiming to develop reliable cost estimates and
budgets for decision-making regarding the construction and operation of sanitation and wastewater
infrastructure. This is of particular relevance for non-conventional sanitation technologies that are not
widely known and used. With the goal to contribute to closing this gap, Sandec proposed the
development of a BoQ-based sanitation costing Excel tool, which will be featured as part of the
CLUES toolbox as a tool for obtaining realistic technology-specific cost estimates. Eawag-Sandec
initiated the collection of cost data for sanitation technologies from its own projects as well as through
implementing partners willing to share their BoQs. Key challenges encountered in this endeavour
were: i) collected designs are often project-specific (e.g. from small-scale pilots with special designs)
and highly variable and therefore difficult to standardize or use in other contexts, ii) the BoQs provided
by third-party sector organisations often lack the corresponding metadata (design information,
drawings and pictures). The BoQ approach has its limitations, particularly for the more complex
technologies where the BoQ depends on the design approach and more complex dimensioning. For a
relatively accurate estimate of the cost of on-site sanitation technologies, however, it proves to be the
best approach. Due to these difficulties the further development of this tool and further data collection
will remain an ongoing task in the coming years. An automated, easy-to-use and transparent Excel
template has been developed, where data can be filled in easily and new technologies and designs
added in a continuous process. The use of this template will help to make further data collection more
easy and systematic.
The Excel tool runs without macros in order to reduce the security risk and make it more robust. It was
designed to compare the cost of two models (design alternatives) and comes with default categories,
components and units. These can be easily modified by the user for any context. Furthermore, if one
wants to analyse the cost in a different currency or if the exchange rate has changed, this can be done
with little effort, even retrospectively.
By assigning items to (i) categories (such as material, labour, transport, etc.) and (ii) components (e.g.
superstructure, substructure or user interface), it allows the user to get a detailed overview on the
different cost items. An automatic graphical representation of the cost shares according to the
categories and components in the form of pie charts (Fig. 3-3) simplifies the identification of cost
drivers. The comparison of two different models (designs) in the form of column charts (Fig. 3-4)
facilitates the selection of the economically more suitable system.
Figure 3-3: Visualisation of cost shares in the Excel template according to expenditure categories (left) and
building components (right). Categories and components can be defined by the user.

Assessing the Costs of on-Site Sanitation Facilities
10/27
Figure 3-4: The Excel template offers easy comparison of two different design alternatives (models) according to
expenditure categories (left) and building components (right).
Possible future developments of the tool include the compilation of widespread design data for key
sanitation technologies into typical (or even standardized) BoQs. Such a tool could then be used by
decision-makers and planners to obtain substantiated and informed cost estimates by simply making
context-specific adaptations (e.g. of the types and quantities of materials to be used) and entering
local unit rates.
4. Results
Detailed cost data from ten different dry toilet case studies was analysed from Bangladesh, Nepal,
India, Kenya, Tanzania and Uganda. Technologies included: Single VIPs, UDDT, lined single pits and
Fossa Alterna. For reasons of space, detailed costs for only four of these toilets are presented on
page 15. The results of the analysis of costs of those different dry toilet case studies in Africa and Asia
reveals the following findings:
i. On average the cost of the five toilets analysed in Africa was US$ 423 (ranging from US$ 172
to 783) (these included two VIPs from Uganda and Tanzania, a Fossa Alterna and UUDT
from Tanzania and a lined single pit latrine from Kenya). The average cost of the five on-site
toilets in Asia was US$ 141 (ranging from US$ 40 to 280) (the Asian toilets compared
included two single pit pour flush toilets from Nepal, two UDDTs from India and Nepal and a
single pit lined pour flush toilet from Bangladesh) This means that on average African on-site
toilets were three times more expensive than the cost of Asian on-site toilets.
ii. The average labour costs amounted to 31%, these costs were slightly higher in Asia (34,7%)
than in Africa (28,5%).
iii. All of the 10 toilets were outhouse toilets with purpose-built superstructures (except one
example from Nepal without a superstructure). The superstructure is a significant cost factor,
albeit one with big variations. It was not possible to evaluate the superstructure cost for all
technologies, but for the four technologies where it was possible, it represented 34% of the
overall toilet cost.
4.1. Key factors that determine local costs
Figure 4-1 below provides an overview of the different cost factors that were found to be influential on
the capital expenditure for an on-site sanitation facility, i.e. material and labour cost. Those influences
are either direct or indirect, as shown by the different arrows. The key cost factors are described in the
following paragraphs.

Assessing the Costs of on-Site Sanitation Facilities
11/27
Figure 4-1: Cost factors (oval shapes) influencing material and labour costs of on-site sanitation facilities. The arrows represent key influences.
4.1.1. Material market
Markets are complex systems that are influenced by numerous factors. Material prices are determined
by market structures and regulations (e.g. taxes), programmes and policies of governments and
donors (e.g. subsidies), as well as properties of supply chains and distribution channels (e.g.
production sites and processes, transport). Sanitation markets in Africa and Asia are very fragmented
and there is no real competition at local (neighbourhood) scale.
4.1.1. Quality of material and resulting material efficiency
The quality of material has a large influence on the required construction time and the quantity of
material required. For example, across most parts of Sub-Saharan Africa the basic quality of bricks is
extremely poor because they are poorly manufactured either on-site or in nearby make-shift kilns. This
results in bricks crumbling before being touched by the mason. In addition, the mason applies a larger
layer of mortar, sometimes as thick as 2-3 cm in order to cover up the inconstancies and to get the
level, shape and size of the wall right. This process leads to a 15-20% (if not more) increase in sand
and cement (both relatively expensive materials) as well as labour time required to construct a wall. In
Asia, the quality of materials available is typically considerably better, which also contributes to lower
cost.
4.1.2. Roads / accessibility / traffic
In large metropolitan areas, transport costs can be a considerable cost factor, mainly due to heavy
traffic congestion and poor accessibility. Building sanitation facilities in dense slums without proper
road access means that bulky materials need to transported manually or by hand cart to the

Assessing the Costs of on-Site Sanitation Facilities
12/27
construction site (and transporting away the earth from pit excavations). Materials are prone to theft
and therefore require supervision by watchmen, or only small quantities can be stored on-site,
basically what can be built during one working day. For this reason, transportation costs in informal
settlements can vary between 4% to 7% of overall construction costs (Lüthi et al, 2013)
4.1.3. Labour market
Most small-scale entrepreneurs active in latrine construction can be considered as micro-
entrepreneurs belonging to the urban informal sector. Masons will try to maximize the building time to
cover all non-core activities and to increase their income and, therefore, there is no real incentive to
improve efficiency and productivity – building a toilet in less time would mean less remuneration.
Small-scale entrepreneurs are risk averse and latrine construction is usually a secondary business line
next to house construction or improvements.
4.1.4. Labour productivity
The most commonly used measure of labour productivity is hours worked in relation to output.
However, there are limitations to comparing labour productivity across countries2. The factors affecting
labour productivity are of broadly the same type as those that affect the performance of manufacturing
firms as a whole. They include: (1) physical location, and technological factors; (2) motivational and
behavioural factors; (3) managerial-organizational and wider economic and political-legal
environments; (4) individual rewards and payment systems, and (5) lack of professional training of
masons, plumbers, etc. Due to the low skills base and poor remuneration, labour productivity in the
cases studied in Sub-Saharan Africa was lower than in Asia featuring longer construction times. The
lack of professional training for masons, plumbers, etc. largely inhabits productivity. In most low-
income countries, the primary reason for the lack of a skilled labour force can also be attributed to the
non-existence of technical vocational training institutes.
4.2. Cost analysis across countries
4.2.1. Local design differences
Local design requirements and preferences are key factors that explain the high diversity of on-site
latrine designs and varying costs. In order for a system to function properly, its technical parameters
have to meet the requirements of the specific socio-cultural and physical context (e.g. preference of
sitting or squatting user interface, watertight construction for wet and flood-prone areas). Such special
local design requirements also need to be taken into account as they can have a significant impact on
the costs. Toilet technology also differs greatly across countries. Recent innovations in Bangladesh
involving the national NGO BRAC and private sector suppliers show that affordable on-site technology
that encompasses the entire supply chain is possible. The standard BRAC toilet design includes a
2 The validity of international comparisons of labour productivity can be limited by a number of measurement
issues. The comparability of output measures can be negatively affected by the use of different valuations, which define the inclusion of taxes, margins, and costs, or different deflation indexes, which turn current output into constant output. Labour input can be biased by different methods used to estimate average hours
or different
methodologies used to estimate employed persons. In addition, for level comparisons of labour productivity,
output needs to be converted into a common currency. The preferred conversion factors are Purchasing Power Parities, but their accuracy can be negatively influenced by the limited representativeness of the goods and services compared and different aggregation methods (Wikipedia 2014).

Assessing the Costs of on-Site Sanitation Facilities
13/27
pour-flush toilet squat pan with two alternating off-set pits which use prefabricated concrete rings for
lining the pits (see Fig. 4-2). This on-site solution provides for a higher level of hygiene and comfort,
thanks to the water seal. The toilet can also be built and repaired using locally available materials.
Concrete rings are the preferred material for lining the toilet pit. On average, five concrete rings were
used per pit. The majority of the superstructures are made of durable materials. However, the ultra-
poor and poor also use traditional non-durable materials such as thatch and bamboo. Toilet prices
vary greatly between US$ 15 (single pit with simple superstructure) to US$ 130 (double pit) and the
average amount households spend on their sanitation facility is Taka 6,850, which amounts to US$ 90
(BRAC and IRC, 2015). The cost differences can be explained by the amount of cement rings installed
and the varying quality of the superstructure.
Most ultra-poor and poor households will find it
difficult to construct the types of hygienic toilets
promoted by BRAC without financial support. BRAC
provides ultra-poor households with an in-kind
grant, which covers the costs of a complete set of
toilet parts for a double off-set pit (Fig. 4-3). It does
not, however, cover all the costs associated with
installing a toilet (e.g. labour or transport). Poor
households receive an interest free loan from
BRAC, which covers part of the costs. The ultra-
poor spent an average Taka 1,500 (US$ 20) on top
of the grant received (BRAC and IRC, 2015).
This case study from Bangladesh exemplifies the
large cost implications that different design
alternatives can have, even within one contextual
setup and technology option. The design alternative
with prefabricated concrete rings for pit lining which is widespread in Bangladesh is rarely found in
sub-Saharan Africa. This is not because the local environment would not permit for such a design;
rather, this design alternative is not widely known and corresponding material, prefabrication and retail
supply and service chains are lacking.
Figure 4-3: Owner of a hardware store in Bangladesh presenting various latrine
components ( © Ingeborg Krukkert/IRC)
4.2.2. Cost breakdown: material vs. labour costs
High material costs (ranging from 53% to 86% of total costs) are the common feature of all on-site
sanitation technologies analysed in this study. This is in accordance with other large-scale sanitation
Figure 4-2: Twin pit for pour flush technology used
in Bangladesh.

Assessing the Costs of on-Site Sanitation Facilities
14/27
programmes recently finalised, e.g. a sanitation project in rural India started in 2009 (7,000 twin soak
pits including superstructure with a cost of USD 184 per unit), where materials accounted for 76% of
the total cost. The main cost factors were key material inputs (sand, cement, aggregate, bricks)
(accounting for 53% of the total cost), followed by the door (11%), the roof (6%), the toilet seat (3%),
and pipes, plumbing and vent pipes (3%) (Graf et al. 2014).
In another project, 61,000 flush toilets, composed of a squat pan and a slab without pit lining, were
installed in rural Cambodia (Table 4-1).
US$ %
Input material 27.50 56
Labour 5.00 10
Transport & delivery 4.00 8
Manufacturer’s margin 10.00 20
Sale agent’s margin 1.63 3
Micro finance institute 1.00 2
Total 49.13 100
Table 4-1: Cost breakdown of rural toilets in Cambodia (Source: Graf et al. 2014)
Material costs are highest in landlocked countries like Uganda and Nepal, where the price of cement is
usually a key cost factor. In Uganda for example one cement bag (40 kg) costs UGX 28,000
(wholesale sellers) to 30,000 (USD 12) (retail sellers).
Surprisingly, labour costs are extremely low: less than a fifth of the overall toilet costs both in Africa
and Asia are labour costs, reflecting the low remuneration in the informal building sector. In the above
mentioned example in rural India, labour accounted for only 22% of the total cost.

Assessing the Costs of on-Site Sanitation Facilities
15/27
Figure 4-4: Comparison of material and labour costs of four dry toilets in Africa and Asia
The comparison between the two on-site technologies in East Africa (the single urine diverting dry
toilet from Sanergy, Nairobi and the single VIP toilet with a lined pit built by U-ACT in Kampala)
exemplifies the high costs involved in building new sanitation facilities. The U-ACT toilet is 43% more
expensive than the Sanergy toilet due to the lined pit and on-site high-end finish of the superstructure.
Sanergy has been investing a lot in producing pre-fabricated elements that ensure a quick installation
time (two days) as well as material savings (see Fig. 4-5 below). Important to note is that the
Sanergy Toilet (Nairobi) (2014)
Nr Item Cost KSHs US$ %
1 Material Costs 23440 246.74 55%
2 Labour costs installation (9 man-days) 6027 63.44 14%
3 Sanergy management 6214 65.41 15%
4 Transport costs 6728 70.82 16%
42409 446.41 100%
UDDT Dry Toilet with bucket system with pre-fab cement superstructure
U-ACT VIP Toilets (Kampala) (2013)
Nr Item Cost UGXs US$ %
1 Material Costs 1695000 676.38 86%
2 Labour costs construction (15 man-days) 290000 94.31 12%
3 Transport costs 40000 13.01 2%
2'025'000 783.69 100%
Single VIP toilet with lined 3m3 pit volume & handwashing unit
1US$ = UGX 2506
Pour flush toilet with leach pit (Nala, Nepal) (2015)
Nr Item Cost NPR US$ %
1 Material Costs 20'000 200.00 71%
2 Labour costs construction (10 man-days) 6'000 60.00 21%
3 Transport costs 2'000 20.00 8%
28'000 280.00 100%
Single pour flush toilet with offsetunlined leach pit, 1 m pipe and brick superstructure
1US$ = 100 NPRs
Pour flush toilet with leach pit* (Surkhet District, Nepal)
Nr Item Cost NPR US$ %
1 Material Costs 7'931 79.30 52,5%
2 Labour costs construction (4,5 man-days) 7'175 71.70 47,5%
15'106 151.00 100%
Single pit with off-set pan
* does not include costs for superstructure
1US$ = 100 NPRs
1US$ = KSH 95
Single pit with pour-flush toilet* (Surkhet District, Nepal)
Nr. Item Costs NPRs US$ %
1 Material Costs 7'931.00 79.30 52,5%
2 Labour costs construction (4,5 man-days) 7'175.00 71.70 47,5%
TOTAL 15'106.00 151.00 100%
Single pit with off-set pre-cast pan (pour flush)
* Does not include costs for superstructure 1US$ = 100 NPRs

Assessing the Costs of on-Site Sanitation Facilities
16/27
operational costs of the Sanergy toilet are significantly higher, due to the daily emptying by a service
team.
The two examples from Nepal show that labour costs are slightly higher than in the African examples,
even though Nepal is a landlocked country with relatively high cement prices. The single pit toilet built
in Nala, Nepal is more than 2.5 times cheaper than the toilet example from Kampala priced at USD
783, although it has to be noted that the design in Nala did not have a pit lining.
Fig 4-5: Sanergy prefabrication workshop in
Mukuru, Nairobi (left)
Pre-fab urine-diverting squatting pan ready for
installation (right)
4.2.3. Substructure vs. superstructure costs
Depending on the physical environment and architectural concept, the cost of a sanitary installation
may differ significantly. If the latter is built inside a new or existing house (which is possible e.g. with a
pour-flush or urine-diverting user interface technology), the superstructure cost can be reduced (less
materials required compared to a separate outhouse building, possibly economies of scale).
However, if a shelter (superstructure) has to be constructed (especially with brick or block design), this
can add a substantial amount to the total cost. In urban and peri-urban Haiti, for instance, 251 home
toilets and 31 shared toilets were installed (urine diverting dry toilets). The production cost of the in-
house solution was US$ 50, whereas for the shared toilets it was situated in the range of USD 175 to
400 (Graf et al. 2014).
5. Conclusions and Recommendations
The results from this study reconfirm that the costs for on-site sanitation hardware are too high for the
urban poor, without even considering if these technologies are appropriate for the context from an
environmental health perspective. Adequate and durable on-site sanitation hardware and services can
only be rendered economically accessible for the urban poor through innovative building methods (e.g.
prefabrication) and/or financing mechanisms (e.g. microfinance and subsidies), especially in sub-
Saharan Africa, where the cost of quality materials and labour remain unaffordable for the urban poor.
The following sections explain why this challenge is more significant in sub-Saharan African countries
(5.1) and discuss possible ways to reduce infrastructure costs (5.2). In addition to interventions on the
technology side, some promising approaches for managing the high cost and developing an enabling
market environment are also described (5.3).
5.1. Reasons for high construction costs
Four main factors contribute to the high cost of sanitation facilities which presents a tremendous
burden in particular for residents in Africa´s informal settlements.

Assessing the Costs of on-Site Sanitation Facilities
17/27
The first are high material input costs, especially cement and burnt or concrete bricks. In most
countries bricks, wood and cement are becoming more and more expensive but often they are the
only materials readily available. The use of these materials accounts for more than 50-60% of the
overall capital expenditure for typical dry toilet installations (see section 4.2.2 for details). Data from a
project in Mauritania revealed that six material components (cement, sand, aggregate, steel bars,
bricks and the toilet door) accounted for 76-87% of the total capital cost of an on-site toilet facility
(different designs of UDDT or double VIP), and only three of those materials (cement, bricks and steel
bars) were responsible for 62-76% of the total cost (Ulrich et al., 2015). Both material and labour costs
are higher in sub-Saharan Africa than in South Asia, even when compared to the relative high
construction costs in land-locked Nepal. In all study cases, labour costs were comparatively low.
Therefore, efforts to lower on-site facility costs must first and foremost focus on material costs, not
labour inputs. Low labour costs favour in situ manufacturing. Combining the latter with pre-fabrication
(see 5.2.1) seems to be a possible approach to reduce the costs as it reduces transportation costs
and (more importantly) imported material expenses for which import taxes are exorbitantly high.
The second factor is site-related. Lack of access in unplanned neighbourhoods makes the delivery of
materials cumbersome – often materials have to be carried to the construction site by hand, thus
increasing the cost and loss of materials as many bricks break or are stolen. Difficult access in these
neighbourhoods can thus inflate the transport costs, in some cases up to 7% of overall capital
expenditure costs (Lüthi et al, 2013).
The third factor are the lacking economies of scale found in most African informal settlement areas.
As in rural and peri-urban areas, on-site sanitation is built and provided by local masons which often
lack the training to provide value and quality. Prefabricated and mass-produced toilet components are
widely unavailable. This results in low productivity labour inputs and material-intensive constructions
that often take more than a week to build.
The fourth factor affecting urban and peri-urban areas of sub-Saharan Africa is information
asymmetry with regards to cost of toilet construction and contact to service providers. In many cases,
clients are unaware of the cost of constructing a toilet and whom he/she can approach to build one at
a known price – this emphasizes the informality of the sanitation sector in developing countries. The
information asymmetry results in masons/contractors charging a premium price (up to two or three
fold) to build toilets, in spite of delivering sub-standard quality of construction. Data from a field survey
conducted in Kampala in 2010 also confirms this: almost 70% of the interviewees did not know the
market price of about Ugandan Shillings (UGX) 1,500,000, or US$ 681, which prevailed in 2010 for a
VIP latrine in Kampala (depending on water table depth and soil conditions). Specifically, 28% of the
interviewed households (mostly tenants) stated right away that they did not know about the price
for a ventilated improve pit (VIP) latrine and only 32% estimated the price to be between UGX
1,000,000 and UGX 2,000,000 (Horst, 2015).
5.2. Possibilities to reduce the sanitation hardware costs
The growing challenge in urban on-site sanitation is to offer a technology that responds to a variety of
sustainability, functionality and quality criteria, and this for an affordable price. Based on the above
analysis, there are three main pathways for trying to reduce capital expenditure costs of on-site
sanitation facilities: (i) design optimization, (ii) prefabrication and mass production, and (iii) alternative
building materials.

Assessing the Costs of on-Site Sanitation Facilities
18/27
5.2.1. Design optimization
Morgan (1990) lists several possibilities on how to reduce the cost of on-site sanitation infrastructure
using the example of the Blair Latrine3:
Reducing the pit size reduces the amount of materials needed but has the disadvantage of
reducing the life time of the pit.
Reduce the toilet dimensions to save on materials.
Building an outhouse latrine adjacent to the residential house means that only three walls need to
be built.
The promotion of toilet solutions that can be fully integrated in residential buildings (which is possible
for pour-flush as well as urine-diverting systems) and do not require a separate building (outhouse)
would not only reduce the cost further, but also increase the comfort for the users.
Two interesting but not very widespread design approaches that contribute to the cost reduction of pit-
based systems have been presented by Franceys et al. already in 1992: the corbelled brickwork pit
lining and the unreinforced concrete slab (see Fig. 5-1 and 5-2 for more information).
Fig. 5-1: Corbelling the top of the pit lining reduces the
span of the slab and, thus, decreases the amount of
material required (Franceys et al., 1992)
Fig. 5-2: Small dry toilet slabs do not require
reinforced concrete if they are cast in the form of a flat
arch or shallow circular dome. This can save the cost
of expensive steel reinforcement.
5.2.2. Prefabrication and mass production
Prefabrication of components can also be a promising option for cost reduction as it can offer
economies of scale. Moreover, prefabrication can be a way to control the material quality and reduce
wastage. Examples can include cement rings for lining the pits as described above in the Bangladesh
case study (see 4.2.1), cement slabs for the outer walls of the superstructure or prefab squat pans or
toilet seats out of cement or plastic. Many user interface solutions are now mass produced by plastic
or ceramic companies which offer a large variety of solutions for conventional dry toilets as well as
pour-flush and source separating toilets.
In sub-Saharan Africa, prefabricated toilet components have not yet reached the market as it is the
case for the South-Asian context. The replication of successful approaches like the promotion of
prefabricated concrete rings or innovative mass-produced user interface products like the SaTo pan
from Bangladesh (see Figure 5-3) could be a highly promising pathway for African countries.
3 The Blair Latrine is a ventilated pit latrine that was introduced in 1975 in Zimbabwe.

Assessing the Costs of on-Site Sanitation Facilities
19/27
Figure 5-3: Various mass produced plastic squat pans. The blue squat slab in the middle is produced in Kampala
and costs USD 12. The model on the right is the SaTo pan designed by iDE and American Standard for Bangladesh. It is a very low flush design and costs USD 1.5.
5.2.3. Using alternative construction materials
As seen in chapter 4.2.2, material inputs represent the predominant cost factor of on-site sanitation
facilities. Alternative low-cost construction materials are a great option for reducing the cost of
outhouse superstructures. In arid areas the use of compressed soil blocks may be considered as a
viable and ecological alternative to cement blocks or burnt bricks at less than half the cost (see Fig. 5-
1). Best results are achieved when using a hydraulic or mechanical compression machine for brick
production. Attention must be paid on the influence of alternative materials on robustness and
operational and maintenance expenditures.
Figure 5-4: Soil cement blocks used in Dar es Salaam, Tanzania. © Centre for Community Initiatives.
Morgan (1990) lists further possibilities on how alternative materials can be used:
Reduce the amount of cement or replace it by traditional mortar. However, as this is at the
expense of structural safety, special attention needs to be paid to avoid failure.
Using sun dried bricks instead of cement or fired bricks. Care needs to be taken that the sun dried
bricks do not erode too quickly. Soil from ant mounds has proven to guarantee a long lifetime.
Use cheap and locally available materials for the superstructure (thatched reeds, bamboo, etc.).

Assessing the Costs of on-Site Sanitation Facilities
20/27
In general, the use of locally available materials should be encouraged whenever possible to replace
materials that need to be purchased, transported or even imported; the materials necessary should be
minimized to obtain the most economical solution; and opportunities for replacing “high-tech” materials
by traditional materials should be sought, especially in low-income peri-urban areas (SSWARS, 2007).
5.3. Possibilities to facilitate access to sanitation infrastructure and services
5.3.1. Promoting market innovations for on-site solutions
Recently, a number of market-based innovations have been introduced by development organizations
and social enterprises. Two solutions are worth mentioning:
i. In-house mobile toilets - they are compact, waterless and portable toilet units that can be used
in homes. They offer the privacy, convenience and safety of ‘modern toilets’, without the
investment into fixed infrastructures (i.e. septic tanks or sewers). See Annex A1 for details.
ii. Fixed branded sanitation solutions such as “Sanergy” in Nairobi. These solutions offer
container-based collection systems that separate urine and faeces. See Annex A2 for details.
5.3.2. Providing adequate financing mechanisms
Both public (e.g. subsidies) and private funding sources and mechanisms can help making sanitation
accessible for the poor. Whilst it will always be in part the responsibility of municipal governments to
provide basic urban and public health services, there are promising innovative financing mechanisms
that can enable households to gain access to a toilet. This section showcases different sanitation
microfinancing approaches.
Microfinance is the provision of financial services to the poor, generally dealing with relatively small
sums of money. An aspect of microfinance is microcredit, through which people who would not
ordinarily be able to gain access to loans at relatively reasonable interest rates. In many cases a
latrine costs well over the monthly or even annual income of a household. By splitting the expenditure
into smaller payments over time, people can access new products and infrastructure.
Several organizations have begun expanding microfinance to the sanitation realm. Household on-site
sanitation differs from typical microfinance products in that it is not (directly) income generating. Steps
are being taken to make microfinance accessible to both producers and potential consumers of
sanitation products and services.
Water.org has expanded their WaterCredit model to include sanitation products — their partners now
offer loans for financing pit latrines, toilets with septic tanks, and household toilet connections, in
addition to rainwater harvesting, water purifiers and boreholes with tanks. This approach involves
working with microfinance providers to develop loan packages for water and sanitation products and
helping them partner with WASH NGOs, who are able to better educate potential clients about the
benefits of safe water and improved sanitation.
Using a different approach, iDE / Hydrologic has worked to build up a network of sales agents in
Cambodia, which promote water and sanitation products at sales meetings in villages. Interested
buyers are able to fill out their loan applications directly at these meetings. If approved, the loan
amount is disbursed to the latrine business, once the components have been delivered. The
customers need to pay separately for the installation and any superstructure. Employees of the local
microfinance institution (MFI) then come by to collect the loan repayments. In Cambodia all loans must
be approved by a governmental agency, which can slow down the process, but may have contributed
to their high repayment rates.
Microcredit for sanitation can take various forms including individual or group loans. The Water and
Sanitation program of the World Bank has worked with various implementers to assess how loan

Assessing the Costs of on-Site Sanitation Facilities
21/27
design can affect demand for credit and the population segments that are willing to go into debt for
sanitation access. People are unwilling to go to much effort (i.e. travel far) in order to make payments.
BRAC takes a multifaceted approach to their sanitation products and financing based on the income
level of the customer. While the ultra-poor are offered subsidized latrines with bamboo
superstructures, the poor are offered a microcredit option for a latrine with a metal superstructure,
which spreads the payments across a year (see section 4.2.1 for details).
Some microfinance organizations find that while sanitation and water loans are not the most profitable
parts of their portfolio, they can serve as a way to recruit new customers or generate return business
from current ones. One approach to increasing the attractiveness of sanitation loans to the MFI is to
bundle them with other water, hygiene, or popular loan products. Depending on the context, accepting
mobile payments can be a way to reduce the transaction costs of collecting payments, albeit at a price
of having less contact with the customer.
Multiple organizations work with Kiva.org, an online microlending platform, to raise capital for the loans
for both private sanitation and sanitation business. Entrepreneurs who invested in products such as
the Fresh Life Toilets had the option of paying their franchise fee outright or taking a loan (see more in
Appendix A2). Table 5-1 examines some of the different applications for microcredit for sanitation.
Table 5-1: Adaptation of microfinance to the sanitation sector
Traditional
microcredit Sanitation Microfinance
Entrepreneurs Households Landlords Entrepreneurs
Duration Up to two years Generally a year Less than a year Less than a year
Type Group or
Individual
Group loans Individual Individual
Amount Up to $1000 $30-100 Up to $500 Up to $1000
Motivation Start or expand
business
Social status, health Increase rents,
conform to
regulations
Start business,
enhance customer
experience
Benefit for
MFI
Business as
usual
Recruit new customers
for other products
Creditworthy customers
5.3.3 Reducing information asymmetry in sanitation services
Local governments should be encouraged to actively engage in framework agreements with sanitation
masons and contractors to build toilets for urban dwellers at a set price over a period of time, and
following standard designs and procedures. By entering into such framework agreements, the masons
and contractors could benefit from
o a higher volume of business as the local government would market their services as
authorised or certified agencies to provide standardised toilets,
o local tax exemptions, and lastly
o legitimisation (or formalisation) of the services rendered by them.
Additionally, such framework agreements can also be used to promote up-coming market innovations
and financing mechanisms for on-site sanitation technologies within urban settlements.

Assessing the Costs of on-Site Sanitation Facilities
22/27
6. Outlook
This study has investigated why on-site sanitation facilities are so much more expensive in Sub-
Saharan Africa than in Asia. The main findings show that in order to bring down costs to affordable
levels, future efforts need to target the high material costs (ranging from 55% to 86% of capital
expenditures in the examples documented) – usually in the form of cement-based products.
To reduce costs for urban sanitation coverage in Sub-Saharan Africa the following actions show the
most promise:
(i) Mass production of latrines or latrine components by companies with a track record in
reaching base-of-the-pyramid customers. Most countries have plastic or cement industries
that are already producing competitive products, but their market penetration is currently
too small (e.g. plastic squatting pans). Programme support by national governments and
the donor community would be needed to promote these market-based solutions for pre-
fabricated products and create strong demand. The successful case of rural and peri-
urban Bangladesh could hereby serve as an example.
(ii) Further research into low-cost building materials – especially for the expensive
superstructures. Finding alternatives for high-cost cement products is not really new, but
there have been interesting innovations in using waste products in recent years, e.g.
densified waste materials, i.e. products based on the principle of compressed refuse such
as cardboard or reconfigured waste or other materials using agricultural or packaging
waste (e.g. Rematerial). Using compressed soil-cement blocks can also lead to
substantial cost savings by reducing the amount of cement needed.
(iii) Formalisation of the services rendered by small-scale builders by encouraging local
governments to actively engage in framework agreements with sanitation masons and
contractors to build toilets for urban dwellers at a set price over a period of time and
following standard toilet designs and procedures.
7. Acknowledgements
We would like to acknowledge financial support received from SDC’s Global Water Initiatives Division.
We would like to thank the following individuals for their contributions and comments: Roman Grüter,
Isabel Günther, Alexandra Horst, Ingeborg Krukkert, Henry Ssuna, Charles Niwagaba, Rajendra
Shrestha, Mingma Sherpa and Elizabeth Tilley.
8. References
BRAC and IRC (2015). Rapid Assessment of Sanitation Demand and Supply in Rural Bangladesh
Recommendations for strengthening the supply chain for rural sanitation, Briefing Note IRC: The
Hague and BRAC, Dhaka.
Fonseca, C., Franceys, R., Batchelor, C., McIntyre, P., Klutse, A., Komives, K., Moriarty, P., Naafs,
A., Nyarko, K., Pezon, C., Potter, A., Reddy, R. and Snehalatha, M. (2011). Life-cycle costs
approach: Costing sustainable services. WASHCost Briefing Note 1a. IRC International Water and
Sanitation Centre.
Franceys, R., Pickford, J., & Reed, B. (1992). A Guide to the Development of on-Site Sanitation.
Geneva, CH: World Health Organisation.

Assessing the Costs of on-Site Sanitation Facilities
23/27
Graf, J., Kayser, O. and Brossard, S. (2014). Designing the next generation of sanitation businesses.
A report by Hystra for the Toilet Board Coalition, Hystra Consulting, Paris.
Günther, I., Horst, A., Lüthi, C., Mosler, H.-J., Niwagaba, C.B. and, Tumwebaze K.I. (2011). Where do
Kampala’s poor “go”? An overview of urban sanitation conditions in Kampala’s informal settlement
areas. Research Evidence for Policy. Bern, Switzerland: NCCR North-South.
Heierli, U., Münger, F. and Walther, P. (Eds.) (2004). Sanitation is a business: Approaches for
demand-oriented policies. SDC, WSP and WSSCC.
Horst, A. (2015). Economics of Slum Sanitation. Dissertation No. 22773. PhD Thesis ETH Zürich,
Switzerland,
Lüthi, C. et al (2013) Ventilated Improved Latrine construction in the slum areas of Kampala, Uganda.
Technical Factsheet, SPLASH – U-ACT.
Morgan, P. (1990). Low cost Blair Latrines – A study of recent developments in Zimbabwe.
O’Keefe, M., Lüthi, C., Kamara, I. and Tobias, R. (2015). Opportunities and limits to market-driven
sanitation services: evidence from urban informal settlements in East Africa. Environment &
Urbanization, 27(2).
Sijbesma, C. (2008). Sanitation and hygiene in South Asia: Progress and challenges. In: Beyond
Construction – Use By All. London, UK and Delft, The Netherlands: WaterAid and IRC International
Water and Sanitation Centre.
SSWARS (2007). Sustainable Toilet Options Catalogue. pp. 40. Published under the ‘Product
development for social marketing of sanitation and waste’ in Kampala, Uganda.
Tilley, E., Ulrich, L., Lüthi, C., Reymond, Ph. and Zurbrügg, C. (2014). Compendium of Sanitation
Systems and Technologies. 2nd
Revised Edition. Swiss Federal Institute of Aquatic Science and
Technology (Eawag). Dübendorf, Switzerland.
Ulrich, L., Diagana, I. and Lüthi, C. (2015). Systèmes d’assainissement pour les quartiers précaires
de Nouakchott. Une composante du Projet Communautaire pour l’Accès à l’Eau (PCAE), 2012-
2014. Synthèse et recommandations. Swiss Federal Institute of Aquatic Science and Technology
(Eawag). Dübendorf, Switzerland.
Assessing the Costs of on-Site Sanitation Facilities
24/27
Annex: Market Innovations for On-Site Sanitation
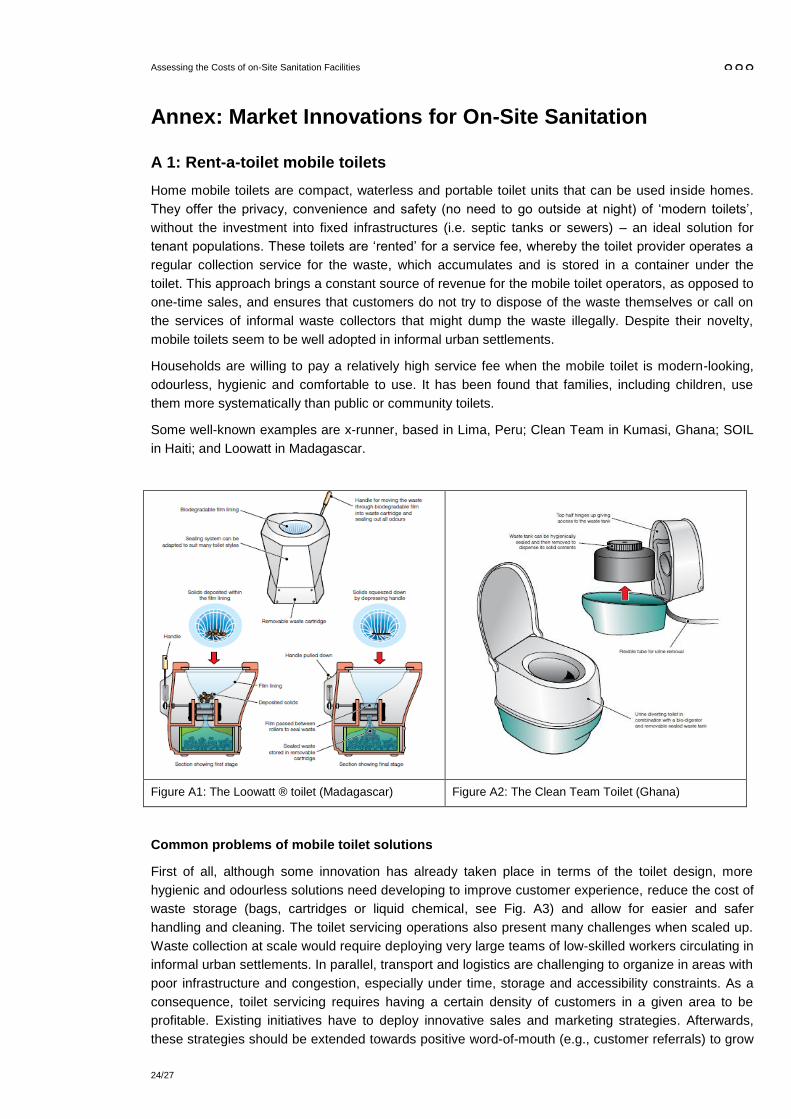
A 1: Rent-a-toilet mobile toilets
Home mobile toilets are compact, waterless and portable toilet units that can be used inside homes.
They offer the privacy, convenience and safety (no need to go outside at night) of ‘modern toilets’,
without the investment into fixed infrastructures (i.e. septic tanks or sewers) – an ideal solution for
tenant populations. These toilets are ‘rented’ for a service fee, whereby the toilet provider operates a
regular collection service for the waste, which accumulates and is stored in a container under the
toilet. This approach brings a constant source of revenue for the mobile toilet operators, as opposed to
one-time sales, and ensures that customers do not try to dispose of the waste themselves or call on
the services of informal waste collectors that might dump the waste illegally. Despite their novelty,
mobile toilets seem to be well adopted in informal urban settlements.
Households are willing to pay a relatively high service fee when the mobile toilet is modern-looking,
odourless, hygienic and comfortable to use. It has been found that families, including children, use
them more systematically than public or community toilets.
Some well-known examples are x-runner, based in Lima, Peru; Clean Team in Kumasi, Ghana; SOIL
in Haiti; and Loowatt in Madagascar.
Figure A1: The Loowatt ® toilet (Madagascar) Figure A2: The Clean Team Toilet (Ghana)
Common problems of mobile toilet solutions
First of all, although some innovation has already taken place in terms of the toilet design, more
hygienic and odourless solutions need developing to improve customer experience, reduce the cost of
waste storage (bags, cartridges or liquid chemical, see Fig. A3) and allow for easier and safer
handling and cleaning. The toilet servicing operations also present many challenges when scaled up.
Waste collection at scale would require deploying very large teams of low-skilled workers circulating in
informal urban settlements. In parallel, transport and logistics are challenging to organize in areas with
poor infrastructure and congestion, especially under time, storage and accessibility constraints. As a
consequence, toilet servicing requires having a certain density of customers in a given area to be
profitable. Existing initiatives have to deploy innovative sales and marketing strategies. Afterwards,
these strategies should be extended towards positive word-of-mouth (e.g., customer referrals) to grow

Assessing the Costs of on-Site Sanitation Facilities
25/27
their customer base. Besides, renting home mobile toilets versus selling them implies operating
frequent payment collection, which needs to be performed regularly by a dedicated team. Finally,
home mobile toilet providers often have to develop their own treatment systems, since existing
treatment facilities are usually inadequate. These systems typically utilize composting or solar heating
to inactivate pathogens and produce marketable products; however, these treatment systems need to
be responsive to the amount of waste that is collected.
Figure A3: Existing containers used by various mobile toilet solutions
Our own research and collaborations with sanitation providers revealed that these solutions, although
promising, do not yet generate sufficient revenue to pay for the waste processing costs, let alone
cross-subsidize collection operations, as was the hope of many initial business model designs. In
addition, many of these by-products face important challenges to commercialization, ranging from lack
of local markets, to regulatory hurdles (e.g. the use of human-based fertilizer for agricultural purpose is
forbidden in many countries) and logistics issues (e.g. transport for urine or biogas). Finally, most of
these technologies are still in the early stages of development. Clean Team Ghana has installed 510
toilets, serving 3000 inhabitants, x-runner’s service is reaching around 2000 people, and SOIL has
around 700 toilets and operations in two cities.
Figure A4: Mobile toilet value chain (example x-runner, Peru)

Assessing the Costs of on-Site Sanitation Facilities
26/27
Affordability for end users: Each organization operates in a different socio-economic context and
users pay between five and twelve US dollars a month for weekly collection, which can represent
three to ten percent of a household’s income.
A 2: Fresh Life Toilets (Sanergy, Nairobi)
Sanergy is a social enterprise company and non-profit organisation based in Kenya that offers a
branded integrated sanitation solution for informal settlements called Fresh Life. The franchise
package includes the toilet, training, cleaning material and one year of waste collection for 600 USD to
entrepreneurs that want to start a Fresh Life Business. The entrepreneur pays for the toilet through a
cash payment or a microfinance loan. The entrepreneur is then linked to the Sanergy waste collection
and operational support teams. Sanergy provides marketing support and the quality of the toilets is
monitored by a field support officer. The business owner can decide her/himself how much the usage
fee is, but Sanergy suggests 5 KShs per use. Assuming 50 users per day, this calculates to 2.50 USD
per day. The maintenance costs of the Fresh Life toilets is about to 0.3 USD per day. A total income of
800 USD/year for such a toilet is guaranteed. It is assumed that the business is run by a single
person/family. After the initial year of collection service, the franchisee pays a renewal fee of 100
USD/year to continue having collection and marketing support.
Figure A5: Fresh Life toilets in Mukuru, Nairobi. Prices advertised: kids: 2 KShs, adults: 3 KShs
Emptying and Transportation
Emptying and transportation is independent from the Fresh Life Operator’s business and remains in
Sanergy’s responsibility. Their collection team passes by daily to exchange used cartridges for empty
ones.
Technical Aspects of Fresh Life
o User Interface
Urine diversion dry toilets without an extra urinal. The urine and faeces are collected separately and
converted into organic fertilizer.
Assessing the Costs of on-Site Sanitation Facilities
27/27
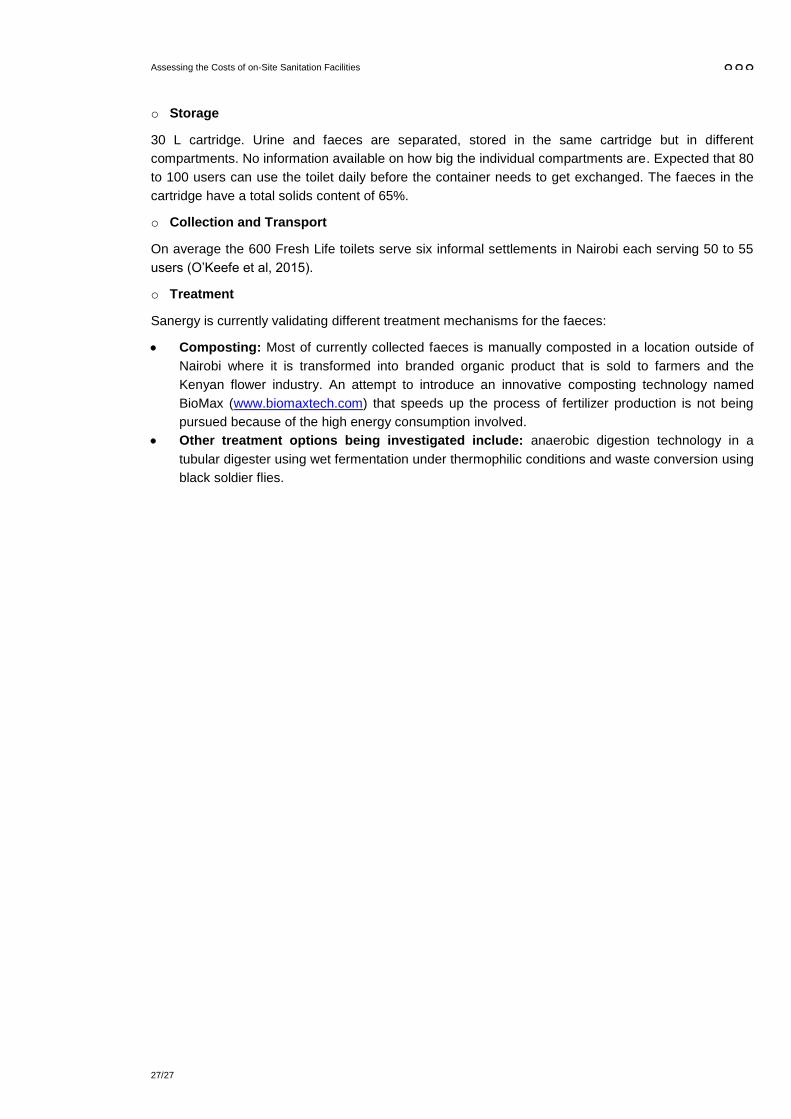
o Storage
30 L cartridge. Urine and faeces are separated, stored in the same cartridge but in different
compartments. No information available on how big the individual compartments are. Expected that 80
to 100 users can use the toilet daily before the container needs to get exchanged. The faeces in the
cartridge have a total solids content of 65%.
o Collection and Transport
On average the 600 Fresh Life toilets serve six informal settlements in Nairobi each serving 50 to 55
users (O’Keefe et al, 2015).
o Treatment
Sanergy is currently validating different treatment mechanisms for the faeces:
Composting: Most of currently collected faeces is manually composted in a location outside of
Nairobi where it is transformed into branded organic product that is sold to farmers and the
Kenyan flower industry. An attempt to introduce an innovative composting technology named
BioMax (www.biomaxtech.com) that speeds up the process of fertilizer production is not being
pursued because of the high energy consumption involved.
Other treatment options being investigated include: anaerobic digestion technology in a
tubular digester using wet fermentation under thermophilic conditions and waste conversion using
black soldier flies.