Session 5.6 The role of informal social networks in agroforestry adoption and management

TREES ON THE FARM
Assessing the Adoption Potential ofAgroforestry Practices in Africa
00Prelims 16/2/02 11:50 am Page i

00Prelims 16/2/02 11:50 am Page ii

TREES ON THE FARMAssessing the Adoption Potential of
Agroforestry Practices in Africa
Edited by
S. FRANZEL
International Centre for Research in Agroforestry (ICRAF),Nairobi, Kenya
S.J. SCHERR
Agricultural and Resource Economics Department, Universityof Maryland, College Park, USA
CABI Publishingin association with the
International Centre for Research in Agroforestry
00Prelims 16/2/02 11:50 am Page iii

CABI Publishing is a division of CAB InternationalCABI Publishing CABI PublishingCAB International 10 E 40th StreetWallingford Suite 3203Oxon OX10 8DE New York, NY 10016UK USA
Tel: +44 (0)1491 832111 Tel: +1 212 481 7018Fax: +44 (0)1491 833508 Fax: +1 212 686 7993Email: [email protected] Email: [email protected] site: www.cabi-publishing.org
© CAB International 2002. All rights reserved. No part of this publication may bereproduced in any form or by any means, electronically, mechanically, by photocopying,recording or otherwise, without the prior permission of the copyright owners.
Published in association with ICRAF, PO Box 30677, Nairobi, Kenya.
A catalogue record for this book is available from the British Library, London, UK.
Library of Congress Cataloging-in-Publication DataTrees on the farm : assessing the adoption potential of agroforestry practices in Africa /edited by S. Franzel and S.J. Scherr.
p. cm.Includes bibliographical references (p. ).ISBN 0-85199-561-6 (alk. paper)1. Agroforestry systems--Africa. 2. Agroforestry--Technology transfer--Africa. I.
Franzel, Steven Charles. II. Scherr, Sara J.
S494.5.A45 T74 2002634.9�9�096--dc21
2001043834ISBN 0 85199 561 6
Typeset in Adobe Garamond by Columns Design Ltd, ReadingPrinted and bound in the UK by Biddles Ltd, Guildford and King’s Lynn
00Prelims 16/2/02 11:50 am Page iv

Contributors vii
Foreword ixP.A. Sanchez
Acknowledgements x
1. Introduction 1S. Franzel and S.J. Scherr
2. Methods for Assessing Agroforestry Adoption Potential 11S. Franzel, S.J. Scherr, R. Coe, P.J.M. Cooper and F. Place
3. Assessing the Adoption Potential of Improved Fallows inEastern Zambia 37S. Franzel, D. Phiri and F. Kwesiga
4. The Adoption Potential of Short Rotation Improved Tree Fallows:Evidence from Western Kenya 65R.A. Swinkels, S. Franzel, K.D. Shepherd, E. Ohlsson and J.K. Ndufa
5. Assessing the Adoption Potential of Hedgerow Intercropping forImproving Soil Fertility, Western Kenya 89R.A. Swinkels, K.D. Shepherd, S. Franzel, J.K. Ndufa, E. Ohlssonand H. Sjogren
6. Farmer-designed Agroforestry Trials: Farmers’ Experiences in WesternKenya 111S. Franzel, J.K. Ndufa, O.C. Obonyo, T.E. Bekele and R. Coe
7. Calliandra calothyrsus: Assessing the Early Stages of Adoption of aFodder Shrub in the Highlands of Central Kenya 125S. Franzel, H.K. Arimi and F.M. Murithi
8. Promoting New Agroforestry Technologies: Policy Lessons fromOn-farm Research 145S.J. Scherr and S. Franzel
Contents
v
00Prelims 16/2/02 11:50 am Page v

9. Assessing Adoption Potential: Lessons Learned and Future Directions 169S. Franzel and S.J. Scherr
Glossary 185
Index 189
vi Contents
00Prelims 16/2/02 11:50 am Page vi

H.K. Arimi, National Agricultural Research Centre, Muguga, PO Box 30148,Nairobi, Kenya
T.E. Bekele, Institute of Biodiversity, Conservation and Research, PO Box 2003,Addis Ababa, Ethiopia
R. Coe, International Centre for Research in Agroforestry (ICRAF), PO Box30677, Gigiri, Nairobi, Kenya
P.J.M. Cooper, International Development Research Centre, PO Box 8500,Ottawa, Ontario, Canada K1G 3H9
S. Franzel, International Centre for Research in Agroforestry (ICRAF), PO Box30677, Gigiri, Nairobi, Kenya
F. Kwesiga, SADC-ICRAF Regional Agroforestry Programme, PO Box MP 128,Mount Pleasant, Harare, Zimbabwe
F.M. Murithi, Kenya Agricultural Research Institute, PO Box 58137, Nairobi, Kenya
J.K. Ndufa, Kenya Forestry Research Institute (KEFRI), Maseno AgroforestryResearch Centre, PO Box 25199, Kisumu, Kenya
C.O. Obonyo, Kenya Forestry Research Institute (KEFRI), Maseno AgroforestryResearch Centre, PO Box 25199, Kisumu, Kenya
E. Ohlsson, Sida/SAREC, SE-105 25 Stockholm, Sweden
D. Phiri, World Vision Integrated Agroforestry Project, PO Box 510948, Nairobi,Kenya
F. Place, International Centre for Research in Agroforestry (ICRAF), PO Box30677, Gigiri, Nairobi, Kenya
S.J. Scherr, Agricultural and Resource Economics Department, University ofMaryland, College Park, MD 20742, USA
Contributors
vii
00Prelims 16/2/02 11:50 am Page vii

K.D. Shepherd, International Centre for Research in Agroforestry (ICRAF), POBox 30677, Gigiri, Nairobi, Kenya
H. Sjogren, Swedish University of Agricultural Sciences, Uppsala, Sweden
R.A. Swinkels, The World Bank, 8th Floor, 63 Ly Thai To Street, Hanoi 20, Vietnam
viii Contributors
00Prelims 16/2/02 11:50 am Page viii

This is a book that pushes forwards the emerging science of agroforestry. There areseveral syntheses on the biophysical aspects of agroforestry but little is available onthe socioeconomics of agroforestry and its adoption by farmers, following rigorousscientific methods. This book fills such a gap by assessing the adoption potential ofselected agroforestry practices, describing the appropriate methodologies and draw-ing lessons for improving the effectiveness of the research–development continuum.Five case studies are described and analysed in this book. Four of them are success-ful and one – hedgerow intercropping – was promoted before a rigorous biophysicalassessment was made.
This book demonstrates how farmers in selected areas have tested and adaptedthese practices, incorporated them into their farming systems and improved theirwelfare and incomes. It also provides examples of scaling up within the areas wheretesting took place: farmer-to-farmer dissemination, partnerships among researchers,extension services, and non-governmental organizations (NGOs) to promote scal-ing up.
The key finding was that agroforestry reduces the risks that farmers face frominput markets by investing small amounts of land and labour, rather than spendingcash on expensive inputs, for improving soil fertility, feeding their livestock, or pro-viding wood for fuel and construction.
There were also important methodological lessons, that add further value tothis book. The authors should be congratulated for advancing the science of agro-forestry.
Pedro A. SanchezDirector General of ICRAF
Nairobi, Kenya
Foreword
ix
00Prelims 16/2/02 11:50 am Page ix

The editors are grateful to the International Centre for Research in Agroforestry forcontributing towards the costs of publishing this book. We also thank the ICRAFstaff in Maseno and Embu, Kenya, and Chipata, Zambia, and our partners at thesesites: the Kenya Agricultural Research Institute, the Kenya Forestry ResearchInstitute, and the Ministry of Agriculture Food, and Fisheries, Zambia. We alsowish to thank the many colleagues in the extension services and non-governmentalorganizations who participated in the work reported in this book. Finally, we thankthe many farmers who participated in the surveys and on-farm trials, especiallythose who shared with us their agroforestry innovations. They are too many tomention, but we would like to thank, in particular, Mr Harrison Chongwe(Chivungwe, Zambia), Ms Zelina Mwanza (Chipata, Zambia) Ms Jennipher Zulu(Kalunga, Zambia), Mr Michael Mwaniki (Ngandori, Kenya), Ms Purity Njagi(Embu, Kenya) and Mr Samuel Nyaga (Kagahari North, Kenya).
We also gratefully acknowledge the International Food Policy ResearchInstitute, Washington, DC, for hosting the senior editor on a 9-month sabbatical towork on this book; thanks to Peter Hazell, Director, Environment and ProductionTechnology Division, IFPRI, for his support.
Chapter 4 of this volume is a revised version of an article appearing inAgricultural Systems, Vol. 55, used with permission from Elsevier Science: Swinkels,R., Franzel, S. Shepherd, K. Ohlsson, E. and Ndufa, J. (1997) The economics ofshort rotation improved fallows: evidence from areas of high population density inwestern Kenya, pp. 99–121.
Chapter 5 draws upon material appearing in an article, Adoption potential ofhedge-row intercropping in the maize-based cropping systems of the highlands ofWestern Kenya, Experimental Agriculture, Vol. 33, 1997, used with permissionfrom Cambridge University Press:
Part 1. Shepherd, K., Ndufa, J.K., Ohlsson, E., Sjogren, H., and Swinkels, R.,1997. Background and agronomic evaluation, pp. 201–210.
Part 2. Swinkels, R. and Franzel, S.. Economic and farmers evaluation, pp.211–223.
We are also grateful to the many colleagues who assisted in the work andreviewed chapters; their names are listed in the acknowledgements at the end ofeach chapter.
Acknowledgements
00Prelims 16/2/02 11:50 am Page x

Background
Agricultural land use and management present major development challengesthroughout sub-Saharan Africa. The area under cultivation has expanded notably,total yields are rising, and there is large-scale conversion from fallow-based croppingsystems to continuous cultivation. None the less, per capita food production hasdeclined by about 2% per year since 1960 (World Bank, 1996), and constraints ongrowth in agricultural sectors, which remain prominent in most African economies,are an important factor explaining a 1% per year decline in per capita incomesbetween 1983 and 1993 (Cleaver and Schreiber, 1994; World Bank, 1994).
Environmental problems associated with agricultural production have alsobecome a major concern. With the marked expansion and intensification of farm-ing, total forested area in Africa declined by 50 million hectares during the 1980s(Dembner, 1991), reducing the availability of wood products for fuel and construc-tion, degrading range resources, and exposing vulnerable soils to degradation. Inmany areas, particularly in the densely populated highlands and in drylands, soildegradation due to inadequate agricultural practices and nutrient depletion threat-ens long-term productive potential (Scherr and Yadav, 1995; Buresh et al., 1997).
Agroforestry is defined as a dynamic, ecologically based, natural resource man-agement system that, through the integration of trees on farms and in the agricul-tural landscape, diversifies and sustains production for increased social, economicand environmental benefits for land users at all levels (Leakey, 1996). Agroforestryhas considerable potential to contribute towards solving some of these problems.Nitrogen-fixing trees, as substitutes or complements for chemical fertilizer, canincrease smallholder incomes, conserve foreign exchange and improve regional foodsecurity. By providing a supply of fuelwood from the farm, agroforestry can helpreduce pressure on forests and communal woodlands. Moreover, agroforestry treescan supply farm households with a wide range of other products, including food,medicine, livestock feed, and timber for home use and sale. Other services that treesprovide, such as boundary markers, windbreaks, soil erosion barriers, beauty andshade, are difficult to quantify but are none the less of substantial importance tofarm families and for natural resource protection.
IntroductionS. FRANZEL1 AND S.J. SCHERR2
1International Centre for Research in Agroforestry, PO Box 30677,Gigiri, Nairobi, Kenya; 2Agricultural and Resource Economics
Department, University of Maryland, College Park, MD 20742, USA
© CAB International 2002. Trees on the Farm (eds S. Franzel and S.J. Scherr) 1
1
Trees on Farms Ch1 16/2/02 11:50 am Page 1

Indeed, indigenous agroforestry practices are already widespread in Africa, as isthe planting and protection of many tree species introduced during the colonialperiod and later through forestry and agroforestry extension projects (Le Houerou,1987; Kerkhof et al., 1990; Warner, 1993). However, most are suited to low-intensityagricultural systems, and function well below their potential productivity as a result ofusing poorly adapted species, provenances and management systems. Over the past 20years, research and extension systems working in Africa have sought to improve theproductivity of existing systems and develop new practices to meet new land-use chal-lenges and opportunities (Scherr and Müller, 1990; Kang, 1993; Cooper et al., 1996).
Assessment of Agroforestry from the Farmers’ Perspective
There is now a substantial body of scientific literature on the biophysical featuresand potentials of agroforestry practices in Africa (Cooper et al., 1996; Sanchez,1996). However, these provide only a first indication of their suitability for wide-spread promotion, and their likely economic, social and environmental contribu-tions. There is, unfortunately, almost no information available quantifying thecontribution of agroforestry to household income, food security and welfare. Thisgap is especially surprising given the widespread use of agroforestry in developmentprojects and extension programmes; as early as 1989, Scherr and Müller (1991)were able to identify 60 development projects promoting agroforestry in Africa.
But most agroforestry research has been conducted at research stations orresearch plots near development project sites; few studies are available on the per-formance of agroforestry practices under farmer-managed conditions. Even fewerquantify the financial returns of the practices1 or examine their advantages and dis-advantages, as perceived by farmers. For example, Swinkels et al. (Chapter 4) reportfinding only two studies on the testing of improved fallows for increasing soil fertil-ity under farmer management, and neither included a financial analysis. They notethat hedgerow intercropping (also called alley cropping or alley farming) forimproving soil fertility is more widely tested, but the few farmer-managed trialsconducted were mostly limited to the humid and subhumid tropics of west Africa.Moreover, assessment of adoption potential has been problematic in manyhedgerow intercropping trials and analyses: targeting was inappropriate as the farm-ers’ perceived priority problem was not low soil fertility; farmers’ participation wasobtained through the provision of material incentives which were likely to bias theirviews and actions; and there was inadequate monitoring of socioeconomic variables(Whittome, 1994).
2 S. Franzel and S.J. Scherr
1 The economics profession distinguishes ‘financial analysis’ from ‘economic analysis’. Theformer takes the perspective of the individual farmer and values inputs and outputs atprices farmers face. By contrast, the latter is defined from the perspective of society as awhole; market prices of inputs and outputs are corrected if these do not reflect their realeconomic values to society (Gittinger, 1982). For example, if the fertilizer price wassubsidized, financial analysis would use the subsidized price and economic analysiswould use the unsubsidized price.
Trees on Farms Ch1 16/2/02 11:50 am Page 2

A literature review by Swinkels and Scherr (1991) found 68 economic studiesof agroforestry systems in Africa, from 17 countries, but most were ex ante analyses,or models based on research station data or assumptions not grounded in farmerexperience, or general economic descriptions of the technology or market condi-tions. Scherr and Müller (1991) found only a few extension projects in Africa evalu-ating the financial impact of agroforestry systems being promoted. This situation isnot unique to Africa; it reflects a global paucity of research on the economics andadoptability of agroforestry practices in developing countries. The only two com-parative studies assessing the economics of agroforestry practices are Current et al.(1995) for Central America and the Caribbean and Sullivan et al. (1992) forselected practices in various parts of the world.
Social and financial analyses of agroforestry practices are important for severalreasons. African governments, non-governmental organizations (NGOs) anddonors need information on the performance of these practices and how they con-tribute to household welfare and to development objectives, in order to assesswhether and how they should continue investing in their development and dissemi-nation. Data are needed on the financial and non-financial benefits of the practices,what works where and why, why some farmers within specific communities adoptand others do not, and who within the family reaps the benefits.
Researchers and development practitioners also need information on howfarmers are using and modifying the practices and what problems they encounter,so they can develop technologies and practices that better meet farmers’ needs andcircumstances. Similarly, policy makers need information on the influence of policyfactors on the adoptability and performance of agroforestry practices. Differentincentives, institutional mechanisms and policies could be implemented to facilitateagroforestry adoption.
Finally, and perhaps of greatest importance, farmers themselves need informa-tion on the performance of agroforestry practices, so they can make more informeddecisions on whether to test and adopt them. Such information is especially impor-tant because many agroforestry practices require considerable resources, skills andtime to bear fruit. In some areas, farmer groups and organizations are emerging tolead adaptive research, and can use this type of information in planning their agro-forestry activities.
Objectives
This volume has two primary objectives. First, it assesses the adoption potential ofseveral new agroforestry practices that researchers, development practitioners andfarmers are currently testing in Africa. The adoption potential of a practice isdefined as its feasibility, profitability and acceptability, as viewed from the farmers’perspective.
Secondly, the volume draws lessons for improving the effectiveness and effi-ciency of the process of developing, modifying and disseminating new agroforestrypractices. These include recommendations to: (i) researchers on technology design
Introduction 3
Trees on Farms Ch1 16/2/02 11:50 am Page 3

and the implementation of on-farm trials; (ii) development organizations concern-ing the establishment of networks for adaptive research and extension; and (iii) pol-icy makers on institutional mechanisms and incentives for promoting agroforestry.Feedback to research and extension is also critical for improving and promotingpractices and for assessing impact, based on farmers’ experiences in managing andusing agroforestry practices. Farmers’ experiences include their assessments, prefer-ences, innovations and their problems, and how they cope with them.
The volume also presents methods that can be used to assess the adoptionpotential of agroforestry practices during the on-farm testing stage and just after,when farmers are deciding whether or not to adopt the practice. An extensive bodyof literature exists about methods for on-farm experimentation (e.g. Stroud, 1993),ex ante financial analysis (e.g. CIMMYT, 1988) and ex post analysis of agriculturaltechnology adoption (e.g. CIMMYT Economics Program, 1993), especially forannual crops technology. But little is available on the assessment of adoption poten-tial during that critical period when farmers are making adoption and design deci-sions. Nor have these methods been widely adapted to the special needs ofagroforestry practices, where management is often more complex and the period offarmer testing is much longer than in conventional cropping systems. Whereas afarmer can harvest and evaluate a new crop variety after a few months, agroforestrypractices often take 3–6 years before benefits are realized. The approach illustratedin this volume is promising for the evaluation of other sustainable agriculture andnatural resource management practices with similarly long gestation periods andcomplex choices about components and management.
The book’s primary audience is development practitioners and researchersworking throughout the Third World who are interested in evaluating the perfor-mance of agroforestry practices. The book will interest persons from a wide range ofdisciplines in the social and biophysical sciences, involved in agricultural technologydevelopment and the promotion of sustainable agricultural systems.
Conceptual Premises
The approach and methods described in the book are based upon four conceptualpremises. First, we assume that a systems approach is required in assessing adoptionpotential. Rural households operate complex farming systems, allocating their lim-ited resources among many enterprises in a manner determined by their priorities,preferences and their biophysical and socioeconomic circumstances (Collinson,1981; Scherr, 1997). This system complexity has several implications for researchersand development practitioners.
To begin with, they must understand the farming system and work closely withfarmers to select and develop appropriate technologies. Since African farming sys-tems are particularly heterogeneous, regarding both biophysical variables (e.g. soils)and socioeconomic variables (e.g. market access), some degree of targeting of newpractices is usually required. At the same time, research has shown that when mov-ing beyond simple interventions, such as varietal improvements, researchers and
4 S. Franzel and S.J. Scherr
Trees on Farms Ch1 16/2/02 11:50 am Page 4

extensionists need to present farmers with a ‘basket of options’ from which they canchoose the practices that are most suitable to them (Chambers et al., 1987).
Indeed, small-scale farmers are rarely able to manage any single enterprise inthe ‘optimal’ manner prescribed by researchers. Rather, they make compromises inthe management of individual enterprises in order to reduce risk, alleviate con-straints and increase the productivity of the whole household livelihood system.Thus, researchers and development practitioners must be willing to test low-cost,simple-to-implement practices that improve on farmers’ existing practices. Somecomplex technologies may have higher potential returns, but pose major risks andare unlikely to be adopted until after other marginal changes have been introducedsuccessfully (Byerlee and Hesse de Polanco, 1986).
African farming systems are also quite dynamic, undergoing significant long-term changes in crop components, commercialization, input use and cropping inten-sity as populations grow and markets expand (Ruthenberg, 1971; Boserup, 1981).Given the relatively long life cycle of many agroforestry systems, improved technolo-gies must be appropriate for farming systems of the future, not just the present.
The second concept is that participatory research approaches are needed toensure that farmers play a leading role in problem diagnosis, testing and evaluationof new practices (Chambers et al., 1987; Okali et al., 1994). New methods in thelate 1980s and 1990s helped researchers and other change agents to play a facilita-tive role in the on-farm research process, helping farmers to carry out their ownappraisals, design their own experiments and conduct their own evaluations. Thisvolume, for example, highlights farmers’ innovations, in experiments they designedand implemented themselves, that were later adopted by farmers on a wide scale.This approach can thus help substantially to streamline and focus the researchprocess, rather than requiring that researchers predict on their own which of hun-dreds of possible tree species and dozens of technologies deserve development anddissemination under different farm conditions and different landscape niches.
The third concept highlighted in this book is that financial analysis and farmerassessment are both needed to complement biophysical assessment of a technology.Whereas financial analysis shows the economic attractiveness of a practice, farmerassessment highlights its advantages and disadvantages as perceived by the farmer,and is especially useful after farmers have had a chance to experiment with the prac-tice. Farmer assessments may highlight the suitability of a product for use by afarmer (e.g. as fuelwood or construction wood), or growth characteristics of a treethat a farmer may like or dislike (e.g. interference with crop production or provi-sion of a boundary marking), or socioeconomic constraints that inhibit the use of apractice, such as unsuitable land tenure or lack of labour during the peak workperiod.
Farmer assessment is especially important in agroforestry, since tree productsoften have multiple uses; new practices frequently involve significant managementchanges for the farmers, and the technology testing period is long. Also, in areaswhere markets are weak and it is difficult to value inputs such as labour and out-puts such as fuelwood, farmer assessment may be more important than financialanalysis for determining the advantage of a practice. Systematic analysis of farmers’
Introduction 5
Trees on Farms Ch1 16/2/02 11:50 am Page 5

assessments of practices are rare; they have been considered by some researchers tobe too ‘soft’ and subjective. However, methods are available from sociology andanthropology for quantifying data on farmers’ preferences, and subjectinghypotheses about those preferences to tests of statistical inference. Examples ofthese methods include hierarchical decision-tree modelling (Chapter 5) and matrixrating (Chapter 6).
The fourth concept is that the interaction of actors made possible through theon-farm research process itself can strengthen the technology development process,and accelerate dissemination of new information, by compressing in time the con-ventional sequential information transfer pattern. Benefits range from learning keylessons about how to communicate ideas about a technology and market it to farm-ers (i.e. simultaneous rather than sequential development of ‘extension messages’);identifying technology design tips for getting around farmer constraints with thetechnology (i.e. compressing the training of extensionists for effectively adaptingthe technology to farmer conditions); and recruiting farmer ‘champions’ of the newtechnology (i.e. getting an early start with farmer-to-farmer diffusion). On-farmresearch provides a defined ‘space’ for interaction among researchers, extensionists,farmers and community groups that would be unlikely to occur otherwise, particu-larly when these belong to different social groups. The communication channelsopened up through on-farm research may make possible continued dialoguebetween groups even after projects are completed.
Overview
This book is composed of three parts. Chapter 2 provides an overview of the methodsused in the studies. It defines the information needed to assess adoption potential,and explains different techniques for collecting and analysing data on those variables,including participatory on-farm trials, financial analysis and farmer assessment.
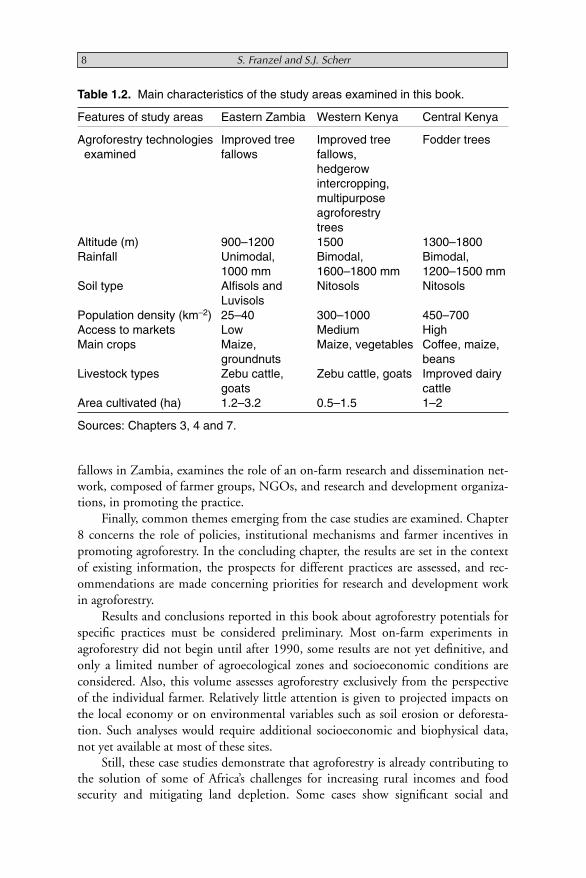
There follow five case studies assessing the adoption potential of specific agro-forestry practices: hedgerow intercropping for improving soil fertility in westernKenya, improved tree fallows for improving soil fertility in eastern Zambia andwestern Kenya, multipurpose agroforestry trees in western Kenya, and fodder treesfor dairy cows in central Kenya (Table 1.1). The studies are from three contrastingzones – a humid highland area in central Kenya located close to major markets, ahumid highland area in western Kenya with poorer soils and farther from markets,and a subhumid plateau area in eastern Zambia far from major markets (Table 1.2).The Kenyan study areas have very high population densities, while the density islow in the Zambia study area.
The five case studies examine the feasibility, profitability and acceptability ofthe practices, based on farmers’ experience in testing them. All cases involveresearcher-designed, farmer-managed trials. Four of the studies also include trialsdesigned by farmers, that is, in which farmers test practices as they wish. Four stud-ies also include some assessment of farmers’ post-trial experiences, that is, farmers’preferences and actions following completion of the trials. One case, for improved
6 S. Franzel and S.J. Scherr
Trees on Farms Ch1 16/2/02 11:50 am Page 6

Introduction 7
Table 1.1. Agroforestry practices examined in this volume.
Practices and tree Main problem Importantspecies addressed by-products Management
Improved fallows Nitrogen Fuelwood Farmers raise seedlings(southern Africa) deficiency (sesbania) in nursery(Sesbania sesban and in soil or direct seed Tephrosia vogelii ) (tephrosia). They plant
in a pure stand or planttrees in a standingmaize crop. After 2 ormore years, trees arecut and leaves incorpo-rated into the soil
Improved fallows Nitrogen Fuelwood Farmers direct seed into(eastern Africa) deficiency a standing maize (Crotalaria spp. and in soil crop. They leave treesTephrosia vogelii ) to grow during the sec-
ond season and cuttrees and incorporateleaves before thebeginning of the thirdseason
Hedgerow intercropping Nitrogen Fuelwood, Trees are planted in(Leucaena deficiency fodder rows, about 30 cm leucocephala in soil, soil apart within rows andand Calliandra erosion 4 m between rows.calothyrsus) Hedges are pruned at
about 1 m and pruningsare incorporated intosoil as green manure
Boundary planting of Fuelwood Boundary Trees are planted onupper-storey trees shortage, markings, boundaries or around(Grevillea robusta and lack of shade, the homesteadCasuarina poles and beautyjunghuhniana) timber for
constructionFodder trees (Calliandra Fodder Fuelwood, Fodder shrubs arecalothyrsus) shortages soil erosion planted in hedges on
in dairy control, boundaries and alongenterprises boundary contours. Beginning in
markings the second year, theyare pruned at about1 m and prunings arefed to livestock
Trees on Farms Ch1 16/2/02 11:50 am Page 7
fallows in Zambia, examines the role of an on-farm research and dissemination net-work, composed of farmer groups, NGOs, and research and development organiza-tions, in promoting the practice.
Finally, common themes emerging from the case studies are examined. Chapter8 concerns the role of policies, institutional mechanisms and farmer incentives inpromoting agroforestry. In the concluding chapter, the results are set in the contextof existing information, the prospects for different practices are assessed, and rec-ommendations are made concerning priorities for research and development workin agroforestry.
Results and conclusions reported in this book about agroforestry potentials forspecific practices must be considered preliminary. Most on-farm experiments inagroforestry did not begin until after 1990, some results are not yet definitive, andonly a limited number of agroecological zones and socioeconomic conditions areconsidered. Also, this volume assesses agroforestry exclusively from the perspectiveof the individual farmer. Relatively little attention is given to projected impacts onthe local economy or on environmental variables such as soil erosion or deforesta-tion. Such analyses would require additional socioeconomic and biophysical data,not yet available at most of these sites.
Still, these case studies demonstrate that agroforestry is already contributing tothe solution of some of Africa’s challenges for increasing rural incomes and foodsecurity and mitigating land depletion. Some cases show significant social and
Table 1.2. Main characteristics of the study areas examined in this book.
Features of study areas Eastern Zambia Western Kenya Central Kenya
Agroforestry technologies Improved tree Improved tree Fodder treesexamined fallows fallows,
hedgerowintercropping,multipurposeagroforestrytrees
Altitude (m) 900–1200 1500 1300–1800Rainfall Unimodal, Bimodal, Bimodal,
1000 mm 1600–1800 mm 1200–1500 mmSoil type Alfisols and Nitosols Nitosols
LuvisolsPopulation density (km−2) 25–40 300–1000 450–700Access to markets Low Medium HighMain crops Maize, Maize, vegetables Coffee, maize,
groundnuts beansLivestock types Zebu cattle, Zebu cattle, goats Improved dairy
goats cattleArea cultivated (ha) 1.2–3.2 0.5–1.5 1–2
Sources: Chapters 3, 4 and 7.
8 S. Franzel and S.J. Scherr
Trees on Farms Ch1 16/2/02 11:50 am Page 8

Introduction 9
financial impacts. Moreover, the studies illustrate a new and dynamic approach togenerate effective and adoptable technologies, which accelerates the technologydevelopment process itself, as well as the process of farmer adoption. The dynamicpartnerships between farmers, researchers and extensionists that are illustrated inthe case studies offer promise for developing and disseminating other sustainableland-management practices.
References
Boserup, E. (1981) Population and Growth. BasilBlackwell, Oxford.
Buresh, R., Sanchez, P.A. and Calhoun, F. (eds)(1997) Replenishing Soil Fertility in Africa.SSSA Special Publication Number 51. SoilScience Society of America and AmericanSociety of Agronomy, Madison, Wisconsin.
Byerlee, D. and Hesse de Polanco, E. (1986)Farmers’ stepwise adoption of technologicalpackages: evidence from the Mexican alti-plano. American Journal of AgriculturalEconomics 68, 519–527.
Chambers, R., Pacey R.A. and Thrupp, L. (1987)Farmer First: Farmer Innovation andAgricultural Research. IntermediateTechnology Publications, London.
CIMMYT (1988) From Agronomic Data toFarmer Recommendations: an EconomicsTraining Manual. CIMMYT, Mexico.
CIMMYT Economics Program (1993) TheAdoption of Agricultural Technology: a Guidefor Survey Design. CIMMYT, Mexico.
Cleaver, K.M. and Schreiber, G.A. (1994)Reversing the Spiral; the Population,Agriculture, and Environment Nexus in Sub-Saharan Africa. World Bank, Washington,DC.
Collinson, M.P. (1981) A low-cost approach tounderstanding small farmers. AgriculturalAdministration 8, 433–450.
Cooper, P.J., Leakey, R.R.B., Rao, M.R. andReynolds, L. (1996) Agroforestry and themitigation of land degradation in thehumid and sub-humid tropics of Africa.Experimental Agriculture 32, 235–290.
Current, D., Lutz, E. and Scherr, S.J. (1995)Costs, Benefits and Farmer Adoption ofAgroforestry: Project Experience in CentralAmerica and the Caribbean. World BankEnvironment Paper No. 14. The WorldBank, Washington, DC.
Dembner, S. (1991) Provisional data from theForest Resources Assessment 1990. Unasylva164(42), 40–44.
Gittinger, J.P. (1982) Economic Analysis ofAgricultural Projects. Johns HopkinsUniversity Press, Baltimore, Maryland.
Kang, B.T. (1993) Alley cropping: past achieve-ments and future directions. AgroforestrySystems 23, 141–155.
Kerkhof, P., Foley, G. and Barnard, G. (1990)Agroforestry in Africa: a Survey of ProjectExperience. Panos, London.
Leakey, R. (1996) Definition of agroforestry revis-ited. Agroforestry Today 8(1), 5–7.
Le Houerou, H.N. (1987) Indigenous shrubs andtrees in the silvopastoral systems of Africa.In: Steppler, H.A. and Nair, P.K.R. (eds)Agroforestry, a Decade of Development.ICRAF, Nairobi.
Okali, C., Sumberg, J. and Farrington, J. (1994)Farmer Participatory Research. Rhetoric andReality. Intermediate TechnologyPublications, London.
Ruthenburg, H. (1971) Farming Systems in theTropics. Clarendon Press, Oxford.
Sanchez, P.A. (1996) Science in agroforestry.Agroforestry Systems 9, 259–274.
Scherr, S.J. (1997) Meeting household needs:farmer tree-growing strategies in westernKenya. In: Arnold, J.E.M. and Dewees, P.(eds) Farms, Trees and Farmers: Responses toAgricultural Intensification. EarthscanPublications, London.
Scherr, S.J. and Müller, E. (1990) Evaluatingagroforestry interventions in extension pro-jects. Agroforestry Systems 11(3), 259–280.
Scherr, S.J. and Müller, E.U. (1991) Technologyimpact evaluation in agroforestry projects.Agroforestry Systems 13, 235–257.
Scherr, S.J. and Yadav, S. (1995) LandDegradation in the Developing World:Implications for Food, Agriculture, and the
Trees on Farms Ch1 16/2/02 11:50 am Page 9

Environment to 2020. Food, Agricultureand the Environment Discussion Paper 14.International Food Policy ResearchInstitute, Washington, DC.
Stroud, A. (1993) Conducting On-FarmExperiments. CIAT, Cali, Colombia.
Sullivan, G.M., Huke, S.M. and Fox, J.M. (eds)(1992) Financial and Economic Analyses ofAgroforestry Systems. Nitrogen Fixing TreeAssociation, Paia, Hawaii, 10–14 July1991. NFTA, Paia, Hawaii.
Swinkels, R.A. and Scherr, S.J. (eds) (1991)Economic Analysis of AgroforestryTechnologies: An Annotated Bibliography.ICRAF, Nairobi.
Warner, K. (1993) Patterns of Farmer Tree-Growing in Eastern Africa: A SocioeconomicAnalysis. Oxford Forestry Institute andInternational Centre for Research inAgroforestry, Oxford.
Whittome, M.P.B. (1994) The adoption of alley-farming in Nigeria and Benin: the on-farmexperience of IITA and ILCA. PhD thesis,Department of Geography, University ofCambridge, Cambridge, UK.
World Bank (1994) Global Economic Prospectsand the Developing Countries. World Bank,Washington, DC.
World Bank (1996) Development Indicators.World Bank, Washington, DC.
10 S. Franzel and S.J. Scherr
Trees on Farms Ch1 16/2/02 11:50 am Page 10

Introduction
This chapter describes methods for assessing the adoption potential of agroforestrypractices through participatory on-farm trials, and their application in the fiveKenya and Zambia case studies. We discuss briefly the evolution of adoption assess-ments through on-farm research. We then define three types of on-farm trials anddiscuss their main features, management and suitability for generating informationon adoption potential. The next section discusses the organization of participatoryon-farm trials; the following section presents specific methods for determining thebiophysical performance, profitability, feasibility/acceptability, boundary conditionsand insights about dissemination of practices tested in on-farm trials. The chapterthen discusses how this on-farm research approach fits into a new farmer-centredmodel of the research–development continuum, and concludes with some thoughtson future priorities.
Background
In conventional approaches to technology generation in the 1960s, assessment ofadoption potential focused almost exclusively on biophysical variables such as a newcrop variety’s potential to increase yield per hectare. Where technologies were fairlysimple and biophysical circumstances fairly homogeneous, as for rice varieties in theirrigated areas of South-East Asia, the approach achieved considerable success. Butin Africa, where farming systems were often more complex, more subsistence-ori-ented and more variable than in the irrigated areas of South-East Asia, the biophysi-
Methods for AssessingAgroforestry Adoption
PotentialS. FRANZEL,1 S.J. SCHERR,2 R. COE,1
P.J.M. COOPER3 AND F. PLACE1
1International Centre for Research in Agroforestry, ICRAF House,PO Box 30677, Gigiri, Nairobi, Kenya; 2Agricultural and Resource
Economics Department, University of Maryland, College Park, MD 20742, USA; 3International Development Research Centre,
PO Box 8500, Ottawa, ON, Canada KIG 3H9
© CAB International 2002. Trees on the Farm (eds S. Franzel and S.J. Scherr) 11
2
Trees on Farms Ch2 16/2/02 11:57 am Page 11

cal approach was found wanting. In the late 1970s and early 1980s, farming sys-tems research emphasized the need to determine adoption potential based on thepriorities and circumstances of farmers (Byerlee and Collinson, 1980). Researchersemphasized the need for testing new practices under farmers’ circumstances butresearch prototypes for on-farm trials still tended to be drawn up by researchers, fol-lowing consultation with farmers (Zandstra et al., 1981). Participatory approachesin the late 1980s and 1990s highlighted empowering farmers to choose the tech-nologies they wanted to test and to design and implement the research themselves(Lightfoot, 1987; Chambers et al., 1989; Haverkort et al., 1991; Rocheleau, 1991;Scherr, 1991a). Little emphasis was given to statistical analysis or to extrapolatingresults to areas beyond the location where the research was conducted.
In the 1980s, there was considerable experimentation with adapting bothresearcher-led and participatory on-farm research methods to agroforestry (Scherr,1991b,c). During the 1990s the International Centre for Research in Agroforestry(ICRAF) and other organizations devoted much effort to the design and testing ofmethods for on-farm research for different types of practices, and with an explicitview to understanding adoption potential. As ICRAF researchers gained experiencein on-farm research and technology development in agroforestry, their approach hasbeen refined. Assessment of adoption potential was observed to be multifaceted,requiring an understanding of biophysical performance under farmers’ conditions,profitability from the farmers’ perspective and its acceptability to farmers (in termsof both their assessment of its value and their willingness and capacity to access theinformation and resources necessary to manage it well). On-farm research shouldmake it possible to define the ‘boundary conditions’ for a particular practice, that is,the biophysical and socioeconomic circumstances under which the practice is likelyto be profitable, feasible and acceptable to farmers, and thus adopted by them.1
Furthermore, it was realized that on-farm research offers researchers, extensionists,policy makers and farmers themselves an opportunity to learn important lessonsabout achieving effective dissemination of agroforestry practices, as well as feedbackon further research priorities (Table 2.1).
The evolving approach outlined in this chapter includes elements of variouson-farm research and adoption assessment approaches. During participatoryappraisals and surveys, researchers and farmers identify farmers’ problems and needsand select practices to test in on-farm trials, some of which may be researcher-designed and some of which may be farmer-designed. These trials, and the analysesthat researchers and farmers conduct together, form the basis for determiningwhether farmers on a wider scale will adopt the practices.
12 S. Franzel et al.
1 The concept ‘boundary conditions’ complements the term ‘recommendation domain’,commonly used in farming systems research. A recommendation domain is a roughlyhomogeneous group of farmers with similar circumstances for whom we can make moreor less the same recommendation (Byerlee and Collinson, 1980). Recommendationdomains are defined in the early stages of the research process and technologies are soughtthat are appropriate for them. Once a technology is found that benefits farmers atparticular sites in a recommendation domain, it is useful to try to assess that technology’sboundary conditions.
Trees on Farms Ch2 16/2/02 11:57 am Page 12

On-farm research has been seen as especially critical in agroforestry technologydevelopment. This is due to the poor understanding of farmers’ agroforestry strate-gies, lack of empirical information about on-farm agroforestry practices, agro-forestry system complexity and variability (in terms of objectives, components,management and ecological interactions), the longer technology cycle and periodrequired for farmer and researcher assessment and the lack of scientifically validatedtechnologies (Scherr, 1991a). Many of these same features characterize other ‘sus-tainable agriculture’ and natural resource management practices and research chal-lenges, with their greater spatial and temporal complexity. Thus many of the lessonslearned from on-farm agroforestry research should be highly relevant to broaderefforts in sustainable agricultural development.
Objectives of On-farm Experimentation
On-farm experimentation has several different objectives. First, it permits farmersand researchers to work as partners in the technology development process. The
Assessing Agroforestry Adoption Potential 13
Table 2.1. Framework for assessing the adoption potential of an agroforestrypractice.
Factors Key questions
Biophysical performance Does the practice result in higher yields, lower vari-ability and provide the anticipated environmental ser-vices? Are these biophysically sustainable?
Profitability Is the practice profitable to the farmer as comparedwith alternative practices? How variable are returns,and how sensitive to changes in key parameters?
Feasibility and Do farmers have the required information andacceptability resources, and are they willing and able to establish
and manage the practice and cope with problemsthat occur? Do farmers perceive significant advan-tages of using the technology?
Boundary conditions Under what circumstances (e.g. biophysical, house-hold, community characteristics, market conditions)is the practice likely to be profitable, feasible andacceptable to farmers?
Lessons for effective What does farmer feedback suggest will help inter-dissemination: est farmers in the practice? What type of extension● extension support do they need most? What types of● policy changes in institutional arrangements, public invest-
ments or market conditions would enhance theadoption potential of the practice?
Feedback to research How do farmers modify the practice? What doesand extension farmer experience suggest are research priorities for
further modification and development of thepractice?
Trees on Farms Ch2 16/2/02 11:57 am Page 13

more, and the earlier, that farmers are involved in the technology developmentprocess, the greater the probability that the practice will be adopted. On-farm trialsare important for getting farmers’ assessment of a practice, their ideas on how itmay be modified and for observing their innovations. Assessments are likely to varyand may be associated with particular biophysical (e.g. soil type) or socioeconomic(e.g. wealth status) circumstances. Farmers’ innovations often serve as a basis fornew research or for modifying recommendations (Stroud, 1993; van Veldhuizen etal., 1997).
Secondly, on-farm testing is useful for evaluating the biophysical performanceof a practice under a wider range of conditions than is available on station. This isespecially important because soil type, flora and fauna on research stations are oftennot representative of those found on farms in the surrounding community.
Thirdly, on-farm trials are important for obtaining realistic input–output datafor financial analysis. Financial analyses conducted on on-station experiments areunreliable because yield response is often biased upward, because estimates oflabour use by station labourers on small plots are unrepresentative, and becauseoperations often differ, as when tractors instead of oxen or hoes are used for prepar-ing land.
Fourthly, on-farm testing provides important diagnostic information aboutfarmers’ problems. Even if diagnostic surveys and appraisals have already been con-ducted, researchers can still learn a great deal about farmers’ problems, preferencesand livelihood strategies from interacting with them in on-farm trials. Trials haveimportant advantages over surveys in that they are based on what farmers do ratherthan on what they say.
Types of On-farm Trials
On-farm trials can thus provide critical information for determining the biophysicalperformance, profitability and acceptability of agroforestry, i.e. adoption potential.However, the design of a trial depends on its specific objectives.
Assessment of biophysical performance requires biophysical data on the prod-ucts and services that the technology is planned to produce. These are likely tochange with different adaptations of the technology as might occur if farmers wereasked to manage them. To prevent such possible variation, trials designed to assessbiophysical performance should be controlled in order to replicate specific technol-ogy designs. The trials should also be implemented in a way that farmers’ willing-ness and ability to establish and maintain the trials does not affect the outcome.Thus trials to assess biophysical performance need a high degree of researcher con-trol in both design and implementation.
The assessment of profitability requires biophysical data (to estimate returns),that must be generated from standardized experiments. However, the financialanalysis also requires realistic input estimates, of which labour poses most difficul-ties. Realistic data can only be obtained if farmers manage the trials to their ownstandards. Thus profitability objectives require trials in which researchers have con-
14 S. Franzel et al.
Trees on Farms Ch2 16/2/02 11:57 am Page 14

siderable input into the design but farmers are responsible for implementation. Theobjectives of assessing feasibility and acceptability require data on farmers’ assess-ments and adaptations of the technology. These can only be assessed if farmers areleft to experiment with little researcher involvement.
There are many different ways of classifying on-farm trials (Okali et al., 1994).The differing requirements of the objectives of biophysical performance, profitabilityand acceptability mean it is helpful to classify trials according to the balance ofresearcher and farmer involvement in their design and implementation. The classifi-cation used in this volume involves three types of trials and draws upon Biggs (1989).
Type 1, trials designed and managed by researchers
These trials are simply on-station trials transferred to farmers’ fields. They are usefulfor evaluating biophysical performance under farmers’ conditions and require thesame design rigour as on-station research with regard to treatment and controlchoice, plot size, replication and statistical design. In the design stage, researchersneed to consult the farmer on the site’s homogeneity and history. If possible, theyshould observe a crop in the field before establishing a trial.
Because type 1 trials take place on farmers’ fields, trial results are generallymore representative of farmers’ biophysical conditions than are on-station trials(Shepherd et al., 1994). More accurate information may be obtained on interac-tions between the biophysical environment and management; for example, how dif-ferent species in an improved fallow trial compare on different soil types.
Type 1 trials are usually more expensive and more difficult to manage than on-station trials; they often involve renting land from farmers and bringing labourersfrom the station to implement them. Farmers’ assessments are an important objec-tive of type 1 trials; as with on-station trials, it is useful to get farmers’ feedback onthe different treatments (Sperling et al., 1993; Franzel et al., 1995).
Type 1 trials were conducted on three of the technologies reported in this vol-ume. The numbers of farmers per trial was small, 1–5, because of the relatively highcost of conducting these trials. For the other technologies, on-station trials providedtechnical information before starting farmer-managed trials.
Type 2, trials designed by researchers but managed by farmers
Here, farmers and researchers collaborate in the design and implementation of thetrial. The trial is labelled ‘researcher-designed’, because it follows the conventionalscientific approach to conducting an experiment: one or more test treatments arelaid out in adjacent plots and compared to one or more control treatments.Researchers consult farmers on the design of the trial and each farmer agrees to fol-low the same prototype (or chooses one of several possible prototypes), so thatresults may be compared across farms. Farmers are responsible for conducting all ofthe operations in the trial.
Assessing Agroforestry Adoption Potential 15
Trees on Farms Ch2 16/2/02 11:57 am Page 15

In type 2 trials, reliable biophysical data over a broad range of farm types andcircumstances are sought. The trials also facilitate the analysis of costs and returns;inputs, such as labour, and outputs, such as crop yields, are relatively easy to mea-sure because plot size is uniform and known. The trials are also useful for assessingfarmers’ reactions to a specific practice and its suitability to their circumstances.Farmers are encouraged to visit each other’s trials and to conduct group field days toassess the practice at different stages of growth.
Type 2 trials were conducted in four of the five case studies reported in thisbook. In most cases, the number of farmers per type 2 trial ranged from 20 to 50.Trials usually started off small, with fewer than 10 farmers, in order to learn fromexperience. They were then modified and expanded in the following year.
Type 3, trials designed and managed by farmers
In type 3 trials, farmers are briefed about new practices through visits to field sta-tions or on-farm trials. They then plant and experiment with the new practices asthey wish. They are not obliged to plant in plots or to include control plots.Researchers monitor the farmers’ experiments, or a subsample of them, focusing inparticular on their assessment of the new practice and their innovations. In addi-tion, farmer-to-farmer visits and meetings are useful so that farmers can comparetheir experiences and assessments with others. Any farmers experimenting with anew practice could be said to have a type 3 trial, regardless of whether they obtainedplanting material and information from researchers, other facilitators or other farm-ers. This ‘hands-off ’ approach, which assumes that farmers know best how to test anew practice on their own farms, is supported by some in the literature (Lightfoot,1987). Others emphasize training farmers to conduct trials following scientific prin-ciples, such as replication and non-confounding of treatments (Ashby et al., 1995).
Three of the case studies in this book involve the use of type 3 trials. The num-ber of type 3 trials was often quite high. In eastern Zambia in 1997, extension ser-vices and NGOs were helping about 2800 farmers to test improved tree fallows(Chapter 3). Researchers coordinated the monitoring of small samples of farmers,60–110, depending on the task and available staff.
Suitability of Trial Types for Meeting Objectives
The suitability of the different trial types for differing objectives is summarized inTable 2.2. Suitability involves both the appropriateness of the trial for collectingthe information and the ease with which it can be collected. Different types of tri-als are suited to different types of analyses. Biophysical measurements are mostmeaningful in type 1 and 2 trials; they are less useful in type 3 trials because eachfarmer may manage the practice in a different manner. Type 2 trials are well suitedfor collecting parameters (e.g. labour use) for financial analysis; such data are diffi-cult to collect in type 3 trials because plot size and management vary. The data can
16 S. Franzel et al.
Trees on Farms Ch2 16/2/02 11:57 am Page 16

be collected in type 1 trials but will be less relevant to farmer circumstances; yieldresponse to new practices tends to be biased upward and labour use, measuredusing labourers hired by researchers and working on small plots, is unrepresenta-tive of farmers’ labour use.
Farmers’ assessments are more accurate in type 3 trials for several reasons.Because farmers control the experimental process, they are likely to have more inter-est and information about the practice. Furthermore, because farmers in type 3 tri-als usually have less contact with researchers than farmers in other types of trials,their views of a technology are less influenced by researchers’ views. Finally, whereasit is often necessary to provide inputs to farmers in type 2 trials to ensure thatresults are comparable across farmers, no inputs, with the possible exception ofplanting material, are provided in type 3 trials. Thus farmers’ views in type 3 trialsare more likely to be sincere than in type 2 trials, where positive assessments maysimply reflect the farmers’ interest and satisfaction in obtaining free inputs. Forexample, in the hedgerow intercropping trial in western Kenya (Chapter 5), 50% ofthe farmers claimed that hedges increased crop yields whereas technicians notedyield increases on only 30% of the farms; the technicians claimed that the differ-ence was due to farmers trying to please researchers.
Finally, all three types of trials play a potentially important role in defining theboundary conditions for the technology. Which type of trial is best depends on theparticipants’ (facilitators’ and farmers’) objectives and the particular circumstances.
Assessing Agroforestry Adoption Potential 17
Table 2.2. The suitability of type 1, 2 and 3 trials for meeting specificobjectives.a
Type 1 trial: Type 2 trial: Type 3 trial:researcher- researcher- farmer-designed, designed, designed,researcher- farmer- farmer-
Information types managed managed managed
Biophysical response H M LProfitability L H LAcceptability
Feasibility L M HFarmers’ assessment of a L H Mparticular prototypeb
Farmers’ assessment of a L M Hpracticeb
OtherIdentifying farmer innovations 0 L HDetermining boundary conditions H H H
aH, high; M, medium or variable; L, low; 0, none. The suitability involves both theappropriateness of the trial for collecting the information and the ease with whichthe information can be collected.bBy particular prototype, we mean a practice that is carefully defined. For example,a prototype of improved fallows would include specific management optionssuch as species, time of planting, spacing, etc.
Trees on Farms Ch2 16/2/02 11:57 am Page 17

Continuum and sequencing of trial types
The different types are not strictly defined; rather they are best seen as points alonga continuum. For example, it is common for a trial to fit somewhere between type 2and type 3, as in the case where farmers agree to test a specific protocol (type 2) butover time, individuals modify their management of the trial (type 3). For example,in the hedgerow intercropping trial in Chapter 5, farmers planted trials in a similarmanner but most later modified such variables as the intercrop, pruning height andpruning frequency.
The types of trials are not necessarily undertaken sequentially; researchers andfarmers may decide to begin with a type 3 trial, or to simultaneously conduct twotypes of trials. For example, in the case of upper-storey tree trials in western Kenya(Chapter 6), no type 1 or type 2 trials were needed, because much was alreadyknown about the growth of the trees in the area. Rather, farmers planted type 3 tri-als, in order to assess the performance of the species on their farms. In Zambia,many farmers planted type 2 and type 3 improved fallow trials in the same year(Chapter 3). They tested a prototype in their type 2 trials and used type 3 trialseither to extend their plantings or to test a modification of the practice. Researcherswished to assess biophysical response in the type 2 trials and to monitor farmers’innovations in the type 3 trials. Type 2 and 3 trials often generate questions orsharpen hypotheses about biophysical factors which can then be best evaluatedthrough type 1 on-farm or on-station trials. In western Kenya, several researcher-managed trials to explore specific aspects of improved fallow function and designwere set up following farmer-managed trials (Chapter 4).
Handling complexity
‘Complexity’ involves the number and diversity of components (intercropping treesand crops, as opposed to trees or crops in pure stand), the length of the cycle of thetechnology (3+ seasons as opposed to single-season cycles), and the size of the trial(whether it takes up more than 10% of a farmers’ cultivated area). In a trial com-paring annual crop varieties, it is often possible to combine biophysical and socioe-conomic objectives because, according to the above definition, the trial is notcomplex. However, most agroforestry trials are complex, and thus different trialtypes are needed to meet the differing objectives.
The type 1–2–3 classification system is useful for highlighting the differentobjectives for conducting on-farm trials and for illustrating that different types oftrials are suitable for particular types of assessments (Table 2.2). For example,researchers often want to use an on-farm trial to collect information on biophysi-cal responses and farmer assessment. But these objectives are often conflicting. Ahigh degree of control is needed to collect accurate biophysical data whereasfarmer assessment is most valid when individual farmers are allowed to use thepractice in the manner they see fit. Researchers and farmers interested in biophysi-cal and socioeconomic data may be better off conducting type 1 trials for biophys-
18 S. Franzel et al.
Trees on Farms Ch2 16/2/02 11:57 am Page 18

ical data and type 3 trials for socioeconomic assessment, rather than a single type2 trial that tries to do both. The more complex the trial or technology, the lesseffective a type 2 approach is likely to be for both biophysical and socioeconomicassessments.
Organization of Participatory On-farm Trials
Key aspects of the organization of participatory on-farm trials (principally types 2and 3) discussed in this section include: farmer and technology selection, the villageapproach to technology testing, trial backstopping and supervision, adaptiveresearch and dissemination teams, and provision of incentives.
Farmer and technology selection
The selection of farmers for the trials reported in this volume generally took placethrough the assistance of extension staff (eastern Zambia) or farmer groups (westernKenya). Interested farmers were asked to volunteer and participants were selected soas to represent a range of the types of different farmers in the area, including largeand small farmers (all sites), male and female farmers (all sites), and farmers prepar-ing land with oxen and hoe (eastern Zambia).
Providing farmers with different options to test was a key feature of the trials,for several reasons. Different farmers had different circumstances and preferences;farmers wanted to diversify; and any single option could have failed. For example,in eastern Zambia, farmers selected among six improved fallow practices for theirtype 2 trials (Chapter 3). In type 3 multipurpose tree trials in western Kenya, farm-ers chose among five tree species but were encouraged to plant all five so as to per-mit a comparison among them (Chapter 6).
To ensure appropriate analysis, interpretation and extrapolation of results, it isimportant to specify or characterize the technology design in detail. Key design ele-ments considered in the case studies include: objectives (priority outputs or envi-ronmental services expected), site characteristics (location in the landscape, soiltype, field size), components (tree crop/provenance/variety; crop species/variety;livestock species/breed), method of tree establishment (and re-establishment or cop-picing), spacing and sequencing of components (including rotations), and tree andcrop management practices.
Village approach to technology testing
A common approach to on-farm technology testing has been to identify a relativelysmall number of farmers in many different villages across a large area who are will-ing to undertake experiments. This ‘scattered farmer’ approach can be useful whenkey socioeconomic or biophysical factors such as farm size or soil type vary mainly
Assessing Agroforestry Adoption Potential 19
Trees on Farms Ch2 16/2/02 11:57 am Page 19

across villages. In the mid-1990s, ICRAF researchers began to experiment with the‘village approach’ to technology testing, that concentrates efforts in a relatively fewcontrasting but representative sites. The key feature of the approach is that all vil-lagers are given equal access to information and germplasm, encouraging wider par-ticipation. As such, it is most appropriate for type 2 or 3 trials. The advantages ofthe village approach are:
● a reduction in monitoring costs per farmer through higher concentration offarmers;
● a wider participation ensures that different household types are involved intesting and development;
● the possibility to study inter-farm linkages and higher-scale effects (e.g. pestand disease outbreak, income from labour hiring) which require identificationprior to wide dissemination;
● the mitigation of intra-village jealousies and the promotion of improved inter-action with researchers;
● the involvement of village-based organizations, such as farmer groups, in thetesting and dissemination process; and
● the spread of information across farms within the village is facilitated.
There is one disadvantage to the village approach: the more or less equal distribu-tion of information and high participation rates make the study of diffusionprocesses within the village more difficult.
With a limited number of villages, it is important that they represent a largepercentage of the target population (e.g. representing major agroecological zones).With the large number of households testing technologies, researchers need toselect a smaller number of households for detailed monitoring. These should repre-sent different types of households, for example, poor, moderate and well-off house-holds; male- and female-headed households; and those using oxen and hoe forland preparation. With concentration of testing in a relatively small number ofsites, it is important to establish a communications strategy as part of the researchand for diffusion. Effective communication is needed within the community,between researchers and the community, and, most important, from the village toother villages.
Trial supervision and backstopping
At all sites, facilitators provided technical backstopping to farmers in types 2 and 3trials, and helped lay out type 2 trials. In eastern Zambia, facilitators includedresearchers, extensionists and NGO staff. In central Kenya, researchers and exten-sionists were involved; and in western Kenya, until the mid-1990s, only researcherswere involved. Facilitators also conducted the monitoring surveys during and fol-lowing the trials. In most cases research technicians collected information; extensionstaff often participated (central Kenya and Zambia), or enumerators were hired(western Kenya).
20 S. Franzel et al.
Trees on Farms Ch2 16/2/02 11:57 am Page 20

Adaptive research and dissemination teams
Participatory on-farm experimentation and dissemination are better viewed aspoints along a research–development continuum than as separate activities. Afterall, when farmers participate in on-farm trials some degree of technology dissemina-tion always takes place. Similarly, when a new technology is disseminated, eachfarmer trying the technology for the first time can be said to be experimenting withit. Therefore, at all case study sites, research, extension, NGOs and farmer groupshave established partnerships called ‘adaptive research and dissemination teams’(ICRAF, 1997). The teams plan, implement and evaluate on-farm research, trainingand dissemination activities (Cooper, 1999). Extension and NGO staff have muchto offer and can benefit greatly from participating in on-farm research. Theirinvolvement reduces the costs of the research and their knowledge of local circum-stances improves the design and quality of the research. They also benefit fromgreater interaction with researchers and are likely to be more knowledgeable about apractice if they are involved with farmers in its development in on-farm trials.Similarly, it is important for researchers to be involved in disseminating practices, inorder to assess adoption and impact, to obtain feedback from farmers and to iden-tify issues for further research. One of the most important impacts of the teams isthat all partners develop a sense of involvement, enthusiasm and ownership ofpromising innovations. A critical task of the team is to define clearly the roles andresponsibilities of the different actors in on-farm research and dissemination.
The most developed adaptive research and dissemination team discussed in thisvolume is in eastern Zambia (Chapter 3). Seventy-five representatives of research,extension, NGOs and farmer groups meet 1–2 times per year to review progressand plan activities for testing and disseminating improved fallows and other soil fer-tility measures. The number of farmer-experimenters has increased from fewer than10 in 1993–1994 to about 200 in 1994–1995, and to about 3000 in 1997–1998.The mechanisms in place for disseminating the practice and for providing feedbackon performance will contribute greatly to the impact that improved fallows achievein Zambia and elsewhere.
Provision of incentives
Farmers did not receive any financial or material incentives for participating in thetrials. Farmers conduct their own research; there should thus not be any need toprovide them with incentives to participate in collaborative trials with researchers.Moreover, giving incentives has four important disadvantages. It promotes a depen-dency relationship between facilitator and farmer, instead of a partnership; it sets anunfortunate precedent for other facilitators who come later and do not have theresources for offering incentives; it may create conflict, because in most programmesincentives cannot be offered to all farmers; and it biases farmers’ assessments, asthey may tend to give more positive opinions in the hopes of obtaining more freeinputs.
Assessing Agroforestry Adoption Potential 21
Trees on Farms Ch2 16/2/02 11:57 am Page 21

However, most practitioners would agree that it is necessary, and even ethical,to provide free of charge the experimental variable, such as seeds or seedlings for anew tree species being tested. Unfortunately, this may bias farmers’ assessment.Some practitioners have also found that farmers value their visits as a social benefitand may give positive assessments merely to encourage them to continue their visits(Chapter 5). Where the farmer’s role expands far beyond that of a trial participant,to active involvement in dissemination, demonstration, etc., which demands signifi-cant time unrelated to on-farm experimentation, it may be appropriate to treat andremunerate such people as staff or consultants. Such arrangements are especially rel-evant where there are no extension agents.
Assessing Adoption Potential
This section focuses on methods for assessing biophysical performance, profitability,acceptability and boundary conditions. The use of on-farm trials to draw lessonsfor extension, policy and research is also described. Criteria for selecting whichmethods to use are also reviewed. The methods used in each case study for assessingprofitability and acceptability are shown in Table 2.3.
Biophysical performance
Assessing the biophysical performance of a technology on-farm uses much the samegeneral methods as used in analysis of on-station trials (see, for example, Little andHills, 1972; Mutsaers et al., 1997). The products and services of the technologiesare measured and compared among different options. Great care must be taken inassessing whether all sites should be included in a particular analysis, especiallywhen data are from trials managed by farmers. For example, in an analysis of animproved fallows trial, it would be important to exclude sites where a trial plot wasshaded by adjacent shrubs, but the control plot was not.
Often the objectives in on-farm assessment include identification of environ-ment (e.g. soil type) by technology interactions. Analysis then requires determininghow the differences between technology options change with changing environ-ment (Hildebrand and Russell, 1996). It is therefore necessary to measure the keyenvironment variables. These key variables must be identified before the trial starts,as many (e.g. rainfall or frost incidence) cannot be measured after the trial hasended.
The most difficult issue in assessing biophysical performance is ensuring thatthe comparisons being made are representative of those that farmers would make.For example, on-station hedgerow intercropping trials showed a strong fertilityresponse to the technology; type 2, on-farm trials did not, probably because farmerswere unable to prune the hedges in time to avoid competition between the treesand adjacent crops (Chapter 5). On the other hand, yield responses obtained intype 1 improved fallows trials in Zambia were only 20% higher than those obtained
22 S. Franzel et al.
Trees on Farms Ch2 16/2/02 11:57 am Page 22
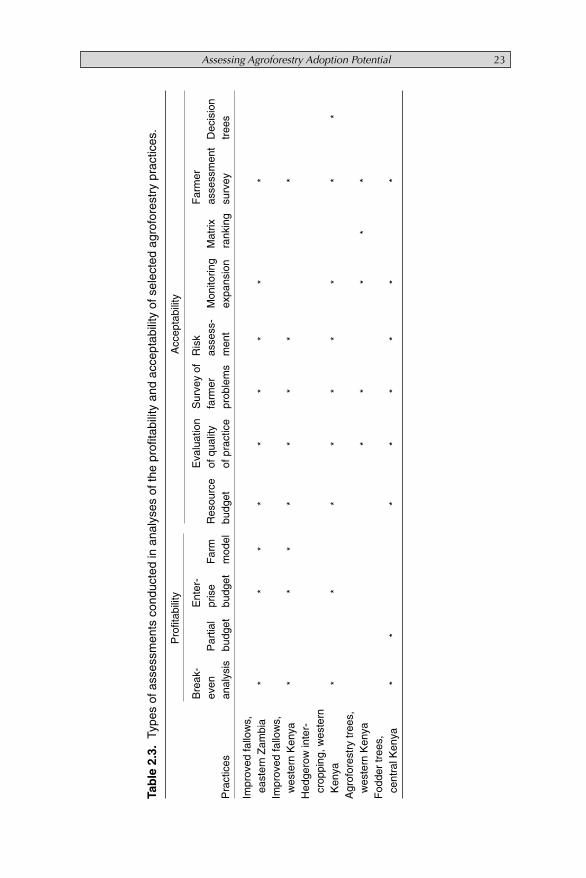
Assessing Agroforestry Adoption Potential 23
Tab
le 2
.3.
Type
s of
ass
essm
ents
con
duct
ed in
ana
lyse
s of
the
profi
tabi
lity
and
acce
ptab
ility
of s
elec
ted
agro
fore
stry
pra
ctic
es.
Pro
fitab
ility
Acc
epta
bilit
y
Bre
ak-
Ent
er-
Eva
luat
ion
Sur
vey
ofR
isk
Far
mer
even
Par
tial
pris
eF
arm
Res
ourc
eof
qua
lity
farm
eras
sess
-M
onito
ring
Mat
rixas
sess
men
tD
ecis
ion
Pra
ctic
esan
alys
isbu
dget
budg
etm
odel
budg
etof
pra
ctic
epr
oble
ms
men
tex
pans
ion
rank
ing
surv
eytr
ees
Impr
oved
fallo
ws,
east
ern
Zam
bia
**
**
**
**
*Im
prov
ed fa
llow
s,w
este
rn K
enya
**
**
**
**
Hed
gero
w in
ter-
crop
ping
, wes
tern
Ken
ya*
**
**
**
**
Agr
ofor
estr
y tr
ees,
wes
tern
Ken
ya*
**
**
Fod
der
tree
s,ce
ntra
l Ken
ya*
**
**
**
*
Trees on Farms Ch2 16/2/02 11:57 am Page 23

in type 2 and type 3 trials, indicating that the type 1 trials were probably not man-aged much differently than the type 2 and type 3 trials (Kwesiga et al., 1999). Intype 1 and 2 trials, researchers need to ensure that the site, treatments compared,and trial management are each similar to those of the farmers for whom the practiceis targeted.
Long-term monitoring of trials is likely to be required to assess the biophysicalsustainability of different practices, in terms of maintaining soil quality, managingpests and diseases, etc. Assessing the sustainability of a practice involves identifyingkey elements that will be needed over the long term, at least 20 years, to ensure thatthe practice will remain feasible, profitable and acceptable to farmers. For example,high-yielding maize following improved fallows in eastern Zambia will draw downstocks of soil phosphorus. Thus it is likely that over the long term, improved fallowswill have to be supplemented by phosphorus fertilizer in order to sustain high maizeyields. The sustainability of an agroforestry practice may involve a range of differentvariables, such as seed production and distribution, soil nutrient balance, and pestand disease management.
Profitability
Profitability issues can usefully be divided into three categories. The first concernswhether the financial net benefits of the new practice are greater than for alternativepractices, including those that farmers currently use. Secondly, it is important toassess the variability of benefits across farmers and seasons and the sensitivity of theresults to changes in key parameters. Thirdly, benefits are appraised relative to totalhousehold income in order to assess their potential for contributing to improvedhousehold welfare.
Greater financial benefits may arise through increased biophysical productivityor through reduced input costs. Biophysical productivity and financial net benefitswere assessed in the case studies by comparing results on treatment plots with thoseon control plots, which represented farmers’ current practices. For example,researchers assessed the impact of hedgerow intercropping by comparing crop yieldsand net benefits on hedge plots with those on plots without hedges (Chapter 5).Where it was not possible to assess productivity responses, as in the case study ofimproved fallows in western Kenya (Chapter 4), the yield increases required tobreak even, that is, to cover the costs of planting and maintaining the practiceunder different assumptions, were calculated. Break-even analysis was also con-ducted in three other case studies to show the minimum returns needed to coverthe costs of establishing and maintaining the practice (Chapters 3, 5 and 7). Break-even analysis thus provides useful information about profitability long before theyield response of a practice is known.
In all cases, financial analyses were based on the actual costs and returns thatfarmers face. Partial budgets were drawn up for those practices that had limitedimpacts on the costs and returns of an enterprise, as in the case of Calliandracalothyrsus as a fodder for dairy cows (Chapter 7). A partial budget is a technique
24 S. Franzel et al.
Trees on Farms Ch2 16/2/02 11:57 am Page 24
for assessing the benefits and costs of a practice relative to not using the practice. Itthus takes into account only those changes in costs and returns that result directlyfrom using the new practice (Upton, 1987).
Where a practice was expected to have substantial financial effects, enterprisebudgets were used. Here, all of the enterprises’ costs and returns for a single period,a growing season or a year, were calculated. Prices were collected from local markets.Detailed information on labour use among participating farm households was col-lected using a range of methods, including farmers’ recall just after a task was com-pleted and monitoring of work rates through observation (Franzel, 1996).Collecting data on labour use in on-farm trials is problematic: monitoring farmerswhile they are in the field introduces an important ‘observer’ bias, while askingfarmers to recall how much time they spent at a specific task is often unreliable. Wefound that interviewing farmers in the field just after a task was completed was thebest way to collect data on labour use. Moreover, we found that only researcherscould collect accurate labour data; the task was too complex to be relegated to enu-merators. Finally, not all farmers could provide accurate data on labour used; thesample must be purposive based on the confidence that the researcher has in thequality of data being provided.
Net returns to farmers’ production factors (land, labour and capital) are calcu-lated by subtracting purchased inputs from the production value. After subtractingfarmers’ capital inputs, which are generally minor, the net returns are allocatedamong farmers’ land and labour by valuing one factor at its opportunity cost and byattributing the remainder to the other factor. This permits a calculation of the netreturns to land, which is relevant for farmers whose most scarce resource is land,and the net returns to labour, relevant for those who lack labour. Net returns tocapital for agroforestry practices were often extremely high or infinite because littleor no capital was used in implementing them. This finding explained the attractive-ness of many of the options as the alternatives, such as fertilizer to improve cropyields or dairy meal concentrate to increase milk yields, were very expensive forfarmers.
Data for a single period are usually inadequate for evaluating agroforestry.Therefore, cost–benefit analyses, also called investment appraisals (Upton, 1987),were developed in most of the case studies for estimating resource inputs, costs andbenefits over the lifetime of the investments (2–6 years). Average values for costsand returns across the sample were used to compute net present values. Also, netpresent values were calculated for each farmer, based on his/her particular costs andreturns. This latter method permitted a better understanding of the variation acrossfarms in returns, and thus the risk of the practices.
To assess the actual changes in annual income generated by a new practice,farm models were developed in which the farm was partitioned to contain specifiedportions of land devoted to each phase (corresponding to a season or year) of thetechnology. For example, in the model of improved fallows in Zambia (Chapter 3),the farm was assumed to have equal portions of area in each of the practice’s fourphases: planting of the improved fallow (year 1), maturing of the fallow (year 2),the first post-fallow maize crop (year 3), and the second post-fallow maize crop
Assessing Agroforestry Adoption Potential 25
Trees on Farms Ch2 16/2/02 11:57 am Page 25

(year 4). The net returns of this farm were compared to two other farms having thesame amount of labour (the main constraining resource), one planting fertilizedmaize continuously without fallow and the other planting unfertilized maize con-tinuously without fallow. The model was thus useful for estimating the impact ofimproved fallows on annual net farm income and maize production.
Acceptability and feasibility
To assess the adoptability of a technology, it must be analysed from the farmers’ per-spective, which means much more than its biophysical performance and profitabil-ity (Scherr, 1995). In particular, it must be feasible for farmers to plant andmaintain, and it must be considered acceptable and desirable. Feasibility andacceptability are grouped together because the feasibility of a technology is depen-dent on its perceived value. For example, labour bottlenecks that appear when farm-ers attach a low value to an activity may disappear when the farmers’ perception ofthe value increases.
Feasibility
Farmers’ ability to plant and maintain agroforestry technologies depends on threefactors: available resources (land, labour and capital), whether they have therequired information and skills, and whether they are able to cope with any prob-lems that arise. Several tools are available for assessing the feasibility of a practice inon-farm trials. Resource budgets may be assembled to compare the availability ofthe resource with the needs of the practice. For example, in Chapter 7, the numberof calliandra trees that can be planted on boundaries and contours is compared tothe numbers needed to feed a cow. In Chapter 5, household labour use in differentweeks of the year is compared to the labour requirements of hedgerow intercrop-ping. If the peak period for labour use of a new practice coincides with that of thehousehold, farmers may have difficulty implementing the practice.
Another means for assessing feasibility is to evaluate the general biophysical per-formance of the technology as planted and maintained by the farmer. This assessmentmay involve quantitative data, such as survival rates of seedlings planted, or qualita-tive ratings, such as technicians’ assessment of the amount of biomass in an improvedfallow. Both are used in assessing the feasibility of improved fallows in Zambia(Chapter 3). Where performance is not as high as expected, technicians and farmersare asked their opinions as to what went wrong. Possible reasons might include:
● inappropriate biophysical conditions, such as soil type;● lack of labour or other resources;● lack of information or skills;● incompatibility of gender with a particular task, as in cultures where females do
not prune trees; or● inability to cope with a problem that arose, such as pests, diseases or inade-
quate rainfall.
26 S. Franzel et al.
Trees on Farms Ch2 16/2/02 11:57 am Page 26

Finally, farmers may be interviewed in informal or questionnaire surveys aboutthe problems they experienced implementing the trial. Their ranking of the impor-tance and frequency of problems provides useful information on feasibility(Chapter 3).
Acceptability
Acceptability includes profitability, feasibility and a range of criteria that are diffi-cult to quantify, such as risk, general compatibility with farmers’ values and farmers’valuation of benefits, such as a tree’s ornamental value or its use as a boundarymarker.
Risk was assessed by: (i) measuring variability in the returns of individual farm-ers; (ii) conducting minimum returns analysis (CIMMYT, 1988), in which theaverage of the lowest 25% of the net benefits of each treatment are compared; and(iii) by conducting informal interviews with farmers. The interviews were particu-larly useful for understanding farmers’ views towards risk. For example, in Zambia,farmers stated that even though fertilizer could be very profitable in a year of goodrainfall, the risk of losing their investment in a year of poor rainfall prevented themfrom using the technology. Sensitivity analysis was conducted to assess the effect onnet present value of changes in key parameters, such as prices of inputs and outputs,changes in input–output coefficients and changes in the discount rate. By assessingthe effects of likely future market patterns on these sensitive parameters, the eco-nomic sustainability of the practice can be evaluated.
Asking farmers whether a practice was acceptable did not prove to be very use-ful; nearly all farmers gave positive assessments, probably because they felt that criti-cizing a practice would be insulting to the researcher. Rather, acceptability is bestascertained by monitoring whether farmers continue using and expand their use ofa practice, and whether neighbouring farmers take it up. Important indicators ofacceptability include the numbers of times farmers expanded their planted area, thenumbers of trees planted and area planted per expansion, and the numbers of farm-ers to whom the original experimenters gave or sold planting material. Farmers’expansion of practices was assessed in four of the case studies and farmer-to-farmerdissemination was assessed in three of the case studies.
But using expansion or adoption as a proxy for acceptability is problematic forthree reasons. First, in some cases, farmers may be interested in expanding butunable to do so because they lack access to critical information or inputs. Secondly,farmers may expand use of a practice not because they like it but because theyexpect to receive other benefits, such as free inputs or employment. Thirdly, agro-forestry practices take a long time to evaluate and it was reasonable to assume that afarmer needed to experience the full cycle of a technology (4–5 years in the case ofimproved fallows in Zambia) before deciding whether to continue using it. Anyexpansion that took place before the end of the cycle could arguably have beencalled an expansion in testing rather than an indication of acceptability.
Assessments of farmers’ preferences among alternative options can provide use-ful feedback for research and extension, especially when they are quantified. For
Assessing Agroforestry Adoption Potential 27
Trees on Farms Ch2 16/2/02 11:57 am Page 27

example, in western Kenya, farmers used an indigenous board game, bao, to scoreupper-storey trees on criteria important to them (Chapter 6). In this variant ofmatrix ranking (Ashby, 1990), branches of each tree were laid out on the ground.For each criterion, farmers rated the tree by putting one to five seeds in the pocketnext to each branch – five being a high rating and one being a low rating. In con-trast with questionnaires, which farmers find tedious, the bao game can be used forcollecting quantitative data on farmer assessments in an accurate, entertaining, yetstatistically rigorous manner. It also allows farmers to assess their ranking visuallyand perhaps, on reflection, make changes (Franzel, 2001).
Farmer assessment surveys may be implemented to find out what farmers per-ceive as the advantages and disadvantages of a practice. These surveys may beinformal, involving individual or group interviews, or formal, using a question-naire administered by technicians. As with matrix ranking, they can be conductedat various times to find out farmers’ assessments at each stage of the practice.Informal and formal farmer assessment surveys were conducted in all five of thecase studies.
Hierarchical decision trees may be used to model complex decisions, such aswhether or not to expand the use of hedgerow intercropping in western Kenya(Chapter 5). This method is useful for explaining the decisions that farmers make,by breaking them down into a series of subdecisions and mapping each farmer’sdecision path along the branches of the tree. Questions needed for decision treescan be included in both informal and formal surveys (Gladwin, 1989).
Farmer workshops are also an important means to find out farmers’ views onthe technologies and their potential impacts (Kristjanson et al., 2002). To facilitatethe exchange of information, farmers divide into small working groups, eachaddressing a specific issue. The workshops provide information on important effectsof practices, ‘invisible effects’, such as secondary effects on other enterprises, indica-tors that farmers would use to evaluate the impact of adoption and clarification ofpossible constraints to adoption. Whereas in many cases the information providedby farmers in such workshops is what researchers might have anticipated, it is possi-ble that important new information may be obtained. For example, a key finding inthe Zambia workshop was that many farmers intended to use improved fallows notso much to increase the total amount of maize they produced, but rather to increasemaize yields and reduce the area they devoted to maize, freeing up land for growingcash crops (Chapter 3). Farmer workshops can also be an important means forfarmers to discuss issues related to new practices, exchange opinions and lessons,and come to consensus or clarify their differences.
Defining boundary conditions
The boundary conditions of a practice are defined by identifying the variables thatare most important in determining who will and will not use the practice.Information on variables affecting biophysical performance, profitability, feasibility
28 S. Franzel et al.
Trees on Farms Ch2 16/2/02 11:57 am Page 28

and acceptability are thus critical. The variables should be fairly easy to identify;otherwise, they will not be useful in distinguishing among farmers or areas.
Biophysical variables used for assessing boundary conditions in the case studiesexamined in this book included altitude (a proxy for temperature), rainfall, soil typeand depth, and soil nutrient status. Critical socioeconomic variables includedwealth, gender and farm size. The two groups of variables were found to be usefulin different ways. Biophysical boundary conditions were often used to exclude acomponent or practice from particular areas. For example, calliandra did not per-form well on acidic soils. Socioeconomic boundary conditions, on the other hand,were used mainly to inform researchers, extensionists and farmers about the appro-priateness of choices. For example, the finding that improved fallows have a higheradoption potential among males than females is important for identifying and alle-viating the constraints that women face or for understanding the need to identifyalternative technologies for them (Chapter 3).
Some boundary conditions may be assessed through secondary data, as when itis known that a particular tree species does not perform well outside a certain alti-tude range. Modelling is also useful, as when a financial analysis shows that a prac-tice is profitable only when the opportunity cost of labour is above a certain level(Chapter 4). But in most cases, assessments must be based on empirical data con-cerning where the practice performs well and who adopts it. Biophysical variablesoften vary spatially; type 1 trials are especially useful for assessing the biophysicalboundary conditions of a practice (Chapter 3). Type 2 and type 3 trials are less reli-able because variation in management practices across site may confound the resultson biophysical performance.
The farm and household characteristics that were examined most frequently inthe case studies, for their association with testing and continued use of a practice,included gender, household type, wealth level, farm size, soil type and soil nutrientstatus. These were investigated by testing the statistical association between individ-ual variables and performance, as in Zambia, where farmers used a wealth rankingexercise to classify themselves into different wealth categories. They found thathigh-income households tended to use improved tree fallows more than low-income households (Chapter 3). In western Kenya, multiple regression was used toassess the relative importance of selected variables affecting farmers’ preferencesamong upper-storey trees (Chapter 6). The small number of farmers that could bemonitored in a type 2 trial, usually fewer than 50, limited the degree to which fac-tors affecting adoption potential could be examined rigorously.
Drawing lessons for effective dissemination and diffusion
The multiyear dissemination, testing and evaluation of agroforestry practices withfarmers was found to provide valuable lessons for the subsequent design of effectivepromotion efforts by extension organizations. Farmers’ own innovations were iden-tified in on-farm trials that can increase productivity and adoption potential. For
Assessing Agroforestry Adoption Potential 29
Trees on Farms Ch2 16/2/02 11:57 am Page 29

example, low-cost tree establishment methods such as bare-rooted seedlings signifi-cantly reduced production costs and increased profitability. In establishingimproved fallows, intercropping the trees with crops during the first year may bemore acceptable to farmers than planting them in pure stands (Chapter 3).
Several methods are available for identifying ‘best-bet’ modifications of practices:
● participatory informal appraisals with farmers to determine their assessment ofpractices and what changes they propose (Ashby, 1990);
● visits to farmers’ fields to identify modifications that farmers have tested;● screening new practices and species from other sites for their relevance to farm-
ers’ needs and circumstances; and● ex ante quantitative data on costs and returns of different modifications and
practices.
By working closely with farmers during the technology development process,extensionists can identify effective ‘selling points’ for the new technologies, for dif-ferent groups of farmers. The process of identifying boundary conditions helps withthe formulation of extension materials and development of strategies for targetingdifferent groups. The advantages of individual versus group or village approachescan be evaluated under different circumstances, prior to the launching of major dis-semination initiatives.
Drawing lessons for policy support
Public policies and institutions can influence the feasibility, profitability and accept-ability of agroforestry practices (Chapter 8). For example, public subsidies and seeddistribution networks affect the price of seedlings, which in turn influences the scaleof tree-planting by farmers. Land tenure legislation and local land-use regulationsinfluence farmers’ selection of sites and niches for tree planting. The design and tar-geting of agroforestry extension programmes influences the dissemination of infor-mation critical for farmer adoption.
On-farm research, particularly large-sample, type 3 trials, can provide bothvaluable diagnostic information about possible policy constraints and benefits, andalso the opportunity to assess particular policy instruments on an experimental basis(such as a new subsidy, product marketing approach, type of farmer organization ora locally agreed land-use regulation). Depending upon the issue and the sample size,various methods can be used to obtain policy-relevant insights:
1. Direct observation and participant feedback about policy or institutional factorsthat constrain adoption or expansion of agroforestry. An example is the identifica-tion of the constraints to on-farm seed production for fodder trees and the need forseed bank development, described in Chapter 7.2. Regression analysis of factors associated with adoption, to assess the importanceof existing policy and institutional factors (for example, plot tenure status) and toidentify factors that could be affected by policy action.
30 S. Franzel et al.
Trees on Farms Ch2 16/2/02 11:57 am Page 30

3. Sensitivity analyses from cost–benefit studies can be used to estimate the magni-tude of the potential impact of policy changes (such as planting subsidies) on vari-ous types of farmer costs and benefits (Chapter 5).4. Formal or informal evaluation of pilot policy interventions or institutional inno-vations. Examples include the pilot programmes for community-based extension inwestern Kenya (Chapter 4), and institutional mechanisms for research–extensionlinkages in Zambia (Chapter 3).
Feedback to research
The close interaction between researchers and farmers during on-farm research, andthe opportunities for direct observation by researchers, can provide an excellentlearning opportunity to identify research problems and priorities. Formal surveys toassess the frequency and severity of important problems can also help researchers toset priorities among problems and among different potential solutions to a givenproblem (Tripp and Wooley, 1989). All five of the case studies report on feedbackto research, which often led to trials and results that alleviated or solved the originalproblems. For example, farmers’ main problem with Sesbania sesban in improvedfallows in western Kenya, that it germinated poorly when direct seeded, led directlyto trials that were successful in selecting species with higher germination rates.
Selection of methods
The approach presented in this chapter for assessing adoption potential is eclectic inthat it draws on a range of methods, including the formal surveys of economists,research trials of biophysical scientists, the participatory techniques of anthropolo-gists, and the informal experiments and assessments that farmers themselves make.The case studies do not all use the same techniques for assessing adoption potential(Table 2.3). Rather, the selection of activities was driven by critical informationgaps, identified jointly by researchers, extensionists and farmers, in technologydesign and in understanding boundary conditions. The choice of methods thusdepended on several factors:
1. The practice’s resource requirements. Improved fallows and hedgerow intercrop-ping had relatively high labour requirements. Thus researchers decided to measurethe practice’s labour requirements and compare them with the seasonal and totallabour requirements of the household. In contrast, upper-storey trees planted onfarm boundaries have low labour requirements, so a formal assessment of labourrequirements relative to total labour use was not viewed as critical.2. The practice’s impact on farming enterprises. Enterprise budgets are needed toassess profitability when a new practice has an important impact on the costs,returns, resource requirements and management of an enterprise. Thus, enterprisebudgets were drawn up for improved fallows and hedgerow intercropping. But for
Assessing Agroforestry Adoption Potential 31
Trees on Farms Ch2 16/2/02 11:57 am Page 31

practices that have less impact, such as substituting calliandra leaves for a purchasedprotein concentrate in a dairy enterprise, a partial budget sufficed for determiningprofitability.3. The size of the sample. Where the number of farmers testing a practice were few(for example, only 20 farmers tested improved fallows in western Kenya), tests ofassociation between farmers’ circumstances and use of the practice could be con-ducted, but the results were not usually statistically convincing.4. Farmers’ experience with the practice. Where farmers had not yet received the ben-efits of the practices, as with upper-storey trees in Chapter 6, it was not possible toassess factors affecting uptake. But farmers’ preferences among the different treescould be examined.5. Availability of staff and resources. Lack of human resources and a change of per-sonnel and research priorities prevented the monitoring of uptake of improved fal-lows in western Kenya, following the end of the experiments in the early 1990s.6. Nature of the practice. Where a practice involves choosing among several alterna-tives, as among five agroforestry species (Chapter 6), matrix ranking was a usefultool. It was not appropriate when a practice involved a single prototype, as withimproved fallows in western Kenya (Chapter 4).
The Research–Development Continuum
The on-farm research experiences in Kenya and Zambia demonstrate that there aremultiple sources of innovation in agroforestry – formal sector researchers, farmingtradition, farmer-innovators, extensionist-innovators. Through shared experiencesin on-farm research studies, their complementary strengths can be effectivelyexploited and integrated, at reasonable cost. Figure 2.1 presents a farmer-centredmodel that is evolving in western Kenya and eastern Zambia. Instead of a linearsequence whereby technology is developed by researchers, then passed to extension-ists and finally to farmers, in the on-farm research-centred model there is continualinteraction among these groups throughout the process. Input from farmers andextensionists is provided early on, opportunities for early extensionist and farmerinnovation and adaptation are encouraged, and implementation on farmers’ fields –and hence potential for farmer-to-farmer diffusion – begins much earlier in time.Moreover, building a coalition of organizations to conduct on-farm research anddissemination together is vastly more effective and efficient than leaving each towork independently on only one element.
Researchers and extensionists working together in particular sites can jointlydevelop locally appropriate extension recommendations for use by other extensionprogrammes in the region. They can, meanwhile, report regularly to this broadercommunity – as well as senior staff in their respective organizations – on progress intechnology development and problems encountered, which can then be jointlyaddressed. Within this structure, technical specialists can collaborate more effec-tively with, and support, initiatives by existing or newly formed farmer-experi-menter groups than can conventional research or extension organizations.
32 S. Franzel et al.
Trees on Farms Ch2 16/2/02 11:57 am Page 32

Assessing Agroforestry Adoption Potential 33
Fig. 2.1. Flow diagram of decisions and activities in farmer-centred agroforestryresearch and extension.
Appraisals and diagnosticsurveys to identify prioritiesfor agroforestry research
Participatory on-farmresearch to assess theadoption potential:• biophysical response• profitability• acceptability
Researcher-controlledtrials, both on-stationand in farmers’ fields
Boundary conditionsdetermined
Disseminationactivities
Widespread adoption andimpact
Farmer feedbackidentifies need
for further surveywork
Refinement ofproblem
descriptionneeded
Controlled trials needed todetermine managementstrategies and measure
key processes
Promisingoptions identified
Farmer feedbackindicates need for more
detailed research
Agroforestryoptions available
for farmerevaluation
Biophysicalperformance
assessed in multi-location trialsImproved targeting
of research
Interaction betweenadoption potential
and socioeconomicfactors assessed
Targeted dissemination ofa range of agroforestry
choices/options
Targeted dissemination ofa range of agroforestry
choices/optionsDisseminationfacilitates wider
testing by farmers
Adoption and impact studies identifyingsecond-generation research issues associated withscaling-up and new opportunities for agroforestry
Trees on Farms Ch2 16/2/02 11:57 am Page 33
34 S. Franzel et al.
Conclusion
The experiences of ICRAF and its partners in Kenya and Zambia demonstrate theimportance of assessing the adoption potential of agroforestry practices. First, suchassessments improve the efficiency of the technology development and dissemina-tion process, by feeding back information on farmers’ problems, modifications andpreferences to research, extension staff and policy makers. Secondly, the assessmentshelp document the progress made in disseminating new practices, demonstratingthe impact of investing in technology development and dissemination. Thirdly,because the activities are conducted with partner institutions, they facilitate inter-disciplinary and inter-institutional cooperation. Finally, the assessments help toidentify the factors contributing to successful technology development programmesas well as the constraints limiting achievements.
Future assessments need to take advantage of farmers’ increased experiencewith agroforestry practices. Analyses of social, economic, biophysical and ecologicalimpacts will thus be possible at community, landscape and regional scales.Improvements in the development of spatially explicit databases and models shouldpermit the use of geographic information systems for assessing the boundary condi-tions of new technologies. Efforts are also needed to hand over many of the activi-ties in assessing adoption potential to local institutions, such as farmer groups andorganizations. The greater control they have over assessing adoption potential, themore responsive technology generation activities will be to their needs.
References
Ashby, J.A. (1990) Evaluating Technology WithFarmers: a Handbook. CIAT PublicationNo. 187. CIAT, Cali, Colombia.
Ashby, J., Gracia, T., Guerrero, M., Quiros, C.,Roa, J. and Beltran, J. (1995)Institutionalizing Farmer Participation inAdaptive Technology Testing With the ‘CIAL’.Overseas Development Institute NetworkPaper 57, London.
Biggs, S. (1989) Resource-Poor FarmerParticipation in Research. ISNAR, TheHague, Netherlands.
Byerlee, D. and Collinson, M.P. (1980) PlanningTechnologies Appropriate to Farmers. CIM-MYT, Mexico.
Chambers, R., Pacey, A. and Thrupp, L.A. (1989)Farmer First: Farmer Innovation andAgricultural Research. IntermediateTechnology Publications, London.
CIMMYT (1988) From Agronomic Data toFarmer Recommendations: an EconomicsTraining Manual. CIMMYT, Mexico.
Cooper, P.J.M. (1999) Agroforestry: learning aswe go in Africa. In: Martin, G.J., Agama, A.and Leakey, R. (eds) Cultivating Trees. Peopleand Plants Handbook, 5. UNESCO, Paris,France, pp. 30–33.
Franzel, S. (1996) Collecting Data on Labour Usein On-Farm Trials. Training Note. ICRAF,Nairobi.
Franzel, S. (2001) Use of an indigenous boardgame, ‘bao’, for assessing farmers’ prefer-ences among alternative technologies. In:Peters, G.H. and Pingali, P. (eds) Tomorrow’sAgriculture: Incentives, Institutions,Infrastructure, and Innovations. Proceedingsof the International Agricultural EconomicsAssociation Conference, 13–18 August2000, Berlin, Germany. Ashgate, UK.
Franzel, S., Hitimana, L. and Akyeampong, E.(1995) Farmer participation in on-stationtree species selection for agroforestry: a casestudy from Burundi. ExperimentalAgriculture 31, 27–38.
Trees on Farms Ch2 16/2/02 11:57 am Page 34

Gladwin, C.H. (1989) Ethnographic Decision TreeModeling. Sage, Newbury Park, California.
Haverkort, B., van der Kamp, J. and Waters-Bayer, A. (eds) (1991) Joining Farmers’Experiments: Experiences in ParticipatoryTechnology Development. IntermediateTechnology Publications, London.
Hildebrand, P.E. and Russell, J.T. (1996)Adaptability Analysis. A Method for theDesign, Analysis and Interpretation of On-Farm Research-Extension. Iowa StateUniversity Press, Ames, Iowa.
ICRAF (1997) Annual Report 1996. Nairobi.Kristjanson, P., Place, F., Franzel, S. and Thornton,
P.K. (2002) Assessing research impact onpoverty: the importance of farmers’ perspec-tives. Agricultural Systems (in press).
Kwesiga, F.R., Franzel, S., Place, F., Phiri, D. andSimwanza, C.P. (1999) Sesbania sesbanimproved fallows in eastern Zambia: theirinception, development, and farmer enthu-siasm. Agroforestry Systems 47, 49–66.
Lightfoot, C. (1987) Indigenous research andon-farm trials. Agricultural Administration24, 1–11.
Little, T.M. and Hills, F.J. (1972) StatisticalMethods in Agricultural Research. Universityof California Press, Davis, USA.
Mutsaers, H.J.W., Weber, G.K., Walker, P. andFisher, N.M. (1997) A Field Guide for On-Farm Experimentation. IITA/CTA/ISNAR,International Institute of TropicalAgriculture, Ibadan, Nigeria.
Okali, C., Sumberg, J. and Farrington, J. (1994)Farmer Participatory Research. Rhetoric andReality. Intermediate TechnologyPublications, London.
Rocheleau, D.E. (1991) Participatory research inagroforestry: learning from experience andexpanding our repertoire. AgroforestrySystems 15, 111–138.
Scherr, S.J. (ed.) (1991a) On-farm agroforestryresearch. Agroforestry Systems Special Issue15(1–2), 2–3.
Scherr, S.J. (1991b) On-farm research: the chal-lenges of agroforestry. Agroforestry Systems15(1–2), 95–110.
Scherr, S.J. (1991c) Methods for Participatory On-Farm Agroforestry Research: SummaryProceedings of an International Workshop.International Center for Research inAgroforestry, Nairobi.
Scherr, S.J. (1995) Economic analysis of agro-forestry systems: the farmers’ perspective.In: Current, D., Lutz, E. and Scherr, S.J.(eds) Costs, Benefits and Farmer Adoption ofAgroforestry: Project Experience in CentralAmerica and the Caribbean. World BankEnvironment Paper No. 14. The WorldBank, Washington, DC, pp. 28–44.
Shepherd, K., Swinkels, R. and Jama, B. (1994)A question of management: the pros andcons of farmer- and researcher-managed tri-als. Agroforestry Today 6(4), 3–7.
Sperling, L., Loevinsohn, M.E. and Ntabomvura,B. (1993) Rethinking the farmers’ role inplant breeding: local bean experts and on-station selection in Rwanda. ExperimentalAgriculture 29(4), 509–518.
Stroud, A. (1993) Conducting On-FarmExperiments. CIAT, Cali, Colombia.
Tripp, R. and Wooley, J. (1989) The PlanningStage of On-Farm Research: IdentifyingFactors for Experimentation. CIMMYT/CIAT, Mexico; Cali, Colombia.
Upton, M. (1987) African Farm Management.Cambridge University Press, Cambridge,UK.
van Veldhuizen, L., Waters-Bayer, A. and deZeeuw, H. (1997) Developing Technologywith Farmers: a Trainers Guide forParticipatory Learning. Zed Books,London.
Zandstra, H.G., Price, E.C., Litsinger, J.A. andMorris, R.A. (1981) A Methodology for On-Farm Cropping Systems Research.International Rice Research Institute, LosBaños, Philippines.
Assessing Agroforestry Adoption Potential 35
Trees on Farms Ch2 16/2/02 11:57 am Page 35

Trees on Farms Ch2 16/2/02 11:57 am Page 36

Summary
Declining soil fertility is a key problem faced by farmers in eastern Zambia. This chap-ter assesses farmers’ experiences of testing improved tree fallows in participatory on-farm trials to increase soil fertility. It also highlights the development of an adaptiveresearch and dissemination network of institutions and farmer groups for testing anddisseminating improved fallows. Sesbania sesban and Tephrosia vogelii performed well,but Cajanus cajan was discontinued because it was browsed heavily by livestock. Theeconomic analysis compared a 2-year improved fallow, followed by maize cropped for3 years, with fertilized and unfertilized continuously cropped maize. Over a 5-yearperiod, farmers used 11% less labour on the improved fallow plot than on unfertilizedmaize, but harvested 83% more maize. Improved fallows had higher returns to landand to labour than continuously cropped unfertilized maize; returns compared to fer-tilized maize were mixed. Farmer interest is strong, as the number of farmers plantingimproved fallows has increased from under 20 in 1993–1994 to roughly 10,000 in2000. Key elements contributing to the progress made thus far include: (i) effectivediagnosis of farmers’ problems and screening of potential solutions; (ii) farmer partici-pation in the early stages of testing of improved fallows; (iii) testing of a range of man-agement options by farmers and researchers, and encouraging farmers to innovate; and(iv) development of an adaptive research and dissemination network.
Introduction
Land depletion and declining soil fertility are viewed increasingly as critical prob-lems affecting agricultural productivity and human welfare in tropical Africa
Assessing the AdoptionPotential of Improved
Fallows in Eastern ZambiaS. FRANZEL,1 D. PHIRI2 AND F. KWESIGA3
1International Centre for Research in Agroforestry, ICRAF House,PO Box 30677, Gigiri, Nairobi, Kenya; 2World Vision Integrated
Agroforestry Project, PO Box 510948, Nairobi, Kenya; 3SADC-ICRAFRegional Agroforestry Programme, PO Box MP 128, Mount Pleasant,
Harare, Zimbabwe
© CAB International 2002. Trees on the Farm (eds S. Franzel and S.J. Scherr) 37
3
Trees on Farms Ch3 22/2/02 11:44 am Page 37

(Cooper et al., 1996; Sanchez et al., 1997). Much attention has focused on biologi-cal technologies, such as agroforestry, for solving these problems because of theincreasing costs of inorganic fertilizers, their limited availability and the need toincrease soil organic matter and improve soil structure. Improved tree fallows, theenrichment of natural fallows with trees to improve soil fertility, are a promisingagroforestry practice for small-scale farmers and are being tested at many sitesthroughout the tropics.
There is considerable evidence from many areas that farmers use leguminoustrees on fallow plots for improving soil fertility (Raintree and Warner, 1986). Butthere is little evidence that farmers have benefited from researchers’ efforts to buildupon the performance of farmers’ traditional practices, or from efforts to introduceimproved tree fallows in areas where farmers are unfamiliar with them.
In 1987, following farmer surveys that highlighted the soil fertility problem(Zambia/ICRAF, 1988), the Zambia/ICRAF Agroforestry Research Project beganresearch at Msekera Research Station, Chipata, Eastern Province, Zambia, on improvedfallows to increase crop production. In on-station trials, improved fallows usingSesbania sesban seedlings transplanted from nurseries greatly increased maize yields(Kwesiga and Coe, 1994; Kwesiga et al., 1999). Moreover, economic analysis showedthat 2-year improved fallows were likely to be profitable for small-scale farmers (Place etal., 1995). Species that can be established directly from seed, such as Tephrosia vogeliiand Cajanus cajan, have also been tested on station, with encouraging results (Kwesigaet al., 1995). Farmer experimentation began in 1992–1993 and 1993–1994 with fivefarmers, and involved 204 farmers in 1994–1995 and about 3000 in 1996–1997.
The objective of this chapter is to assess the adoption potential of improvedtree fallows in Eastern Province, based on farmers’ experiences. We examine:
1. Feasibility: the degree to which farmers are able to manage the technology, thatis, whether they have the required information, are able to plant and maintain thefallows, and cope with any problems that arise.2. Profitability: whether the financial benefits obtained are greater than the costsincurred and how the benefits compare with farmers’ alternative practices.3. Farmer interest: farmers’ views and actions to expand testing and use of the practice.4. Institutional support: particularly the adaptive research and dissemination net-work that has emerged for evaluating and extending improved fallows.
First, the study area is described and the design of the trials and monitoring surveysare examined. Next, results from the trials are discussed and the strategy for institu-tional support is examined. Finally, conclusions are drawn.
Methods
Study area
The plateau area of eastern Zambia is characterized by a flat to gently rolling land-scape and altitudes ranging from 900 to 1200 m (Fig. 3.1). Seasonally waterlogged,
38 S. Franzel et al.
Trees on Farms Ch3 22/2/02 11:44 am Page 38

low-lying areas, known locally as dambos, are also common. The main soil types areloamy sand or sand Alfisols, interspersed with clay and loam Luvisols. The Alfisolsare well-drained and relatively fertile but have low water and nutrient-holdingcapacities (Zambia/ICRAF, 1988; Raussen et al., 1995). Rainfall averages about1000 mm year−1, with about 85% falling in 4 months, December–March. Rainfallis highly variable; the area received less than 600 mm in 2 of 8 years between 1990and 1997. The growing season lasts for about 140–155 days. Average air tempera-tures range from 15 to 18°C during June–July to 21–26°C in September–October(Zambia/ICRAF, 1988).
Population density varies between 25 and 40 persons km−2. About half of thefarmers practice ox cultivation, the others cultivate by hand-hoe. Average croppedland ranges from 1.1–1.6 ha for hoe cultivators to 2.3–4.3 ha for ox cultivators.The two groups are mixed amongst each other and grow similar crops, though oxcultivators tend to use more purchased inputs. Maize is the most important cropaccounting for about 60–80% of total cultivated area. Other crops include sun-flower, groundnuts and cotton. Average numbers of cattle per household range from1.5 to 3, depending on the district, and goats are also common. The main ethnicgroups are the Chewa and the Ngoni. Rural households are concentrated in villagesettlements of up to 100 homesteads, a legacy of government-sponsored villageregrouping programmes (Zambia/ICRAF, 1988; ARPT, 1991; Celis and Hollaman,1991; Jha and Hojjati, 1993; FSRT, 1995; Peterson et al., 2000).
Assessing Improved Fallows Adoption Potential 39
Kasama
Chipata
Lusaka
Kabwe
Western
Southern
NorthWestern
Central
Copperbelt
Northern
Lusaka
Eastern
Luapula
N
100 0 100 200 kilometers
Fig. 3.1. Eastern Province, Zambia.
Trees on Farms Ch3 22/2/02 11:44 am Page 39

Farmer surveys have identified declining soil fertility as one of farmers’ mainperceived problems (Zambia/ICRAF, 1988; ARPT, 1991). Nitrogen deficiency wasjudged to be the most important problem responsible for low maize yields.Increased pressure on land has reduced fallow periods, farmers’ main method formaintaining soil fertility, to 1–3 years. Many farmers even practise continuous crop-ping while having land in ‘reserve fallow’ that they have never cultivated(Zambia/ICRAF, 1988; Peterson et al., 2000). Fertilizer use was common duringthe 1980s but the cessation of subsidies caused the ratio between the price of nitro-gen and the price of maize to increase from 3.1 in 1986/87 to 11.3 in 1995/96.Fertilizer use in Zambia declined by 70% between 1987/88 and 1995/96 (Howardet al., 1997) and the decline in the smallholder sector was even greater.
Trial design
In 1992/1993 and 1993/1994, five farmers established type 31 (farmer-designed,farmer-managed) improved fallow trials, using sesbania seed or bare-rooted or pot-ted seedlings obtained from researchers. The objective of the trials was to give farm-ers the opportunity to experiment with improved fallows, to assess their ability toestablish and maintain improved fallows, and to obtain their assessment of the prac-tice. Farmers were advised on how to manage improved fallows and they eachdesigned their own trial, planting the trees where and how they wished on theirfarms. Spacing averaged 1 m × 1 m (10,000 trees ha−1) and plot size ranged from400 m2 to 800 m2. In the third year of the trial, farmers were given fertilizer to useon an adjacent plot of 200 m2, so as to be able to compare the post-fallow maizeyield with yields of fertilized maize. A non-fertilized maize plot was also identifiedfor the comparison.
In 1994/95, 157 farmers planted type 2 (researcher-designed, farmer-managed)trials. The farmers selected one of six improved fallow technologies to plant: sesba-nia, tephrosia or cajanus as well as the same three species intercropped with maizeduring fallow establishment in the first year and then allowed to grow into a purestand fallow in the second year. Sesbania was planted using bare-rooted seedlings;tephrosia and cajanus were planted by direct seeding. Bare-rooted seedlings wereinoculated with rhizobia from the already established stands of sesbania at farmer-training centres or on farm. The treatments included:
● the improved fallow plot (pure stand or intercropped with maize) in a 400 m2
plot – trees were planted at a density of 0.9 m × 0.75 m or 14,763 trees ha−1,whether in pure stand or intercropped with hybrid maize;
● unfertilized maize in a 200 m2 plot;
40 S. Franzel et al.
1 Type 1 on-farm trials are researcher-designed and researcher-managed and are similar totrials done on station. Type 2 trials are researcher-designed and farmer-managed. Type 3trials are farmer-designed, farmer-managed, that is, farmers experiment as they wish andthus may not have control plots (see Chapter 2).
Trees on Farms Ch3 22/2/02 11:44 am Page 40
● maize fertilized at the recommended level, 112–40–20 kg N–P–K per hectare,in a 200 m2 plot.
Maize was planted at the recommended density of 75 cm × 30 cm, whether in purestand or intercropped, giving a density of 44,444 plants ha−1. When intercropped,trees and maize were planted in the same rows, to permit space for weeding betweenthe rows. The project supplied hybrid maize seed and fertilizer for the maize plotsand farmers supplied labour for all of the operations. Farmers were advised to man-age the plots uniformly in order to ensure that the results among them would becomparable. They agreed to continue growing maize on the maize plots for 5 years.2
On the improved fallow plots, farmers agreed to maintain the trees for 2 years, andto then cut them down, incorporate the leafy biomass, and plant maize in the third,fourth and fifth years.
In 1995/96, 35 type 2 trials were added, primarily to assess the effects of differ-ences among seasons on the improved fallows. The sample was stratified by technol-ogy and included 12 farmers with sesbania in pure stand, 13 with tephrosia in purestand, 4 with intercropped sesbania and 6 with intercropped tephrosia. Cajanus wasomitted because of the browsing problems the previous year.
Type 3 trials, in which farmers experimented on their own with improved fal-lows, expanded greatly, from 37 farmers in 1994/95 to about 800 farmers in1995/96 and about 3000 in 1998. Farmers received no incentives for experiment-ing with improved fallows.
Overall, the on-farm experimentation programme was designed to providefarmers with different options for testing. Table 3.1 shows that by 2000, five ofeight variants of the technologies were being used by farmers; three had beenrejected.
Monitoring and analysis
Monitoring surveys were conducted by a researcher, a technician and collaboratingextension staff. Data were collected on labour use and other costs from selected type2 and type 3 farmers; these were supplemented by data from other farmers, localmarkets and secondary sources (Appendix 3.1). Enterprise costs and returns weredrawn up for each farm and used to calculate net present values per hectare to assessreturns to land (in which household labour is valued) and net returns per work dayto assess returns to labour (in which household labour is not valued). The analysiscovered a period of 5 years: 2 years of fallow and the 3 subsequent years for which itis assumed that maize yields would be affected. Maize yields following sesbania fal-lows were available for five farmers for 1996 and seven farmers for 1997. Averagedata on costs were used in each individual farmers’ budget; maize yield figures werespecific to each farm. Since data on maize yields during the second and third years
Assessing Improved Fallows Adoption Potential 41
2 Maize yields in the control plots were approximately equal to average maize yields in thearea.
Trees on Farms Ch3 22/2/02 11:44 am Page 41

42 S. Franzel et al.
Tab
le 3
.1.
Impr
oved
fallo
w p
ract
ices
test
ed b
y fa
rmer
s.
Ses
bani
a se
sban
Teph
rosi
a vo
gelii
Caj
anus
caj
anG
liric
idia
sep
ium
Pot
ted
seed
ling
Bar
e-ro
ot s
eedl
ing
Dire
ct s
eede
dD
irect
see
ded
Bar
e-ro
ot s
eedl
ing,
Year
Pur
e st
and
Pur
e st
and
Inte
rcro
pped
Pur
e st
and
Inte
rcro
pped
Pur
e st
and
Inte
rcro
pped
inte
rcro
pped
91–9
2*
92–9
3*
**
**
93–9
4*
**
**
94–9
5*
**
**
*95
–96
**
**
96–9
7*
**
*97
–98
**
**
*98
–99
**
**
*99
–00
**
**
*
Trees on Farms Ch3 22/2/02 11:44 am Page 42

following improved fallows were not available from on-farm trials, data on the per-centage decline in the maize yield response from on-station trials, 30% for the sec-ond year and 60% for the third year, were used in the analysis. Where cost was afunction of yield, as in the case of harvesting labour, costs were adjusted in relationto yield. Sensitivity analysis was conducted to show the effects of changes in para-meters on the results of the economic analysis. A semi-structured survey was con-ducted following the first post-fallow maize harvest, to assess farmers’ experiencesand opinions.
Farm models using the Microsoft Excel Program were drawn up to assess theimpact of adopting improved fallows on maize income. Models were drawn up forthe same three scenarios as for the enterprise budgets: farms that adopt improvedfallows, farms that cultivate unfertilized maize and those with fertilized maize.
For the 157 type 2 farmers planting in 1994/95, four subsamples were sur-veyed during the first 2 years:
1. Three months after the 1994/95 planting, a survey assessed survival rates andproblems inhibiting tree survival and growth. The survey included 110 of the 157farmers; sample farmers were chosen on the basis of their accessibility.2. Six months after planting, maize yields were measured on 20 farms to assess theeffects of intercropping trees with maize on maize yields.3. One year after planting, a questionnaire survey was conducted of the 68 farmerswho had achieved high survival rates, that is, rates of over 60% in the first survivalsurvey, and were thus expected to have successful improved fallows.3 The samplewas stratified by technology. Farmers were interviewed concerning their manage-ment of the improved fallows and problems encountered.4. Two years after planting, 31 farmers with low survival rates, that is, rates below60% 6 months after planting, were interviewed to find out whether they had con-tinued with their experiments and whether they had started new ones.
The 35 type 2 farmers planting in 1995/96 were surveyed 6 months afterplanting, using a questionnaire, to assess their experiences and problems theyencountered.
A random sample of 65 of the roughly 800 type 3 farmers planting in 1995/96was surveyed 6 months after planting, using a questionnaire, to assess their experi-ences.
For assessing the uptake of improved fallows by gender and wealth group, acensus of households was conducted in 1998 in four villages where substantial pro-portions of farmers were planting improved fallows. Community members con-ducted a ‘wealth ranking exercise’, in which they defined the different wealth groups– well off, fairly well off, poor and very poor – and classified households into thegroups (Phiri et al., 2001).
Assessing Improved Fallows Adoption Potential 43
3 We estimated that for sesbania a minimum survival rate of 60%, 6 months after planting,would ensure a survival rate of at least 30% at the time of cutting the trees, and that 30%was the minimum required to obtain benefits. For tephrosia and cajanus, the minimum ishigher, about 40%, because these species do not have as wide a canopy.
Trees on Farms Ch3 22/2/02 11:44 am Page 43

Results
Feasibility
In the five type 3 trials planted in 1992/93 and 1993/94, the farmers represented arange of types of farmers found in the area: three were male, while two were femaleheads of households; two were considered to be of high income, one middleincome, and two low income. Two farmers used oxen for land preparation whilethree used hoes, and three were on Alfisols while two had Luvisols. Four of the fivefarmers were able to establish dense sesbania fallows. Lack of weeding and bushfires, which are common during the dry season, constrained tree growth on the fifthfarm. One female farmer made an important modification in the technology, inter-cropping trees with maize during the first year of establishment, that was later testedby researchers and is now used on a wide scale by many farmers.
In the type 2 trials planted in 1994/95, sesbania was the most popular species,planted by 42% of the farmers. Tephrosia was planted by 34% and cajanus by 22%.Most (83%) planted their trees in pure stand whereas 17% intercropped them withmaize during the season of establishment.
Survival rates were used in this and other trials as rough indicators of the feasi-bility of planting improved fallows. Tree survival and growth were hampered by theseason’s low rainfall, 580 mm. Overall mean survival rates 3 months after plantingwere highest for tephrosia, 74% (standard deviation (SD) = 27) in pure stands.Survival rates for cajanus averaged 68% (SD = 19), and for sesbania, 58% (SD = 28).The higher survival rates of tephrosia and cajanus were associated with the relativeease in ‘gapping up’ directly seeded species as compared with bare-rooted seedlings,which become either in short supply or too large for successful transplanting as theseason advances.
Farmers cited dry spells of up to 2 weeks early in the season as the principalreason for low survival (Table 3.2). Other important problems affecting survivaland growth, noted by farmers and technicians, included weed competition, live-
44 S. Franzel et al.
Table 3.2. Reasons for low survival of tree seedlings on 33 farms with survivalrates lower than 60%, 3 months after planting, 1996.a
Number of farmers
Problem Sesbania Tephrosia Cajanus Total
Dry spells 12 1 3 16Weeds 6 0 0 6Browsing 1 3 1 5Poor germination 0 1 4 5Seedlings remaining 5 0 0 5too long in nursery
Number of farmers 20 5 8 33
aReasons as given by research staff or farmers. In some cases more than oneresponse was given, thus numbers in columns do not sum to column totals.
Trees on Farms Ch3 22/2/02 11:44 am Page 44

stock browsing, low germination (particularly with cajanus), and sesbania seedlingsremaining too long in the nursery (in part, because of the late start of the rain).Lack of experience also affected performance, as this was the first time that most ofthe farmers had ever planted tree nurseries or transplanted bare-rooted seedlings.
In the survey of farmers with high survival rates, two-thirds had gapped up orreplanted seedlings. Fifteen per cent did so twice. As is common in years of poorrainfall, many farmers had to replant their maize as well.
During the 1995/96 dry season (March–November), there was a significantreduction in the mean survival rates for all species because of moisture stress anduncontrolled communal grazing. A paired comparison of survival rates 3 monthsand 1 year after planting showed that sesbania ranked highest in its ability to with-stand the long dry season. On 19 farms that had high survival rates on pure standsof sesbania, survival dropped from 81% at 3 months to 63% after 1 year. Tephrosiasurvival dropped from 91% to 51% (15 farms) and cajanus from 72% to 21% (13farms). Because cajanus was so heavily browsed, it was discontinued from on-farmtrials the following year. The differences in the reduction in survival rates amongthe species were significant at P = 0.01.
Intercropping appeared to reduce tree survival and maize yields, probablybecause of competition for resources, especially for moisture in a dry year. Seedlingsurvival rates 3 months after planting in intercropped fields were 9–13 percentagepoints lower than for seedlings planted in pure stands, depending on the species.The proportion of farmers achieving survival rates over 60% was generally higherfor pure stands than for intercropped trees (Table 3.3). Furthermore, the dry seasonhad a greater negative impact on intercropped trees than those in pure stands. Forexample, whereas the survival rate of tephrosia in pure stand declined by 44%between 3 and 12 months, intercropped tephrosia declined by 59%. Trees plantedin pure stand grew more vigorously because of the lack of competition for resourcesby maize, and were thus better able to develop a deep rooting system, necessary towithstand the long dry season. Moreover, intercropped trees were more susceptibleto trampling by livestock, which feed on the crop residues remaining after harvest.
Assessing Improved Fallows Adoption Potential 45
Table 3.3. Proportion of farmers with survival rates greater than 60%, 3 monthsafter planting, 1996.
Species and % farmers with % farmers with Number ofarrangement survival rates >60% survival rates <60% farmers
Sesbania pure 50 50 40Tephrosia pure 74 26 23Cajanus pure 72 28 9Sesbania intercropped 40 60 18
with maizeTephrosia intercropped 100 0 10
with maizeCajanus intercropped 44 56 9
with maizeTotal 62 38 110
Trees on Farms Ch3 22/2/02 11:44 am Page 45

Data from on-farm trials also suggested that intercropping reduced maizeyields during the season of establishment by 18–28%, depending on the species.But because of high variability, differences in maize yields between pure stand andintercropping were not significant for any of the tree species.
As 1995/96 was a season of average rainfall, survival rates were considerablyhigher than in 1994/95. Overall, 80% of the type 2 farmers planting pure-standsesbania in 1995/96 and 84% growing pure-stand tephrosia achieved high survivalrates, that is, rates over 60%. Intercropping did not appear to affect survival nega-tively, as three of four intercropping sesbania and five of six intercropping tephrosiaalso achieved acceptable survival rates. Only 46% needed to replant or gap up.
There was also a marked reduction in the numbers of farmers reporting prob-lems. Twelve of 19 tephrosia growers and 3 of 16 sesbania growers reported thatthey did not experience any problems. The mesoplatys beetle (Mesoplatys ochroptera)was the most frequently cited problem affecting sesbania. Our observations indi-cated that, in most cases, trees once established were able to recover fully after a bee-tle attack, even without being sprayed. No other problem was mentioned by morethan four farmers. All but one farmer weeded their plots; half weeded two or threetimes.
The results in the type 3 trials during the same year were somewhat lessfavourable. Ninety-five per cent of the tephrosia growers and 61% of sesbania grow-ers had survival rates over 50%. Nursery management and transplanting techniqueswere suboptimal, probably because sesbania growers in type 3 trials received lesstraining than those in type 2 trials. Farmers with pure stands of sesbania andtephrosia had slightly higher survival rates than those who intercropped. The prob-lems reported by type 3 farmers were similar to those reported by type 2 farmers.
Performance was also assessed by soil type. Survival rates after 6 months didnot vary between Luvisols and Alfisols. But mean survival rates after 12 months,that is, after the long dry season, were significantly lower on the Alfisols fortephrosia (41% versus 75%, P < 0.05), because Alfisols are lighter than Luvisols andretain less moisture. Tephrosia and cajanus were less able than sesbania to survivethe long dry season because they are direct seeded and are thus less able to developan extensive root system. Moreover, cajanus and, to a lesser extent, tephrosia weresubject to browsing during the dry season.
The last management task, cutting the trees, was not a serious problem forfarmers for three reasons. First, the trees were cut during the dry season before landpreparation begins, a slack period for farmers. Secondly, sesbania and, in particular,tephrosia were easier to fell than other trees. Thirdly, females traditionally clear bushfallows, so the task of cutting trees is not new to them, as it is in other countries.
The above analyses assess feasibility of improved fallows on very small plots;but will farmers be able to manage them on a scale needed to maintain fertility ontheir entire farms? A family manually cultivating 1.2 ha needs to plant 0.27 haimproved fallow each year, assuming they crop for 3 years following each 2-year fal-
46 S. Franzel et al.
Trees on Farms Ch3 22/2/02 11:44 am Page 46
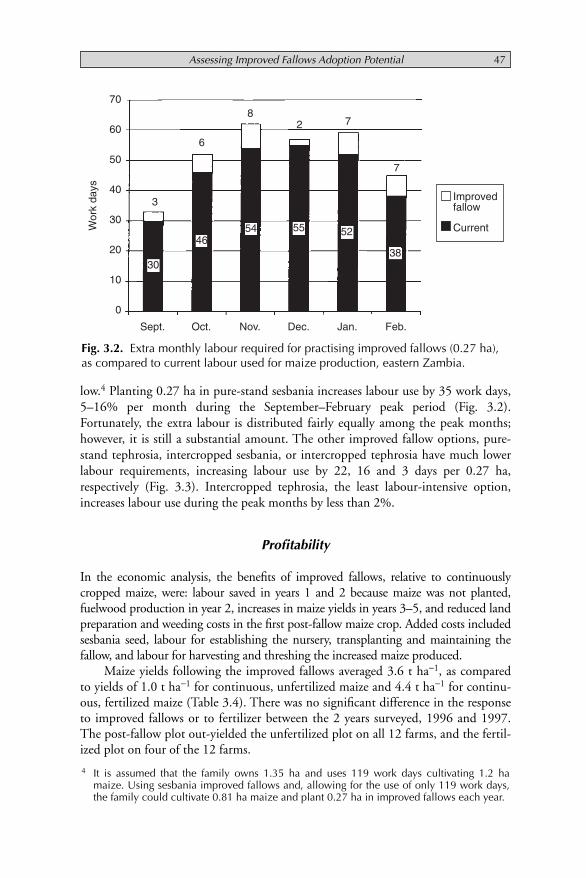
low.4 Planting 0.27 ha in pure-stand sesbania increases labour use by 35 work days,5–16% per month during the September–February peak period (Fig. 3.2).Fortunately, the extra labour is distributed fairly equally among the peak months;however, it is still a substantial amount. The other improved fallow options, pure-stand tephrosia, intercropped sesbania, or intercropped tephrosia have much lowerlabour requirements, increasing labour use by 22, 16 and 3 days per 0.27 ha,respectively (Fig. 3.3). Intercropped tephrosia, the least labour-intensive option,increases labour use during the peak months by less than 2%.
Profitability
In the economic analysis, the benefits of improved fallows, relative to continuouslycropped maize, were: labour saved in years 1 and 2 because maize was not planted,fuelwood production in year 2, increases in maize yields in years 3–5, and reduced landpreparation and weeding costs in the first post-fallow maize crop. Added costs includedsesbania seed, labour for establishing the nursery, transplanting and maintaining thefallow, and labour for harvesting and threshing the increased maize produced.
Maize yields following the improved fallows averaged 3.6 t ha−1, as comparedto yields of 1.0 t ha−1 for continuous, unfertilized maize and 4.4 t ha−1 for continu-ous, fertilized maize (Table 3.4). There was no significant difference in the responseto improved fallows or to fertilizer between the 2 years surveyed, 1996 and 1997.The post-fallow plot out-yielded the unfertilized plot on all 12 farms, and the fertil-ized plot on four of the 12 farms.
Assessing Improved Fallows Adoption Potential 47
70
60
50
40
30
20
10
0
Wor
k da
ys
Sept. Oct. Nov. Dec. Jan. Feb.
3
6
82 7
7
30
4654 55 52
38
Improvedfallow
Current
Fig. 3.2. Extra monthly labour required for practising improved fallows (0.27 ha),as compared to current labour used for maize production, eastern Zambia.
4 It is assumed that the family owns 1.35 ha and uses 119 work days cultivating 1.2 hamaize. Using sesbania improved fallows and, allowing for the use of only 119 work days,the family could cultivate 0.81 ha maize and plant 0.27 ha in improved fallows each year.
Trees on Farms Ch3 22/2/02 11:44 am Page 47

Results of the economic analysis of the 12 farms, using average values acrossfarms, are summarized in Table 3.5; the detailed budgets for improved sesbania fal-lows and fertilized and unfertilized maize are shown in Appendix 3.1. Over a 5-yearperiod, a hectare of improved fallows required 11% less labour than a hectare ofunfertilized maize and 32% less labour than fertilized maize. Relative to unfertilizedmaize, the improved fallow increases total maize production per hectare over the 5-year period by 77%, even though it does not produce maize during the first 2 yearsof the fallow. But fertilized maize gives the highest 5-year maize yield, 2.5 times thatof improved fallows. The value of fuelwood produced in the fallow was low, onlyabout 3% of the value of maize following the improved fallow.5
For economic data, two scenarios are presented, one using prices for a year fol-lowing a bumper harvest when prices were low (1996) and one following a poor har-vest when prices were high (1998). Values in both years are expressed in 1998 USdollars, taking into account inflation between 1996 and 1998. In the analysis ofreturns to land using 1996 prices, net present values (NPVs) per hectare for fertilizedmaize were over 30% higher than those of improved fallows; both were much higherthan for unfertilized maize. Six of the 12 farmers obtained higher NPVs forimproved fallows than for fertilized maize; 11 obtained higher NPVs for improvedfallows than for unfertilized maize. Using 1998 prices, NPVs for fertilized maize wereover double those for improved fallows, because of the much higher maize prices.
A main disadvantage of improved fallows relative to continuous maize is thatfarmers have to wait until after the fallow to recoup their investment; in continuousmaize farmers earn positive net benefits in the first year. The payback period, that is,
48 S. Franzel et al.
40
35
30
25
20
15
10
5
0
36
22
16
3
Wor
k da
ys/0
.27
ha
Sesbaniapure stand
Tephrosiapure stand
Sesbaniaintercropped
Tephrosiaintercropped
Fig. 3.3. Extra labour (work days/0.27 ha) for different improved fallows options.
5 The value of sesbania wood varies: in some areas, farmers burn the wood in the field to getrid of it, whereas in other areas, they carry it to the homestead to use as fuelwood.
Trees on Farms Ch3 22/2/02 11:44 am Page 48

the period required for improved fallows to yield higher cumulative net present val-ues than unfertilized maize, was 3 years for 10 of the 12 farmers. This indicates thateven without residual maize yield increases during the second and third post-fallowmaize harvests, improved fallows were still more profitable than unfertilized maizefor 10 of the 12 farmers.
Assessing returns to labour is more relevant to most Zambian farmers thanreturns to land, because labour tends to be scarcer than land. On returns to labour,improved fallows outperformed unfertilized maize by a wide margin and fertilizedmaize narrowly, using average values across the 12 farms and 1996 prices (Table3.5). Improved fallows gave higher net returns to labour than for unfertilized maizeon 11 of the 12 farms and higher net returns to labour than for fertilized maize on8 of the 12 farms. Even assuming no maize yield response to improved fallows inyear 4 and year 5, returns to labour on improved fallows were higher than those forunfertilized maize on 10 of 12 farms. Using 1998 prices, fertilized maize had higherreturns to labour than improved fallows. In summary, improved fallows had muchhigher returns to land and labour than unfertilized maize but lower returns to landthan fertilized maize. On returns to labour, the improved fallows did better using1996 prices while fertilized maize did better using 1998 prices.
The performance of improved fallows relative to continuous, unfertilized maizeis fairly stable under a wide range of possible changes in parameters (Table 3.6). Forexample, improved fallows have returns to land and labour at least double those of
Assessing Improved Fallows Adoption Potential 49
Table 3.4. Maize yield (kg ha−1) following 2-year Sesbania sesban improved fal-lows, as compared to yields in continuous unfertilized and fertilized maize, type 2and type 3 trials, 1996 and 1997.
II. MaizeI. Continuous following III. Continuousunfertilized improved fertilized
maize fallow maize Ratio: II/I
Phiri Tikozenji 440 3000 2860 6.8Isaac Phiri 1310 4720 3630 3.6Whyson Mbewe 2200 5010 5100 2.3Harrison Chogwe 960 3790 4580 3.9Maine Mwale 700 3560 4150 5.1Lazarus Mwanza 970 2760 6570 2.8Peniyas Tembo 190 1420 2820 7.5T.Phiria 1300 2300 5100 1.8Z. Mwanza 300 4400 3700 14.7M. Jere 1100 3500 4200 3.2P. Nthani 800 4800 4200 6.0J. Zulu 1300 4400 5700 3.4Mean 964 3638 4384 3.8SD 548 1108 1108
aFallow period was for 3 years.
Trees on Farms Ch3 22/2/02 11:44 am Page 49

unfertilized maize under most tested changes, including a 500 kg decline in post-fallow maize yields, and 50% increases or decreases in the discount rate, and theprices of fertilizer and labour. An increase in post-fallow maize yield of only 1.1 tha−1 is needed in the third year to cover the costs of establishing and maintainingthe fallow, relative to unfertilized maize, in terms of returns to land or labour.
In contrast, the performance of improved fallows relative to continuous, fertil-ized maize is sensitive to changes in key parameters (Table 3.6). Increases in maizeprices (such as between 1996 and 1998) raise the returns to fertilized maize at amuch faster rate than they raise the returns to improved fallows. Similarly, the rela-tive profitability of the two practices is highly sensitive to the price of fertilizer;reductions in fertilizer price greatly increase the profitability of fertilized maize rela-tive to improved fallows. Changes in the discount rate and in the cost of labour andseedlings have little effect on the performance of improved fallows relative to fertil-ized maize.
The risk of drought is critical for farmers in Zambia; unfortunately the effectsof drought in the season following an improved fallow cannot be assessed using thedata collected for this study. But there are four reasons why improved fallows arelikely to be much less risky than fertilized maize. First, in the event of a completecrop failure, a farmer using fertilizer would lose his investment in fertilizer, US$154ha−1, whereas a farmer with improved fallow would lose his investment in plantingand maintaining the trees, only about US$90 ha−1 (using 1998 prices). In addition,both farmers would lose their investment in growing maize that year. Secondly,whereas nearly all of a farmer’s investment in fertilizer is in cash terms, improvedfallows require little or no cash input. The opportunity cost of cash is extremelyhigh, and in the case of the farmer buying fertilizer on credit, loss of the maize cropmay result in substantial losses in productive capacity in order to repay the loan.Thirdly, the benefits of improved fallow are likely to be spread over a 3-year period,
50 S. Franzel et al.
Table 3.5. Labour requirements, maize production, and returns to land andlabour of Sesbania sesban improved fallows and continuously cropped maizeover a 5-year period, using an average farm budget.a
Returns to land: Returns to labour:
Work Tons net present value net returns
days maize (US$ ha−1) (US$) per work day
Option ha−1 ha−1 1996 1998 1996 1998
Continuous 499 4.8 6 6 0.47 0.79unfertilized maize
Improved 2-year 441 8.5 170 215 1.11 1.64sesbania fallow
Continuous fertilized 645 21.9 229 544 1.04 2.18maize
aMeans of values from individual budgets of the 12 trial farmers were used.Monetary values for 1996 and 1998 are in 1998 constant US dollars adjusted forinflation. Details on budgets and coefficients are provided in Appendix 3.1.
Trees on Farms Ch3 22/2/02 11:44 am Page 50

whereas those of nitrogen fertilizer take place in a single year. Thus in the abovecase, where a farmer’s crop fails in the first post-fallow season, there is likely to be asubstantial response the following year. Fourthly, improved fallows appear toimprove the soil structure and organic matter content of the soil, thus enhancingthe soil’s ability to retain moisture during drought years.
The above analysis of profitability examines returns per hectare; but how willadoption of improved fallows affect farm income once they have been incorporatedinto the farming system? A farm household cultivating manually and having 1.4 haand 120 work days available for cultivating maize would earn US$262 year−1 usingfertilized maize, US$225 year−1 growing improved fallows, and only US$95 year−1
cultivating continuous maize without fertilizer (Table 3.7). Even if there is no resid-ual effect on maize yields in the third year following improved fallows, earnings arestill twice as high as on unfertilized maize.
Assessing Improved Fallows Adoption Potential 51
Table 3.6. Sensitivity analysis showing the effects of changes in parameters.a
Continuous Continuousunfertilized maize Improved fallows fertilized maize
Returns Returns Returns Returns Returns Returnsto land to labour to land to labour to land to labour
Base analysis 6 0.47 170 1.11 229 1.04Maize price + 50% 114 0.83 330 1.73 718 2.31Maize price − 50% −101 0.11 10 0.49 –260 –0.23Labour price + 50% −61 0.47 117 1.14 142 1.04Labour price − 50% 73 0.47 223 1.05 315 1.04Discount rate 30% 5 0.47 119 1.02 186 1.04
instead of 20%Discount rate 10% 8 0.47 246 1.20 290 1.04
instead of 20%Seedling cost + 50% 6 0.47 164 1.06 229 1.04Seedling cost − 50% 6 0.47 176 1.16 229 1.04Fertilizer price + 50% 6 0.47 170 1.11 –11 0.42Fertilizer price − 50% 6 0.47 170 1.11 469 1.66Yield response to 6 0.47 209 1.25 229 1.04
improved fallows+ 500 kg ha−1
Yield response to 6 0.47 131 0.96 229 1.04improved fallows− 500 kg ha−1
No response to 6 0.47 72 0.89 229 1.04improved fallow(years 4–5)
No response to 6 0.47 138 1.09 229 1.04improved fallow(year 5)
aValues are based on 1996 prices expressed in 1998 US dollars.
Trees on Farms Ch3 22/2/02 11:44 am Page 51

52 S. Franzel et al.
Tab
le 3
.7.
Far
m m
odel
s co
mpa
ring
net r
etur
ns to
labo
ur p
er y
ear
of a
1.4
ha
farm
pra
ctis
ing
Ses
bani
a se
sban
impr
oved
fallo
ws
with
farm
s cu
ltiva
ting
cont
inuo
us m
aize
, with
and
with
out f
ertil
izer
.a
Far
m p
ract
isin
g im
prov
ed fa
llow
s (f
arm
add
s 0.
28 h
a of
Far
m w
ith u
nfer
tiliz
ed m
aize
Far
m w
ith fe
rtili
zed
mai
zeim
prov
ed fa
llow
per
yea
r)(1
.2 h
a cu
ltiva
ted)
(0.9
2 ha
cul
tivat
ed)
Wor
kM
aize
Net
Wor
kM
aize
Net
Wor
kM
aize
Net
Are
ada
yspr
oduc
tion
retu
rns
days
prod
uctio
nre
turn
sda
yspr
oduc
tion
retu
rns
Cro
p(h
a)ye
ar−1
(kg
year
−1)
(US
$ ye
ar−1
)C
rop
(yea
r−1)
(kg
year
−1)
(US
$ ye
ar−1
)C
rop
year
−1(k
g ye
ar−1
)(U
S$
year
−1)
Fal
low
, 1st
yea
r0.
2831
00
Mai
ze12
011
5795
Mai
ze12
040
7726
2F
allo
w, 2
nd y
ear
0.28
10
1M
aize
1st
pos
t-0.
287
1026
97fa
llow
Mai
ze 2
nd p
ost-
0.28
3180
075
fallo
wM
aize
3rd
pos
t-0.
2830
573
52fa
llow
Tota
l1.
412
023
9022
5
Net
ret
urns
to la
bour
if m
aize
in th
e 3r
d po
st-
195
fallo
w s
easo
n yi
elds
the
sam
e as
on
the
farm
with
unf
ertil
ized
mai
ze
a Hou
seho
ld is
ass
umed
to
have
onl
y 12
0 w
ork
days
ava
ilabl
e du
ring
the
crop
ping
sea
son
for
mai
ze p
rodu
ctio
n; t
he a
mou
nt n
eede
d to
culti
vate
1.2
ha
mai
ze m
anua
lly w
ithou
t usi
ng fe
rtili
zer.
Cos
ts a
nd r
etur
ns a
re fr
om A
ppen
dix
3.1.
Impr
oved
fallo
ws
are
2 ye
ars
in le
ngth
and
are
follo
wed
by
3 ye
ars
of m
aize
cro
ps.
Trees on Farms Ch3 22/2/02 11:44 am Page 52

Farmer interest and innovation
Determining farmers’ interest in improved fallows is problematic, as 5 years arerequired for a full cycle of the technology, that is, 2 years of fallow and 3 years ofcropping. Moreover, farmers often state that they like a technology, even when theydo not, because they hope to obtain material or social benefits from interacting withfacilitators, or because of cultural taboos against criticism. Nevertheless, there isconsiderable evidence that farmer interest in improved fallows is extremely strong.First, there has been a rapid expansion in the number of farmers testing and usingthe technology: the number of type 3 trials, for which farmers receive no incentivefor planting the trees, rose from 37 in 1994–1995 to about 2800 in 1996–1997. By2000, roughly 10,000 farmers in Eastern Province were planting improved fallows.Secondly, most farmers planting the improved fallows continue to plant them: in astudy of 100 farmers planting improved fallows in 1996–1997 or earlier, 71% con-tinued to plant them over the following three seasons (Keil, 2001). Thirdly, evenfarmers with low survival rates have continued testing improved fallows on parts oftheir plots where survival was higher (71% of farmers with low survival rates) orhave planted new improved fallow plots the following year (32%).
The main intention of farmers in using the technology is undoubtedly toincrease returns to land and labour. But it is not clear how they will actually incor-porate the technology into their farming system. For example, in workshops to dis-cuss the potential impact of improved fallows, some expressed interest in rotatingimproved fallows around their farm, so that their supply of maize would be stableand all areas of their farm would benefit from the fallows. Some intended to use thetechnology to reduce their area cropped to maize, so as to be able to devote moreland to cash crops (Place, 1997).
Fuelwood availability varies considerably within the province and thus farmers’interest in using the trees for fuelwood is variable. Some claimed that the larger ses-bania trees were good substitutes for the fuelwood they collected from off the farm.Others mentioned that the quality of the wood was poor and that it was useful onlyas kindling. Tephrosia and cajanus produce lower-quality fuelwood than sesbania.
Farmers’ preferences between sesbania and tephrosia vary considerably. Maizeyields following sesbania fallows are generally higher than those following tephrosiafallows, but some farmers prefer tephrosia because it can be direct seeded and thusrequires less labour than sesbania. In type 2 trials in 1994/95, 42% chose sesbaniaand 30% tephrosia; in type 3 trials the following year 64% chose sesbania and 32%,tephrosia. By 2000, tephrosia had surpassed sesbania; 85% of farmers withimproved fallows were planting tephrosia while 69% were planting sesbania (Keil,2001).
Farmers’ innovations of the improved fallow technology have been one of themain elements contributing to its success. Two of the main technological options,bare-root seedlings instead of potted seedlings, and intercropping instead of plant-ing in pure stands, were innovations that farmers introduced in type 3 trials in theearly 1990s. In these trials, farmers were given potted seedlings grown at farmer-training centres, but to reduce the cost of transporting them to their farms, they
Assessing Improved Fallows Adoption Potential 53
Trees on Farms Ch3 22/2/02 11:44 am Page 53

removed the seedlings from the pots and carried them ‘bare-rooted’ in basins. Whenfarmers’ plantings of these seedlings proved successful, researchers conducted type 1trials to compare the performance of bare-rooted seedlings, grown in raisedseedbeds, with potted seedlings. They found no significant difference in perfor-mance and as potted seedlings were much more costly to produce, they were phasedout (Kwesiga et al., 1999).
The farmers’ second main innovation, intercropping during the year of treeestablishment, was also tested later in on-farm trials. The trials found that inter-cropping reduces maize yields and tree growth during the year of establishment, butmany farmers prefer it because it economizes on land and labour use relative toplanting in pure tree stands. Intercropping appears to be increasing; the percentageof farmers practising it rose from 17% during the planting of 1994/95 type 2 trialsto 42% in the 1995/96 type 3 trials.
Researchers have also noted several other farmer innovations. One farmerplanted seedlings into a bush fallow without preparing the land first. Anotherplanted sesbania seedlings behind the ox-plough; as the plough moved along anadjacent furrow, it covered the seedling roots with soil. Several farmers gapped uptheir sesbania fields with seedlings planted 1 year after the first planting. Severalplanted sesbania at weeding time into parts of fields where maize was performingpoorly. Some also tested the effect of improved fallows on crops other than maize,such as sunflower and groundnuts.
Gender and wealth
The data support the hypothesis that females were able to manage improved fallowsas well as males. In the type 3 trial planted in 1995/96, half of the participants werefemales and they had somewhat higher survival rates for sesbania than males. Forexample, 47% of females and 29% of males had survival rates for sesbania of over75%, 6 months after planting. For tephrosia, males had somewhat higher survivalrates. Males and females reported similar problems with similar frequency and didnot differ in the number of times they weeded their trees. But females had smallerplot sizes, 332 m2, as compared to 679 m2 for males. Since the same percentage ofmales and females stated that they had obtained enough planting material, itappears that females wanted smaller plots than males.
In the four villages where a census was conducted on the use of improved fal-lows in 1998, 32% of the male-headed households and 23% of the female-headedhouseholds had planted improved fallows. There was no significant difference acrossvillages between the two proportions. Moreover, whereas single females are oftendisadvantaged relative to female heads of household whose husbands live away(Bonnard and Scherr, 1994), the data showed that the same proportions of thesetwo groups were testing the technology. In fact, Peterson (1999) found a higherproportion of single females planting improved fallows than married females; thelatter needed permission from their husbands and thus were sometimes preventedfrom testing the practice.
54 S. Franzel et al.
Trees on Farms Ch3 22/2/02 11:44 am Page 54

As could be expected, there was an association between wealth level and plant-ing improved fallows (log linear model, P < 0.08). As wealth status declined, theproportion of farmers planting improved fallows also declined. Whereas 53% of thewell-off farmers planted fallows, 40% of the fairly well off, 22% of the poor and16% of the very poor planted fallows (Phiri et al., 2001). Interestingly, though, theproportion of farmers continuing to plant improved fallows after their first plantingdid not appear to vary by wealth status; 59% of the farmers in the well-off andfairly well-off groups expanded whereas 58% of the farmers in the poor and verypoor groups expanded (Peterson, 1999)
Institutional Support
In some areas of Eastern Province, the planting of improved fallows has spreadalmost spontaneously, that is, largely through the efforts of farmers without muchsupport from researchers or extension staff. For example, during the dry season,1995, a lorry load of 78 farmers arrived unannounced at Msekera Research Station.The farmers came from Kapinde, a village bordering a village having on-farm trials,and they had hired the truck to come to the station to learn about improved fal-lows. The farmers were members of self-help groups and were accompanied by theircamp officer. Project staff gave them a tour of the station and nearby on-farm trials.The farmers were given sesbania seed and instructions on raised-bed nursery meth-ods to produce bare-rooted seedlings. Several months passed without contact but inDecember, project staff went to visit the village, arriving unannounced. The campofficer quickly assembled some of the group leaders and accompanied Chipata staffto the nursery. It was well-managed, weed-free and well-watered, with 40,000seedlings ready for planting. Seventy-one farmers planted improved fallows usingseedlings from the nurseries.
But in most cases, substantial support, that is, training and planting material, isrequired. In the above case, Kapinde farmers had significantly lower survival ratesthan in nearby camps, probably because of less training and experience. TheZambia/ICRAF project has helped facilitate the establishment of an informal net-work to conduct adaptive research, training and facilitate dissemination ofimproved fallows (Fig. 3.4). The network has two functions: to provide coordinatedand analytical mechanisms for participatory monitoring and evaluation of on-farmresearch in improved fallows, and to act as a catalytic and action-oriented group forthe widespread dissemination of the technology. The network began when the pro-ject started supplying planting material, training, and information to extension ser-vices, development projects, NGOs and farmer groups that wanted to help theirmembers test improved fallows. In exchange, these organizations provided the pro-ject with feedback on the performance of the technology.
The network is based on the principle that adaptive research and extension arereally two sides of the same coin; once on-farm research has confirmed that a tech-nology has adoption potential, dissemination is already beginning. Researchers needto be involved to obtain feedback from farmers and extension staff on problems and
Assessing Improved Fallows Adoption Potential 55
Trees on Farms Ch3 22/2/02 11:44 am Page 55

56 S. Franzel et al.
FAR
ME
RS
AN
D F
AR
ME
R G
RO
UP
S
NG
Os
with
ow
n ex
tens
ion
staf
f
Ger
man
Te
ch.
Ser
vice
Luth
eran
W
orld
F
eder
atio
n
GR
Z
Ada
ptiv
e re
sear
ch p
lann
ing
team
s in
oth
er p
rovi
nces
Advic
e, tr
aini
ng, s
eed
Feed
back
on
perfo
rman
ce,
prob
lem
s
Advice, tr
aining, seed
Feedback on perfo
rmance
, problems
ICR
AF
-Z
AM
BIA
TE
AM
Visits to research station
Management of and feedback from on farm trials
-
Visits to research stations seed, training, allowances, training materials, Visits to other areas
Visits to research station,
training and training materials
General support
Gen
eral
sup
port
Freq
uent
pro
gres
s re
port
ssu
ppor
t, as
sista
nce
in
sup
ervis
ing
trial
s
Gen
eral
sup
port
Freq
uent
Org
. wor
king
thro
ugh
Gov
. of Z
ambi
a ex
tens
ion
serv
ice
NG
Os
Don
or p
roje
cts
GR
Z
Farm
er+
Farm
ervi
sits
Key
Oth
er o
rgan
izat
ions
test
ing
impr
oved
fa
llow
s ou
tsid
e E
aste
rn P
rovi
nce
Oth
er o
rgan
izat
ions
test
ing
impr
oved
fa
llow
s in
Eas
tern
Pro
vinc
e
Prio
rity
area
s re
quiri
ng a
dditi
onal
sup
port
Ext
ensi
on s
ervi
ce, M
inis
try
of A
gric
ultu
re
Adv
ice,
trai
ning
, see
d
Feed
back
on
perfo
rman
ce,
prob
lem
s
Train
ing
and
train
ing
mat
eria
ls,
allow
ance
s
GR
ZG
over
nmen
t of t
he R
epub
lic o
f Zam
bia
GR
Z C
amp
offic
ers
GR
Z B
lock
of
fice
GR
Z D
istr
ict
agric
.offi
ce
GR
Z P
rov.
ag
ric. o
ffice
GR
Z D
irect
or o
f A
gric
. Lus
aka
Data from on-farm trials, feedback
Ref
orm
Chu
rch
Cat
holic
C
hurc
hFi
nnid
aD
anis
h
proj
ect
Ada
ptiv
e re
sear
ch
plan
ning
te
am
Soi
l con
s.
Agr
ofor
estry
ex
tens
ion
proj
ect
Cop
per-
be
ltLu
apul
aC
entra
lW
este
rn
Fig.
3.4
.In
stitu
tiona
l lin
ks b
etw
een
ICR
AF/
Zam
bia
team
, far
mer
s an
d ot
her
orga
niza
tions
test
ing
impr
oved
fallo
ws.
Trees on Farms Ch3 22/2/02 11:44 am Page 56
Assessing Improved Fallows Adoption Potential 57
to identify researchable issues. Moreover, the more extension staff become involvedin on-farm research, the more knowledgeable and enthusiastic they will be inextending the practice. Their involvement helps to save scarce research resourcesand improves the feedback to research.
The extension service in Zambia is a full partner in the on-farm research. Infact, about half of the type 2 trials were laid out by extension staff in the absence ofresearchers. Extension staff also play an important role in supporting the villagenurseries and in monitoring the trials. They view the trials as joint research–exten-sion work. Relations are also excellent at higher levels. Throughout the system, themanaging of on-farm trials is seen as a normal duty of extension and NGO staff,rather than a burden imposed on them from outside. Development projects pro-vide some incentives to extension staff, such as bicycles and lunch allowances,which facilitate institutional linkages and raise the effectiveness of the extensionstaff. That only one researcher and technician from the Zambia/ICRAF projectwere involved in the establishment and monitoring of the hundreds of on-farm tri-als in the mid-1990s attests to the strength of the network.
Development projects, NGOs and community-based organizations are alsoactive members of the network. The World Vision International Zambia IntegratedAgroforestry Project (financed by the United States Agency for InternationalDevelopment) plays a major role in promoting improved fallows. Farmer groupsare also important members of the network. The groups (often called clubs) aregenerally composed of farmers in a single village; sometimes they are limited to aspecific group such as females or youths. Most have several different self-help activ-ities, but some were formed specifically to promote improved fallows. The groupsmanage nurseries, distribute seed and seedlings, and exchange knowledge, trainingand experience on improved fallows.
The first meeting of the network was hosted by the Zambia/ICRAF project inApril 1996 and was attended by 75 representatives of extension services, projects,NGOs and farmer groups (FSRT/SCAFE, 1997). Participants planned for thewider testing of improved fallows, reviewed the problems and the state of knowl-edge about them, and developed a draft extension manual. The network meets 1–2times yearly and meetings are chaired by the Provincial Agricultural Officer, wholeads the government’s agricultural programmes in the province. Representatives ofextension and NGOs present the progress they have made and problems encoun-tered in helping farmers use agroforestry. Farmers present their experiences andresearchers report on the results of on-station and on-farm trials. Participants alsoplan training exercises and germplasm production and distribution.
Conclusion
Improved fallows have generated a high degree of enthusiasm among farmers,extension staff, NGOs and researchers. But several critical biophysical, socioeco-nomic, institutional and policy issues remain. On the biophysical side, the farmers’most important problem was poor tree growth and the low tree survival rate. Poor
Trees on Farms Ch3 22/2/02 11:44 am Page 57
58 S. Franzel et al.
rainfall was the main contributing factor, followed by poor nursery and transplant-ing techniques and attacks by the mesoplatys beetle. Despite poor rainfall in someyears, the quality of fallow stands will likely improve as farmer’s knowledge of nurs-ery and tree management increases. But sustained training of extension staff andfarmers is needed to ensure progress in improving survival rates. Efforts to addressthe beetle problem focus on improving tree management, especially early planting,so that trees will be better able to withstand the attacks, and selecting sesbaniaprovenances that the beetles do not attack. Researchers at Makoka ResearchStation, Malawi, have identified one such provenance.
Type 1 trials established across Zambia and three other countries in southernAfrica confirmed that sesbania does not perform well on sandy soils, because ofnematode attacks, or on shallow soils, because of mortality during the dry season(ICRAF, 1996). These problems, along with that of mesoplatys, highlight the needto screen new species for improved fallows. Gliricidia sepium is the most promisingnew species; farmers like it because it can be coppiced, that is, it regrows after cut-ting. Thus it is not necessary to replant it after using it in an improved fallow.
Several socioeconomic issues are also critical. Research is needed to monitorfarmers’ uptake of improved fallows and to assess their appropriateness for differenttypes of farmers in the area. Researchers need to monitor carefully how those farm-ers testing the practice differ from those not testing and, eventually, how adoptersdiffer from those rejecting the practice. The most important variables influencingadoption appear to be wealth level and gender.
Preliminary assessments presented in this chapter suggest that improved fallowsare a gender-neutral technology; women are planting them about as frequently asmen. Although wealth is associated with planting improving fallows, the fact thatabout one-sixth of the poor and very poor farmers are planting them suggests thatthere are no absolute constraints preventing these groups from doing so. More workis needed on understanding why some poor households participate while others donot. For example, participation in farmer groups may be an important factor.
An additional variable, labour availability at the time of planting, also needs tobe assessed. Labour availability does not appear to be constraining farmers fromtesting improved fallows, but it may be important in limiting the area a farmerallocates to the practice. Farmers’ apparent lack of concern about devoting labourto planting trees during their peak period of labour use reflects their high expecta-tions concerning the benefits of the practice. Nevertheless, increased attention isneeded for reducing labour requirements of improved fallows through such tech-niques as coppicing species, direct seeding and intercropping trees with maize dur-ing the year of establishment.
Several other socioeconomic issues need to be assessed. The economics ofalternative improved fallow practices (e.g. sesbania versus tephrosia; pure stand ver-sus intercropping; trees versus herbaceous legumes) needs to be examined. Also, asfarmers expand their use of improved fallows, impact assessment is important todetermine the financial and environmental effects of the technology at the farm,household and village scales. For example, will widespread adoption of improvedfallows reduce deforestation, that is, tree felling in the woodlands for fuelwood?
Trees on Farms Ch3 22/2/02 11:44 am Page 58

Assessing Improved Fallows Adoption Potential 59
Will farmers use improved fallows to reduce their area under maize so as to growmore cash crops? Researchers have conducted two village-level workshops to findout farmers’ views on potential impacts and are planning participatory monitoringof the uptake of improved fallows and their impact in selected villages (Place,1997).
On the institutional side, priority needs to be given to developing sustainablesystems of producing and distributing seed; in 1996, it was necessary to import 7tons of sesbania seed from Kenya to meet seed demand. Seed orchards are now inplace and the area is self-sufficient in seed, but production and distribution arelargely through NGOs, ICRAF and other organizations, the private sector andfarmer organizations play less of a role. The advantages and disadvantages of collec-tive and private nurseries also need to be examined. Large, collective nurseries facil-itate the training of farmers, but dividing labour duties and distributing seedlingshave proved problematic. Farmer groups need to be strengthened to take over someof the functions of research and extension (Ashby and Sperling, 1995). Such devo-lution not only reduces the costs of research and extension; it permits increasedscale of testing and more appropriate research to meet farmers’ needs. For example,group members could decide on research issues they want to investigate (e.g. inter-cropping versus pure stand) and could allocate responsibilities among members. Atthe end of the experimental cycle, the testers could draw their own conclusions andpresent them to the community.
Policy research can help identify how communities can control the free grazingof livestock to limit browsing damage to improved fallows, as well as to off-seasongardens and woodlots. Several communities are currently trying to regulate brows-ing; their progress and lessons learned need to be monitored (FSRT/SCAFE,1997). An alternative means to addressing the grazing problem is to identify treespecies that are not palatable to livestock. Also, if improved fallows increase thequantity of produce marketed, marketing constraints, already severe, may be exac-erbated. With market liberalization in the early 1990s, parastatal marketing ofmaize and cash crops has greatly declined and the private sector has not filled thegap.
In spite of the problems, much progress has been made in developing and dis-seminating improved fallows and it is useful to identify key elements that have con-tributed to the achievements thus far. First, diagnostic surveys were effective inidentifying farmers’ problems and drawing up research projects that could helpsolve them and fit farmer circumstances. Secondly, farmers participated in thedesign and testing of improved fallows at an early stage and their feedback was crit-ical in modifying the technology. The early experimenters also played an importantrole, hosting visits from other farmers and training them. Thirdly, researchers andfarmers tested a wide range of management options, not just a single prototype,and encouraged farmers to modify and innovate. Fourthly, an adaptive research anddissemination network was critical for mobilizing research, extension, NGOs andfarmers, and for testing and extending the technology in new areas. Emphasis onthese four elements can help promote success in technology development and dis-semination efforts elsewhere.
Trees on Farms Ch3 22/2/02 11:44 am Page 59

Acknowledgements
The authors are grateful to Stanislas Phiri for assisting in the collection of the data,to Josefynne Miingi for help in analysing the data, and to Thomas Raussen and SaraScherr for reviewing earlier drafts of the manuscript.
References
60 S. Franzel et al.
ARPT (1991) Report of an informal survey ondegraded lands in Eastern Province,Zambia. Adaptive Research Planning Team,Department of Agriculture, Chipata.
Ashby, J. and Sperling, L. (1995)Institutionalizing participatory, client-dri-ven research and technology developmentin agriculture. Development and Change 26,753–770.
Bonnard, P. and Scherr, S. (1994) Within genderdifferences in tree management: is genderdistinction a reliable concept? AgroforestrySystems 25, 71–93.
Celis, R. and Holleman, C. (1991) The effects ofadopting technology on the household useof labour. In: Celis, R., Milimo, J.T. andWanmali, S. (eds) Adopting Improved FarmTechnology: a Study of Smallholder Farmers inEastern Province, Zambia. IFPRI,Washington, DC.
Cooper, P.J., Leakey, R.R.B., Rao, M.R. andReynolds, L. (1996) Agroforestry and themitigation of land degradation in thehumid and sub-humid tropics of Africa.Experimental Agriculture 32, 235–290.
DOA (1991) A Handbook for AgriculturalExtension Workers. Department ofAgriculture, Eastern Province, Chipata.
FSRT (1995) Annual Report 1994/95. FarmingSystems Research Team – Eastern Province.Ministry of Agriculture, Food, andFisheries, Chipata.
FSRT/SCAFE (Farming Systems Research Team– Eastern Province, and Soil Conservationand Agroforestry Extension Programme –Eastern Province) (1997) Proceedings of theConsultative Workshop on Integrated SoilFertility Management on Small Scale Farmsin Zambia’s Eastern Province, 13–19 October1996, Chipata, Zambia.
Howard, J.A., Rubey, L. and Crawford, E.W.(1997) Getting technology and the technol-
ogy environment right: lessons from maizedevelopment in Southern Africa. Paper pre-sented at the Meeting of the InternationalAssociation of Agricultural Economics,10–16 August, Sacramento, CA.
ICRAF (1996) Annual Report, 1995. ICRAF,Nairobi.
Jha, D. and Hojjati, B. (1993) Fertilizer Use onSmallholder Farms in Eastern Province,Zambia. Research Report No. 94,International Food Policy ResearchInstitute, Washington, DC.
Keil, A. (2001) Improved fallows using legumi-nous trees in eastern Zambia: do initialtesters adopt the technology? MSc thesis,Institute of Rural Development, Georg-August-University of Goettingen, Germany.
Kwesiga, F.R. and Coe, R. (1994) The effect ofshort rotation Sesbania sesban planted fal-lows on maize yield. Forest Ecology andManagement 64, 199–208.
Kwesiga, F.R., Phiri, D., Mwanza, S. andSimwanza, P.C. (1995) Zambia/ICRAFAgroforestry Research Project (1995) AnnualReport. AFRENA Report No. 98. ICRAF,Nairobi.
Kwesiga, F.R., Franzel, S., Place, F., Phiri, D. andSimwanza, C.P. (1999) Sesbania sesbanimproved fallows in eastern Zambia: theirinception, development, and farmer enthu-siasm. Agroforestry Systems 47, 49–66.
Peterson, J.S. (1999) Kubweletza Nthaka: ethno-graphic decision trees and improved fallowsin the Eastern Province of Zambia.University of Florida/Gender and SoilFertility in Africa Collaborative ResearchSupport Program, Gainesville, Florida.
Peterson, J.S., Tembo, L., Kawimbe, C. andMwang’amba (2000) The ZambiaIntegrated Agroforestry Project baseline sur-vey: lessons learned in Eastern ProvinceZambia. World Vision International/
Trees on Farms Ch3 22/2/02 11:44 am Page 60

University of Florida/ICRAF/Ministry ofAgriculture, Gainesville, Florida.
Phiri, D., Franzel, S., Mafongoya, P., Jere, I.,Katanga, R. and Phiri, S. (2001) Who isusing the new technology? A case study ofthe association of wealth status and genderwith the planting of improved tree fallows inEastern Province, Zambia. ICRAF, Nairobi.
Place, F. (1997) A methodology for a participa-tory approach to impact assessment: impli-cations from village workshops in EasternProvince, Zambia. ICRAF, Nairobi.
Place, F., Mwanza, S. and Kwesiga, F.R. (1995) Acost–benefit analysis of improved fallows inEastern Province, Zambia. ICRAF, Nairobi.
Raintree, J. and Warner, K. (1986) Agroforestrypathways for the intensification of shiftingcultivation. Agroforestry Systems 4, 39–54.
Raussen, T., Daka, A.E. and Bangwe, L. (1995)
Dambos in Eastern Province. Ministry ofAgriculture, Food, and Fisheries, Chipata.
Sanchez, P.A., Shepherd, K.D., Soule, M.J.,Place, F.M., Buresh, R.J., Izac, A.N., UzoMokwunye, A., Kwesiga, F.R., Nderitu,C.G. and Woomer, P.L. (1997) Soil fertilityreplenishment in Africa: an investment innatural resource capital. In: Buresh, R.J.,Sanchez, P.A. and Calhoun, F.G. (eds)Replenishing Soil Fertility in Africa. SSSASpecial Publication Number 51. SoilScience Society of America and AmericanSociety of Agronomy, Madison, Wisconsin,pp. 1–46.
Zambia/ICRAF (1988) Agroforestry ResearchProject for the Maize-Livestock System in theUnimodal Upland Plateau in EasternProvince, Zambia. ARENA Report No. 10.ICRAF. Nairobi, Kenya.
Assessing Improved Fallows Adoption Potential 61
Trees on Farms Ch3 22/2/02 11:44 am Page 61

62 S. Franzel et al.
Ap
pen
dix
3.1
.C
ost–
bene
fit a
naly
sis
of im
prov
ed fa
llow
and
cro
ppin
g op
tions
(Z
K h
a−1).
Mai
ze c
ropp
ing
with
out f
ertil
izer
Two-
year
ses
bani
a fa
llow
Mai
ze c
ropp
ing
with
fert
ilize
r
Year
1Ye
ar 2
Year
3Ye
ar 4
Year
5Ye
ar 1
Year
2Ye
ar 3
Year
4Ye
ar 5
Year
1Ye
ar 2
Year
3Ye
ar 4
Year
5
Cos
tsC
ash
cost
sM
aize
see
d22
.24
22.2
422
.24
22.2
422
.24
22.2
422
.24
22.2
422
.24
22.2
422
.24
22.2
422
.24
Nur
sery
cos
ts2.
93F
ertil
izer
0.00
0.00
0.00
142.
8214
2.82
142.
8214
2.82
142.
82F
ertil
izer
tran
spor
t0.
000.
000.
006.
406.
406.
406.
406.
40To
tal c
ash
cost
s22
.24
22.2
422
.24
22.2
422
.24
2.93
22.2
422
.24
22.2
417
1.46
171.
4617
1.46
171.
4617
1.46
Labo
urTr
ee n
urse
ry10
.52
Land
pre
para
tion
12.0
012
.00
12.0
012
.00
12.0
012
.00
9.00
12.0
012
.00
12.0
012
.00
12.0
012
.00
12.0
0R
idgi
ng4.
004.
004.
004.
004.
004.
003.
004.
004.
004.
004.
004.
004.
004.
00P
lant
ing
mai
ze2.
002.
002.
002.
002.
000.
002.
002.
002.
002.
802.
802.
802.
802.
80P
lant
ing
tree
s0.
000.
000.
000.
000.
0011
.24
0.00
0.00
0.00
0.00
0.00
0.00
0.00
0.00
1st w
eedi
ng8.
008.
008.
008.
008.
008.
006.
008.
008.
0010
.00
10.0
010
.00
10.0
010
.00
2nd
wee
ding
4.00
4.00
4.00
4.00
4.00
4.00
3.00
4.00
4.00
6.00
6.00
6.00
6.00
6.00
Tree
cut
ting
0.00
0.00
0.00
0.00
0.00
0.00
2.08
0.00
0.00
0.00
0.00
0.00
0.00
0.00
0.00
Har
vest
ing
mai
ze5.
965.
965.
965.
965.
960.
000.
008.
888.
007.
139.
589.
589.
589.
589.
58M
aize
she
lling
3.96
3.96
3.96
3.96
3.96
0.00
0.00
6.88
6.00
5.13
7.58
7.58
7.58
7.58
7.58
Tota
l lab
our
cost
s39
.92
39.9
239
.92
39.9
239
.92
49.7
62.
0838
.76
44.0
142
.26
51.9
651
.96
51.9
651
.96
51.9
6To
tal c
osts
62.1
662
.16
62.1
662
.16
62.1
652
.68
2.08
61.0
066
.25
64.5
022
3.42
223.
4222
3.42
223.
4222
3.42
Labo
ur w
ork
days
99.8
99.8
99.8
99.8
99.8
124.
45.
296
.911
0.0
105.
612
9.9
129.
912
9.9
129.
912
9.9
Ben
efits
Mai
ze63
.74
63.7
463
.74
63.7
463
.74
0.00
0.00
257.
6319
9.47
141.
3030
4.11
304.
1130
4.11
304.
1130
4.11
Fue
lwoo
d0.
000.
000.
000.
000.
000.
006.
400.
000.
000.
000.
000.
000.
000.
000.
00To
tal b
enefi
ts63
.74
63.7
463
.74
63.7
463
.74
0.00
6.40
257.
6319
9.47
141.
3030
4.11
304.
1130
4.11
304.
1130
4.11
Net
ben
efit t
o la
bour
41.5
041
.50
41.5
041
.50
41.5
0−2
.93
6.40
235.
3917
7.23
119.
0613
2.66
132.
6613
2.66
132.
6613
2.66
Net
ret
urn
to
0.42
0.42
0.42
0.42
0.42
−0.0
21.
232.
431.
611.
131.
021.
021.
021.
021.
02la
bour
day
−1
Trees on Farms Ch3 22/2/02 11:44 am Page 62
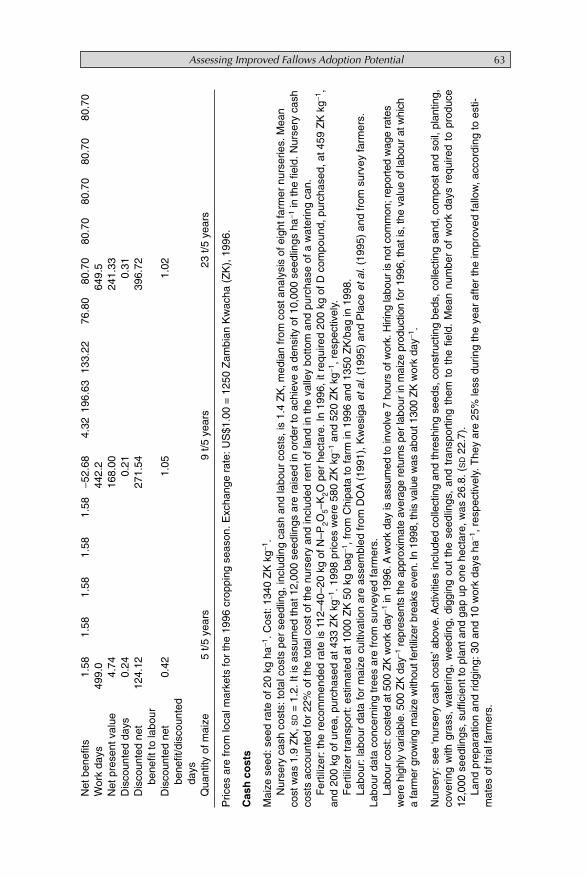
Assessing Improved Fallows Adoption Potential 63
Net
ben
efits
1.58
1.58
1.58
1.58
1.58
−52.
684.
3219
6.63
133.
2276
.80
80.7
080
.70
80.7
080
.70
80.7
0W
ork
days
499.
044
2.2
649.
5N
et p
rese
nt v
alue
4.74
168.
0024
1.33
Dis
coun
ted
days
0.24
0.21
0.31
Dis
coun
ted
net
124.
1227
1.54
396.
72be
nefit
to la
bour
Dis
coun
ted
net
0.42
1.05
1.02
bene
fit/d
isco
unte
dda
ysQ
uant
ity o
f mai
ze5
t/5 y
ears
9 t/5
yea
rs23
t/5
year
s
Pric
es a
re fr
om lo
cal m
arke
ts fo
r th
e 19
96 c
ropp
ing
seas
on. E
xcha
nge
rate
: US
$1.0
0 =
125
0 Z
ambi
an K
wac
ha (
ZK
), 1
996.
Cas
h c
ost
s
Mai
ze s
eed:
see
d ra
te o
f 20
kg h
a−1. C
ost:
1340
ZK
kg−1
.N
urse
ry c
ash
cost
s: to
tal c
osts
per
see
dlin
g, in
clud
ing
cash
and
labo
ur c
osts
, is
1.4
ZK
, med
ian
from
cos
t ana
lysi
s of
eig
ht fa
rmer
nur
serie
s. M
ean
cost
was
1.9
ZK
, SD
= 1
.2. I
t is
assu
med
that
12,
000
seed
lings
are
rai
sed
in o
rder
to a
chie
ve a
den
sity
of 1
0,00
0 se
edlin
gs h
a−1in
the
field
. Nur
sery
cas
hco
sts
acco
unte
d fo
r 22
% o
f the
tota
l cos
t of t
he n
urse
ry a
nd in
clud
ed r
ent o
f lan
d in
the
valle
y bo
ttom
and
pur
chas
e of
a w
ater
ing
can.
Fer
tiliz
er: t
he r
ecom
men
ded
rate
is 1
12–4
0–20
kg
of N
–P2O
5–K
2O p
er h
ecta
re. I
n 19
96, i
t req
uire
d 20
0 kg
of D
com
poun
d, p
urch
ased
, at 4
59 Z
K k
g−1,
and
200
kg o
f ure
a, p
urch
ased
at 4
33 Z
K k
g−1. 1
998
pric
es w
ere
580
ZK
kg−1
and
520
ZK
kg−1
, res
pect
ivel
y.F
ertil
izer
tran
spor
t: es
timat
ed a
t 100
0 Z
K 5
0 kg
bag
−1, f
rom
Chi
pata
to fa
rm in
199
6 an
d 13
50 Z
K/b
ag in
199
8.La
bour
: lab
our
data
for
mai
ze c
ultiv
atio
n ar
e as
sem
bled
from
DO
A(1
991)
, Kw
esig
a et
al.
(199
5) a
nd P
lace
et a
l.(1
995)
and
from
sur
vey
farm
ers.
Labo
ur d
ata
conc
erni
ng tr
ees
are
from
sur
veye
d fa
rmer
s.La
bour
cos
t: co
sted
at 5
00 Z
K w
ork
day−1
in 1
996.
Aw
ork
day
is a
ssum
ed to
invo
lve
7 ho
urs
of w
ork.
Hiri
ng la
bour
is n
ot c
omm
on; r
epor
ted
wag
e ra
tes
wer
e hi
ghly
var
iabl
e. 5
00 Z
K d
ay−1
repr
esen
ts th
e ap
prox
imat
e av
erag
e re
turn
s pe
r la
bour
in m
aize
pro
duct
ion
for
1996
, tha
t is,
the
valu
e of
labo
ur a
t whi
cha
farm
er g
row
ing
mai
ze w
ithou
t fer
tiliz
er b
reak
s ev
en. I
n 19
98, t
his
valu
e w
as a
bout
130
0 Z
K w
ork
day−1
.
Nur
sery
: see
‘nur
sery
cas
h co
sts’
abov
e. A
ctiv
ities
incl
uded
col
lect
ing
and
thre
shin
g se
eds,
con
stru
ctin
g be
ds, c
olle
ctin
g sa
nd, c
ompo
st a
nd s
oil,
plan
ting,
cove
ring
with
gra
ss,
wat
erin
g, w
eedi
ng,
digg
ing
out
the
seed
lings
, an
d tr
ansp
ortin
g th
em t
o th
e fie
ld.
Mea
n nu
mbe
r of
wor
k da
ys r
equi
red
to p
rodu
ce12
,000
see
dlin
gs, s
uffic
ient
to p
lant
and
gap
up
one
hect
are,
was
26.
8. (
SD
22.7
).La
nd p
repa
ratio
n an
d rid
ging
: 30
and
10 w
ork
days
ha−1
, res
pect
ivel
y. T
hey
are
25%
less
dur
ing
the
year
afte
r th
e im
prov
ed fa
llow
, acc
ordi
ng to
est
i-m
ates
of t
rial f
arm
ers.
Trees on Farms Ch3 22/2/02 11:44 am Page 63

64 S. Franzel et al.
Ap
pen
dix
3.1
.C
ontin
ued.
Pla
ntin
g m
aize
: 5 w
ork
days
ha−1
. Whe
n ap
plyi
ng fe
rtili
zer,
7 w
ork
days
ha−1
.P
lant
ing
tree
s: 4
20 tr
ees
per
day,
med
ian
of d
ata
from
12
farm
ers
(mea
n =
499
, SD
= 4
24).
Wee
ding
: ass
umed
to b
e th
e sa
me
for
tree
s as
for
mai
ze, a
s cl
aim
ed b
y fa
rmer
s. W
eedi
ng r
equi
rem
ents
dec
line
by 2
5% d
urin
g th
e ye
ar a
fter
the
impr
oved
fallo
w, a
ccor
ding
to e
stim
ates
of t
rial f
arm
ers.
Wee
ding
req
uire
men
ts a
re a
ssum
ed to
incr
ease
33%
with
fert
ilize
r us
e.H
arve
stin
g an
d po
st-h
arve
st: l
abou
r va
ries
with
qua
ntity
. Ayi
eld
of 1
t ha
−1re
quire
s 15
wor
k da
ys fo
r ha
rves
ting
and
10 d
ays
for
post
-har
vest
act
iviti
es(s
helli
ng a
nd tr
ansp
orta
tion)
. Ayi
eld
of 4
.6 t
ha−1
is e
stim
ated
to r
equi
re 6
0% m
ore
harv
est l
abou
r an
d 90
% m
ore
post
-har
vest
labo
ur.
Ben
efits
Ele
ven
of th
e 12
tria
l far
mer
s ha
d 2-
year
fallo
ws;
one
had
a 3
-yea
r fa
llow
. For
the
purp
ose
of c
ompa
rison
with
the
othe
r sa
mpl
e fa
rms
for
draw
ing
upen
terp
rise
budg
ets,
we
assu
med
that
Phi
ri ha
d a
2-ye
ar fa
llow
. Thi
s as
sum
ptio
n in
crea
sed
the
net p
rese
nt v
alue
s in
the
tabl
e ab
ove
by 1
% a
nd th
e ne
tbe
nefit
day
−1by
1%
.M
aize
: yie
lds
are
from
the
12 tr
ial f
arm
ers
for
the
seas
on fo
llow
ing
the
impr
oved
fallo
w a
nd a
re c
ompa
red
with
yie
lds
on c
ontin
uous
ly c
ropp
ed a
djac
ent
field
s, w
ith a
nd w
ithou
t fer
tiliz
er (
Tabl
e 3.
4). F
or th
e co
ntin
uous
ly c
ropp
ed m
aize
fiel
ds, y
ield
s ar
e as
sum
ed to
be
cons
tant
ove
r th
e 5-
year
per
iod
(964
kg h
a−1w
ithou
t fer
tiliz
er a
nd 4
384
kg h
a−1w
ith fe
rtili
zer)
. Mai
ze y
ield
s fo
llow
ing
the
impr
oved
fallo
ws
are
3638
kg
ha−1
for
the
first
pos
t-fa
llow
sea
son
(Tab
le 3
.4),
283
6 kg
ha−1
for
the
seco
nd, a
nd 2
034
kg h
a−1fo
r th
e th
ird s
easo
n. T
he la
tter
two
figur
es a
re b
ased
on
a 30
% a
nd 6
0% r
educ
tion
inre
spon
se, a
s ob
tain
ed in
on-
stat
ion
tria
ls. T
he m
aize
pric
e w
as 8
3 Z
K k
g−1, t
he e
stim
ated
farm
-gat
e pr
ice
durin
g th
e ha
rves
t per
iod,
199
6. T
he 1
998
pric
e w
as 1
67 Z
K k
g−1.
Fue
lwoo
d: fu
elw
ood
is n
ot n
orm
ally
sol
d; y
ield
is e
stim
ated
at 4
t ha
−1an
d pr
ice
at 2
000
ZK
t−1.
Dis
coun
t rat
e: 2
0%.
Trees on Farms Ch3 22/2/02 11:44 am Page 64

Summary
This study assesses the economics of improved fallow in the densely populated areasof western Kenya, where soils are nutrient depleted. A formal survey of 71 randomlyselected farmers showed that half fallow 10–50% of their land for at least one season,mainly for soil fertility restoration. An improved-fallow prototype, established bydirect seeding Sesbania sesban, an indigenous tree, into the maize crop preceding thefallow, was subjected to an economic analysis, based on 20 farmer-managed trialswhere the technology was tested. One would expect intuitively that the yield of maizegrown after a one-season fallow would need to be at least double that obtained beforethe fallow, in order to compensate for the lost production during the fallow period.Instead, the break-even yield increase following the one-season fallow, compared tocontinuous cropping, was only 21% of the long rains yield of 600 kg ha−1 for thebase scenario. It was relatively low, because the foregone maize yield during the fallowwas compensated by savings in crop labour. Improved fallow is a promising techniquefor reclaiming depleted land, especially for households with access to off-farm incomeor having low labour-to-land ratios. The farm trials facilitated a realistic economicanalysis and farmers’ input into the design of the technology to help focus research onimproving the practice. Insights from this trial led to a new phase of on-farmresearch, with researcher-designed, researcher-managed trials to screen potentialimproved fallow species, researcher-designed, farmer-managed trials on a range ofdesign variables, a large network of farmer-designed, farmer-managed trials, and arapidly expanding extension programme promoting improved fallows.
The Adoption Potential ofShort Rotation ImprovedTree Fallows: Evidencefrom Western Kenya
R.A. SWINKELS,1 S. FRANZEL,2 K.D. SHEPHERD,2E. OHLSSON3 AND J.K. NDUFA4
1The World Bank, 8th Floor, 63 Ly Thai To Street, Hanoi, Vietnam;2International Centre for Research in Agroforestry, ICRAF House,
PO Box 30677, Gigiri, Nairobi, Kenya; 3Sida/SAREC, SE-105 25 Stockholm, Sweden; 4Kenya Forestry Research Institute (KEFRI),
Maseno Agroforestry Research Centre, PO Box 25199, Kisumu, Kenya
© CAB International 2002. Trees on the Farm (eds S. Franzel and S.J. Scherr) 65
4
Trees on Farms Ch4 16/2/02 11:51 am Page 65

Introduction
Soil nutrient depletion is a worldwide problem affecting 135 million ha, mostly inSouth America and Africa (Oldeman et al., 1991). In the East African highlands,soil depletion is a common feature of food-crop oriented small-scale farms, and hasled to low labour and land productivity. Rapid population growth has resulted in anincrease in continuous cropping of farmers’ fields, while little use is made of organicor inorganic fertilizers. Organic inputs, such as manure, are limited by their avail-ability, and the use of inorganic fertilizers is constrained by the unreliable returns torecommended ‘packages’ of hybrid seeds and fertilizers (Ruthenberg, 1980;Anderson, 1992) and lack of access to capital (Hoekstra and Corbett, 1995). As off-farm income has become relatively important for farm households in eastern andsouthern Africa (Low, 1988), technologies are required that not only are able torecover depleted soils and are appropriate to the suboptimal production conditionsof small-scale farmers, but also offer attractive returns per work day.
Work in Zambia has shown that improved fallows (enrichment of natural fal-lows with trees or shrubs to improve soil fertility) have the potential to increase cropyields, while also providing fuelwood (Chapter 3). Results have been positive usingSesbania sesban, a rapidly growing (though short-lived), nitrogen-fixing tree thatseeds profusely. It is indigenous throughout eastern and southern Africa; in westernKenya it is often found in cropland and in fallowed plots (Bradley, 1991). Farmerssometimes scatter sesbania seed in cropland for fuelwood production and as ameans for soil enrichment (Bradley, 1991; Scherr, 1993).
Uses of sesbania species as green-manure crops have been documented exten-sively (Evans and Rotar, 1987). In on-station trials in western Kenya, sesbania isreported to produce up to 9 t ha−1 of dry leafy biomass per 6-month season (Onimet al., 1990), equivalent to about 252 kg of nitrogen. However, few studies haveexamined improved fallow for soil fertility improvement under farmer manage-ment, particularly in areas of high population density, where one would think theyhave little potential (Hoefsloot et al., 1993; Versteeg and Koudokpon, 1993).
The objectives of this work were to: (i) assess the extent and role of fallowing inthe densely populated farming systems of the area; (ii) obtain farmers’ evaluations ofimproved fallow and determine problems farmers had in managing them; (iii) assessthe economics of improved fallow in terms of yield increase following the fallowrequired to cover the costs; and (iv) assess possible management options based onobservation of farmers’ experimentation with the technology. As there had been noearlier research on improved fallow in the area or in a similar environment, thework was important in guiding decisions regarding further research on the technol-ogy. Assessing yield response following the fallows was originally an objective, butthis was not possible due to high managerial variability: farmers often planted testand control plots at different times in different crop densities with varying amountsof manure and weeding labour. Determining yield response would have requiredcontrolling non-experimental variables, which was inimical to the objective ofassessing farmer management of the technology. Therefore, yield response was mea-sured in separate researcher-managed trials under controlled conditions.
66 R.A. Swinkels et al.
Trees on Farms Ch4 16/2/02 11:51 am Page 66

Study Area
The study area is located around the town of Maseno in western Kenya (0°00� N34° 35� E) (Fig. 4.1). The area lies on the equator, and includes adjacent portions ofSiaya, Vihiga and Kisumu Districts, i.e. Yala, Emuhaya, Winam and MasenoDivisions. These represent humid parts of the food-crop-based land-use system ofwestern Kenya. The area has high agricultural potential (high rainfall, well-struc-tured soils) but the land is nutrient depleted (Shepherd et al., 1996). The altitude isabout 1500 m above sea level and the mean annual temperature is 21.0°C. Rainfallis bimodal, averaging 1600–1800 mm year−1 and divided over the long rains season,
Short Rotation Improved Tree Fallows 67
Tana River
Turkana
Marsabit
SambaruIsiolo
Mandera
Garisa
Lamu
Kilifi
MombasaKwale
Taita
Kitui
Kajiado
Machakos
KeyProvincesDistricts
Meru
Meru
EmbuMuranga
Kirinyaga
Kiambu
EmbuNjeri KirinyagaKiambu
Laikia
Njeri
South Nyanza
Kisii Ker
icho Nakuru
Baringo
Transnzoia
Busia
BungomaBungoma
KakamagNandi
Siaya
Uasin
Gishu
Nairobi
Fig. 4.1. Study area in western Kenya.
Trees on Farms Ch4 16/2/02 11:51 am Page 67

68 R.A. Swinkels et al.
from March to July, and the short rains season, from August to November. Duringthe trial period, rainfall varied within the research area and was slightly lower thanusual in 1991 (1350–1500 mm) and about the average in 1992 (1400–2050 mm).The landscape is undulating with slopes of 2–8%. Main soil types are Ferralsols,Acrisols and Nitisols with pH 5 to 7, and moderate to high base. Nitrogen andphosphate deficiencies in soils are widespread (Shepherd et al., 1996; Sanchez et al.,1997).
Farm size varies between 0.5 and 2.0 ha, with a median of 1.2 ha (David andSwinkels, 1994), and population densities range from 300 to over 1000 personskm−2. Maize, often intercropped with beans, dominates the cropping pattern. Cashcrops are rare: only 14% sell either sugarcane, French beans, coffee or tea. Maizeyields are low: about 700–1200 kg ha−1. Most households (74%) own a few localZebu cattle (median is four cattle). Land is privately owned. About half of theheads of households are involved in off-farm money-making ventures. Roughly halfof all households are female-headed. Use of hired labour is variable; some house-holds hire labour for almost all their farm work, while others use only householdlabour. Less than one-third use mineral fertilizer (David and Swinkels, 1994).
Methods
The methods used include a formal survey of a randomly selected sample of farm-ers, a participatory rapid appraisal of farmers with dense stands of sesbania fallows,and a participatory on-farm trial in which interested members of self-help groupstested improved fallows.
Formal surveys and participatory rapid appraisals
In 1991, informal discussions with farmers were conducted regarding their meth-ods of soil fertility maintenance, including existing fallowing practices. A formalsurvey of 71 randomly selected farmers using a structured interview schedule wasconducted in 1992. Its aim was to verify hypotheses developed from the earlierinformal discussions with farmers. The methods of maintaining soil fertility werethen correlated with key parameters, such as household characteristics, farm sizeand labour available for agricultural work.1 Fallowing was defined as leaving land,which is normally cropped, temporarily uncultivated. A participatory rapidappraisal was conducted in 1993 among six farmers who had dense stands of sesba-nia, to assess the role of these stands in their existing fallowing practices. Semi-structured interview techniques were used to stimulate free expression of farmers’views.
1 This variable was calculated by adjusting household size for age composition and thereported primary activity of each member. It is only indicative of available labour, ashouseholds may also hire labour.
Trees on Farms Ch4 16/2/02 11:51 am Page 68

Trial design
Farmers were selected from self-help groups during 1991; after discussions with thegroup members, the most interested ones were invited to participate (Ndufa et al.,1995). Twelve planted a trial in 1991 and eight others planted in 1992. Researchersprovided farmers with tree seed, some seedlings for gapping up, and advice onplanting method. The researchers marked out plots, but farmers conducted all oper-ations. The trial thus began as a ‘type 2’ (researcher-designed, farmer-managed) trial(Chapter 2).
The trial included two adjacent plots managed by each farmer: (i) an improvedfallow rotation, maize→improved fallow→maize (6 months per phase); and (ii) acontrol plot under continuous maize or maize→unimproved fallow withoutsesbania→maize, depending on the farmers’ choice (unimproved fallow withoutsesbania is the most common fallow practice in the area). On the improved-fallowplots, the prototype recommendation was to: (i) establish sesbania rows by directseeding as a relay crop between 3-week-old maize during the long rains season; (ii)fallow during the subsequent short rains season; and (iii) cut down the trees justbefore the next long rains season, incorporate the leafy biomass, and plant a maizecrop. The improved-fallow prototype helps farmers to achieve a higher density ofsesbania in their fallow fields.
The sesbania were planted in continuous lines 4 m apart in 1991, but 2 mapart in 1992. A linear planting arrangement was chosen to facilitate crop cultiva-tion. Farmers were given about 150 g of tree seed (110 seeds g−1) per 100 m of ses-bania line. Sizes of plots were variable: 300–900 m2. Just before the start of the longrains following the fallow, farmers were given the option of cutting the trees atground level to kill them, or cutting at 0.5–1 m height to maximize regrowth. Thelatter option would turn the tree lines into hedges, but these would not be long-lived as sesbania at this altitude does not withstand frequent removal of all its leaves(Yamoah and Burleigh, 1990; ICRAF, 1992).
Informal interviews with the trial farmers were conducted each season to deter-mine methods and criteria farmers used to evaluate improved fallow, to obtain theirassessments and to examine the problems they encountered. We also monitoredtheir willingness to repeat the improved fallow by offering them seed during 1992and 1993. Formal questionnaire surveys at the end of the trial period were used totest hypotheses developed from the informal interviews, to quantify farmers’ per-ceptions on yield responses, and to assess household characteristics so as to deter-mine whether they were representative of the population in the area (David andSwinkels, 1994).
Data on labour inputs for planting and managing the trees were collected bymonitoring work rates through observation. Crop input–output data were collectedfrom 150 maize plots, including those of the trial farmers as well as an additional50 farmers with other on-farm trials in the area, using farmers’ recall just after a taskwas completed (Chapter 5). Prices were collected from six local markets. Yields oftree foliage and wood at the time of tree harvest were determined from quadratsamples.
Short Rotation Improved Tree Fallows 69
Trees on Farms Ch4 16/2/02 11:51 am Page 69

Economic analysis
Enterprise budgets were developed for the maize with the improved fallow proto-type, for continuous maize, the most common practice on the control plots, and formaize with an unimproved fallow without sesbania. Intercropped beans and ground-nuts were omitted in the economic analysis as their yields were low and formed onlya minor part of the production value. As this regards an economic analysis from thefarmers’ point of view, we incorporate the inputs, outputs and prices that the farmerfaces. Net returns to farmers’ production factors (land, labour and capital) were cal-culated by subtracting purchased inputs from the production value. After subtractingfarmers’ capital inputs, which were minor, the net returns were allocated amongfarmers’ land and labour by valuing one factor at its opportunity cost and byattributing the remainder to the other factor. This enabled us to calculate the netreturns to land, which is relevant for farmers whose most scarce resource is land, andthe net returns to labour, relevant for those who lack household labour.
As comparing crop yields between test and control plots was not meaningful,due to a high managerial variability, we are not able to report crop yield responseshere. Instead, we calculated the break-even maize yield relative to continuous crop-ping, that is, the yield increase over continuous maize that is required to cover thecosts of the improved fallow (including the maize yield foregone during the fallowperiod and including the cost of postponing consumption, i.e. the social time pref-erence rate, estimated at 20%). We also calculated the break-even maize yieldincrease relative to an unimproved fallow. This is the extra yield required over theyield after an unimproved fallow, to cover the cost of improved fallow. Equationswere developed for the calculation of the break-even yield increase for the compari-son with continuous maize, based on an analysis of returns to land (Appendix 4.1);for the comparison with unimproved fallow; and for both types of comparisonsbased on an analysis of returns to labour. Only the first season after the fallow isincluded in the analysis and thus residual effects of the improved fallow are notconsidered. The analysis is therefore likely to underestimate benefits. Furthermore,negative effects of the trees on adjacent fields during the fallow and positive effectson adjacent fields after the fallow are not considered.
The economic analysis incorporates two maize yield scenarios: low and high.To represent severely depleted soils the average 25th percentile seasonal yields for1991 and 1992 were taken from the sample of 150 maize plots (600 kg ha−1 in thelong rains and 400 kg ha−1 in the short rains). To represent less depleted soils theaverage 75th percentile sample yields were taken (1900 kg ha−1 and 1200 kg ha−1).For each yield scenario, yields under continuous maize were assumed to remainconstant for the three seasons. Under unimproved fallow, yields were assumed toremain the same before and after the one-season fallow. These assumptions allow anassessment of the break-even yield increase of improved fallow relative to the twoalternative systems. Crop labour inputs were about 50% higher for the high-yieldscenario compared to the low-yield scenario.
In situations of high population density where land is scarce and farms aresmall, the marginal product of labour is usually lower than the wage rate (Ellis,
70 R.A. Swinkels et al.
Trees on Farms Ch4 16/2/02 11:51 am Page 70

1988). Therefore, we valued cropping labour according to three different scenarios:25, 50 and 75% of the hired labour price. The first scenario would be applicablewhere labour is abundant and the farmer is usually not able to find off-farm work;the third one is applicable where the farmer is usually able to do off-farm work, butincurs some transaction costs in finding it (De Janvry et al., 1991). The second sce-nario represents an intermediate situation.
Land was valued at its rental rate of about US$33 ha−1 year−1, but as tenancyand land transactions are uncommon,2 this is only indicative of its opportunitycost. In the analysis we therefore incorporate two other land values: (i) double therental rate, approximating the opportunity cost of land based on the relatively highpurchase price (US$660 ha−1); and (ii) half the rental rate, to estimate the opportu-nity cost of severely depleted land.
For each yield scenario, the average of the 1991 and 1992 medians of otherinputs, such as quantities of maize seed, farmyard manure and fertilizer, were used.Sensitivity analysis was conducted to measure the effects of changes in some of thebase assumptions on the break-even maize yield increase.
Results
Formal survey results
Farm sizes are small: the mean was 1.7 ha (SD = 1.6 ha; median = 1.2 ha).Labour–land ratios were variable: the mean was 3.1 equivalents of adult full-timeworkers per ha (SD = 5.1; median = 1.8).
More than half the farmers (52%) mentioned that they fallow some of theirland periodically, about 10–50% of total farm land at a time. During the short rainsseason of 1992, on average 32–47% of farmers’ cropland was under fallow, depend-ing on the district. The length of the fallow varies between one season (24% ofthose who fallow), 1 year (35%) and 2 or more years (41%). As expected, farmerswho fallow have on average significantly larger farms (2.2 versus 1.2 ha; P < 0.01).However, fallowing is not limited to the larger farms as 31% of households withfarms smaller than the median also fallow periodically. Labour–land ratios were notsignificantly lower than for farmers who do not fallow.
Of the farmers who fallow, 84% mentioned that they did so to restore soil fer-tility, while 51% mentioned shortages of labour or cash to hire labour. Other rea-sons mentioned by less than 5% of farmers included need for grazing land/fodder,lack of seeds and need for fuelwood (farmers were allowed to give more than oneanswer). Farmers that mentioned lack of labour as a reason for fallowing had lowerlabour–land ratios than the rest (1.4 versus 3.6 adult full-time workers; P < 0.08). Ahigher proportion of farmers with off-farm income mentioned that they fallow peri-
Short Rotation Improved Tree Fallows 71
2 Tenancy is infrequent because of enforcement problems and lack of credit, while landtransactions are rare due to high land prices and lack of credit (Collier, 1989). Usually landis obtained through inheritance.
Trees on Farms Ch4 16/2/02 11:51 am Page 71

odically, compared to those without off-farm income (68% versus 32%; P < 0.003).No association was found between fallowing and gender or age of head of house-hold.
Three-quarters of the farmers reported that they had some sesbania growing intheir crop land; tree density ranged between 20 and 200 trees ha−1. The proportionof farmers varied between 33% and 94%, depending on the district. A fifth of thefarmers claimed they sometimes scatter sesbania seeds in the cropland after landpreparation.
Results of participatory rapid appraisal
Among the six farmers with dense sesbania stands, sesbania usually grows naturallyin cropland. In case the population of sesbania drops below desirable levels, farmersmay broadcast sesbania seeds. During land preparation or weeding, farmers some-times remove sesbania trees or branches to prevent excessive shading of crops. Thefarmers’ main reason for growing sesbania is for fuelwood for domestic use, butthey are aware of its beneficial effect on soil fertility, although the impact is limitedas tree densities are low.
When land is left fallow, the sesbanias are allowed to grow tall and seed, whichmay result in a dense stand. After a fallow, all sesbania trees are cut down, the landis prepared and a maize crop planted. None of the farmers interviewed had sownsesbania during the season prior to a fallow or at the start of a fallow in order toencourage a dense stand.
Trial results
The average farm size of trial farmers was 1.2 ha (SD = 1.4 ha). Seven of the 20 trialhouseholds were female-headed; ten farms were managed by a female, five by a cou-ple, three by a male and two by permanent labourers. These results are in line withfindings for the broader population of the area (David and Swinkels, 1994).
Tree establishment failed on five of the 20 farms because of washing away ofseed during heavy rains (four farms) and poor weeding (one farm). In the remaining15 trials, the mean number of trees germinating was 13 m−1 (SD = 7), leading totree stands of 32,500 trees ha−1 for trees in rows 4 m apart and 65,000 trees ha−1 fortrees in rows 2 m apart. Farmers did not do any extra weeding of the trees, apartfrom the normal weeding of the maize. Tree height 6 months after sowing wasextremely variable, ranging between 0.5 and 2.5 m, with a mean of 1.3 m.
Of the 15 remaining trials, another five failed in the course of the first yearafter establishment. Causes included browsing by dik-diks (Madoqua kirki) (threefarms, all in areas of low population density where such antelopes are still com-mon), browsing by the farmer’s cow (two farms), farmer leaving the area (one farm)and trees accidentally uprooted during land preparation (one farm). On somefarms, there were more than one cause of failure.
72 R.A. Swinkels et al.
Trees on Farms Ch4 16/2/02 11:51 am Page 72

Trial management was highly variable. In four of the remaining ten trials, thefarmer followed the prototype recommendation for the test plot of fallowing forone season and cutting down the trees about 1 year after sowing. Quantities of dryleafy biomass on three of these four farms for which data were available were 9000kg ha−1, 3700 kg ha−1 and 700 kg ha−1. Assuming 18 g nitrogen kg−1 leafy biomass(Shepherd et al., 1996), the leafy biomass provided about 162, 67 and 13 kg nitro-gen ha−1. Dry weights of wood were 7900 kg ha−1, 3400 kg ha−1 and 500 kg ha−1,and the amounts of nitrogen removed in the wood (assuming 7.3 g nitrogen kg−1
wood) were 58, 25 and 4 kg ha−1. Thus about one-third of the nitrogen in thestanding biomass was removed from the field. Tree yields were lower on the thirdfarm partly because trees were planted in rows 4 m apart, compared to 2 m apart onthe other two farms.
Five other farmers cut down the trees at 1.5–3 years after establishment. Threeof these fallowed only during the last season before cutting, cropping in betweenthe tree rows during the other seasons. They side-pruned the trees to prevent shad-ing. One other farmer fallowed for two seasons, and another one for three seasons,before harvesting the trees. Tree biomass data were available only for the latterfarmer; he harvested about 2400 kg ha−1 of dry leaves and 2500 kg ha−1 of drywood (trees in rows 4 m apart). One other farmer still had not cut down the trees 3years after sowing. Only 1 of the 10 farmers fallowed the control plot at least onceduring the trial period. The rest planted maize (eight farmers) or sweet potato (onefarmer). Average long-rains maize yields before the fallow on 6 of the 10 success-fully established trials for which data were available was 1073 kg ha−1 (SD = 667).Data on long-rains crop yields in the trial plot after the fallow were only availablefor three farmers: their mean maize yield was 658 kg ha−1 (SD = 238). In the controlplot, long-rains maize yields during the trial period were, on average, 995 kg ha−1
(SD = 610; n =7) in the long rains and 633 kg ha−1 (SD = 356; n = 19) in the shortrains.
Farmers’ evaluations of the ten successfully established improved fallows werepositive. All of them stated that, in the establishment season, the young sesbaniaseedlings had no influence on maize yields and weeding requirements. However, thefour farmers who cut down the trees within 1 year after sowing mentioned thatregrowth of the remaining tree stumps made land preparation and weeding moredifficult. In contrast, the five farmers who cut down their trees 1.5–3 years aftersowing saw a much higher tree mortality and said that the remaining tree stumpshad no effect on labour requirements for land preparation or weeding. The threefarmers who intercropped the trees for more than one season before fallowing,observed that after the first season the crops were negatively effected by shading ofthe trees.
Six of eight farmers for whom data were available claimed that the improvedfallow increased crop yields; two mentioned the trees had made no difference. Threefarmers noted the trees had caused a decrease in weeds and two reported that thetrees helped curb soil erosion. Five asked for more sesbania seed and four planted anew improved fallow on their own.
Short Rotation Improved Tree Fallows 73
Trees on Farms Ch4 16/2/02 11:51 am Page 73

Economic analysis
Extra costs of improved fallow, compared to continuous cropping, consisted of treeseeds, labour for establishing and removing the trees, and the maize yield foregoneduring the fallow; extra benefits included crop labour and other crop inputs savedduring the fallow, fuelwood and the increased maize yield after the fallow (Table4.1). Improved fallow required less labour than continuous cropping: over threeseasons the reduction was 83 work days ha−1, or 21% under the low-yield scenario(Table 4.1). Thus, the higher the opportunity cost of labour, the more profitable isthe improved fallow. The extra costs of improved fallow compared to an unim-proved fallow consisted of planting and cutting down the trees, minus the cost ofclearing the natural fallow, which is estimated to require 5.8 work days ha−1 (one-third of the labour required to cut down an improved fallow).
Returns to land
The break-even maize yield increase required to cover the costs of improved fallow,as compared to continuous cropping, was calculated from Equations (4.1) and (4.2)(Appendix 4.1). Using values from Table 4.1 to calculate (Equation 4.2) we get:
BEYIland = − 41
+ PL
275 – 8.6 LSm + 1.2
Y S
Y L Y L Y L
where,
BEYIland = the break-even yield increase in the long rains following the fallow (% oflong-rains yield under continuous cropping) for the analysis of returns to land, andY L = maize yield in the long rains under continuous cropping (kg ha−1),PL = opportunity cost of labour (US$ day−1),LS
m = maize labour input in the short rains (work days ha−1), andY S = maize yield in the short rains (kg ha−1).
Under the low-yield scenario, the break-even yield increase required to coverthe costs of improved fallow was 21% (Table 4.1), and ranged between −5% and47% of the long-rains yield of 600 kg ha−1, depending on the opportunity cost oflabour (Table 4.2). In the high-yield scenario, the break-even yield increase forimproved fallow was between 31% and 59% (Table 4.2). Thus at higher base yields,improved fallow becomes less attractive (Fig. 4.2), reflecting the higher maize yieldforegone while fallowing. Under a high-yield scenario, the break-even yield increasealso becomes less sensitive to changes in the opportunity cost of labour compared tothe low-yield scenario (Table 4.2).
A higher opportunity cost of labour reduced the break-even maize yield increasebecause higher labour costs were foregone during fallowing, increasing the attractive-ness of improved fallows (Table 4.2; Fig. 4.3). In the low-yield scenario, the break-even yield increase is negative when the opportunity cost of labour is higher thanUS$0.59 day−1 (70% of the wage rate) (Table 4.2). This is because at that labour cost,the present value of net returns per hectare of continuous maize is negative (Fig. 4.2).
74 R.A. Swinkels et al.
Trees on Farms Ch4 16/2/02 11:51 am Page 74

Short Rotation Improved Tree Fallows 75
Tab
le 4
.1.
Ent
erpr
ise
budg
et s
how
ing
the
21%
mai
ze y
ield
incr
ease
, fol
low
ing
the
impr
oved
fallo
w, r
equi
red
unde
r th
e ba
se a
naly
sis
toco
ver
the
cost
s of
ado
ptin
g it,
rel
ativ
e to
con
tinuo
us c
ropp
ing,
bas
ed o
n re
turn
s to
land
(U
S$
ha−1
).a
Impr
oved
fallo
wC
ontin
uous
mai
ze
Year
1Ye
ar 2
Year
1Ye
ar 2
Cos
ts a
nd r
etur
nsb
Sea
son
1S
easo
n 2
Sea
son
3S
easo
n 1
Sea
son
2S
easo
n 3
Ret
urns
(U
S$
ha−1
)m
aize
yie
ld82
099
8255
82fu
elw
ood
00
100
00
Cos
ts (
excl
udin
g la
bour
) (U
S$
ha−1
)m
aize
see
d4
04
44
4tr
ee s
eed
80
00
00
Net
ret
urns
to fa
rmer
s’la
nd, l
abou
r an
d ca
pita
l74
010
982
5582
(US
$ ha
−1)
Net
ret
urns
to fa
rmer
s’la
nd a
nd la
bour
70
010
578
5178
(US
$ ha
−1)
Pre
sent
val
ue o
f net
ret
urns
to fa
rmer
s’la
nd13
116
1an
d la
bour
(U
S$
ha−1
)La
bour
inpu
t (w
ork
days
ha−1
)m
aize
136.
40
136.
413
6.4
118.
213
6.4
tree
sow
ing
17.5
00
00
0cu
tting
tree
s0
017
.50
00
Tota
l lab
our
153.
90
153.
913
6.4
118.
213
6.4
Pre
sent
val
ue o
f lab
our
inpu
t (w
ork
days
ha−1
)23
5.1
306.
9P
rese
nt v
alue
of n
et r
etur
ns to
land
(U
S$
ha−1
)33
33
a Mai
ze y
ield
incr
ease
s ar
e ex
pres
sed
as p
erce
ntag
es o
f lo
ng-r
ains
yie
ld. T
he b
ase
anal
ysis
use
s th
e lo
w m
aize
yie
ld s
cena
rio:
600
kgha
−1in
the
long
rai
ns a
nd 4
00 k
g ha
−1in
the
shor
t rai
ns; o
ppor
tuni
ty c
ost o
f lab
our
is 5
0% (
US
$0.4
2 da
y−1)
of w
age
rate
. 199
1 pr
ices
, 1U
S$
= 3
0 K
enya
Shi
lling
s.
Trees on Farms Ch4 16/2/02 11:51 am Page 75

76 R.A. Swinkels et al.
Tab
le 4
.1.
Con
tinue
d.
b Cos
ts a
nd r
etur
ns:
Mai
ze p
rice
= U
S$0
.14
kg−1
(mar
ket p
rice
at p
lant
ing
time
and
harv
estin
g tim
e).
Fue
lwoo
d yi
elds
var
ied
betw
een
3 an
d 10
ton
s dr
y w
ood
ha−1
, bu
t as
fue
lwoo
d is
not
par
ticul
arly
sca
rce,
we
valu
e on
ly t
he fi
rst
ton;
estim
ated
val
ue is
one
-thi
rd o
f the
mar
ket p
rice
of U
S$0
.03
kg−1
.M
aize
see
d ra
te is
32
kg h
a−1.
Tree
see
d ra
te is
6.1
kg
ha−1
of s
esba
nia
seed
s, v
alue
d at
the
pric
e of
US
$1.3
kg−1
, at w
hich
it is
bou
ght b
y N
GO
s in
the
area
.N
et r
etur
ns to
land
, lab
our
and
capi
tal i
s pr
oduc
tion
valu
e m
inus
pur
chas
ed in
puts
; onl
y tr
ee s
eeds
are
ass
umed
to b
e pu
rcha
sed.
Net
ret
urns
to la
nd a
nd la
bour
: far
mer
s’ca
pita
l inp
uts
are
assu
med
to c
onsi
st o
nly
of o
wn
mai
ze s
eeds
; val
ue o
f far
m to
ols
is n
eglig
i-bl
e an
d th
eir
depr
ecia
tion
cost
s ar
e no
t inc
lude
d.P
rese
nt v
alue
use
s a
disc
ount
rat
e of
20%
.La
bour
inpu
t on
mai
ze: i
n w
este
rn K
enya
a w
orki
ng d
ay in
agr
icul
ture
con
sist
s of
5.5
hou
rs.
Labo
ur in
put f
or tr
ee s
owin
g: 1
3.1
wor
k da
ys h
a−1fo
r so
win
g pl
us 4
.4 w
ork
days
ha−1
for
gapp
ing
up a
few
wee
ks la
ter.
Labo
ur in
put f
or c
uttin
g tr
ees
cons
ists
of t
wo
cuts
: one
at t
he e
nd o
f the
fallo
w a
nd o
ne c
ut o
f reg
row
th d
urin
g th
e cr
oppi
ng s
easo
n.
Trees on Farms Ch4 16/2/02 11:51 am Page 76

Short Rotation Improved Tree Fallows 77
Tab
le 4
.2.
Bre
ak-e
ven
yiel
d in
crea
se (
expr
esse
d in
per
cent
age
of lo
ng-r
ains
yie
ld)
requ
ired
to c
over
the
cost
s of
impr
oved
fallo
wun
der
diffe
rent
ass
umpt
ions
, com
paris
ons
and
type
s of
ana
lysi
s. Ana
lysi
s of
ret
urns
to la
nd Low
opp
ortu
nity
Hig
h op
port
unity
cost
of l
abou
rdco
st o
f lab
oure
Mai
ze y
ield
aC
ompa
rison
bE
quat
ionc
%kg
ha−1
%kg
ha−1
low
IF v
s C
M0.
731
– 1.
239
PL
(1)
47%
282
−5%
−30
high
IF v
s C
M0.
736
– 0.
679
PL
(2)
59%
1121
31%
589
low
IF v
s U
F0.
005
+ 0
.389
PL
(3)
9%54
25%
150
high
IF v
s U
F0.
002
+ 0
.123
PL
(4)
3%57
8%15
2
Ana
lysi
s of
ret
urns
to la
bour Lo
w o
ppor
tuni
tyH
igh
oppo
rtun
ityE
quat
ion
cost
of l
andf
cost
of l
andg
low
IF v
s C
M
0.09
0 +
0.0
060R
LR+
0.0
034R
SR
(5)
17%
102
42%
252
high
IF v
s C
M−0
.047
+ 0
.003
3RLR
+ 0
.001
8RS
R(6
)−2
%−3
813
%24
7lo
wIF
vs
UF
0.18
6 –
0.00
27R
LR–
0.00
15R
SR
(7)
15%
904%
76hi
ghIF
vs
UF
0.16
6 –
0.00
09R
LR–
0.00
03R
SR
(8)
16%
9612
%22
8
a Low
-yie
lds
scen
ario
is th
e 25
th p
erce
ntile
sam
ple
mai
ze y
ield
: 600
kg
ha−1
in th
e lo
ng r
ains
and
400
kg
ha−1
in th
e sh
ort r
ains
.C
orre
spon
ding
cro
p la
bour
inpu
ts a
re 1
36.4
and
118
.2 w
ork
days
ha−1
, res
pect
ivel
y. H
igh
yiel
ds a
re th
e 75
th p
erce
ntile
sam
ple
mai
zeyi
elds
: 190
0 kg
ha−1
in th
e lo
ng r
ains
and
120
0 kg
ha−1
in th
e sh
ort r
ains
. Cor
resp
ondi
ng c
rop
labo
ur in
puts
are
200
.0 a
nd 1
81.8
wor
kda
ys h
a−1, r
espe
ctiv
ely.
b IF
= im
prov
ed fa
llow
, CM
= c
ontin
uous
mai
ze, U
F =
uni
mpr
oved
fallo
w.
c PL
= op
portu
nity
cos
t of l
abou
r in
US
$ da
y−1; R
LR, R
SR
= op
portu
nity
cos
t of l
and
in th
e lo
ng ra
ins
and
shor
t rai
ns, r
espe
ctiv
ely,
in U
S$
ha−1
.d U
S$0
.21
per
wor
k da
y, i.
e. 2
5% o
f wag
e ra
te.
e US
$0.6
3 pe
r w
ork
day,
i.e.
75%
of w
age
rate
.f H
alf t
he r
enta
l rat
e, i.
e. U
S$1
6.5
ha−1
year
−1(U
S$1
0 ha
−1in
the
long
rai
ns a
nd U
S$6
.5 h
a−1in
the
shor
t rai
ns).
g Dou
ble
the
rent
al r
ate,
i.e.
US
$66
ha−1
year
−1(U
S$4
0 ha
−1in
the
long
rai
ns a
nd U
S$2
6 ha
−1);
buy
ing
pric
e fo
r la
nd is
abo
ut U
S$6
60ha
−1; i
f the
inte
rest
rat
e is
20%
, in
a pe
rfec
t mar
ket r
ent s
houl
d be
abo
ut U
S$1
32 h
a−1, s
how
ing
that
the
land
mar
ket i
s hi
ghly
impe
rfec
tan
d la
nd r
ent r
elat
ivel
y ch
eap.
Trees on Farms Ch4 16/2/02 11:51 am Page 77

The percentage break-even yield increase was not greatly affected by changes inthe value of most of the economic parameters (Table 4.3). However, using pottedseedlings instead of direct seeding raised the break-even maize yield increase frombetween −5% and 47% to between 126% and 147%. An increase in the length ofthe improved fallow, or an increase in the firewood price, also greatly affected theresults. Compared to the unimproved fallow prototype, the break-even yieldincrease for improved fallow (Equations 4.3 and 4.4 in Appendix 4.1) is low underall assumptions (Table 4.2).
Returns to labour
As improved fallow required less labour than continuous cropping, the break-evenmaize yield for improved fallow, compared to continuous maize, was generallylower when the analysis was based on returns to labour than when on returns toland (Table 4.2). Furthermore, the break-even yield increase, when expressed in kgha−1, is hardly affected by a change in yield scenario (Fig. 4.2). The outcome ishighly sensitive to changes in the fuelwood price and establishment method(Table 4.3).
78 R.A. Swinkels et al.
900
800
700
600
500
400
300
200
100
0
50
45
40
35
30
25
20
15
10
0
5Bre
ak-e
ven
yiel
d in
crea
se (
kg h
a–1 )
Bre
ak-e
ven
yiel
d in
crea
se (%
of l
ong-
rain
s yi
eld)
0 500 1000 1500 2000 2500 3000 3500
Base maize yield (kg ha–1 year–1)
kg ha–1 (returns to land)% (returns to land) % (returns to labour)
kg ha–1 (returns to labour)
Fig. 4.2. Break-even yield increase of improved fallow as a function of base maizeyield. For the returns-to-land analysis, labour was valued at 50% of the wage rate;for the returns-to-labour analysis, land was valued at the rental rate.
Trees on Farms Ch4 16/2/02 11:51 am Page 78

Discussion
Extent of fallowing
The survey finding that periodic fallowing for soil-fertility restoration is a commonpractice in western Kenya is in conflict with the theories and empirical findings ofothers concerning areas of high population density. For example, Boserup (1965)claims that as population increases, fallowing is replaced by continuous cropping.Ruthenberg (1980) regards continuous cropping on impoverished soils as the finalsteady state in the land-use development process, although fallowing may occur as aconsequence of labour shortages and the need for grazing. The survey results sug-
Short Rotation Improved Tree Fallows 79
200
150
100
50
0
–50
Pre
sent
val
ue o
f net
ret
urns
to la
nd (
US
$ ha
–1)
Yield increase improved fallow
Improved fallow; labour valued at 25% of wage rate
Continuous maize; labour valued at 25% of wage rate
Improved fallow; labour valued at 50% of wage rate
Continuous maize; labour valued at 50% of wage rate
Improved fallow; labour valued at 75% of wage rate
Continuous maize; labour valued at 75% of wage rate
Break-even yield increase with increasing opportunity cost of labour
Fig. 4.3. Effect of opportunity cost of labour on break-even maize yield increase ofimproved fallow, relative to continuous cropping (low-yield scenario).
Trees on Farms Ch4 16/2/02 11:51 am Page 79

gest that labour shortages were not the main reason for fallowing. Instead, it wasdepleted land often in combination with the availability of off-farm income thatcaused farmers to fallow. As farmers with off-farm income are likely to have a higheropportunity cost of labour, they are more likely to conclude that cropping depletedland is uneconomical to them, compared to those with no off-farm income.Moreover, off-farm income also makes it easier for them to forego crop productionduring the fallow period, as they can purchase food. Off-farm employment ofhousehold members leading to more extensive land use has been observed else-where, e.g. in Zambia (Low, 1988), in Java, Indonesia (Nibbering, 1991), inCentral Province of Kenya and in north-west India (Dewees and Saxena, 1995).The potential beneficial effect of this extensification process on soil recovery in theJava uplands has been suggested by Barbier (1990) and Nibbering (1991).
Before our survey, Maseno agroforestry researchers had not consideredimproved fallow as relevant to the area, because it was thought that farmers do not
80 R.A. Swinkels et al.
Table 4.3. Sensitivity analysis showing the effect of changes in assumptions onthe break-even maize yield increase (expressed as a percentage of long-rainsyield) of improved fallow for the low-yield scenarioa and relative to continuouscropping.
Returns to land Returns to labouropportunity cost opportunity cost
of labourb of landc
Other assumptions Low High Low High
‘Base assumptions’ 47% −5% 17% 42%Maize price + 50% 55% 27% 13% 29%Maize price − 50% 21% −67% 23% 73%Discount rate 50% instead of 20% 61% 4% 20% 52%Valuing 10 tons DM ha−1 of −59% −100% −92% −67%
fuelwood instead of 1 ton ha−1
Establishment with potted 147% 126% 158% 168%seedlings instead of directseeding
3 seasons fallow instead of 170% −45% −67% 36%1 seasond
a25th percentile sample maize yield: 600 kg ha−1 in the long rains and 400 kgha−1 in the short rains; corresponding labour inputs are 136.4 and 118.2 workdays ha−1, respectively.bFor the low scenario, US$0.21 day−1, i.e. 25% of the wage rate. For the highscenario, US$0.63 day−1, i.e.75% of the wage rate.cFor the low scenario, half the rental rate, i.e. US$16.5 ha−1 year−1 (US$10 ha−1
in the long rains and US$6.5 ha−1 in the short rains). For the high scenario, dou-ble the rental rate is used, i.e. US$66 ha−1 year−1 (US$40 ha−1 in the long rainsand US$26 ha−1 in the short rains).dIncreased fuelwood production compared to a one-season fallow not valued;cutting back labour is assumed to be the same as with one-season fallow.
Trees on Farms Ch4 16/2/02 11:51 am Page 80

Short Rotation Improved Tree Fallows 81
fallow their land. As a result of the survey showing the prevalence of fallowing andthe on-farm trials demonstrating the feasibility of improved fallow, the technologybecame one of the main research foci of the Maseno Agroforestry Research Centre.
The existing occasional dense sesbania stands in fallow land usually originatefrom wildlings. It is not clear why farmers in western Kenya had not previouslythought of deliberately planting sesbania in high densities just before a fallow.Some farmers indicated that they did not consider it because sesbania is a commonindigenous tree in the area, and that they instead look for ‘new’ technologies tosolve their problems.
Feasibility and farmers’ evaluation of improved fallow
The on-farm trial showed that improved fallow to restore depleted land appearspromising under farmers’ conditions. Almost half of the farmers with good treeestablishment planted a new improved fallow on their own. Farmers on degradedsoils in densely populated areas of Benin gave similar positive evaluations of fallowsimproved with Mucuna pruriens (Versteeg and Koudokpon, 1993).
Costs and break-even yield increase
With low yields equivalent to the quartile for the area, maize growing is only prof-itable when opportunity costs of labour are below 70% of the rural wage rate (Fig.4.3). As hiring of labour is common in the area, even among farmers with lowyields, this means that some farmers grow maize at a loss and would financiallygain by leaving land fallow. That they do cultivate maize even when it is not prof-itable is probably associated with: (i) the cultural value that a household should beself-sufficient in maize; (ii) the high maize price during pre-harvest months, relativeto just after the harvest, the frequent need to purchase maize at this time and thepoorly functioning credit markets that make it difficult for farmers to finance suchpurchases; and (iii) risk management to cope with the occasional seasons whenmaize is only available at extremely high prices. Thus improved fallow technologymay also have a role in reclaiming depleted land that is currently being continu-ously cropped, as farmers are often making a financial loss in such situations.Improved fallow need not threaten food self-sufficiency of the household in anygiven season, as a farmer would likely have only a portion of land under fallow at atime and the fallow rotates within the farm. However, improved fallow will notsubstantially increase food production at a farm scale, unless yield responses(including the residual effects) are much larger than the lost production during thefallow.
Direct seeding and relay cropping were two key features that reduced thelabour requirements of improved fallows and made them relatively inexpensive, ascompared to using potted seedlings and planting trees at the beginning of the fal-low period. Direct seeding reduces the break-even yield increase by at least two-
Trees on Farms Ch4 16/2/02 11:51 am Page 81
82 R.A. Swinkels et al.
thirds compared to potted seedlings (Table 4.3). Relay cropping the trees intomaize greatly reduces the extra weeding requirement of the trees. In addition, relaycropping permits tree growth to be extended for two seasons while crops are beingfallowed for only one season. However, improved fallows do have to be planned inadvance and therefore cannot be adopted in cases where unpredictable labourshortages occur at planting time and prevent a farmer from planting part of hisland. Access to off-farm income or remittances may increase farmers’ ability topractice improved fallows, depending on the reliability of the food market, that is,whether or not food is available in the market at a reasonable price.
One would intuitively expect that the yield of maize grown after a fallowwould need to be at least double that obtained before the fallow in order to com-pensate for the lost production during the fallow period. Thus, one would expectthe break-even yield increase to be at least 100%. However, the results of the eco-nomic analysis show that the break-even yield increase required was much less thanthat under almost all assumptions. The main reason is that the foregone maizeyield during the fallow is partly compensated by the savings in crop labour andother crop inputs. Thus the break-even maize yield increase of improved fallowdepends on the amount and opportunity cost of the saved labour and the amountand value of the crop yield foregone. The lower the base maize yield is, and thehigher the opportunity cost of the household labour, the more attractive improvedfallows become. This confirms results from available theoretical economic modelsfor the optimal private and social utilization of soil. For example, Barbier (1990)shows that only when soil is severely degraded do soil restoration measures becomeeconomical for a farmer that maximizes long-term income. Krautkraemer (1994)demonstrates that recurring cycles of cropping and fallow cycles can be an optimalsoil management strategy because there are seasonal ‘fixed costs’ in farming that canbe avoided by not farming. Such ‘fixed costs’ include the minimum amount oflabour required before any yield is obtained, e.g. land preparation labour. Incurringsuch costs can result in an annual return to continuous cropping which is less thanthe average return from a cycle of farming and fallow.
Factors affecting adoption potential
The analysis shows that improved fallow is especially attractive to farmers ondepleted land and in areas where the opportunity cost of labour is high. It is espe-cially suited to farmers with off-farm income because they can afford to fallow landand are more likely to be interested in saving labour than full-time farmers.Improved fallow may qualify as an ‘induced innovation’, i.e. an innovation thatreflects farmers’ changing resource scarcities and uses less of resources that havebecome scarcer (and thus expensive) (Hayami and Ruttan, 1985). Improved fallowis also likely to be more profitable for higher-value crops, such as kale (Brassica oler-acea), than for maize, assuming a similar biophysical response.
The technology seems to be particularly beneficial for high-income house-holds, as they have a higher opportunity cost of labour. However, high-income
Trees on Farms Ch4 16/2/02 11:51 am Page 82

Short Rotation Improved Tree Fallows 83
households may prefer to put more emphasis on the use of other improved soilmanagement practices, such as fertilizer. When labour is scarcer than land,improved fallow requires only low amounts of yield increase to become more prof-itable than continuous cropping (rows 5–8 of Table 4.2; Fig. 4.2). Thus, the scarcerlabour is relative to land for a household, the lower the required break-even yieldincrease. Therefore, improved fallows may be of greatest benefits to poor house-holds that have little labour available per unit of land.
Because improved fallow with sesbania provides only small quantities of phos-phorus, it needs to be supplemented with phosphorus fertilizers on phosphorus-deficient soils, which are common in western Kenya (Sanchez et al., 1997).On-farm research and dissemination of rock phosphate, available from Tanzania,has begun in western Kenya (Niang et al., 1999)
Management options and implications for research
The surveys and trials reported in this chapter have confirmed the high degree offallowing in the densely populated farming systems of western Kenya and thepotential of improved tree fallows to improve farmers’ incomes. Two exampleshighlight how the trials have helped focus further research on problematic aspectsof improved fallows:
1. The variable success rates farmers had with tree establishment promptedresearchers to initiate a new trial evaluating different seeding methods for sesbania,as well as to look for new tree species with a larger seed size to decrease the chanceof seeds being washed away by rain.2. The high variability in tree growth triggered a new trial investigating the effectof early phosphorus applications on sesbania tree growth. Research is also neededto assess the role of inorganic fertilizer as an alternative or complement to improvedfallow.
The trials have also demonstrated various management options of the technol-ogy. In 1991, one farmer doubled the tree density we had initially recommended,planting in rows 2 m apart instead of 4 m. As this led to a much faster biomassaccumulation, we adopted this tree spacing for our recommended prototype in1992 and for later researcher-managed trials. Farmers’ experiences also showed that:(i) species planted to improve fallows should be easy to uproot; and (ii) improvedfallow using palatable tree species are not suitable in areas where wild antelopes arecommon or where farmers’ animals graze freely.
In summary, the surveys and on-farm trials on improved fallows have provento be effective means of demonstrating the potential of the technology to increasereturns to farmers’ resources, the socioeconomic limits to adoption of improved fal-lows, and how research may alleviate the main constraints and improve the produc-tivity and adoptability of the technology. Following completion of this study in1994, an expanded programme of tree species screening for improved fallows wasinitiated in researcher-designed, on-farm trials. Those showing consistently high
Trees on Farms Ch4 16/2/02 11:51 am Page 83

biomass production and crop response, Crotalaria grahamiana, Crotalariaochroleuca, Tephrosia vogelii and sesbania were advanced to type 2 and 3 trials(Niang et al., 1996, 1998). Concurrently, new type 1 on-farm trials were establishedto further evaluate fallow performance and management. By 2000, an extensionprogramme was rapidly expanding and several thousand farmers were plantingimproved fallows (Niang et al., 1999; Place et al., 2002).
Acknowledgements
We thank field technicians L. Anjeho, A. Otieno, J. Onoo and S. Amoko, and fieldassistants F. Ochuka, J. Otiende, J. Ounza, C. Omondi, M. Waswa, V. Atieno, N.Odhiambo, E. Olesi and M. Ayiemba. The support of the Kenya Forestry ResearchInstitute, in particular Daniel Nyamai, is appreciated. Henk Moll provided sugges-tions for presentation of the results. Comments on earlier drafts were received fromEve Crowley, Dirk Hoekstra, Bashir Jama, Jan-Willem Nibbering, SyllaPahladsingh, Frank Place and Meredith Soule. Financial support was provided bythe Rockefeller Foundation, while DGIS of The Netherlands Government sup-ported the first author and the Swedish International Development Associationfinanced the fourth author.
References
84 R.A. Swinkels et al.
Anderson, J.R. (1992) Difficulties in African agri-cultural systems enhancement: ten hypothe-ses. Agricultural Systems 38, 387–409.
Barbier, E.B. (1990) The farm-level economics ofsoil conservation: the uplands of Java. LandEconomics 66, 199–211.
Boserup, E. (1965) The Conditions of AgriculturalGrowth: the Economics of Agrarian ChangeUnder Population Pressure. AldinePublishing Company, Chicago, Illinois.
Bradley, P.N. (1991) Woodfuel, Women andWoodlots, Vol. 1, The Foundation of aWoodfuel Development Strategy for EastAfrica. Macmillan, London.
Collier, P. (1989) Contractual constraints onlabour exchange in rural Kenya.International Labor Review 128, 745–768.
David, S. and Swinkels, R.A. (1994) Socio-Economic Characteristics of HouseholdsEngaged in Agroforestry Technology Testing inWestern Kenya. AFRENA Report No. 78.International Centre for Research inAgroforestry, Nairobi, Kenya.
De Janvry, A., Fafchamps, M. and Sadoulet, E.(1991) Peasant household behaviour with
missing markets: some paradoxes explained.The Economic Journal 101, 1400–1417.
Dewees, P.A. and Saxena, N.C. (1995) Treeplanting and household land and labourallocation: case studies from Kenya andIndia. In: Arnold, J.E.M. and Dewees, P.A.(eds) Tree Management in Farmer Strategies:Responses to Agricultural Intensification.Oxford University Press, Oxford,pp. 198–241.
Ellis, F. (1988) Peasant Economics: FarmHouseholds and Agrarian Development. WyeStudies in Agricultural and RuralDevelopment. Cambridge University Press,Cambridge.
Evans, D.O. and Rotar, P.P. (1987) Sesbania inAgriculture. Westview Press, Boulder,Colorado.
Hayami, Y. and Ruttan, V. (1985) AgriculturalDevelopment: an International Perspective.Johns Hopkins University Press, Baltimore,Maryland.
Hoefsloot, H., van der Pol, F. and Roeleveld, L.(1993) Jachères Améliorées: Options Pour LeDéveloppement Des Systèmes De Production
Trees on Farms Ch4 16/2/02 11:51 am Page 84

En Afrique De l’Ouest. Royal TropicalInstitute (KIT), Amsterdam.
Hoekstra, D. and Corbett, J. (1995) SustainableAgricultural Growth for the Highlands ofEast and Central Africa: Prospects to 2020.ICRAF, Nairobi, Kenya.
ICRAF (1992) Annual Report 1991.International Centre for Research inAgroforestry, Nairobi.
Krautkraemer, J.A. (1994) Population growth,soil fertility, and agricultural intensifica-tion. Journal of Development Economics 44,403–428.
Low, A. (1988) Farm-household economics andthe design and impact of biological researchin southern Africa. AgriculturalAdministration and Extension 29, 23–34.
Ndufa, J.K., Ohlsson, E., Swinkels, R.A. andShepherd, K.D. (1995) Participatoryresearch methods for agroforestry technol-ogy development in western Kenya. In:Design Implementation and Analysis of On-Farm Trials: An Assessment of FieldExperience. Proceedings of an internationalworkshop, 28 June–2 July 1993, Arusha,Tanzania. Royal Tropical Institute,Amsterdam, pp. 187–204.
Niang, A., Amadalo, B., Gathumbi, S.M.,Otieno, J.H.O., Obonyo, C.O. andObonyo, E. (1996) AFRENA ProjectMaseno, Kenya. Progress and TechnicalReport 1996. AFRENA Working Paper No.110. ICRAF, Nairobi, Kenya.
Niang, A., Amandalo, B., Kaleb, M., Obonyo,C.O. and Simone, R. (1998) AFRENAProject, Maseno, Kenya. Progress andTechnical Report 1997. AFRENA WorkingPaper No. 122. ICRAF, Nairobi, Kenya.
Niang, A., De Wolf, J., Gathumbi, S. andAmandalo, B. (1999) The potential ofshort duration improved fallows withselected trees and shrubs for crop produc-tivity enhancement in the densely popu-lated highlands of Western Kenya. Paperpresented at the workshop: La Jachère enAfrique Tropicale. Rôles, Aménagements,Alternatives, Dakar, 13–16 April. CORAF-ISRA-ORSTOM.
Nibbering, J.W. (1991) Crisis and resilience inupland land use in Java. In: Hardjono, J.(ed.) Indonesia: Resources, Ecology andEnvironment. Oxford University Press, NewYork, pp. 104–132.
Oldeman, L.R., van Engelen, V.W.P. and Pulles,J.H.M. (1991) The extent of human-induced soil degradation. In: Oldeman,L.R., Hakkeling, R.T.A. and Sombroek,W.G. (eds) World Map of the Status ofHuman-induced Soil Degradation.International Soil Reference andInformation Centre, Wageningen,Netherlands and UNEP, New York.
Onim, J.F.M., Otieno, K. and Dzowela, B.(1990) The role of sesbania as multipur-pose trees in small-scale farms in westernKenya. In: Macklin, B. and Evans, D.O.(eds) Perennial Sesbania Species inAgroforestry Systems, Proceedings of a work-shop held in Nairobi, 27–31 March 1989.The Nitrogen Fixing Tree Association,Hawaii, pp. 167–179.
Place, F., Franzel, S., DeWolf, J., Rommelse, R.,Kwesiga, F., Niang A. and Jama, B. (2002)Agroforestry for soil fertility replenishment:evidence on adoption processes in Kenyaand Zambia. In: Barrett, C.B., Place, F. andAboud, A.A. (eds) Natural ResourceManagement in African Agriculture:Understanding and Improving CurrentPractices. CAB International, Wallingford,UK.
Ruthenberg, H. (1980) Farming Systems in theTropics, 3rd edn. Clarendon Press, Oxford,UK.
Sanchez, P.A., Shepherd, K.D., Soule, M.J.,Place, F.M., Mokwunye, A.U., Buresh,R.J., Kwesiga, F.R., Izac, A.N., Ndiritu,C.G. and Woomer, P.L. (1997) Soil fertilityreplenishment in Africa: an investment innatural resource capital. In: Buresh, R.J.and Sanchez, P.A (eds) Replenishing SoilFertility in Africa, SSSA SpecialPublication. Madison, Wisconsin.
Scherr, S.J. (1993) Evaluation of agroforestrypractices over time in the crop-livestocksystem of western Kenya. In: Dvorák, K.A.(ed.) Social Science Research for AgriculturalTechnology Development: Spatial andTemporal Dimensions. CAB International,Wallingford, UK, pp. 118–144.
Shepherd, K.D., Ohlsson, E., Okalebo, J.R. andNdufa, J.K. (1996) Potential impact ofagroforestry on soil nutrient balances at thefarm scale in the East African Highlands.Fertiliser Research 44, 87–99.
Short Rotation Improved Tree Fallows 85
Trees on Farms Ch4 16/2/02 11:51 am Page 85

Versteeg, M.N. and Koudokpon, V. (1993)Participative farmer testing of four lowexternal input technologies, to address soilfertility decline in Mono Province (Benin).Agricultural Systems 42, 265–276.
Yamoah, C.F. and Burleigh, J.R. (1990) Alleycropping Sesbania sesban (L.) Merill withfood crops in the highland region ofRwanda. Agroforestry Systems 10, 169–181.
86 R.A. Swinkels et al.
Trees on Farms Ch4 16/2/02 11:51 am Page 86

Short Rotation Improved Tree Fallows 87
Appendix 4.1 Derivation of the Break-even Equations
Returns to land
In the analysis of returns to land, labour was valued but land was not.
Improved fallow compared to continuous maize
In order to break even, the extra costs per unit of land of improved fallow shouldequal the extra benefits:
PtsSt + PLLts + PmY S+ PLLc = PmSS
m + PLLSm + PfF + PmBEYIlandY L
1 + r (1 + r)2 1 + r (1 + r)2 (4.1)
where,Pts = price of tree seed (US$ kg−1),St = amount of tree seed required to plant the improved fallow (kg ha−1),PL = opportunity cost of labour (US$ day−1),Lts = amount of labour required for tree sowing (work days ha−1),Pm = market price of maize (US$ kg−1),Y S = maize yield in the short rains (kg ha−1),r = social time preference rate (discount rate),Lc = amount of labour required to cut back the trees at the end of the fallow (workdays ha−1), SS
m = amount of maize seed used in the short rains (kg ha−1),LS
m = maize labour input in the short rains (work days ha−1),Pf = opportunity cost of sun-dried firewood (US$ kg−1),F = amount of dry firewood (kg ha−1),BEYIland = the break-even yield increase in the long rains after the fallow (% oflong rains yield under continuous cropping) for the analysis of returns to land, andY L = maize yield in the long rains under continuous cropping (kg ha−1).
The break-even yield increase can then be derived:
BEYIland = (1 + r)(PtsSt + PLLts + PmY S − PmSSm −PLLS
m) + (PLLc − PfF ). (4.2)PmY L PmY L
Improved fallow compared to unimproved fallow
As above, in order to break even, the extra costs per unit of land of improved fallowshould equal the extra benefits:
(PtsSt + PLLts) + PLLc = (PfF + PmBEYIlandY L) (4.3)
1 + r (1 + r)2 (1 + r)2
Trees on Farms Ch4 16/2/02 11:51 am Page 87

88 R.A. Swinkels et al.
from (Equation 4.3) follows:
BEYIland = −PfF + (1 + r)(PtsSt + PLLts) + PLLc (4.4)PmY L
Returns to labour
In the analysis of returns to labour, land was valued, but labour was not; instead thenet returns were divided by the amount of labour. Thus, for improved fallow com-pared to continuous maize, to break even:
present value of net returns improved fallow=
present value of net returns continuous maizepresent value labour input improved fallow present value labour input continuous maize.
Or, for the comparison with unimproved fallow:
present value of net returns improved fallow=
present value of net returns unimproved fallowpresent value labour input improved fallow present value labour input unimproved fallow.
Trees on Farms Ch4 16/2/02 11:51 am Page 88

Summary
The biophysical and socioeconomic performance of hedgerow intercropping for soilfertility improvement was assessed in a farmer-participatory trial in western Kenyaover 3 years. Farmers successfully established dense hedgerows but planting andpruning considerably increased labour use during the busiest period of the year.Women did not generally prune the hedges. The yields of hedgerow prunings ofLeucaena leucocephala and Calliandra calothyrsus (1–4 t ha−1 year−1, n = 24) werelow compared to potentials in the region (4–8 t ha−1). The hedgerows had no effecton grain yield over five seasons. But they reduced slopes from 7.2 to 4.5% withinalleys (P < 0.01) and thus were likely to have decreased soil erosion.
The average extra maize yield required each year, beginning in the second year,to cover the added cost of hedgerow intercropping was 10.5% (SD = 5.5%) whenbased on returns to land, and 17.5% (SD = 6.5) based on returns to labour.Although about half the farmers claimed that hedges improved crop yields, after 3years of experimentation, only about a fifth planted additional hedges and only14% did so to improve soil fertility. It thus appears that the potential for its adop-tion as a soil fertility practice in this area is low. Hedgerow intercropping appears tohave greater adoption potential if its aim is to provide feed for an intensive dairyoperation or for curbing soil erosion. Control plots were of little use as farmers weremore interested in contrasting test-plot yields with past yields than comparing the
Assessing the AdoptionPotential of Hedgerow
Intercropping for Improving Soil Fertility,
Western KenyaR.A. SWINKELS,1 K.D. SHEPHERD,2 S. FRANZEL,2J.K. NDUFA,3 E. OHLSSON4 AND H. SJOGREN4
1The World Bank in Vietnam, 8th Floor, 63 Ly Thai To Street, Hanoi,Vietnam; 2International Centre for Research in Agroforestry, I
CRAF House, PO Box 30677, Gigiri, Nairobi, Kenya; 3Kenya ForestryResearch Institute (KEFRI), Maseno Agroforestry Research Centre, Maseno, PO Box 25199, Kisumu, Kenya; 4Sida/SAREC, SE-105 25
Stockholm, Sweden
© CAB International 2002. Trees on the Farm (eds S. Franzel and S.J. Scherr) 89
5
Trees on Farms Ch5 16/2/02 11:51 am Page 89

test and control plots. Different types of trials may be required to obtain reliable bio-physical data on yield response and socioeconomic data on farmer assessment of com-plex agroforestry technologies.
Introduction
There is a considerable body of research showing that crop yields can be increasedsignificantly by hedgerow intercropping (also called alley cropping or alley farming),a technology in which crops are grown between rows of nitrogen-fixing trees andthe trees’ leafy biomass is applied to the crops (Kang et al., 1990; Kang, 1993). Butthere is little scientific data on the performance of hedgerow intercropping for soilfertility improvement under farmer-managed conditions in the tropics, despite con-siderable extension (Müller and Scherr, 1989; Carter, 1995). Potential difficulties inconducting on-farm trials with complex agroforestry technologies have beenreviewed by Shepherd and Roger (1991). Earlier analyses of the adoption potentialof hedgerow intercropping were based mainly on ex ante analysis of on-station trialresults (Swinkels and Scherr, 1991). Few on-farm trials or social or economic analy-ses have been reported, and these are mostly from subhumid to humid areas in westAfrica (Whittome, 1994; Dvorak, 1996). Even these trials had several limitationsfor the assessment of adoption potential: (i) targeting was inappropriate as oftenfarmers’ priority problem was not low soil fertility; (ii) farmers’ participation wasobtained through the provision of incentives, such as free fertilizer and improvedcrop material; and (iii) there was limited monitoring to establish labour require-ments and crop and economic performance relative to existing systems (Whittome,1994). Better farmer participation was obtained where soil fertility decline was per-ceived by farmers as a serious problem (Versteeg and Koudokpon, 1993). The lim-ited adoption of hedgerow intercropping that has occurred has been for soilconservation on sloping land (particularly in the Asian/Pacific region) and for fod-der production in intensive dairy systems, or because of indirect benefits providedby the projects themselves (Whittome, 1994; Carter, 1995).
This study uses 3 years’ results from a farmer-participatory trial to assess theadoption potential of hedgerow intercropping, primarily for soil fertility improve-ment, in a subsistence-level crop/livestock farming system in the humid highlandsof western Kenya. The components were:
1. Biophysical response:1 What were the effects of the trees on slope and cropyields?2. Feasibility: Are farmers able to manage the technology? Do they have therequired information and are they able to plant and maintain the hedges, and tocope with any problems that arise?
90 R.A. Swinkels et al.
1 Several agronomic substudies were conducted to assess the degree of competition betweenhedges and adjacent maize rows, to confirm maize yield responsiveness to appliednutrients and tree prunings, and to test the response of hedge biomass production tonitrogen and phosphorus applications. These studies are reported in Shepherd et al. (1997).
Trees on Farms Ch5 16/2/02 11:51 am Page 90

3. Profitability: Are the financial benefits obtained greater than the costs incurred?4. Acceptability: Do farmers perceive that the advantages of using the technologyare greater than the disadvantages? Acceptability thus includes a range of criteria inaddition to profitability and feasibility, such as riskiness and compatibility withother enterprises.
For each of the above components, selected farm and household characteristics wereexamined to assess whether they were associated with the uptake of the technology.
Materials and Methods
Study area and background
The study area included parts of Siaya, Kisumu and Vihiga Districts, locatedbetween 0°05�S and 0°10�N, to 34°31�E to 34°40�E, chosen to represent humidareas of the food-crop land-use system of western Kenya which have high agriculturalpotential but where land has become nutrient depleted (Fig. 4.1) (Shepherd et al.,1992). The population density ranges from 300 to over 1000 persons km−2 in someareas. There are two cropping seasons: the long rains from March to July and theshort rains from August to November, totalling 1500–1800 mm year−1, with a meanannual temperature of 21.0°C. The landscape is undulating with average slopes of2–8%, dominated by Acrisols, Ferralsols and Nitisols (Shepherd et al., 1992).
Hedgerow intercropping had been introduced to farmers in the area in 1983by the CARE-Kenya Agroforestry Extension Project, to address soil fertility con-straints and produce fuelwood. Several hundred farmers planted hedges of primarilyLeucaena leucocephala (leucaena) but no quantitative data on biophysical or eco-nomic performance were available. An evaluation in 1988 found that spacing andmanagement were highly variable and that median tree density was very low, 2000trees ha−1, roughly half of the density required to supply adequate nitrogen toimpact on crop yield. Not surprisingly, only one-quarter of plots showed notablyhigher crop yields, according to farmers’ qualitative assessments (Scherr and Oduol,1989; Scherr, 1995).
Farmer selection and treatment design
In participatory rapid appraisals, farmers identified soil fertility as a key problemand expressed interest in testing hedgerow intercropping (Ohlsson et al., 1992).Two to three farmers from 29 farmer groups in the area participated in the trial: thegroups were selected to represent the main variation in soils and ethnic groups inthe area (Ohlsson et al., 1992). The recommended prototype, which was developedwith farmers, consisted of L. leucocephala, Leucaena diversifolia, Calliandra calothyr-sus (calliandra), or Gliricidia sepium, planted from inoculated seedlings, with0.30 m between trees in contour-aligned rows about 4 m apart (8333 trees ha−1)(Ohlsson et al., 1992). Crops were planted close to the trees so there was no loss of
Adoption Potential of Hedgerow Intercropping 91
Trees on Farms Ch5 16/2/02 11:51 am Page 91

cropped area due to trees. The trial was started with 24 farmers from ten groups inAugust 1990, and with a further 29 farmers, including six additional groups, inFebruary 1991. Farmers received advice from the project technicians on hedgerowmanagement throughout the reported period, but farmers made all crop and treemanagement decisions.
Trial design and measurements
The trial design consisted of a control plot without hedges and an adjacent plotwith hedges on each farm. The L. leucocephala seedlings were a mixture ofHengchun, Kisumu, Gede, Siakago and Baobab provenances (29 farms), C.calothyrsus was Guatemala provenance (18 farms), L. diversifolia wasVeracruz/Mexico provenance (four farms), and G. sepium was established from cut-tings from a local source (two farms). The 1990 plantings were all of L.leucocephala. The seedlings were inoculated with compatible rhizobia in polythenetubes in a nursery before being delivered to the farms.
Project technicians recorded the number of trees planted, the number survivingat 6 months, and the causes of plant death on each tree plot. Crop harvest yieldswere measured on the whole area of test and control plots in five consecutive sea-sons from the short rains in 1990, on farms where annual crops were grown and thetrial maintained (n = 41). The total produce of maize cobs and pods of any inter-crops from each plot were weighed and subsamples taken to determine oven-drygrain weight. Farmers’ estimates of numbers of green maize cobs harvested earlier inthe season were converted to dry grain weight on the basis of average cob weights.Crop plant populations were estimated from quadrat counts, and the incidence ofpests, weeds and diseases were scored on each plot.
Soil properties were determined in each plot (Shepherd et al., 1996). Averageslopes were measured on all farms using a clinometer. On eight of the steeper farms,the average slope of the hedgerow plot and the slope within each alley were deter-mined in October 1994, using a surveying level.
Social and economic analysis
Project staff conducted informal, semi-structured surveys during the trial’s first 2years to define the methods and the criteria farmers used to evaluate hedgerowintercropping, to obtain their assessments, and to examine the problems theyencountered (David, 1992). Formal surveys using structured questionnaires wereused to test hypotheses developed from the informal surveys and to quantify criticalparameters, including household characteristics (David and Swinkels, 1994) andfarmers’ assessments of the technology. Data on the use of labour and other inputswere collected on each plot using two different methods: farmers’ recall just after atask was completed (for crop management) and monitoring of work rates throughobservation (for planting and cutting back trees). The number of farmers includedin the above surveys ranged from 33 to 46.
92 R.A. Swinkels et al.
Trees on Farms Ch5 16/2/02 11:51 am Page 92

To assess profitability, enterprise budgets for maize with and without hedgeswere drawn up, using input and output data from the 23 farms for which completedata sets were available. The only data not used were for the response of maizeyields to the hedgerows, although the available evidence indicated that thehedgerows had no effect on yields (Shepherd et al., 1997). Therefore, break-evenmaize yields were calculated, that is, the increase in maize yields required to pay forthe costs of establishment and maintenance of the hedges. Separate budgets weredrawn up for each farmer in order to assess the variability in costs and returnsamong farms. Two types of analysis were carried out: net returns to land and netreturns to labour. In net returns to land, household labour was valued at its oppor-tunity cost, as estimated by the hired labour price. Land was not valued; returnswere instead expressed on a per-hectare basis. This measure was relevant for farmerswhose most scarce input was land. Net returns to labour, on the other hand, weremost relevant for farmers whose most scarce input was labour. Land was valued atits opportunity cost, as estimated by rental rates. Household labour was not valuedand returns were expressed per unit of labour. The break-even analysis was based ona 5-year time period with maize yields increasing in the second year and remainingconstant thereafter.
Sensitivity analysis was conducted to measure the effects of changes in some ofthe base parameters on the break-even maize yield increase. The riskiness ofhedgerow intercropping was also assessed, using two methods. First, the variabilityin the net returns was compared between the two treatments, that is, maize with andwithout hedges. Secondly, minimum returns analysis (CIMMYT, 1988) was used tocompare the average of the lowest 25% of the net benefits for the two treatments.
Three methods were used to assess acceptability. First, project staff asked farm-ers to compare yields on the control and test plots. Secondly, the other criteria usedby farmers to evaluate the technology were identified and farmers were asked howthe technology performed by these criteria. Thirdly, their willingness to expand thehedgerows on their farms was monitored by offering them seed in the third yearafter establishment. Data on acceptability were collected using informal interviews,farmer-to-farmer group visits, formal surveys and monitoring of expansion throughobservation. A hierarchical decision tree was constructed to model farmers’ deci-sions to expand their plantings (Gladwin, 1980). This method was useful forexplaining the decisions farmers made by breaking them down into a series of sub-decisions and mapping farmers’ decision paths along the branches of the tree.
Results and Discussion
Farmer and seasonal rainfall characteristics
Participants were broadly representative of the range of types of farmer found in thearea; over one-quarter were female-headed, most were of average wealth, and farmsize ranged from 0.1 to 6.1 ha (Table 5.1; David and Swinkels, 1994). Eleven of the
Adoption Potential of Hedgerow Intercropping 93
Trees on Farms Ch5 16/2/02 11:51 am Page 93

56 participating farmers dropped out of the trial within the first year but the partici-patory approach was otherwise successful in maintaining farmers’ interest in the trial.
The seasonal total rainfall at Maseno for each of the seven seasons from theshort rains 1990 did not differ by more than 25% from the long-term average val-ues (1960–1993; 895 mm in long rains, and 774 mm in short rains).
Tree establishment and early growth
The size of plots planted with hedges ranged from 270 to 2010 m2 with a medianof 790 m2 (n = 42). Tree density, which ranged from 3660 to 10,040 with a median
94 R.A. Swinkels et al.
Table 5.1. Characteristics of farmers participating in the hedgerow intercroppingtrial (n = 45).
Variable Min. Median Max. Frequency (%)
Farm size, all parcels (ha) 0.1 1.3 6.1 –Household size (members) 2 6 15 –Labour:land ratio 0.6 2.2 23.6 –
(adult equivalent workers ha−1)Farm first cultivated (year) 1935 1977 1991 –Ethnic group
Luhya 22Luo 78
Household typemale 72female de jure 13female de facto 15
Age of household head (years)<40 2440–60 52>60 24
Education of household head<primary 19primary 59>primary 22
Wealth category<average 26average 67>average 7
Off-farm income (one or both 82partners)
Use of hired labour 87Ownership of cows 80Ownership of improved-breed 6
dairy cows
Source: David and Swinkels, 1994.
Trees on Farms Ch5 16/2/02 11:51 am Page 94

of 6680 trees ha−1, was negatively correlated with plot size (r = −0.45, P < 0.01).This indicated that the potential benefits of the technology, resulting from biomassproduction, would decrease with increasing plot size. The proportion of the origi-nally planted trees surviving at 6 months after planting (MAP) ranged from 0.33 to1.00 with a median of 0.91. Termite damage was observed to be the primary causeof tree mortality on 30 farms, whereas other causes were important on only a fewfarms: moles, 4; drought, 3; uprooting, 1; erosion, 1; and fire, 1. Browsing, mostlyby Kirk’s dik-dik (Madoqua kirki), occurred on ten farms, primarily those nearuncultivated land.
Survival was not related to browsing, but there was a higher frequency of lowsurvival rates in leucaena (40% farms had <80% survival, n = 25 farms) than in cal-liandra (6% farms had <80% survival, n = 17). The frequency of termites as themain cause of damage was similar for the two species (68% leucaena, 76% callian-dra), but the survival differences could have been due to differences in rainfall dur-ing the 2 months after planting. This was lower in the short rains of 1990 whenmost (n = 22) of the leucaena was planted (302 mm) than in the long rains of 1991when all of the calliandra was planted (537 mm).
At 6 months after planting, median tree height was 97 cm (range 34–140) forleucaena (12 farms) and 152 cm (range 90–196) for calliandra (12 farms), whilemedian stem basal diameter was 1.4 cm (range 1.0–1.8) and 1.5 cm (range0.8–2.1), respectively. The median early growth rates were substantially (about40%) lower than those obtained with the same provenances in researcher-managedexperiments at the Maseno Agroforestry Research Centre (Heineman et al., 1990).However, trees in the on-station experiments received 25 g diammonium phosphateper tree at transplanting and were established with well-weeded and phosphate-fer-tilized beans for the first two seasons.
Tree yield
Farmers cut the hedges between four and seven times during the 2 years of moni-toring of hedge biomass on 24 farms. There was no significant effect of species,provenance, season or year on tree total biomass yield and dry matter partitioning(P > 0.05). However, total biomass was significantly greater (P < 0.001) at the firstcut (1.68 t ha−1) than at the second cut (0.74 t ha−1) in the season. Woody stemcomprised 33% of the total biomass at the first cut but only 4% at the second cut,reflecting the younger growth at the second cut.
On the farms the annual amount of biomass returned to the soil ranged from1.2 to 4.3 t ha−1 year−1 (median = 2.4 t ha−1 year−1) and was below on-station levelsmeasured over the same growth phase (about 4.4 t ha−1 year−1 for leucaena(Hengchun) at a spacing of 3.75 × 0.25 m, and 7.3 t ha−1 year−1 for leucaena(Hengchun) and 10.8 t ha−1 year−1 for calliandra (Guatemala) both at a spacing of2.8 × 0.25 m (Heineman et al., 1990; Otieno et al., 1991). In experiments in thesubhumid and humid tropics with the same species and management, maximumannual yields of prunings were 4–8 t ha−1 year−1 (Balasubramanian and Sekayange,
Adoption Potential of Hedgerow Intercropping 95
Trees on Farms Ch5 16/2/02 11:51 am Page 95

1991; Kang, 1993). The amounts of nutrients returned in prunings were corre-spondingly low, but on all farms the amounts are significant in relation to croprequirements (Shepherd et al., 1997).
The growth of leucaena was affected by an infestation of the psyllidHeteropsylla cubana from March 1993 onwards. Total biomass over the five cuts was590 g m−1 of hedge (range 90–810) in leucaena compared with 1850 g m−1 (range1000–2860) in calliandra; before 1993 there was no difference in yields betweenthe two species. Thus the potential effects of leucaena on soil fertility are likely to belimited as long as the psyllid infestation persists.
Crop yields and terracing effect of hedges
Farmers grew a wide range of crop mixtures and fallows in the test and controlplots, making it difficult to evaluate the effects of the hedgerows on yields. Forexample, in the long rains of 1992, out of 86 plots, 68 had maize; six, sorghum; 39,beans; 18, groundnuts; and 16, weedy fallow. Farms where maize was grown as themain crop in both plots, either as a sole crop or with grain intercrops, were selectedfor analysis of yields in each season. There was no significant difference in meangrain yields (expressed as sum of maize and intercrop grain dry weights) betweenthe hedgerow and the control plots in any individual season. Averaged over five sea-sons, mean grain yields were 16% lower in the hedgerow plots than the controlplots, but the significance of this difference was marginal (P = 0.05). The lack ofevidence for an effect of the hedges on yield in the researcher-managed competitionstudy (Shepherd et al., 1997) suggests that the difference was due to variation infarmer management between the two plots.
Regression models were used to test the hypothesis that selected soil and man-agement variables (nitrogen and phosphorus concentration in the subsoil, pur-chased inputs, and manure application) account for the variation in control plotgrain yields and the difference in grain yield between the hedgerow and controlplots. However, little of the variation could be accounted for by linear regressionwith the measured variables (Shepherd et al., 1997). Apparently, variation in yieldamong plots and farms was determined by a wide range of biophysical and socio-economic factors, and could not be explained adequately by the measured variableswithin the limitations of the sample size.
Average slopes ranged from 1 to 13% with a median of 5.8% (44 farms). Thehedgerows had a significant terracing effect: the mean slope within alleys was 4.5%compared with 7.2% over the length of the hedgerow plots (P < 0.01, eight farms).
Feasibility
The hedges required planting just after the rainy season began, when farmers werebusy preparing land and planting their crops. In fact, hedgerow establishmentgreatly exacerbated peak periods of labour use; when hours spent planting seedlings
96 R.A. Swinkels et al.
Trees on Farms Ch5 16/2/02 11:51 am Page 96
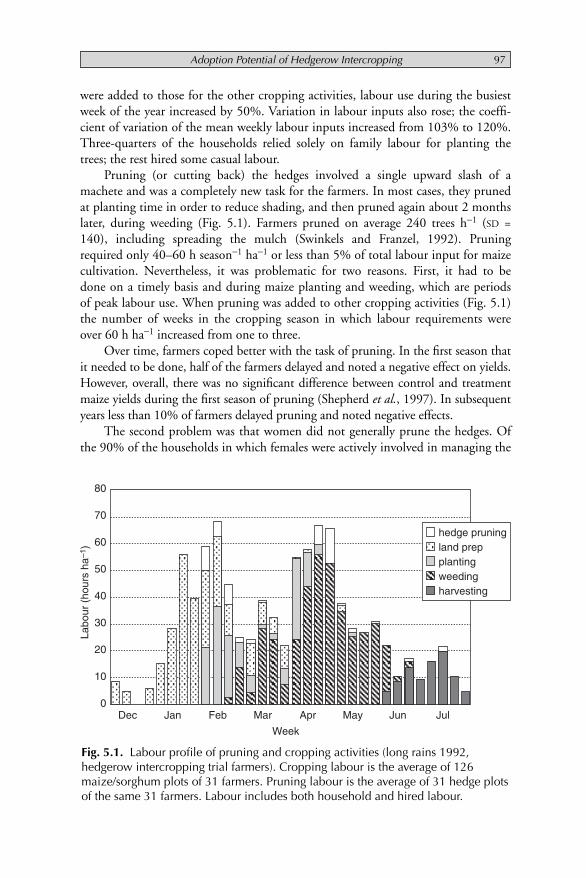
were added to those for the other cropping activities, labour use during the busiestweek of the year increased by 50%. Variation in labour inputs also rose; the coeffi-cient of variation of the mean weekly labour inputs increased from 103% to 120%.Three-quarters of the households relied solely on family labour for planting thetrees; the rest hired some casual labour.
Pruning (or cutting back) the hedges involved a single upward slash of amachete and was a completely new task for the farmers. In most cases, they prunedat planting time in order to reduce shading, and then pruned again about 2 monthslater, during weeding (Fig. 5.1). Farmers pruned on average 240 trees h−1 (SD =140), including spreading the mulch (Swinkels and Franzel, 1992). Pruningrequired only 40–60 h season−1 ha−1 or less than 5% of total labour input for maizecultivation. Nevertheless, it was problematic for two reasons. First, it had to bedone on a timely basis and during maize planting and weeding, which are periodsof peak labour use. When pruning was added to other cropping activities (Fig. 5.1)the number of weeks in the cropping season in which labour requirements wereover 60 h ha−1 increased from one to three.
Over time, farmers coped better with the task of pruning. In the first season thatit needed to be done, half of the farmers delayed and noted a negative effect on yields.However, overall, there was no significant difference between control and treatmentmaize yields during the first season of pruning (Shepherd et al., 1997). In subsequentyears less than 10% of farmers delayed pruning and noted negative effects.
The second problem was that women did not generally prune the hedges. Ofthe 90% of the households in which females were actively involved in managing the
Adoption Potential of Hedgerow Intercropping 97
80
70
60
50
40
30
20
10
0
hedge pruningland prepplantingweedingharvesting
Dec Jan Feb Mar Apr May Jun Jul
Labo
ur (
hour
s ha
–1)
Week
Fig. 5.1. Labour profile of pruning and cropping activities (long rains 1992,hedgerow intercropping trial farmers). Cropping labour is the average of 126maize/sorghum plots of 31 farmers. Pruning labour is the average of 31 hedge plotsof the same 31 farmers. Labour includes both household and hired labour.
Trees on Farms Ch5 16/2/02 11:51 am Page 97

farm, only 19% of prunings were done by women. Only in female-headed house-holds did females prune. Women claimed that they lacked the strength to do it andthat using a machete was a man’s task (David, 1992).
Neither browsing of trees by animals nor the effects of the hedges on other crop-ping activities were important problems for the farmers. Browsing by wild and domes-tic animals was reported by 8–19% of the farmers per season over the years but inmost cases only a few trees were browsed. Problems in land preparation were reportedby 25–33% of farmers, including both oxen-users, who complained that hired oxendid not plough close enough to the hedges, and farmers preparing by hand, who men-tioned interfering tree roots and branches. In contrast, between 5% and 15% reportedthat the hedges reduced labour required for preparation, because the hedges reducedweed incidence and softened the soil. Roughly equal numbers (10–25%) felt that thehedges increased and reduced labour requirements for weeding.
Profitability
The costs of hedgerow intercropping were highest in the first season, when hedgeswere established (Table 5.2). Seedling costs and planting labour added 78% to theproduction costs of maize during this season. Thereafter, pruning was the only extracost on the hedge plots, adding only 3% (SD 2%) to maize production costs.
Fuelwood was harvested each year from the hedge treatment, and extra maizefrom increased soil fertility was assumed to be harvested each season, beginning inyear 2. During the first year, the hedges did not affect maize yields; no evidence ofan effect was found in either the maize yield data (Shepherd et al., 1997) or infarmers’ own assessment. The analysis (Table 5.2) showed that variability of the netbenefits was high. The extra maize yield required each year to cover the added costsof hedge establishment and maintenance was 242 kg ha−1 (SD = 65 kg), or on aver-age 10.5% (SD = 5.5%) of farmers’ mean maize yields, which were 1521 kg ha−1 (SD
= 873) in the long rains and 1180 kg ha−1 (SD = 1118) in the short rains; medianyields were 1220 kg ha−1 and 794 kg ha−1, respectively.2
Because household labour inputs were higher for hedgerow intercropping thanfor conventional maize, the technology was less profitable and the break-even maizeyield increase higher in returns to labour analysis than in returns to land analysis.An annual maize yield increase of 475 kg ha−1 (SD = 267 kg), or, on average, 17.5%(SD = 6.5%) of farmers’ mean maize yield, was required to break even.
The break-even maize yield increase was fairly stable under a range of changesin the assumptions and values (Table 5.3). For the returns to land analysis, thebreak-even increase ranges from 6% to 21%, and in the returns to labour analysis,from 12% to 35%. For the returns to land analysis, a change from potted seedlingsto bare-rooted seedlings, which resulted in a 60% reduction in establishment costs,
98 R.A. Swinkels et al.
2 The average of all individual break-even yield increases is 10.5%; when the average of thevalue of all individual maize yield increases is divided by the value of the average maizeproduction, the outcome is 8.5%.
Trees on Farms Ch5 16/2/02 11:51 am Page 98

Adoption Potential of Hedgerow Intercropping 99
Tab
le 5
.2.
Ent
erpr
ise
budg
et s
how
ing
the
amou
nt o
f ext
ra m
aize
yie
ld r
equi
red
to c
over
the
cost
s of
ado
ptin
g he
dger
ow in
terc
ropp
ing
rela
tive
to c
onve
ntio
nal m
aize
(in
US
$ ha
−1).
a
Hed
gero
wC
onve
ntio
nal
Hed
gero
wC
onve
ntio
nal
inte
rcro
ppin
gm
aize
inte
rcro
ppin
gm
aize
Cos
tsb
Mea
nS
DM
ean
SD
Ben
efits
cM
ean
SD
Mea
nS
D
Sea
son
1S
eedl
ings
9023
00
Mai
ze36
518
236
518
2Tr
ee p
lant
ing
labo
ur34
200
0In
terc
rop
4654
4654
Cro
p se
ed18
1018
10F
ertil
izer
/man
ure
2027
2027
Cro
p la
bour
122
4512
245
Sub
tota
l sea
son
128
380
159
65S
ubto
tal s
easo
n 1
411
185
411
185
Sea
son
2P
runi
ng la
bour
22
00
Fue
lwoo
d2
30
0C
rop
seed
1410
1410
Mai
ze27
222
427
222
4F
ertil
izer
/man
ure
614
614
Inte
rcro
p24
3424
34C
rop
labo
ur11
751
117
51S
ubto
tal s
easo
n 2
139
6313
762
Sub
tota
l sea
son
229
823
429
623
4
Tota
l: ye
ar 1
422
116
296
99To
tal:
year
170
931
670
731
6
Sea
son
1P
runi
ng la
bour
53
00
Fue
lwoo
d4
30
0C
rop
seed
1810
1810
Mai
ze36
518
236
518
2F
ertil
izer
/man
ure
614
614
Ext
ra m
aize
3213
00
Cro
p la
bour
122
4512
245
Inte
rcro
p46
5446
54S
ubto
tal s
easo
n 1
164
6615
965
Sub
tota
l sea
son
144
719
241
118
5
Trees on Farms Ch5 16/2/02 11:51 am Page 99

100 R.A. Swinkels et al.
Tab
le 5
.2.
Con
tinue
d.
Hed
gero
wC
onve
ntio
nal
Hed
gero
wC
onve
ntio
nal
inte
rcro
ppin
gm
aize
inte
rcro
ppin
gm
aize
Cos
tsb
Mea
nS
DM
ean
SD
Ben
efits
cM
ean
SD
Mea
nS
D
Sea
son
2P
runi
ng la
bour
53
00
Fue
lwoo
d1
20
0C
rop
seed
1410
1410
Mai
ze27
222
427
222
4F
ertil
izer
/man
ure
614
614
Ext
ra m
aize
23
120
0C
rop
labo
ur11
751
117
51In
terc
rop
2434
2434
Sub
tota
l sea
son
214
263
137
62S
ubto
tal s
easo
n 2
320
243
296
185
Tota
l: ye
ar 2
276
8827
187
Tota
l: ye
ar 2
766
320
707
316
a In
two
case
s th
ere
was
sor
ghum
inst
ead
of m
aize
. Exc
hang
e ra
te in
199
2 w
as U
S$1
= 4
3 K
enya
shi
lling
s.b C
osts
:S
eedl
ings
: M
ean
num
ber
of t
rees
pla
nted
was
694
9 ha
−1(S
D=
178
5);
seed
lings
cos
ted
at U
S$1
.16
per
100
(pric
e in
sm
all
priv
ate
nurs
erie
s).
Tree
pla
ntin
g: M
ean
tree
pla
ntin
g ra
te w
as 3
3 tr
ees
h−1(S
D=
16)
(in
clud
ing
tran
spor
t ho
mes
tead
to
field
), l
abou
r co
sted
at
hire
dla
bour
pric
e.S
eed:
Mea
n m
aize
see
d in
put
was
32
kg h
a−1(S
D=
12)
in
the
long
rai
ns a
nd 4
1 kg
ha−1
(SD
= 1
7) i
n th
e sh
ort
rain
s; 1
8 ou
t of
23
farm
ers
plan
ted
an in
terc
rop
(mos
tly b
eans
) in
the
long
rai
ns, w
hile
12
did
so in
the
shor
t rai
ns; b
ean
seed
inpu
t qua
ntiti
es w
ere
sim
ilar
to th
ose
of m
aize
.F
ertil
izer
and
man
ure:
Mea
n fe
rtili
zer
inpu
t was
17
kg h
a−1(S
D=
43)
in th
e lo
ng r
ains
and
4 k
g ha
−1(S
D=
15)
in th
e sh
ort r
ains
; fer
til-
izer
was
val
ued
at U
S$0
.37
kg−1
. Far
mya
rd m
anur
e in
put w
as 1
037
kg h
a−1at
37%
moi
stur
e co
nten
t, co
sted
at U
S$1
3.50
ton−1
DM
.C
rop
labo
ur:
Thi
s in
clud
es b
oth
hire
d an
d fa
rm h
ouse
hold
lab
our;
bot
h ar
e va
lued
at
the
hire
d la
bour
pric
e of
US
$0.1
16 h
−1;
hire
dla
bour
acc
ount
ed f
or a
bout
30%
of
the
tota
l ave
rage
labo
ur in
put.
Mea
n la
bour
inpu
t in
the
long
rai
ns w
as 1
054
h ha
−1(S
D=
385
) an
d10
07 h
ha−1
(SD
= 4
36)
in th
e sh
ort r
ainy
sea
son.
Lab
our
inpu
ts d
id n
ot v
ary
sign
ifica
ntly
bet
wee
n te
st a
nd c
ontr
ol p
lots
.
Trees on Farms Ch5 16/2/02 11:51 am Page 100

Adoption Potential of Hedgerow Intercropping 101
Pru
ning
labo
ur:
Mea
n pr
unin
g la
bour
inpu
t w
as 2
5 h
ha−1
(SD
= 1
4) f
or t
he fi
rst
cut
of t
he lo
ng r
ains
, an
d 22
h h
a−1(S
D=
18)
for
the
seco
nd c
ut t
hat
seas
on;
the
first
cut
of
the
shor
t ra
ins
took
on
aver
age
30 h
ha−1
(SD
= 1
8),
whi
le t
he s
econ
d cu
t th
at s
easo
n to
ok o
nav
erag
e 18
h h
a−1(S
D=
16)
. Firs
t pru
ning
was
abo
ut 6
mon
ths
afte
r pl
antin
g (1
4 fa
rmer
s) o
r ab
out 1
0 m
onth
s af
ter
plan
ting
(nin
e fa
rm-
ers)
.c B
enefi
ts:
Mai
ze: M
ean
mai
ze y
ield
was
152
1 kg
ha−1
(SD
= 8
73)
in th
e lo
ng r
ains
and
118
0 kg
ha−1
(SD
= 1
118)
in th
e sh
ort r
ains
; mai
ze m
arke
tpr
ice
was
US
$0.2
5 kg
−1at
the
harv
est p
erio
d fo
r th
e lo
ng r
ains
sea
son
and
US
$0.2
0 kg
−1fo
r th
e ha
rves
t per
iod
of th
e sh
ort r
ains
cro
p.In
terc
rop:
Mea
n be
an y
ield
was
117
kg
ha−1
(SD
= 1
25)
in t
he l
ong
rain
s an
d 71
kg
ha−1
(SD
= 8
8) i
n th
e sh
ort
rain
s, v
alue
d at
the
mar
ket p
rice
at h
arve
st ti
me
of U
S$0
.38
kg−1
.F
uelw
ood:
Mea
n m
easu
red
fuel
woo
d yi
eld
in lo
ng r
ains
was
518
kg
dry
mat
ter
ha−1
(SD
= 4
21)
for
the
first
cut
and
zer
o fo
r th
e se
c-on
d cu
t; fo
r th
e fir
st c
ut o
f th
e sh
ort
rain
s it
was
127
kg
ha−1
(SD
= 2
67)
and
30 k
g ha
−1(S
D=
139
) fo
r th
e se
cond
cut
(12
far
mer
s).
(Bas
ed o
n th
eir
sam
ple
of 2
4 fa
rmer
s, S
heph
erd
et a
l.(1
997)
rep
orte
d a
med
ian
yiel
d of
1.0
5 t
ha−1
of f
uelw
ood
per
annu
m.)
As
fuel
-w
ood
is n
ot c
omm
only
trad
ed in
the
area
, its
val
ue w
as e
stim
ated
at o
ne-t
hird
(U
S$7
.7 t−1
dry
wei
ght)
of t
he m
arke
t pric
e.E
xtra
mai
ze:
The
ave
rage
ext
ra m
aize
yie
ld r
equi
red
to c
over
the
add
ed c
ost
of h
edge
row
inte
rcro
ppin
g, c
ompa
red
to c
onve
ntio
nal
mai
ze, w
as 1
0.5%
(S
D=
5.5
%)
or 2
42 k
g ha
−1ye
ar−1
(SD
= 6
5 kg
) (in
clud
es tw
o se
ason
s fo
r ea
ch o
f 4 y
ears
, ove
r ye
ars
2–5
of a
5-y
ear
prod
uctio
n pe
riod)
whe
n ba
sed
on r
etur
ns to
land
.
Trees on Farms Ch5 16/2/02 11:51 am Page 101

reduced the maize yield required to break even from 10.5% (SD = 5.5%) to 6% (SD
= 3%). (A change to bare-root seedlings also reduced tree growth by about 60%.Therefore, with bare-rooted seedlings, the first cut back was assumed to take placein the second year instead of the first.) The analysis also showed that increasing orreducing the value of fuelwood, even to zero, had little effect on the results, becauselittle fuelwood was generated in the hedgerow system.
On a few occasions, farmers were unable to prune due to absence or illnessand yields were greatly reduced. Therefore, it was hypothesized that the technologywas risky and that it would increase the variability in net benefits. However, thestandard deviation of net benefits per ha of the hedge plots differed very little fromthose of the other plots. It was higher in one season and lower in three seasons.Data from eight on-farm trials that were researcher-managed during one seasonalso showed no important difference in the variability in returns between the con-trol plots and the plots with the hedges. Similarly, minimum returns analysis didnot show the hedge plots to be any riskier than the conventional maize plots. Inthe first three seasons, minimum returns per ha were slightly lower on the hedgeplots (US$22–34 ha−1 lower) and in the fourth season US$39 higher.
102 R.A. Swinkels et al.
Table 5.3. Sensitivity analysis, showing mean break-even maize yield increasesof hedgerow intercropping under different assumptions.
Returns to land Returns to labour
Assumption Mean SD Mean SD
Base assumptions 10.5% 5.5% 17.5% 6.5%Land not valueda 10.5% 5.5% 19% 7%Bare-rooted seedlings (instead of potted 6% 3% 13% 6%
seedlings) @ US$0.46 per 100Fuelwood sold at market price (US$23 8% 5% 15% 7%
per ton dry weight)Fuelwood has no value 12% 6% 19% 7%Maize price 50% higher 7% 4% 12% 4%Maize price 50% lower 21% 11% 35% 13%Labour cost 100% higherb 15% 7% 18% 6%Labour costs 50% lowerb 8% 5% 18% 6%Discount rate is 50% instead of 20% 16% 9% 26% 9%Ten-year period considered instead of five 7% 4% 13% 5%Fallow in short rainy seasonc 48% 65% 15% 48%
(median 39%) (median 5%)Fallow in short rainy season, fuelwood no 65% 64% 33% 50%
value (median 49%) (median 19%)Fallow in short rainy season, fuelwood sold 6% 73% −27% 54%
at market price
aIn an analysis of returns to land, land is never valued; this assumption thereforedoes not affect the outcome of the analysis of returns to land.bIncludes farm household and hired labour.cFallowing in short rains from year 2 onwards.
Trees on Farms Ch5 16/2/02 11:51 am Page 102

On farms where there was no crop response to the hedgerows, only 6% (aboutUS$7 ha−1) of the average investment costs of the technology were earned backthrough fuelwood production. Median returns to labour were reduced by 22%,from US$0.37 h−1 to US$0.29 h−1.
Acceptability
Eleven (20%) of the 56 farmers that planted hedgerows dropped out of the trial dur-ing the first year after establishment. The main reasons included land tenure prob-lems, intra-household disputes, and poor tree establishment (Fig. 5.2). Thus, after thefirst season, 45 farmers remained in the trial, and percentages given below are basedon this group. During subsequent monitoring, over 3.5 years, another two farmersdropped out: one because of an intra-household conflict and one lost interest.
Farmers’ management practices varied considerably between the test and controlplots: crops and intercrops changed (Shepherd et al., 1997) or manure was applied toone plot and not the other. There were two reasons for this variation. First, the sizeof the trials, averaging 40% of cropped area, made it difficult for farmers to managethe two plots in the same manner. For example, farmers often lacked the labourrequired to conduct operations in a timely manner throughout the two plots.
Secondly, in interviews during the first year, we found that farmers’ evaluationmethods differed considerably from ours. Only five farmers (11%) concurred withour approach to treat the control and test plots in the same manner and then com-pare crop yields on the two plots to determine the impact of the hedges. Instead, 18(40%) sought to compare the hedges with another soil fertility amendment, such asmanure or fertilizer, to see if the hedges were as effective. Further, we found that 17(38%) did not compare test plot yields with control plot yields at all. Rather, thesefarmers wanted to compare present yields with past yields on the same plot, that is,yields before they planted the hedges. (We were unable to determine the methodthat eight farmers (18%) used to assess yield impact. Farmers were permitted to givemore than one response.)
Moreover, farmers’ assessment methods changed during the course of the trial.Comparing performance on the test and control plots was the main evaluationmethod of 61% of the farmers during the first year, but only 18% during the sec-ond through fourth year. Over the same period, comparing past and present yieldson the test plot as the favoured evaluation method increased from 38% to 67%. Intwo-thirds of the cases where farmers assessed yield performance during the secondthrough fourth years, they cited changes in yields over time on the test plot; in onlyone-fifth of the cases did they compare test and control yields. We suspect thatmany farmers initially stated that they intended to assess yield impact by comparingtest and control yields because they knew that that was what the researchersexpected them to do.
The percentage of farmers claiming that hedges improved crop yields rose fromfewer than 10% during the third season (the first after pruning) to around 50% dur-ing the third to seventh seasons. But project technicians and field assistants, using
Adoption Potential of Hedgerow Intercropping 103
Trees on Farms Ch5 16/2/02 11:51 am Page 103

104 R.A. Swinkels et al.
Inte
rest
in h
edge
row
inte
rcro
ppin
g fo
r so
il fe
rtili
ty
Yes
(50
farm
ers)
Land
tenu
re s
ecur
e?
No
Yes
(47)
Est
ablis
hmen
t suc
cess
ful? N
oYe
s (4
7)H
ouse
hold
dec
isio
n-m
aker
agr
eem
ent?
No
Yes
(42)
Impa
ct o
n so
il fe
rtili
ty s
een
Yes
No
(20)
Yes
(12)
No
(8)
Yes
(7)
No
(10)
Dro
p o
ut
2 ca
ses
Exp
and
5 ca
ses
Up
roo
tin
g3
case
s
Up
roo
tin
g3
case
s
Exp
and
1 ca
se
Yes
No
Yes
(2)
Yes
(1)
No
(11)
No
Soi
l ero
sion
red
uced
?
Impa
ct w
orth
exp
ansi
on w
ork?
Impa
ct w
orth
the
expa
nsio
n w
ork?
Do
n’t
exp
and
1 ca
se
Do
n’t
exp
and
9 ca
ses
Yes
No
(6)
Yes
(4)
No
Impa
ct w
orth
the
expa
nsio
n w
ork
Yes
(1)
No
Exp
and
1 ca
se
Fee
d liv
esto
ck w
ithhe
dge
biom
ass?
Impa
ct w
orth
the
expa
nsio
n w
ork
Impa
ct w
orth
the
expa
nsio
n w
ork
Fee
d liv
esto
ck w
ithhe
dge
biom
ass?
Impa
ct w
orth
the
expa
nsio
n w
ork
Yes
No
Exp
and
1 ca
se
Exp
and
1 ca
se
Do
n’t
exp
and
7 ca
ses
Do
n’t
exp
and
6 ca
ses
No
Do
n’t
exp
and
6 ca
ses
Soi
l ero
sion
red
uced
?
Yes
(25)
No
(17
)
Exp
and
1 ca
seD
on
’t e
xpan
d3
case
s
Yes
Fee
d liv
esto
ck w
ithhe
dge
biom
ass?
Fee
ding
lives
tock
with
hed
gebi
omas
s?
Fig.
5.2
.D
ecis
ion
tree
: exp
ansi
on o
f hed
gero
ws
by tr
ial f
arm
ers.
Six
farm
ers
are
excl
uded
(fou
r be
caus
e of
lack
of r
elia
ble
info
rmat
ion
and
two
beca
use
they
mig
rate
d fr
om th
e ar
ea).
Trees on Farms Ch5 16/2/02 11:51 am Page 104

subjective judgements based on frequent farm visits, noted yield increases on only20–40% of the trials. The difference may be due to farmers noticing yield increasesthat field assistants did not, to field assistants not taking into account managementdifferences between the plots, or to farmers simply trying to please researchers.
Farmers noted a number of other benefits from the hedges. By the sixth seasonafter planting, one-fifth were feeding some of the tree leaves to their livestock,mostly local-breed cattle. The three farmers with improved-breed dairy cows werefeeding all of their leafy biomass. Feeding leaves to livestock was not associated withopinions on the effectiveness of the biomass for improving crop yields. Forty percent mentioned fuelwood as a valuable benefit. However, quantities were small;wood harvested after the first and second prunings of the third season provided fuelfor only 11 days (SD = 14) and 6 days (SD = 3), respectively. The proportion offarmers reporting that the hedges curbed soil erosion increased from 20% duringthe first few seasons to 50% in the seventh season. These farmers did not havesteeper sloping hedge plots than other farmers. The overall effects of the hedgeswere judged to be positive by 60–64% of the farmers in the fourth to seventh sea-sons. Others felt the positive and negative (that is, shading) effects were offsetting,or saw no effect (13–25%). The number of farmers reporting mainly negativeeffects declined from 25% in the first season to 3% in the sixth season, reflectingtheir increasing ability to cut back in time.
By the fifth season, 18 (40%) of the farmers indicated their interest in expand-ing the hedges. They were given seed and advised on raising them in nurseries forproduction of bare-rooted seedlings, but over the next two seasons, only 10 (22%)established a nursery and transplanted the seedlings. Five expanded hedges in theircrop fields while five planted on boundaries. The decision tree (Fig. 5.2) showedthat five farmers expanded mainly for improving soil fertility, three for fodder pro-duction (all three had improved cattle breeds and regularly sold milk), and two forcontrolling soil erosion.
The ten expanders differed from the rest of the farmers in several importantrespects. They were more likely to be households where a male or a couple managedthe farm (P < 0.02), to be visited regularly by extension agents (P < 0.01), to have acash crop such as coffee or tea (P < 0.003), and to manage their hedges well,according to ratings by technicians (P < 0.07). There was some evidence thatexpanders had less depleted soils than others, based on analyses of the soil of fourexpanders and 28 non-expanders. Expanders had significantly higher cationexchange capacities (P < 0.04) and higher amounts of calcium (P < 0.01) andexchangeable bases (P < 0.04), in topsoil, subsoil and deep soil, compared withnon-expanders. Maize yields in the test plots of expanders were significantly higherthan in the test plots of non-expanders in the first, second and third season, but notin the fourth season after hedge establishment.
The expanders did not appear to have different levels of wealth, off-farmincome, farm size, or crop sales, to have different labour : land ratios, to be moreself-sufficient in food, to use more purchased inputs, or to be of different ages com-pared with the non-expanders. Furthermore, the species of hedge did not influenceexpansion; five grew Leucaena leucocephala and five, Calliandra calothyrsus.
Adoption Potential of Hedgerow Intercropping 105
Trees on Farms Ch5 16/2/02 11:51 am Page 105

Discussion
Farmers were able to establish the hedges effectively, as has been shown in Nigeria(Reynolds et al., 1991), Malawi (ICRAF, 1993) and the Philippines (Fujisaka,1993). The low labour requirements for pruning are similar to those reported fromon-farm trials by Reynolds et al. (1991). Although pruning had to be done duringperiods of peak labour use, farmers appeared to cope better with this task over time.However, the fact that women do not generally prune hedges greatly reduces theadoption potential of the technology among the 40–60% of the farm households inthe survey area which are headed by women.
Given the greater demands on their time, women may avoid pruning as part ofa strategy to force men to bear the risks and costs of the technology (David, 1992).Should the hedges improve soil fertility, more women might be prepared to maketrade-offs and prune their hedges.
Reduction in the labour requirements for weeding was not an important bene-fit, and this differs from the findings of other trials in the tropical humid lowlands(Reynolds et al., 1991; Fernandes et al., 1993).
Break-even yield increases are fairly low, indicating that only relatively lowyield increases are required to cover the costs of the technology. That the break-evenyield increase is lower in the returns to land analysis highlights the attractiveness ofthe technology in areas of high population density, small farms and plentiful labour.Sensitivity analysis showed the importance of reducing establishment costs forincreasing the profitability of the technology. Our data do not support the hypothe-sis that hedges increase variability in returns, although it is clear that farmers whowere unable to prune on time would suffer yield decreases.
In the end, only seven farmers (14%) expanded their hedges to improve soilfertility or soil erosion control. Non-expansion is not necessarily a sign of non-adoption; several farmers indicated that they appreciated the practice but onlywanted to adopt it on a portion of their field. The general lack of expansion, how-ever, indicated that overall confidence in the technology was low.
Given the disappointing data on yield impacts and economic returns fromhedgerow intercropping, extension efforts were reduced and focused more on ero-sion control. On-farm research was reoriented to focus on improved fallows, whichproduced greater biomass, had lower establishment and overall labour costs, andgreater yield effects. New on-station trials were established at Maseno in 1994 usingcalliandra, to better understand crop and tree productivity in contour plantings,and the possible effects of phosphorus application on performance (Niang et al.,1996).
The low adoption potential of hedgerow intercropping for improving soil fer-tility has been noted in several other farmer-managed on-farm trials in the semiaridareas of Kenya (David, 1995), in the subhumid plateau areas of Malawi (Minae,1994), and in the humid lowlands of Nigeria (Whittome, 1994) and Cameroon(Degrande and Duguma, 2000). The practice appears to have more adoptionpotential if its main aim is to provide feed for an intensive dairy operation, as in
106 R.A. Swinkels et al.
Trees on Farms Ch5 16/2/02 11:51 am Page 106
Kenya (Chapter 7 of this volume; Reynolds, 1994; Reynolds and Jabbar, 1994) orfor soil erosion control, as in the Philippines (Fujisaka, 1993).
For reducing erosion, the practice appears to be most relevant to:
● areas with erosive soils on sloping land;● areas with high rainfall, where competition for moisture between trees and
crops is minimal; and● farmers with high labour–land ratios, because the labour requirements of the
practice are high.
But incentives may be needed to motivate farmers to adopt hedgerow intercroppingon a wide scale, if reducing erosion is the only benefit.
The trial results also had important implications for participatory on-farmresearch methods. First, where trial plot size is large (for example, 40% of croppedarea) or trials are long-term (more than two seasons), farmers will find it difficult tomanage non-experimental variables in a uniform manner.
Secondly, in trials designed to facilitate farmer assessment, farmers’ own evalua-tion methods should be factored into the design. In our trial, as in others (Reynoldset al., 1991; CIAT, 1992; Versteeg and Koudokpon, 1993), farmers were not asinterested in the comparison between the test and the control plot as were theresearchers. If farmers are not interested in comparing test yields with controlyields, control plots are not needed. Where farmers do want to compare test andcontrol plots, the exact comparison should be the one they are interested in. Forexample, in our trial, more farmers were interested in comparing hedges withmanure than were interested in the with- and without-hedges comparison.
Thirdly, the trials provided reliable socioeconomic data on feasibility, costsand farmers’ expansion. Farmers’ assessment of the hedges were less reliable, asevidenced by disparities between farmers’ and technicians’ opinions on yieldresponse and between farmers’ stated appreciation of the practice and their will-ingness to plant new hedges. We believe that farmers’ assessments were biasedtowards reporting more positive impacts for two reasons, because criticism of apractice is impolite in their culture, and because of their belief that positiveassessments would help them obtain free inputs or even employment from theproject.
Finally, the findings suggest that it may not be possible to obtain reliable bio-physical data on yield response and socioeconomic data on farmer assessment fromthe same trial (Shepherd and Rodger, 1991). In order to obtain a good socioeco-nomic evaluation, individual farmers need to use the technology in the mannerthey see fit. Thus it is unlikely to be possible to compare yields between plots oracross farms. Conversely, a high degree of control of experimental and non-experi-mental variables is required to measure biophysical response. Under such manage-ment, farmers will not be able to assess the adoptability of a technology adequately.Farmer-participatory trials are useful in the early stage of the development of atechnology for obtaining farmer feedback, for identifying critical constraintsaffecting performance and to define realistic conditions for researcher-managed tri-als, which are recommended for assessing biophysical performance (Shepherd and
Adoption Potential of Hedgerow Intercropping 107
Trees on Farms Ch5 16/2/02 11:51 am Page 107

Roger, 1991). Following these, adoption potential and acceptability can then bedetermined in extension-led, farmer-participatory trials, rather than throughexperiments aimed at collecting biophysical and socioeconomic data of the kindreported here.
Acknowledgements
We thank the following who assisted in conducting the research: Luke Anjeho,Aggrey Otieno, Joseph Onoo, Stephen Amoko, Florence Ochuka, Julius Otiende,Jairus Ounza, Cleophas Omondi, Mark Waswa, Victoria Atieno, NehemiahOdhiambo, Miriam Ayiemba, Soniia David and W. Mwangi Muturi. We are grate-ful for comments on earlier drafts from Richard Coe, Dirk Hoekstra, Henk Moll,Collins Obonyo, Sylla Pahladsingh, Frank Place and Meredith Soule. The supportof the Kenya Forestry Institute, in particular, Dr Daniel Nyamai, is appreciated. Weare grateful to Richard Coe of ICRAF for biometric support. Financial support wasprovided by the Rockefeller Foundation, while the Swedish InternationalDevelopment Authority supported Eva Ohlsson and Hans Sjögren, and theDirectoraat Generaal Internationale Samenwerking of The NetherlandsGovernment supported Rob Swinkels.
References
108 R.A. Swinkels et al.
Balasubramanian, V. and Sekayange, L. (1991)Effects of tree legumes in hedgerows on soilfertility changes and crop performance inthe semi-arid highlands of Rwanda.Biological Agriculture and Horticulture 8,17–32.
Carter, J. (1995) Alley farming: have resource-poor farmers benefited? Natural ResourcesPerspectives 3, June 1995. OverseasDevelopment Institute, London.
CIAT (1992) Annual Report 1992. InternationalCentre for Tropical Agriculture, Cali,Colombia.
CIMMYT (1988) From Agronomic Data toFarmer Recommendations: an EconomicsTraining Manual. International Maize andWheat Improvement Centre, Mexico, DF.
David, S. (1992) Open the Door and See All thePeople: Intra-Household Processes and theAdoption of Hedgerow Intercropping. Paperpresented at the Rockefeller FoundationSocial Science Fellows Meeting, 9–13November 1992, CIMMYT, El Batan,Mexico.
David, S. (1995) What do farmers think? Farmer
evaluations of hedgerow intercroppingunder semi-arid conditions. AgroforestrySystems 32, 1.
David, S. and Swinkels, R.A. (1994) Socio-Economic Characteristics of HouseholdsEngaged in Agroforestry Technology Testing inWestern Kenya. AFRENA Report No. 78.International Centre for Research inAgroforestry, Nairobi.
Degrande, A. and Duguma, B. (2000) AdoptionPotential of Rotational HedgerowIntercropping in the Humid Lowlands ofCameroon. AGREN Network Paper No.103, Agricultural Research and ExtensionNetwork, Overseas Development Institute,London.
Dvorak, K.A. (1996) Adoption Potential of AlleyCropping: Final Project Report. Resource andCrop Management Research MonographNo. 23. International Institute of TropicalAgriculture, Ibadan, Nigeria.
Fernandes, E.C.M., Davey, C.B. and Nelson, L.A.(1993) Alley cropping on an acid soil in theUpper Amazon: mulch, fertilizer, andhedgerow root pruning effects. In: Ragland,
Trees on Farms Ch5 16/2/02 11:51 am Page 108

J. and Lal, R. (eds) Technologies forSustainable Agriculture in the Tropics,Proceedings of two international symposia.ASA Special Publication No. 56. AmericanSociety of Agronomy, Crop Science Societyof America and Soil Science Society ofAmerica, Madison, Wisconsin, pp. 77–96.
Fujisaka, S. (1993) A case of farmer adaptationand adoption of contour hedgerows for soilconservation. Experimental Agriculture 29,97–105.
Gladwin, C. (1980) A theory of real life choice:applications to agricultural decisions. In:Barlett, P.F. (ed.) Agricultural DecisionMaking: Anthropological Contributions toRural Development. Academic Press, NewYork, pp. 45–86.
Heineman, A.M., Mengich, E.K., Olang, A.D.and Otieno, H.J.O. (1990) AFRENA On-Station Project Maseno, Kenya. ProgressReport for the Period January 1988 toJanuary 1990. AFRENA Report No. 27.International Centre for Research inAgroforestry, Nairobi, Kenya.
ICRAF (1993) Annual Report 1992.International Centre for Research inAgroforestry, Nairobi, Kenya.
ICRAF (1995) Annual Report 1994.International Centre for Research inAgroforestry, Nairobi, Kenya.
Kang, B.T. (1993) Alley cropping: past achieve-ments and future directions. AgroforestrySystems 23, 141–155.
Kang, B.T., Reynolds, L. and Atta-Krah, A.N.(1990) Alley farming. Advances inAgronomy 43, 315–359.
Minae, S. (1994) Malawi–ICRAF On-FarmAgroforestry Research Program AnnualReport, 1991–92. AFRENA Report No. 82.International Centre for Research inAgroforestry, Nairobi.
Müller, E.U. and Scherr, S.J. (compilers) (1989)Technology Monitoring and Evaluation inAgroforestry Projects: An AnnotatedBibliography. International Centre forResearch in Agroforestry, Nairobi.
Niang, A.I., Amadalo, B.A., Gathumbi, S.M.,Otieno, J.H.O., Obonyo, C.O. andObonyo, E. (1996) KEFRI/KARI/ICRAF-AFRENA-Maseno Project Progress ReportSeptember 1995–September 1996. AFRENAReport No. 110. International Centre forResearch in Agroforestry, Nairobi, Kenya.
Ohlsson, E., Ndufa, J.K., Swinkels, R.A.,
Muturi, W.M. and Shepherd, K.D. (1992)Evaluation of hedgerow intercropping onfarms in western Kenya: participatory tech-nology testing trials. In: On-farm ResearchProject, Maseno, Kenya: Papers presented tothe Zonal Conference of the Eastern andCentral Africa Agroforestry Network,Nairobi, 6–10 July 1991. AFRENA ReportNo. 50. International Centre for Researchin Agroforestry, Nairobi, pp. 52–81.
Otieno, H.J.O., Heineman, A.M., Mengich,E.K. and Amadalu, B. (1991) AFRENAOn-Station Project Maseno, Kenya ProgressReport for the Year 1990. AFRENA ReportNo. 41. International Centre for Researchin Agroforestry, Nairobi, Kenya.
Reynolds, L. (1994) A review of the biophysicaland socio-economic basis of alley farming,and its adoption potential. Consultantreport for the Alley Farming Network ofAfrica. International AgriculturalConsultancy, Kibworth, Leicester, UK.
Reynolds, L. and Jabbar, M. (1994) The role ofalley farming in African livestock produc-tion. Outlook on Agriculture 23, 105–113.
Reynolds, L., di Domenico, C., Atta-Krah, A.N.and Cobbina, J. (1991) Alley farming insouth-western Nigeria: the role of farmingsystems research in technology develop-ment. In: Tripp, R. (ed.) Planned Change inFarming Systems: Progress in On-farmResearch. John Wiley & Sons, London, pp.85–108.
Scherr, S.J. (1995) Economic factors in farmeradoption of agroforestry: patterns observedin western Kenya. World Development23(5), 787–804.
Scherr, S.J. and Oduol, P.A. (1989) Alley-croppingand Tree Borders in Crop Fields in SiayaDistrict, Kenya. International Council forResearch in Agroforestry and CAREInternational (Kenya), Nairobi.
Shepherd, K.D. and Roger, J.H. (1991)Approaches to On-farm Testing andEvaluation of Agroforestry Technology.Working Paper No. 67. International Centrefor Research in Agroforestry, Nairobi.
Shepherd, K.D., Swinkels, R.A., Muturi, W.M.,Ohlsson, E. and Ndufa, J.K. (1992)Evaluation of hedgerow intercropping onfarms in western Kenya: diagnosis of tech-nology potential and farmers’ interest. On-Farm Research Project, Maseno, Kenya:Papers presented to the Zonal Conference of
Adoption Potential of Hedgerow Intercropping 109
Trees on Farms Ch5 16/2/02 11:51 am Page 109

the Eastern and Central Africa AgroforestryNetwork, Nairobi, 6–10 July 1991.AFRENA Report No. 50. InternationalCentre for Research in Agroforestry,Nairobi, pp. 1–29.
Shepherd, K.D., Ohlsson, E., Okalebo, J.R. andNdufa, J.K. (1996) Potential impact ofagroforestry on soil nutrient balances at thefarm scale in the East African Highlands.Fertilizer Research 44, 97–99.
Shepherd, K.D., Ndufa, J.K., Ohlsson, E.,Sjogren, H. and Swinkels, R. (1997)Adoption potential of hedgerow intercrop-ping in maize-based cropping systems inthe highlands of western Kenya. Part 1.Background and agronomic evaluation.Experimental Agriculture 33, 197–209.
Swinkels, R.A. and Franzel, S. (1992) Analysis offactors influencing labour productivity inhedge pruning. In: Hoekstra, D. andBeniest, J. (compilers) Summary Proceedings
of the East and Central African AFRENAWorkshop, 22–26 June 1992, Kigali,Rwanda. AFRENA Report No. 58.International Centre for Research inAgroforestry, Nairobi, Kenya, pp. 84–85.
Swinkels, R.A. and Scherr, S.J. (1991) EconomicAnalysis of Agroforestry Technologies: AnAnnotated Bibliography. InternationalCentre for Research in Agroforestry,Nairobi, Kenya.
Versteeg, M.N. and Koudokpon, V. (1993)Participative farmer testing of four lowexternal input technologies, to address soilfertility decline in Mono Province (Benin).Agricultural Systems 42, 265–276.
Whittome, M.P.B. (1994) The adoption of alleyfarming in Nigeria and Benin: the on-farmexperience of IITA and ILCA. PhD thesis,Department of Geography, University ofCambridge, Cambridge, UK.
110 R.A. Swinkels et al.
Trees on Farms Ch5 16/2/02 11:51 am Page 110

Summary
In farmer-designed tree trials, farmers experiment on their own with new treespecies, planting them where and how they wish on their farms. In western Kenya,50 farmers (half female) planted and evaluated five different species: two upper-storey species (Grevillea robusta and Casuarina junghuhniana), primarily for timberand pole production, and three shrub species (Leucaena leucocephala, Leucaenadiversifolia, Calliandra calothyrsus), mainly for improving soil fertility. Resultsrevealed important criteria that farmers use in evaluating tree species. For example,casuarina was widely appreciated for its ornamental value, despite its relatively poorratings on survival and growth. The findings also highlighted the importance oftesting new species under farmer conditions, as their ranking on growth was differ-ent than in on-station trials. Farmers appreciated the upper-storey species but mostdid not find the shrub species to be effective in improving soil fertility. The trialsalso provided important information on farmers’ management problems, preferredniches for tree planting, and intended uses of tree products.
Introduction
In most African countries, farmers have little input into decisions about which treespecies are made available to them. Rather, scientists or extension services generallymake the decisions – screening new species in on-station trials or from available lit-
Farmer-designedAgroforestry Trials: Farmers’
Experiences in Western Kenya
S. FRANZEL,1 J.K. NDUFA,2 O.C. OBONYO,2T.E. BEKELE3 AND R. COE1
1International Centre for Research in Agroforestry, PO Box 30677, Gigiri, Nairobi, Kenya; 2Kenya Forestry Research Institute (KEFRI), Maseno Agroforestry Research Centre, Maseno, PO Box 25199,
Kisumu, Kenya; 3Institute of Biodiversity, Conservation and Research, POBox 2003, Addis Ababa, Ethiopia
© CAB International 2002. Trees on the Farm (eds S. Franzel and S.J. Scherr) 111
6
Trees on Farms Ch6 19/2/02 10:28 am Page 111
erature and evaluating them according to well-known criteria such as growth andform. In order to enhance farmers’ role in species introduction, scientists of theKenya Forestry Research Institute and the International Centre for Research inAgroforestry and members of 13 self-help groups initiated farmer-designed trials inwestern Kenya, in which farmers evaluated new tree species on their own farms.Farmers’ assessments of the trees were an important input into the decision onwhether to disseminate them.
Farmer-designed trials, also called collegial trials (Biggs, 1989) or type 3 trials(see Chapter 2), are an important means for increasing farmers’ role in the technol-ogy development process. In these trials, farmers experiment on their own with newtechnologies or components and, together with researchers, they monitor theirexperiences (Haverkort et al., 1991). Because each farmer controls the testing proce-dure on his/her farm, farmer-designed trials are not seen as being appropriate forthe collection of quantitative data, either biophysical or socioeconomic, or for theformal testing of hypotheses. Thus they are often dismissed as being ‘soft’ researchand are rarely reported on in refereed journals. Nevertheless, farmer-designed trialsare important for obtaining farmers’ assessments and for understanding the processby which farmers test new practices and incorporate them into their farming sys-tems. As illustrated in this study, quantitative and statistically valid data on prefer-ences can be collected by asking farmers to rate alternative species across differentcriteria (Fransella and Bannister, 1977).
Study objectives were to: (i) examine how farmers in western Kenya experi-ment with new tree species, that is, where they plant them, how they manage them,how they use them, and the problems they encounter; (ii) elicit farmers’ evaluationcriteria and evaluation of the species across criteria; (iii) assess how the species per-form on farmers’ fields and under farmer management, as compared to on-station;(iv) associate farmers’ assessment of species with selected farm and household char-acteristics; and (v) recommend which new species should be made available to farm-ers by development institutions.
Methods
The trials were conducted in a maize-based land-use system, encompassing parts ofSiaya, Kisumu and Vihiga Districts, in western Kenya (Fig. 4.1). Altitudes rangefrom 1450 m to 1650 m and rainfall is bimodal, averaging 1500 mm to 2000 mmyear−1. The landscape is undulating, with slopes of 2–10%. The main types of soilinclude Ferralsols, Acrisols and Nitisols, and are generally infertile with a low pH(5–7). Most farms range in size from 0.5 ha to 2.0 ha and population densities are400 to 1200 persons km−2. Maize accounts for over half of the cultivated area andthe use of purchased inputs, such as seed and fertilizer, is low. Most households owncattle, predominantly of the local breed. About 45% of the households are female-headed. Eucalyptus spp. (mainly Eucalyptus saligna) is the most common type of treein the area and is widely grown for poles, for domestic use and for sale, and for fuel-wood, for domestic use (David and Swinkels, 1994).
112 S. Franzel et al.
Trees on Farms Ch6 19/2/02 10:28 am Page 112

The collaborating farmer groups selected 50 farmers who were interested intesting new tree species on their farms. The selected farms included the range oftypes of farms found in the area; over half were female-headed, median farm sizewas 1.1 ha, and two-thirds had cattle. Technicians provided farmers with informa-tion about each species (e.g. growth characteristics and end uses) and, followinggroup discussions, farmers decided to test three shrub species (Leucaenaleucocephala, Leucaena diversifolia, Calliandra calothyrsus) and two upper-storeyspecies (Grevillea robusta (Meru) and Casuarina junghuhniana (Australia)). Theshrub species were intended to improve soil fertility through application of prun-ings to crops, and to provide livestock feed during the dry season, thus addressingtwo of farmers’ most important problems in the area (Minae and Akyeampong,1988). The upper-storey species were intended to provide timber and poles, twohighly preferred tree products that farmers use for both domestic use and cash sales(Muturi and Franzel, 1992). The shrub species were new to the farmers; beforeplanting, they were able to view them in on-farm hedgerow intercropping trials.Farmers were familiar with grevillea and casuarina but lacked information aboutthem as they were not widely planted in the area.
Planting took place during the short rains season, September throughNovember, 1991. Researchers raised trees in nurseries and delivered an average of273 trees, 29–103 per species, to each farmer, depending on their availability.Technicians demonstrated planting methods, but all planting and management ofthe species was done by the farmers themselves. Rainfall during the season of plant-ing was 20% lower than the 30-year average.
Trials were monitored using both informal and formal survey methods.Informal interviews were conducted during researchers’ visits to the trials. Groupvisits were also organized in which farmers visited one another’s trials and discussedtrial performance. Formal surveys using structured questionnaires were conducted3, 15, 30 and 52 months after planting; the number of farmers interviewed rangedfrom 30 to 43. The questions concerned farm and household characteristics, treemanagement, preferred end uses and problems encountered. Some biophysical datawere collected; survival rates were measured 3 months after planting and tree heightand root collar diameter 30 months after planting. In the latest survey, 52 monthsafter planting, researchers rated farmers’ level of interest in the trees as high,medium or low, according to the level of management and perceived benefits. Arandom sample of 22 neighbours of participating farmers was also interviewed toassess whether they had planted any of the trees in the trial (Bekele, 1997).
Two methods were used to get farmers’ ratings of different trees. In informalvisits, farmers were asked to explain the advantages and disadvantages of variousspecies on their farm and the criteria behind their preferences (Bruin et al., 1994;Franzel, 2001). In subsequent visits, farmers used a local board game, bao, to ratespecies according to the criteria by moving seeds among pockets of the board(Franzel et al., 1995; Franzel, 2001). Farmers rated a species on a particular criterion,e.g. growth rate, by placing 1–5 seeds (5 represented a high rating) in a pocket nextto a branch of that species. E. saligna was also used in the bao game ratings as a con-trol for the rating of upper-storey species, although it was not planted in the trial.
Farmer-designed Agroforestry Trials 113
Trees on Farms Ch6 19/2/02 10:28 am Page 113

The influence of various farm and household characteristics on farmers’ ratingsof their interest in planting different species was assessed using a linear logisticmodel for ordered category response data (Collet, 1991). The variables consideredincluded wealth level, farm size, off-farm income, ethnic group, age, gender, districtand livestock ownership.
Results
Tree establishment, management and intended uses
About two-thirds of the farmers planted all of their seedlings; the others gave away orsold some. Most farmers planted the shrub species in hedgerows in their crop fields,others planted on external or internal boundaries, on terraces, or in fallow land.Grevillea tended to be planted on external boundaries whereas casuarina was equallydistributed among the homestead, internal and external boundaries. Only a few farm-ers planted any of the five species in woodlots or scattered in their fields (Table 6.1).
Survival rates 3 months after planting were over 70% for all species exceptcasuarina, which had a rate of 46%. According to farmers, principal causes of mor-tality were termites, drought and browsing (both by wild and domestic animals).Each of the above causes was mentioned by 11–16% of the farmers.
Over 80% mixed their shrub species in the field; this was partly because, inmany cases, the farmers, could not distinguish between them. About 40% mixedgrevillea and casuarina, even though they are easy to distinguish.
Farmers planted the shrubs at spacings of 1.0–1.7 m in hedgerows. These aremuch wider than the recommended 0.5 m. Spacings on boundaries for grevillea
114 S. Franzel et al.
Table 6.1. Niche where farmers planted existing upper-storey trees and the testspecies (% of farmers responding).
Existingupper-storey Grevillea Casuarina Leucaena Leucaena Calliandra
Niche treesa robusta junghuhniana leucocephala diversifolia calothyrsus
Hedgerows 0 0 0 63 59 70in crops
External 44 50 29 9 9 6boundary
Internal 75 36 29 6 6 9boundary
Homestead 92 13 29 2 0 2Otherb 83 12 20 18 20 18
Data from 43 farmers. Column percentages do not sum to 100 because a farmercan plant in more than one niche.aFrom Muturi and Franzel (1992).bOther niches include scattered in cropland, woodlots and pasture.
Trees on Farms Ch6 19/2/02 10:28 am Page 114

were 2.3 m (SD = 1.9) and for casuarina, 3.2 m (SD = 2.9), as compared to the rec-ommended 1 m (to be later thinned to 2 m). About two-thirds said they made theirown decision about the spacing, one-third said they based the decision on advicefrom others. Farmers justified their wide spacings on the basis that they hadreceived few trees and were interested in maximizing the area covered.
Most of the farmers intended to use the shrub species for improving soil fertility(Table 6.2); other reasons expressed by over 40% of the farmers were to produce fuel-wood and fodder. Grevillea and casuarina were being planted primarily for timberand poles. Only 29% claimed that one of the two main uses of grevillea would be forfirewood, and there were no differences in responses among males and females.
Farmers’ evaluation of tree growth
Farmers used a wide range of criteria to evaluate the growth of the trees, includingsurvival, rapidity of growth, compatibility with crops, and resistance to pests,drought and browsing. Fifteen months after planting, farmers rated grevillea andcalliandra highest on survival and growth (ratings of 3.8–4.5 out of 5); casuarinawas rated lowest (1.7–2.6) (Table 6.3). These data were in line with the actual dataon survival and growth collected by the technicians. On resistance to termites, onlycasuarina received a low rating (1.6).
Two other growth characteristics were also rated. Grevillea and calliandrareceived high ratings (4.5 and 4.0 respectively) on drought resistance, casuarina waslowest (2.3). Grevillea and eucalyptus were the only species with high ratings onresistance to browsing (4.1 and 4.0, respectively); casuarina was rated low (2.6), inpart because it was frequently planted around the homestead, where livestock werecommon.
Thirty months after planting, grevillea and eucalyptus were rated high onrapidity of growth (4.4 and 4.3, respectively); casuarina was rated medium (3.2)(Table 6.4). In fact, growth data from the farms showed grevillea outperforming
Farmer-designed Agroforestry Trials 115
Table 6.2. Farmers’ intended uses for the trees they planted in the farmer-designed trial (% of farmers responding).
Grevillea Casuarina Leucaena Leucaena CalliandraUse robusta junghuhniana leucocephala diversifolia calothyrsus
Firewood 29 16 52 48 52Fodder 0 0 43 41 39Soil conservation 0 0 11 11 7Soil fertility 0 0 72 73 77Timber 93 71 0 0 2Poles 48 43 0 0 0Shade/beauty 9 25 0 2 2
Data from 43 farmers. Column percentages do not sum to 100 because a farmercan have more than one use for a tree.
Trees on Farms Ch6 19/2/02 10:28 am Page 115
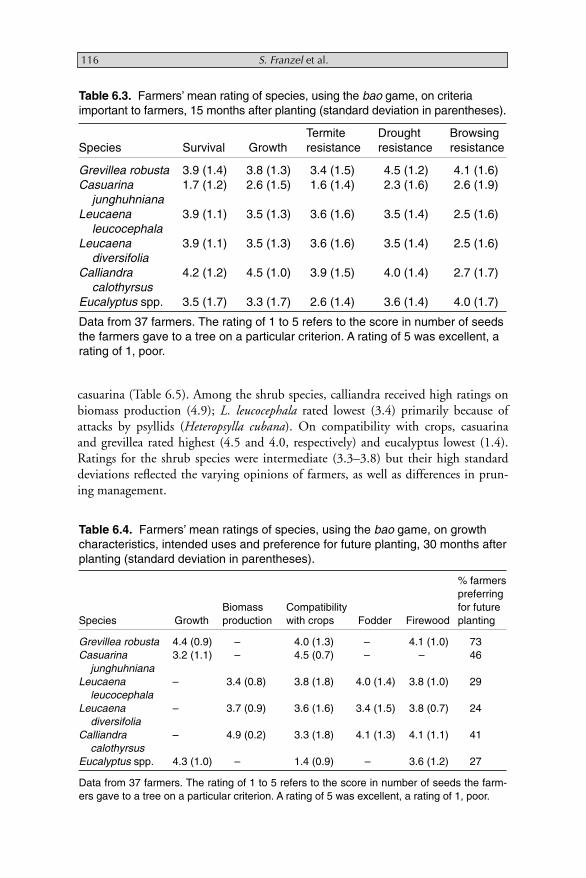
casuarina (Table 6.5). Among the shrub species, calliandra received high ratings onbiomass production (4.9); L. leucocephala rated lowest (3.4) primarily because ofattacks by psyllids (Heteropsylla cubana). On compatibility with crops, casuarinaand grevillea rated highest (4.5 and 4.0, respectively) and eucalyptus lowest (1.4).Ratings for the shrub species were intermediate (3.3–3.8) but their high standarddeviations reflected the varying opinions of farmers, as well as differences in prun-ing management.
116 S. Franzel et al.
Table 6.3. Farmers’ mean rating of species, using the bao game, on criteriaimportant to farmers, 15 months after planting (standard deviation in parentheses).
Termite Drought BrowsingSpecies Survival Growth resistance resistance resistance
Grevillea robusta 3.9 (1.4) 3.8 (1.3) 3.4 (1.5) 4.5 (1.2) 4.1 (1.6)Casuarina 1.7 (1.2) 2.6 (1.5) 1.6 (1.4) 2.3 (1.6) 2.6 (1.9)
junghuhnianaLeucaena 3.9 (1.1) 3.5 (1.3) 3.6 (1.6) 3.5 (1.4) 2.5 (1.6)
leucocephalaLeucaena 3.9 (1.1) 3.5 (1.3) 3.6 (1.6) 3.5 (1.4) 2.5 (1.6)
diversifoliaCalliandra 4.2 (1.2) 4.5 (1.0) 3.9 (1.5) 4.0 (1.4) 2.7 (1.7)
calothyrsusEucalyptus spp. 3.5 (1.7) 3.3 (1.7) 2.6 (1.4) 3.6 (1.4) 4.0 (1.7)
Data from 37 farmers. The rating of 1 to 5 refers to the score in number of seedsthe farmers gave to a tree on a particular criterion. A rating of 5 was excellent, arating of 1, poor.
Table 6.4. Farmers’ mean ratings of species, using the bao game, on growthcharacteristics, intended uses and preference for future planting, 30 months afterplanting (standard deviation in parentheses).
% farmerspreferring
Biomass Compatibility for futureSpecies Growth production with crops Fodder Firewood planting
Grevillea robusta 4.4 (0.9) – 4.0 (1.3) – 4.1 (1.0) 73Casuarina 3.2 (1.1) – 4.5 (0.7) – – 46
junghuhnianaLeucaena – 3.4 (0.8) 3.8 (1.8) 4.0 (1.4) 3.8 (1.0) 29
leucocephalaLeucaena – 3.7 (0.9) 3.6 (1.6) 3.4 (1.5) 3.8 (0.7) 24
diversifoliaCalliandra – 4.9 (0.2) 3.3 (1.8) 4.1 (1.3) 4.1 (1.1) 41
calothyrsusEucalyptus spp. 4.3 (1.0) – 1.4 (0.9) – 3.6 (1.2) 27
Data from 37 farmers. The rating of 1 to 5 refers to the score in number of seeds the farm-ers gave to a tree on a particular criterion. A rating of 5 was excellent, a rating of 1, poor.
Trees on Farms Ch6 19/2/02 10:28 am Page 116

Comparison of tree growth on-farm and on-station
Both grevillea and casuarina were grown in on-station trials near the survey area.Thirty months after planting, heights and root collar diameters (RCDs) were signif-icantly higher on-station than on-farm (Table 6.5), probably because of the higherlevel of management, including application of phosphorus fertilizer, better weedingand less competition from adjacent crops. Root collar diameters of grevillea in on-station trials were 1.6 times greater than those in on-farm trials, the correspondingratio for casuarina was 2.6 times. In the on-station trial, casuarina outperformedgrevillea in RCD (14% higher, significant at P < 10%). In the on-farm trial, theRCD of casuarina was only 71% that of grevillea. However, the difference was notsignificant due to the high variability (coefficients of variation ranged from 32% to43%) in the on-farm trial results.
Farmers’ use and evaluation of trees
By the 30th month after planting, farmers had coppiced the shrub species aboutseven times and thus had considerable experience using the leafy and woody bio-mass. Ninety per cent used the leaves as a mulch, 81% used the branches for fire-wood and 46% used the leaves for fodder. Three farmers (7%) also sold leaves toother farmers to use as fodder. Fifty-six per cent claimed that their main intentionin using the shrubs was to improve soil fertility; 17% cited fodder.
Farmers’ perceptions of the effect of the shrub species on their crop yields var-ied considerably. For calliandra, the best-performing shrub species in terms of bio-mass production, nine farmers (39% of those using the species primarily to improvesoil fertility) saw a positive effect, while 61% saw no effect or were not sure. Of the17 (41%) who had a strong interest in planting calliandra in the future, only seven
Farmer-designed Agroforestry Trials 117
Table 6.5. Mean height and root collar diameter (standard deviations in paren-theses) for species in farmer-designed trials and on-station trials, 30 monthsafter planting.
Casuarina Ratio:Grevillea robusta junghuhniana casuarina/grevillea
Height Root collar Height Root collar Height Root collarDistrict (cm) diameter (cm) (cm) diameter (cm) (cm) diameter (cm)
On-station 678 (36) 8.05 (0.56) 694 (87) 9.14 (0.94) 1.02 1.14On-farm 382 (138)** 4.9 (1.80)** 416 (135)* 3.5 (1.5)** 1.09 0.71Ratio: 1.77 1.64 1.67 2.61
on-station/on-farm
For grevillea, 84 accessions from local collections were tested in the on-stationtrial; for casuarina, 20.** and * denote significance at the 1% and 5% level, respectively, between on-station and on-farm parameters.
Trees on Farms Ch6 19/2/02 10:28 am Page 117
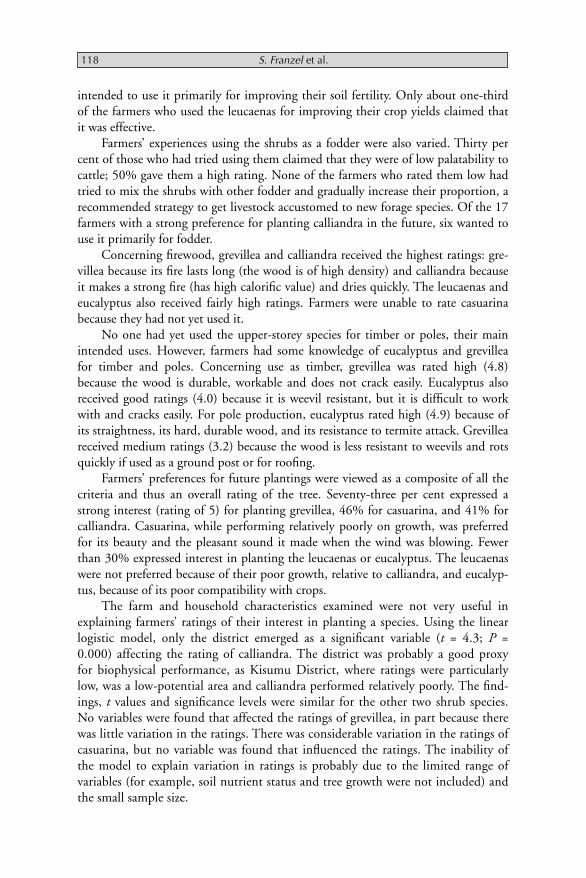
intended to use it primarily for improving their soil fertility. Only about one-thirdof the farmers who used the leucaenas for improving their crop yields claimed thatit was effective.
Farmers’ experiences using the shrubs as a fodder were also varied. Thirty percent of those who had tried using them claimed that they were of low palatability tocattle; 50% gave them a high rating. None of the farmers who rated them low hadtried to mix the shrubs with other fodder and gradually increase their proportion, arecommended strategy to get livestock accustomed to new forage species. Of the 17farmers with a strong preference for planting calliandra in the future, six wanted touse it primarily for fodder.
Concerning firewood, grevillea and calliandra received the highest ratings: gre-villea because its fire lasts long (the wood is of high density) and calliandra becauseit makes a strong fire (has high calorific value) and dries quickly. The leucaenas andeucalyptus also received fairly high ratings. Farmers were unable to rate casuarinabecause they had not yet used it.
No one had yet used the upper-storey species for timber or poles, their mainintended uses. However, farmers had some knowledge of eucalyptus and grevilleafor timber and poles. Concerning use as timber, grevillea was rated high (4.8)because the wood is durable, workable and does not crack easily. Eucalyptus alsoreceived good ratings (4.0) because it is weevil resistant, but it is difficult to workwith and cracks easily. For pole production, eucalyptus rated high (4.9) because ofits straightness, its hard, durable wood, and its resistance to termite attack. Grevilleareceived medium ratings (3.2) because the wood is less resistant to weevils and rotsquickly if used as a ground post or for roofing.
Farmers’ preferences for future plantings were viewed as a composite of all thecriteria and thus an overall rating of the tree. Seventy-three per cent expressed astrong interest (rating of 5) for planting grevillea, 46% for casuarina, and 41% forcalliandra. Casuarina, while performing relatively poorly on growth, was preferredfor its beauty and the pleasant sound it made when the wind was blowing. Fewerthan 30% expressed interest in planting the leucaenas or eucalyptus. The leucaenaswere not preferred because of their poor growth, relative to calliandra, and eucalyp-tus, because of its poor compatibility with crops.
The farm and household characteristics examined were not very useful inexplaining farmers’ ratings of their interest in planting a species. Using the linearlogistic model, only the district emerged as a significant variable (t = 4.3; P =0.000) affecting the rating of calliandra. The district was probably a good proxyfor biophysical performance, as Kisumu District, where ratings were particularlylow, was a low-potential area and calliandra performed relatively poorly. The find-ings, t values and significance levels were similar for the other two shrub species.No variables were found that affected the ratings of grevillea, in part because therewas little variation in the ratings. There was considerable variation in the ratings ofcasuarina, but no variable was found that influenced the ratings. The inability ofthe model to explain variation in ratings is probably due to the limited range ofvariables (for example, soil nutrient status and tree growth were not included) andthe small sample size.
118 S. Franzel et al.
Trees on Farms Ch6 19/2/02 10:28 am Page 118
Fifty-two months after planting, 63% of the farmers showed a high interest inplanting upper-storey trees; only 30% in hedgerow intercropping. Sixty-three percent showed a high interest in grevillea, 47% in calliandra and 43% in casuarina.Less than 10% showed a high interest in the leucaenas. Uptake by neighbours waslow; only 3 of 22 neighbours sampled had planted grevillea since the start of thesurvey, one had planted calliandra, and one, casuarina. Lack of seed or seedlings wasthe main reason that farmers cited for not planting (Bekele, 1997).
Discussion
The farmer-designed trials reported in this chapter served four important func-tions. First, they provided important information about farmers’ managementproblems, preferred niches for tree planting and intended end uses of tree prod-ucts. The main problems reducing tree survival were termites, drought and brows-ing. External boundaries were the most important niche for the planting ofupper-storey trees, whereas they ranked fourth among existing trees (Table 6.1).This finding suggests that farmers consider the other three niches (homesteads,internal boundaries and in crop fields) to be fairly saturated, and that externalboundaries represent the most important niche for future plantings. Casuarina wasthe species most likely to be planted around the homestead, reflecting its utility tofarmers as an ornamental tree.
Shrub species were planted mainly in hedges in crop fields, as their major pur-pose was to increase soil fertility. Many farmers were influenced by the experiencesof their fellow group members, who had planted shrub species in hedgerow inter-cropping trials.
Upper-storey trees were planted primarily for timber and poles. These resultsconfirm findings from previous surveys that firewood is not a particularly scarceproduct in the area and that it is considered, by both men and women, as a by-product rather than as a main product from tree harvests (Bradley, 1991). In con-trast, farmers in central Kenya plant grevillea mainly for firewood (Tyndall, 1996).
Secondly, the trials were important for determining farmers’ evaluation criteriaand for obtaining farmers’ assessment of each species across the criteria. Six growthcharacteristics and six end uses were found to be important. Most were well knownto researchers but one, the importance of ornamental value, came as a surprise. Itsimportance was highlighted by the finding that many farmers were interested inplanting casuarina as an ornamental despite its relatively poor ratings on other crite-ria. The results show the usefulness of the trial in providing researchers with infor-mation on the criteria farmers use to evaluate trees.
Concerning other upper-storey trees, grevillea outperformed eucalyptus onevery growth characteristic except rapidity of growth, and outperformed casuarinaon every one except compatibility with crops. Judgements on uses of the upper-storey species for poles and timber are pending, as farmers have not yet harvestedthem.
Farmer-designed Agroforestry Trials 119
Trees on Farms Ch6 19/2/02 10:28 am Page 119

Among the shrub species, calliandra outperformed the leucaenas on all criteriaexcept compatibility with crops. Thirty-nine per cent of the farmers using calliandrato improve soil fertility found that it was effective in this respect. This result is simi-lar to the findings from the researcher-designed, farmer-managed hedgerow inter-cropping trial in the same area, which showed that about 50% of the farmersreported positive effects (see Chapter 5).
Thirdly, comparisons between on-farm and on-station trials showed thatgrowth rates of both upper-storey species were much higher in the on-station trials,probably reflecting higher soil fertility and more effective weed and termite controlmeasures. Even though casuarina outperformed grevillea in on-station trials, thereverse was true on farms. In the on-farm trials, casuarina was more susceptible tostress factors (drought, and possibly lack of inoculant in the soil) and pests (termitesand browsing) and had lower survival rates and slower growth than grevillea. Theresults demonstrate the importance of assessing the performance of species underfarmer management and farm conditions; rankings of species on growth in on-sta-tion trials will not necessarily hold under farmers’ conditions. They also suggest thaton-farm research is needed to assess the use of fertilizer in growing high-value treesto reduce the time to harvesting the products.
Concerning farmer recommendations, the trial is on-going – the upper-storeyspecies have not yet been harvested. Moreover, only one provenance of each of thespecies was used in this trial; there is high variation among provenances of a speciesand thus recommendations concerning one provenance may not be relevant forothers (Simons et al., 1994). On the basis of the findings, and those of other on-sta-tion and on-farm trials, several interim recommendations can be made.
Calliandra can be recommended for distribution as a fodder tree, based on thistrial and results presented in Chapter 7 and in van der Veen (1993). But many live-stock do not take to eating it on the first try; thus, care has to be taken to introduceit gradually into the diet, by mixing it with other feeds. The other two shrub speciesshould not be recommended – Leucaena leucocephala because of its susceptibility topsyllid damage, and Leucaena diversifolia because of low leafy biomass production.None of the shrub species should be recommended for improving soil fertility asevidence on their effectiveness is lacking, even when the shrubs are planted at therecommended density (see Chapter 5). Moreover, some of the farmers who claimedthat the trees were improving their soil fertility may have been doing so becausethey believed such a response would please the researchers.
Casuarina may also be recommended, based on its preference as an ornamentaland its use for construction poles in eastern Kenya (Jama et al., 1989). However,farmers need to be warned about the slower growth of this species than of grevilleaand eucalyptus, its low survival rate and its susceptibility to termite damage, brows-ing and moisture stress. Grevillea may be recommended, based on its widespreaduse in central Kenya. Research there has shown that grevillea trees planted alongboundaries offer net benefits from fuelwood and timber that are as high as themaize they displace. In addition, they provide other difficult-to-quantify benefits,such as boundary marking, windbreak, erosion control and improved microclimate(Tyndall, 1996).
120 S. Franzel et al.
Trees on Farms Ch6 19/2/02 10:28 am Page 120
Researchers need to continue monitoring the trial, especially with respect toend uses of casuarina, and farmers’ and neighbours’ experience with, and interest in,expanding production of the test species.
Conclusion
Farmer-designed trials are an effective means for finding out how farmers managetrees, for determining their planting criteria and preferences, for assessing tree per-formance under farmers’ conditions and for helping to decide which species shouldbe recommended to farmers. Because few biophysical data are collected, the cost ofconducting such trials is relatively low. Also, most of the data on farmer assessmentmay be taken during slack periods, such as following the crop harvest. Farmer-designed trials are thus a relatively low-cost method to help increase farmer partici-pation in species introduction and agroforestry tree research, enhancing theeffectiveness of research systems to meet farmers’ needs and improve their welfare.
The trial reported on in this chapter also provided important feedback onresearchable problems. For example, the poor performance of upper-storey specieson farms, relative to on-station trials, has led researchers to implement on-farm trialsto assess the growth response of trees to phosphorus fertilizer (Niang et al., 1996).
Farmer-designed trials are also an important tool for extension programmes tohelp farmers and extensionists decide which species should be promoted in a specificarea. In 1994, farmer-designed trials were formally institutionalized in Kenya’s ForestryMaster Plan and the Forestry Extension Services Division was given the mandate toconduct them (Franzel et al., 1996). Farmer-designed trials, as described in this chap-ter, in central Kenya (Holding et al., 1995) and in Eastern Province (O’Neill et al.,1994) are giving farmers major responsibility in screening new species for extensionprogrammes. But two factors impede the technology development and disseminationprocess. First, linkages between research and extension are weak; information exchangeon appropriate technology and farmers’ problems is scant. Secondly, germplasm islacking; farmers cannot get seed for 5–10 years from the grevillea and casuarina treesthat they planted, and there are no other sources of seed. As discussed in Chapter 9,researchers, extensionists and non-governmental organizations are establishing anadaptive research and dissemination network to facilitate linkages between researchand extension and to ensure that germplasm and information are made available tofarmers. This will greatly strengthen linkages and improve the effectiveness of the tech-nology development and dissemination process for agroforestry in western Kenya.
Acknowledgements
The authors are grateful to the following for reviewing earlier versions of this chap-ter: Elias Ayuk, Peter Cooper, Francis Esegu, Roger Leakey, Frank Place, AnthonySimons and Rob Swinkels. Crispus Kamanga is gratefully acknowledged for biomet-rics assistance.
Farmer-designed Agroforestry Trials 121
Trees on Farms Ch6 19/2/02 10:28 am Page 121

References
122 S. Franzel et al.
Bekele, T. (1997) Adoption of hedgerow inter-cropping and two upper-storey tree speciesin western Kenya. Ethiopian MSc inForestry Programme Thesis Works. ReportNo. 1996:1 Faculty of Forestry. SwedishUniversity of Agricultural Sciences,Skinnskatteberg, Sweden.
Biggs, S. (1989) Resource-poor Farmer Partici-pation in Research. International Service forNational Agricultural Research, The Hague,Netherlands.
Bradley, P. (1991) Woodfuel, Women, andWoodlots, Vol. 1, The Foundation of aWoodfuel Development Strategy for EastAfrica. Macmillan, London.
Bruin, E., Ndufa, J.K. and Franzel, S. (1994)Farmers’ evaluation of trees in the foodcrop-based land use system of WesternKenya. In: Atta-Krah, K. (ed.) Agroforestryin the Highlands of Eastern and CentralAfrica. Proceedings of an InternationalSymposium, 6–10 September 1993, Kabale,Uganda. International Centre for Researchin Agroforestry, Nairobi, pp. 28–32.
Collett, D. (1991) Modelling Binary Data.Chapman & Hall, London.
David, S. and Swinkels, R.A. (1994) Socio-economic Characteristics of HouseholdsEngaged in Agroforestry Technology Testing inWestern Kenya. AFRENA Report No. 78.International Centre for Research inAgroforestry, Nairobi.
Fransella, F. and Bannister, D. (1977) A Manualfor Repertory Grid Technique. AcademicPress, New York.
Franzel, S. (2001) Use of an indigenous boardgame, ‘bao’, for assessing farmers’ prefer-ences among alternative agricultural tech-nologies. In: Peters, G. and Pingali, P. (eds)Tomorrow’s Agriculture: Incentives,Institutions, Infrastructure, and Innovations.Proceedings of the 2000 InternationalAgricultural Economics AssociationConference, Ashgate, UK.
Franzel, S., Hitimana, L. and Akyeampong, E.(1995) Farmer participation in on-stationtree species selection for agroforestry: a casestudy from Burundi. ExperimentalAgriculture 31, 27–38.
Franzel, S., Holding, C., Ndufa, J.K., Obonyo,O.C. and Weru, S.M. (1996) Farmers and
trees – linking research and extension.Agroforestry Today 8(3), 19–21.
Haverkort, B., van der Kamp, J. and Waters-Bayer, A. (1991) Joining Farmers’Experiments. Experiences in ParticipatoryTechnology Development. IntermediateTechnology Publications, London.
Holding, C., Niemi, T. and Weru, S.M. (1995)On-farm Diagnostic Trials. Gilgil andKiangop Divisions. Technical Report No. 12.Nakuru and Nyandarua Intensified ForestryExtension Project, Nairobi.
Jama, B., Macklin, B., Rashid, K. and Getahun,A. (1989) Intercropping Experiment withCasuarina equisetifolia in Kenya. NitrogenFixing Tree Research Report, 7. NitrogenFixing Tree Association, Honolulu, Hawaii.
Minae, S. and Akyeampong, E. (eds) (1988)Agroforestry Potentials for the Land UseSystems in the Bimodal Highlands of EasternAfrica, Kenya. AFRENA Report No. 3,International Centre for Research inAgroforestry, Nairobi, Kenya.
Muturi, W.M. and Franzel, S. (1992) Availabilityand use of wood products in the highpotential zones of Western Kenya. In:Hoekstra, D. and Beniest, J. (eds) East andCentral African Agroforestry ResearchNetwork, Proceedings of an InternationalSymposium, 22–26 June, Kigale, Rwanda.AFRENA Report, 58. International Centrefor Research in Agroforestry, Nairobi,Kenya, pp. 48–50.
Niang, A.I., Amadalo, B.A., Gathumbi, S.M.,Otieno, J.H.O., Obonyo, C.O. and Obonyo,E. (1996) KEFRI/KARI/ICRAF/AFRENA-Maseno Project Progress Report September1995–September 1996. AFRENA ReportNo. 110. International Centre for Researchin Agroforestry, Nairobi, Kenya.
O’Neill, M., Murithi, F., Nyaata, Z., Tuwei, P.and Gachanja, S. (1994) NationalAgricultural Research Project, KenyaAgricultural Research Institute. RegionalResearch Centre, Embu, Annual Report:March 1993–March 1994. AFRENAReport No. 81. International Centre forResearch in Agroforestry, Nairobi, Kenya.
Simons, A.J., MacQueen, D.J. and Stewart, J.L.(1994) Strategic concepts in the domestica-tion of non-industrial trees. In: Leakey,
Trees on Farms Ch6 19/2/02 10:28 am Page 122

R.R.B. and Newton, A.C. (eds) TropicalTrees: The Potential for Domestication andthe Rebuilding of Forest Resource.Proceedings of an InternationalSymposium, 23–28 August 1992,Edinburgh, UK. Institute of TerrestrialEcology, HMSO, London.
Tyndall, B. (1996) The Socioeconomics ofGrevillea robusta within the Coffee Land-use
System of Kenya. AFRENA Report No. 109.International Centre for Research inAgroforestry, Nairobi, Kenya.
van der Veen, W. (1993) An economic analysison farms of alley farming with fodder treeson dairy cows in western Kenya. MSc the-sis, Department of DevelopmentEconomics, Wageningen AgriculturalUniversity, Wageningen, Netherlands.
Farmer-designed Agroforestry Trials 123
Trees on Farms Ch6 19/2/02 10:28 am Page 123

Trees on Farms Ch6 19/2/02 10:28 am Page 124
Summary
The uptake of Calliandra calothyrsus as a fodder shrub by small-scale dairy farmers wasassessed several years after the shrubs were introduced to farmers in on-farm trials. Therewas strong evidence that farmers were adopting the shrub. A random sample of 45farmers had increased their average number of shrubs from 84 in their first plantings in1991–1992 to 311 after 6–7 years. Moreover, farmer-to-farmer dissemination appearedto be high, as 47% had harvested seed and 70% of these had given or sold seed orseedlings to other farmers. The net benefits of using 6 kg of fresh calliandra leaves perday as a substitute for 2 kg purchased dairy meal or as a supplement to farmers’ basefeeding regime amounted to about US$130 per cow year−1. By 2000, several thousandfarmers in central Kenya were feeding calliandra to their dairy animals. Potential benefitsfrom adopting calliandra or similar fodder shrub species in Kenya’s smallholder dairysector amounted to about US$139,000,000 year−1. Several measures were proposed tohelp realize this potential: facilitating on-farm research and dissemination of informationand planting material, research to identify new fodder shrub species, and assessing theconstraints and incentives affecting fodder shrub adoption.
Introduction
The low quality and quantity of feed resources is the greatest constraint to improv-ing the productivity of the livestock sector in sub-Saharan Africa (Winrock
Calliandra calothyrsus: Assessing the Early
Stages of Adoption of a Fodder Shrub in the Highlands
of Central KenyaS. FRANZEL,1 H.K. ARIMI2 AND F.M. MURITHI3
1International Centre for Research in Agroforestry, PO Box 30677, Gigiri, Nairobi, Kenya; 2National Agricultural Research Centre, Muguga, PO Box 30148, Nairobi, Kenya; 3Kenya Agricultural
Research Institute, PO Box 58137, Nairobi, Kenya
© CAB International 2002. Trees on the Farm (eds S. Franzel and S.J. Scherr) 125
7
Trees on Farms Ch7 16/2/02 11:51 am Page 125

International, 1992). With milk and meat imports projected to increase dramati-cally, there is increasing interest in leguminous fodder shrubs to help solve the feedproblem, for three reasons. First, the uptake of herbaceous legumes in Africansmallholder systems has been disappointing (Thomas and Sumberg, 1995), encour-aging interest in other protein sources. Secondly, the growing popularity of agro-forestry has helped promote research and extension activities on integrating foddershrubs into farming systems. Thirdly, there is widespread evidence that shrublegumes are an important component of indigenous livestock production systemsthroughout the world (Gutteridge and Shelton, 1993) – cultivation of foddershrubs can thus be viewed as a modification of existing systems rather than a new,and thus more difficult to introduce, practice.
Despite the strong interest, a literature review did not reveal a single case ofwidespread adoption of introduced, managed fodder shrubs by small-scale farmers inAfrica. Several studies discuss on-farm research on fodder shrubs but give little or noindication as to whether farmers adopted and expanded their use of the technologyfollowing the trials (Reynolds et al., 1991; Jabbar et al., 1996). This chapter exam-ines the adoption of Calliandra calothyrsus, a leguminous fodder shrub, among small-holder dairy producers in the highlands of central Kenya. The objectives are to:
● examine the expansion of calliandra plantings by farmers after initial testing,and determine which farm and household characteristics are associated withexpansion;
● document farmers’ experiences and assessments in testing, managing and usingcalliandra;
● determine the economic impact of calliandra from the farmers’ perspective;● provide feedback and recommendations to research, extension and policy mak-
ers for improving and promoting calliandra and fodder shrub production inthe Kenyan highlands.
First, the study area is described. Then research on the management of calliandraas a fodder shrub and as a feed to dairy cows is summarized. Next, the survey meth-ods used in the research are described, followed by the results and the conclusions.
Description of the Study Area
The coffee-based land-use system of central Kenya, ranging in altitude from 1300m to 1800 m, is located on the slopes of Mt Kenya (Fig. 7.1). Rainfall occurs intwo seasons, March–June and October–December, and averages 1200–1500 mmannually. Soils, primarily Nitosols, are deep and of moderate to high fertility.Population density is high, ranging from 450 to 700 persons km−2. This study wasconducted in the portion of Embu District that falls within the coffee-based system.Farm size averages 1.9 ha (SD = 1.5), and 39% of farmers have plots away from theirhomesteads. Most farmers have titles to their land, thus tenure is relatively secure.About 18% of all households are female-headed (Minae et al., 1988; Kimenye,1998; Murithi, 1998).
126 S. Franzel et al.
Trees on Farms Ch7 16/2/02 11:51 am Page 126
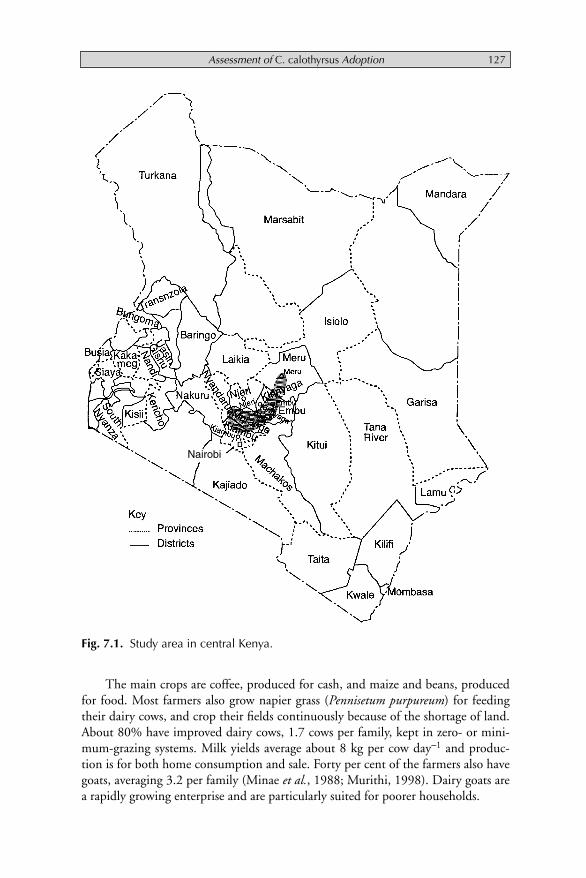
Assessment of C. calothyrsus Adoption 127
Fig. 7.1. Study area in central Kenya.
The main crops are coffee, produced for cash, and maize and beans, producedfor food. Most farmers also grow napier grass (Pennisetum purpureum) for feedingtheir dairy cows, and crop their fields continuously because of the shortage of land.About 80% have improved dairy cows, 1.7 cows per family, kept in zero- or mini-mum-grazing systems. Milk yields average about 8 kg per cow day−1 and produc-tion is for both home consumption and sale. Forty per cent of the farmers also havegoats, averaging 3.2 per family (Minae et al., 1988; Murithi, 1998). Dairy goats area rapidly growing enterprise and are particularly suited for poorer households.
Nairobi
Trees on Farms Ch7 16/2/02 11:51 am Page 127
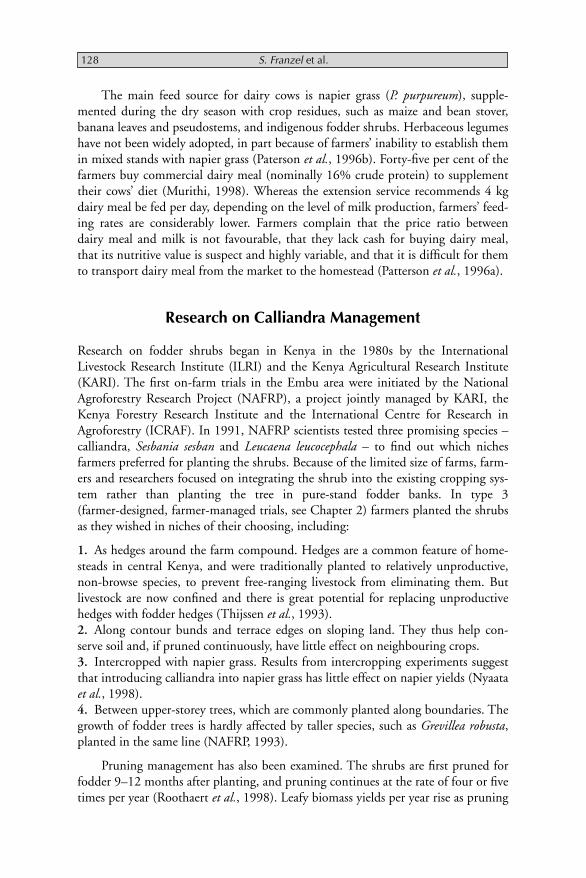
The main feed source for dairy cows is napier grass (P. purpureum), supple-mented during the dry season with crop residues, such as maize and bean stover,banana leaves and pseudostems, and indigenous fodder shrubs. Herbaceous legumeshave not been widely adopted, in part because of farmers’ inability to establish themin mixed stands with napier grass (Paterson et al., 1996b). Forty-five per cent of thefarmers buy commercial dairy meal (nominally 16% crude protein) to supplementtheir cows’ diet (Murithi, 1998). Whereas the extension service recommends 4 kgdairy meal be fed per day, depending on the level of milk production, farmers’ feed-ing rates are considerably lower. Farmers complain that the price ratio betweendairy meal and milk is not favourable, that they lack cash for buying dairy meal,that its nutritive value is suspect and highly variable, and that it is difficult for themto transport dairy meal from the market to the homestead (Patterson et al., 1996a).
Research on Calliandra Management
Research on fodder shrubs began in Kenya in the 1980s by the InternationalLivestock Research Institute (ILRI) and the Kenya Agricultural Research Institute(KARI). The first on-farm trials in the Embu area were initiated by the NationalAgroforestry Research Project (NAFRP), a project jointly managed by KARI, theKenya Forestry Research Institute and the International Centre for Research inAgroforestry (ICRAF). In 1991, NAFRP scientists tested three promising species –calliandra, Sesbania sesban and Leucaena leucocephala – to find out which nichesfarmers preferred for planting the shrubs. Because of the limited size of farms, farm-ers and researchers focused on integrating the shrub into the existing cropping sys-tem rather than planting the tree in pure-stand fodder banks. In type 3(farmer-designed, farmer-managed trials, see Chapter 2) farmers planted the shrubsas they wished in niches of their choosing, including:
1. As hedges around the farm compound. Hedges are a common feature of home-steads in central Kenya, and were traditionally planted to relatively unproductive,non-browse species, to prevent free-ranging livestock from eliminating them. Butlivestock are now confined and there is great potential for replacing unproductivehedges with fodder hedges (Thijssen et al., 1993).2. Along contour bunds and terrace edges on sloping land. They thus help con-serve soil and, if pruned continuously, have little effect on neighbouring crops.3. Intercropped with napier grass. Results from intercropping experiments suggestthat introducing calliandra into napier grass has little effect on napier yields (Nyaataet al., 1998).4. Between upper-storey trees, which are commonly planted along boundaries. Thegrowth of fodder trees is hardly affected by taller species, such as Grevillea robusta,planted in the same line (NAFRP, 1993).
Pruning management has also been examined. The shrubs are first pruned forfodder 9–12 months after planting, and pruning continues at the rate of four or fivetimes per year (Roothaert et al., 1998). Leafy biomass yields per year rise as pruning
128 S. Franzel et al.
Trees on Farms Ch7 16/2/02 11:51 am Page 128

frequency decreases and cutting height increases. But adjacent crop yields are nega-tively affected (ICRAF, 1992). The most productive compromise is probably in therange of 4–6 prunings per year at 0.6–1 m cutting height, which would yieldroughly 1.5 kg dry matter per tree year−1 planted at 2 trees m−1 in hedges underfarmers’ conditions. Thus a farmer would need about 500 trees to feed a cowthroughout the year at a rate of 2 kg dry matter day−1, providing about 0.6 kg crudeprotein. A typical farm of 1.5 ha would have available about 500 m of perimeterand several hundred metres in each of three other niches: along terrace edges orbunds, along internal field and homestead boundaries, and in napier grass plots.Only 250 m of hedges would be needed to accommodate 500 trees, in order to feeda dairy cow (Paterson et al., 1996a,c).
On-farm feeding trials have confirmed the effectiveness of calliandra as both asupplement to the basal diet and as a substitute for dairy meal. One kilogram of drycalliandra (24% crude protein and digestibility of 60% when fed fresh) has aboutthe same amount of digestible protein as 1 kg dairy meal (16% crude protein and80% digestibility) (Paterson et al., 1996b); each increases milk production by about0.75 kg (from 10.0 to 10.75 kg day−1) under farm conditions, but the response isvariable, depending on such factors as the health of the cow and the quantity andquality of the basal feed (Paterson et al., 1996c). The effects of calliandra and dairymeal were found to be additive, suggesting that the two feeds are nutritionally inter-changeable (Paterson et al., 1996c). Unfortunately, data are not available for con-structing a response curve to show the effect of varying quantities of calliandra onmilk production. Calliandra was also found to increase the milk production of dairygoats (Kiruiro et al., 1999).
Calliandra seedlings are raised in nurseries and transplanted following the onsetof the rains. Experiments on seedling production have confirmed that plants maybe grown in raised seedbeds rather than by the more expensive, labourious methodof planting in polythene bags (O’Neill et al., 1997). Researchers are also conductingstudies on other shrubs species, exotic and indigenous (Roothaert et al., 1997), tohelp farmers further diversify their feed sources. These species include Leucaenatrichandra, Morus alba (mulberry) and Sapium ellipticum.
Methods
Informal, semi-structured interviews were conducted in April 1995, with six farm-ers who had tested calliandra, in order to develop an understanding of the issuesinvolved in adoption and to formulate hypotheses. In order to draw up a sampleframe for the formal survey, a list of farmers who had received calliandra seedlingsduring, or previous to, 1993 was assembled. The year 1993 was selected as the cut-off year in order to ensure that sample farmers had at least 2 years’ experience ofgrowing, and thus 1 year of feeding, calliandra. The list included:
● All of the 64 farmers who had participated in the two on-farm calliandra trialsof the National Agroforestry Research Project (NAFRP) up to 1993, including
Assessment of C. calothyrsus Adoption 129
Trees on Farms Ch7 16/2/02 11:51 am Page 129

those who had dropped out of the trials. These farmers had been selected forthe trials on the basis of their interest in testing calliandra.
● Nineteen farmers who had received seedlings from the National DairyDevelopment Project (NDDP). Unfortunately, a complete list of the farmerswho received seedlings was not available, nor were the criteria for their selec-tion known. It is likely that the list drawn up by extension staff for this surveywas biased towards farmers who were adopters.
Assessing adoption among farmers who participated in on-farm trials and spe-cial projects is sometimes suspect, as extensive contact and incentives may bias thefarmers in favour of the technology being assessed. In this particular case, we feelthat such concerns were negligible. None of the farmers in either group received anyincentives apart from free seed and seedlings. All received some advice about callian-dra but, as the findings show, lack of information about calliandra was an importantproblem (one farmer did not know that calliandra could be fed to livestock!).Monitoring and contact with research and extension varied; about half of the farm-ers had completed their trials by 1993 and afterwards had little or no contact withresearchers. About one-third participated in type 2 (researcher-designed, farmer-managed) on-farm trials during 1994 and 1995, involving feeding and pruning, andthus had repeated contact with researchers. The NDDP ended in 1994, so theNDDP farmers had had no contact with the project for a year or longer.
A random sample of 45 farmers from the lists was interviewed twice, in 1995and in 1998, using a structured questionnaire. The authors conducted all interviewsthemselves. In addition, three farmers who had obtained seed from interviewedfarmers were visited, to find out their experience in testing calliandra.
For the economic analysis, partial budgets were drawn up to show the effects onnet income under two scenarios: (i) using calliandra as a supplement to the normaldiet; and (ii) as a substitute for purchased dairy meal. The base analysis assumed a1.5 ha farm with 500 shrubs and one zero-grazed dairy cow and covers a 5-yearperiod. The benefits included in the analysis were the effect of calliandra on milkproduction (in the supplementation case) and the cash saved by not purchasing dairymeal and interest on cash freed up (in the substitution case). Costs were those of theseedlings and labour for planting, cutting and feeding calliandra. Average prices overa 3-year period, 1996–1998, were used for dairy meal, milk and labour. Returns areexpressed in 1998 US dollars, adjusted for inflation. Coefficients, prices and sourcesof data used in the economic analysis are shown in Table 7.1.
Results
Farm and household characteristics
Most (91%) of the households were male-headed, while four (9%) were female-headed. Of the latter group, in three cases the husband was living away and in one,the woman was not married. Household heads were generally middle aged; 48%
130 S. Franzel et al.
Trees on Farms Ch7 16/2/02 11:51 am Page 130

Assessment of C. calothyrsus Adoption 131
Table 7.1. Coefficients and prices used in the economic analysis.
Items Values Data sources
CoefficientsPeriod of analysis 5 years AssumptionLactation period 300 days AssumptionDays fed calliandra 365 days AssumptionDays fed dairy meal 365 days AssumptionCalliandra quantity fed 6 kg fresh (equivalent Assumptionper cow day−1 to 2 kg dry)Dairy meal quantity fed 2 kg Assumptionper cow day−1
Milk output day−1 from 1 kg 0.75 kg Paterson et al. (1996c)dry calliandraMilk ouput day−1 from 1 kg 0.75 kg Paterson et al. (1996c)dairy mealCalliandra leafy biomass 0 kg Farmers’ experienceyield per shrub in year 1Calliandra leafy biomass 1.5 kg (dry) Paterson et al. (1996c)yield per shrub year−1,years 2–5Shrubs required to feed 1 487 Computed from abovecow year−1
Shrub survival rate 80% Survey dataCalliandra planting labour 20 shrubs h−1 FarmersCalliandra cutting and 15 min day−1 Farmersfeeding labourDiscount rate 20% AssumptionInterest on capital freed up Capital tied up for anby using calliandra instead average of 2 weeks,of purchasing dairy meal 20% annual interest
ratePrices
Dairy meal US$0.201 kg−1 Market survey, 1996–1998Transport of dairy meal US$0.008 kg−1 Market survey, 1996–1998Seedling cost (bare-rooted) US$0.526 per 100 R. Swinkels (unpublished
seedlings data from on-farm trial)Labour cost US$0.118 h−1 Farmers, 1996–1998Milk price (farm gate) US$0.296 kg−1 Farmers, 1996–1998Annualized value of fixed cost US$2.18 Use of capital recovery for seedling establishment for formulaa (Spencer et al., 500 shrubs 1979)US$1 = 59 Kenya shillings Average exchange rate,
1996–1998
aK=(rv)/(1 � (1=r)−n) where K is the annual service user cost, v is the original(acquisition) cost of the fixed capital asset, r is the discount rate and n is theexpected life of the asset. This procedure allows both the depreciation on capitaland the opportunity cost of capital to be costed out.
Trees on Farms Ch7 16/2/02 11:51 am Page 131

were between 30 and 55 years old, with 36% older and 17% younger. Eighty-nineper cent of the females and 77% of the males work full time on the farm. Over half(55%) were judged to be high-income farmers, 38% were of middle income and7%, low income.
Farm size averaged 2.3 ha (SD = 1.6; median = 1.6). Of the total, 1.8 ha wassituated around the homestead and 0.5 ha at some distance away. Main enterprises,as ranked by the farmers themselves, were dairy, coffee, tea and maize. Ninety-sixper cent had dairy cows, averaging 1.9 cows per farm. Sixty per cent had heifers,47% had bulls or steers and 53% had calves. Goats were owned by 58%, averaging2.3 per farm, and 27% owned sheep. Eighty-five per cent owned poultry and 68%had rabbits. Overall, the sample farmers appeared to have somewhat higher incomesand were more oriented towards dairy farming than average farmers in their area.Their farms were about 20% larger than average farms in the area.
Establishment and expansion of calliandra plantings
Farmers’ first plantings of calliandra averaged 90 shrubs, of which 84 shrubs sur-vived. The high survival rate, 93% (SD = 13%), was consistent with data collectedin farmer-managed trials in the same area and including some of the same farmers(NAFRP, 1993). Two-thirds were participants in NAFRP on-farm trials, 20%obtained planting material from NDDP, and 13% from other sources. Four-fifthsof the farmers used potted seedlings to establish their first calliandra plantings, 16%established their own nursery, and 4% direct seeded. First plantings occurredbetween 1988 and 1993, with over half taking place in 1992 (Fig. 7.2).
Over four-fifths of the farmers expanded their calliandra plantings after theirfirst planting (Table 7.2). Over one-third expanded twice and 18%, three or fourtimes. As farmers expanded, the number of shrubs planted1 per expansion appearedto increase, although because of the high variability, the differences were not statisti-cally significant (Table 7.2). In farmers’ fourth and fifth plantings, the average num-ber of shrubs planted was 54% higher than in their first plantings.
132 S. Franzel et al.
1 The number of shrubs that survived is used instead of the number that were planted,because in many cases the farmers could not remember how many they had planted,whereas we were able to count the numbers of surviving shrubs. As survival rates averaged93% for the 31 cases where data were available, the differences between numbers plantedand numbers survived was probably small.
Table 7.2. Expansion of calliandra plantings and numbers of shrubs per plantings.
Planting No. of farmers Average no. shrubs per planting (SD)
Initial planting 45 (100%) 84 (65)1st expansion 37 (82 %) 85 (54)2nd expansion 16 (36%) 97 (99)3rd and 4th expansions 8 (18%) 129 (143)
Trees on Farms Ch7 16/2/02 11:51 am Page 132
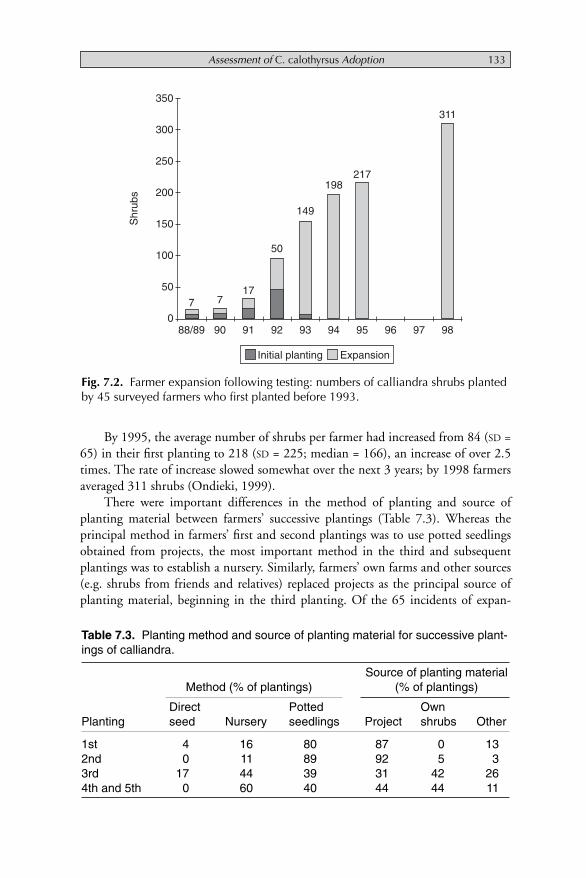
By 1995, the average number of shrubs per farmer had increased from 84 (SD =65) in their first planting to 218 (SD = 225; median = 166), an increase of over 2.5times. The rate of increase slowed somewhat over the next 3 years; by 1998 farmersaveraged 311 shrubs (Ondieki, 1999).
There were important differences in the method of planting and source ofplanting material between farmers’ successive plantings (Table 7.3). Whereas theprincipal method in farmers’ first and second plantings was to use potted seedlingsobtained from projects, the most important method in the third and subsequentplantings was to establish a nursery. Similarly, farmers’ own farms and other sources(e.g. shrubs from friends and relatives) replaced projects as the principal source ofplanting material, beginning in the third planting. Of the 65 incidents of expan-
Assessment of C. calothyrsus Adoption 133
350
300
250
200
150
100
50
0
Shr
ubs
88/89 90 91 92 93 94 95 96 97 98
7 717
50
149
198217
311
Initial planting Expansion
Fig. 7.2. Farmer expansion following testing: numbers of calliandra shrubs plantedby 45 surveyed farmers who first planted before 1993.
Table 7.3. Planting method and source of planting material for successive plant-ings of calliandra.
Source of planting materialMethod (% of plantings) (% of plantings)
Direct Potted OwnPlanting seed Nursery seedlings Project shrubs Other
1st 4 16 80 87 0 132nd 0 11 89 92 5 33rd 17 44 39 31 42 264th and 5th 0 60 40 44 44 11
Trees on Farms Ch7 16/2/02 11:51 am Page 133

sion, 33 involved planting seeds or seedlings obtained from projects, and 32, seedsor seedlings obtained from farmers’ own farms or from other persons. By mid-1995,36% of the farmers had established calliandra nurseries. Three-quarters of theseused seed from their own shrubs.
The niches where farmers planted calliandra were sometimes determined byfarmers and sometimes by researchers, as when an on-farm trial concerned a partic-ular niche. Overall, the most common niches were in lines on contours (62% offarms), intercropped with food crops or coffee (40%), and on homestead bound-aries (35%) (Table 7.4). In plantings where farmers chose the niche, the most com-mon choices were homestead boundaries, external boundaries and in lines oncontours. Only two farmers planted calliandra in pure-stand fodder banks, reflect-ing farmers’ reluctance to allocate even small plots to calliandra.
There did not appear to be much association between uptake of calliandra andselected farm and household characteristics, but the assessment was constrained bythe small size of the sample. Defining an adopter as a farmer who had expanded atleast once and had more than 100 shrubs, 73% of the sample could be termedadopters. There was no association between adoption and farm size, wealth, size offarm adjacent to the homestead, or number of cows. There was a tendency foradoption to be associated with age; six of seven farmers under 30 adopted, whereasonly 9 of 15 over 55 did so. The dairy enterprise’s rank in importance among otherenterprises was significantly associated with adoption at the P < 0.10 level (chi-square test); the higher the rank of dairy, the more likely farmers were to adopt.
Management and uses of calliandra
Pruning methods were quite variable. The most common method was to periodi-cally cut calliandra when it reached a height of about 1.0–1.4 m (before it becomes
134 S. Franzel et al.
Table 7.4. Niches where farmers planted calliandra.
All plantings Plantings where farmer chose(numbers and niche (numbers andpercentages of percentages of farmers
Niche sample farmers)a who chose niches) (n = 35)
In lines on contours 28 (62%) 8 (23%)Intercropped with food crops 18 (40%) 6 (17%)
or coffeeHomestead boundary 16 (35%) 11 (31%)Intercropped in napier 15 (33%) 2 (6%)
grass plotsExternal boundary 11 (24%) 10 (28%)Internal boundary 9 (20%) 6 (17%)
aPercentages do not sum to 100 because farmers often plant in more than oneniche. In some of the on-farm trials, farmers were asked to plant in a particularniche.
Trees on Farms Ch7 16/2/02 11:51 am Page 134
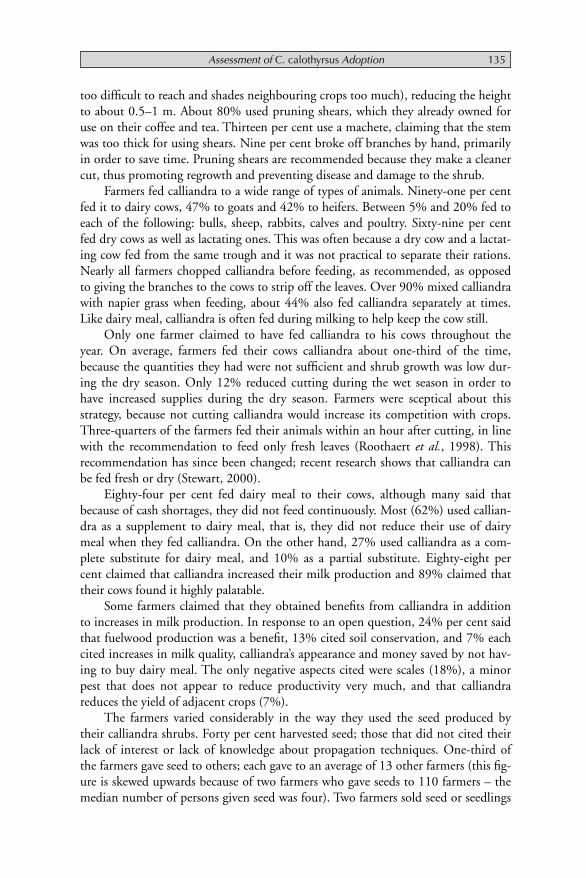
too difficult to reach and shades neighbouring crops too much), reducing the heightto about 0.5–1 m. About 80% used pruning shears, which they already owned foruse on their coffee and tea. Thirteen per cent use a machete, claiming that the stemwas too thick for using shears. Nine per cent broke off branches by hand, primarilyin order to save time. Pruning shears are recommended because they make a cleanercut, thus promoting regrowth and preventing disease and damage to the shrub.
Farmers fed calliandra to a wide range of types of animals. Ninety-one per centfed it to dairy cows, 47% to goats and 42% to heifers. Between 5% and 20% fed toeach of the following: bulls, sheep, rabbits, calves and poultry. Sixty-nine per centfed dry cows as well as lactating ones. This was often because a dry cow and a lactat-ing cow fed from the same trough and it was not practical to separate their rations.Nearly all farmers chopped calliandra before feeding, as recommended, as opposedto giving the branches to the cows to strip off the leaves. Over 90% mixed calliandrawith napier grass when feeding, about 44% also fed calliandra separately at times.Like dairy meal, calliandra is often fed during milking to help keep the cow still.
Only one farmer claimed to have fed calliandra to his cows throughout theyear. On average, farmers fed their cows calliandra about one-third of the time,because the quantities they had were not sufficient and shrub growth was low dur-ing the dry season. Only 12% reduced cutting during the wet season in order tohave increased supplies during the dry season. Farmers were sceptical about thisstrategy, because not cutting calliandra would increase its competition with crops.Three-quarters of the farmers fed their animals within an hour after cutting, in linewith the recommendation to feed only fresh leaves (Roothaert et al., 1998). Thisrecommendation has since been changed; recent research shows that calliandra canbe fed fresh or dry (Stewart, 2000).
Eighty-four per cent fed dairy meal to their cows, although many said thatbecause of cash shortages, they did not feed continuously. Most (62%) used callian-dra as a supplement to dairy meal, that is, they did not reduce their use of dairymeal when they fed calliandra. On the other hand, 27% used calliandra as a com-plete substitute for dairy meal, and 10% as a partial substitute. Eighty-eight percent claimed that calliandra increased their milk production and 89% claimed thattheir cows found it highly palatable.
Some farmers claimed that they obtained benefits from calliandra in additionto increases in milk production. In response to an open question, 24% per cent saidthat fuelwood production was a benefit, 13% cited soil conservation, and 7% eachcited increases in milk quality, calliandra’s appearance and money saved by not hav-ing to buy dairy meal. The only negative aspects cited were scales (18%), a minorpest that does not appear to reduce productivity very much, and that calliandrareduces the yield of adjacent crops (7%).
The farmers varied considerably in the way they used the seed produced bytheir calliandra shrubs. Forty per cent harvested seed; those that did not cited theirlack of interest or lack of knowledge about propagation techniques. One-third ofthe farmers gave seed to others; each gave to an average of 13 other farmers (this fig-ure is skewed upwards because of two farmers who gave seeds to 110 farmers – themedian number of persons given seed was four). Two farmers sold seed or seedlings
Assessment of C. calothyrsus Adoption 135
Trees on Farms Ch7 16/2/02 11:51 am Page 135

to other farmers. Two-thirds of the farmers had left some shrubs to seed at the timethey were interviewed, indicating their strong interest in expanding calliandra pro-duction or in distributing seed.
Interviews were conducted with three farmers who obtained seed from thesample farmers. Two used the seed to establish nurseries in 1995. One had trans-planted 67 shrubs from the nursery to his farm; the other was waiting for theseedlings to reach sufficient size before transplanting. A third farmer purchased 500seedlings in 1994 from a sample farmer and he planted them on internal and exter-nal boundaries. He purchased an additional 100 seedlings in 1995. He also estab-lished a nursery in late 1995, and planned to transplant seedlings to his farm in1996. As these farmers were not randomly selected, they cannot be said to be repre-sentative of farmers receiving seed from sample farms. But their experiences indi-cated the high potential for dissemination beyond the original farmers.
Each person who harvested seed harvested from an average of only eightshrubs. It is advisable to harvest from at least 30 shrubs in order to conserve thegenetic diversity of the germplasm. If the genetic base in an area is too narrow,inbreeding causes a significant decline in productivity (Roothaert et al., 1998).Farmers were unaware of the need to harvest from at least 30 shrubs. Some may bereluctant to leave so many shrubs for seed because they become tall and reduce thegrowth of adjacent crops.
Ninety-one per cent of the farmers indicated an interest in increasing their cal-liandra plantings. When asked about constraints limiting expansion of calliandra,19 (42%) claimed they lacked seedlings. Since some farmers had received seedlingsfrom projects two or more times, they clearly were hoping to receive seedlings againso as not to have to develop their own nurseries. Three mentioned that they lackedknowledge on propagation techniques.
Surprisingly, most of the farmers (58%) had never visited another farmer whohad planted calliandra. Nineteen per cent had visited other calliandra farmers aspart of extension tours and 34% had visited other calliandra farmers on their own.
Monitoring, farmer innovation and feedback
Informal monitoring takes place in which farmers and extension staff provide feed-back to project staff and researchers on their progress and problems. In one case,feedback on a farmer innovation has resulted in a change in extension recommenda-tions. Farmers in Kandara Division, Maragua District, conducted experiments onsoaking calliandra seeds before planting and found that seeds soaked for 48–60 hhad higher germination rates than those soaked for the recommended 24 h.Researchers at KARI-Embu confirmed the farmers’ findings and extension staff nowrecommend the longer soaking time.
Farmers’ problems with pests and their innovations in controlling them havealso led to the design of new on-farm trials. For example, in 2001, researchers andfarmers are comparing the effectiveness of using netting and local measures (spray-ing solutions made from tobacco, marigold, neem, hot pepper or Tephrosia vogelii)
136 S. Franzel et al.
Trees on Farms Ch7 16/2/02 11:51 am Page 136

to control crickets, hoppers and aphids damaging seedlings in nurseries. These find-ings demonstrate the importance of monitoring farmer innovations and feedingthem back to research and extension.
Economic analysis
Partial budgets for calliandra as a supplement to farmers’ basal feed and as a substi-tute for dairy meal are shown in Tables 7.5 and 7.6. Shrub establishment costs(including the costs of seedlings and planting) are modest, US$6.58 per 500shrubs.2 Beginning in the second year, harvesting and feeding 2 kg dry calliandraday−1 as a supplement throughout the lactation period increases milk production byabout 450 kg year−1, an increase of about 10% over base milk yields. Incrementalbenefits per year after the first year are over 12 times higher than incremental costs.Net benefits per cow year−1 after year 1 are US$120.11. Treating the establishmentcosts as depreciation spread over the 5-year period, the annualized net benefit isUS$117.91 per cow year−1. The net present value (NPV), assuming a 20% discountrate, is US$258.39.
In the partial budget assessing calliandra as a substitute for dairy meal, estab-lishment, cutting and feeding costs are the same as in the preceding analysis. Byfeeding calliandra, the farmer saves the money he would have spent buying andtransporting 730 kg dairy meal during the year. Incremental benefits per year afterthe first year are over 14 times higher than incremental costs. Milk production doesnot increase but net benefits are slightly higher than in the supplementation case.The net benefits per cow year−1 after year 1 are US$141.68. The annualized netbenefit is US$139.48 per cow year−1. The NPV, assuming a 20% discount rate, isUS$300.15. Therefore, using calliandra increases farmers’ annual income by about
Assessment of C. calothyrsus Adoption 137
2 US$1 = 59 Kenya shillings on average for the period 1996–1998.
Table 7.5. Partial budget: extra costs and benefits of using calliandra as a sup-plement for increasing milk production (US$).
Extra cost Extra benefits Net benefit
Year Item US$ Item US$ (US$)
1 Shrub seedlings 3.05 0Planting labour 3.53Subtotal 6.58 −6.58
2 Cutting/feeding labour 10.75 450 kg milk 133.07 122.32Years 3–5 same as year 2Net present value at 20% discount rate = US$258.39 year−1
Net benefit per year after year 1 = US$120.11Annualized net benefit treating establishment costs as depreciation = US$117.91
Base farm model: the farm has 500 calliandra shrubs and one dairy cow. The cowconsumes a basal diet of 80 kg napier grass day−1 and produces 10 kg milk day−1.
Trees on Farms Ch7 16/2/02 11:51 am Page 137

US$120–142 per cow year−1, depending on whether the farmer is supplementing orsubstituting. As the average farmer owns 1.7 cows, calliandra increases farmers’income by about US$204–241 year−1, representing an increase of about 10% intotal household income (Murithi, 1998).
Returns varied somewhat among the 3 years (1996–1998) for which economicdata were collected. For example, net benefits per cow year−1 after year 1 varied fromUS$94–120 in the supplement scenario and US$107–151 in the substitute scenario.
The costs of establishing, maintaining and feeding calliandra are low. In boththe substitute and supplement scenarios, farmers recover their costs very quickly, inthe second year after planting. In order to break even, a farmer using calliandra as asupplement needs to obtain only 0.08 kg of milk from 1.0 kg of calliandra (dry),rather than the 0.75 kg milk kg−1 of calliandra obtained in on-farm trials andassumed in the analysis.
Several intangible, or otherwise difficult to measure, benefits and costs havebeen omitted from this analysis. Calliandra provides benefits to some farmers asfirewood, in erosion control, as a boundary marker, a fence and as an ornamental. Italso increases the butterfat content of milk, giving it a richer taste and creamier tex-ture. When used as a supplement, calliandra may improve animal health and fertil-ity and reduce the calving interval. Finally, several farmers noted that calliandra hadimportant benefits relative to dairy meal: it was available on the farm, cash was notneeded to obtain it and its nutritional content was more reliable than that of dairymeal. These views support Haugerud’s thesis that farmers prefer enterprises andpractices that do not rely on uncertain governmental or market mechanisms(Haugerud, 1984).
138 S. Franzel et al.
Table 7.6. Partial budget: extra costs and benefits of using calliandra as a sub-stitute for dairy meal in milk production (US$).
Extra cost Extra benefits Net benefit
Year Item US$ Item US$ (US$)
1 Shrub seedlings 3.05 0Planting labour 3.53Subtotal 6.58 −6.58
2 Cutting/feeding labour 10.75 Saved dairy 147.10meal costSaved dairy 5.32meal transportInterest on 0.90capitalfreed up
Subtotal 10.75 Subtotal 152.43 141.68Years 3–5 same as year 2Net present value at 20% discount rate = US$300.15Net benefit per year after year 1 = US$141.68Annualized net benefit treating establishment costs as depreciation = US$139.48
Base farm model as in Table 7.5.
Trees on Farms Ch7 16/2/02 11:51 am Page 138
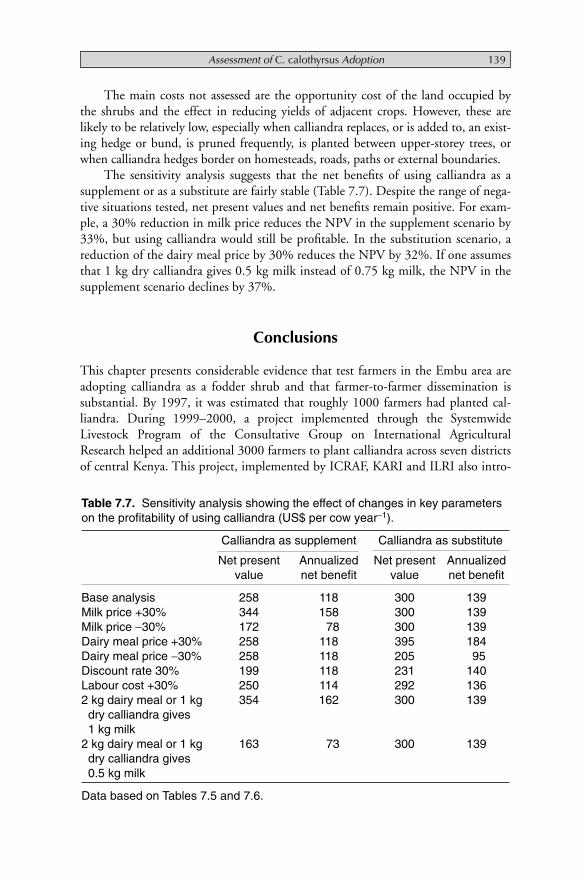
The main costs not assessed are the opportunity cost of the land occupied bythe shrubs and the effect in reducing yields of adjacent crops. However, these arelikely to be relatively low, especially when calliandra replaces, or is added to, an exist-ing hedge or bund, is pruned frequently, is planted between upper-storey trees, orwhen calliandra hedges border on homesteads, roads, paths or external boundaries.
The sensitivity analysis suggests that the net benefits of using calliandra as asupplement or as a substitute are fairly stable (Table 7.7). Despite the range of nega-tive situations tested, net present values and net benefits remain positive. For exam-ple, a 30% reduction in milk price reduces the NPV in the supplement scenario by33%, but using calliandra would still be profitable. In the substitution scenario, areduction of the dairy meal price by 30% reduces the NPV by 32%. If one assumesthat 1 kg dry calliandra gives 0.5 kg milk instead of 0.75 kg milk, the NPV in thesupplement scenario declines by 37%.
Conclusions
This chapter presents considerable evidence that test farmers in the Embu area areadopting calliandra as a fodder shrub and that farmer-to-farmer dissemination issubstantial. By 1997, it was estimated that roughly 1000 farmers had planted cal-liandra. During 1999–2000, a project implemented through the SystemwideLivestock Program of the Consultative Group on International AgriculturalResearch helped an additional 3000 farmers to plant calliandra across seven districtsof central Kenya. This project, implemented by ICRAF, KARI and ILRI also intro-
Assessment of C. calothyrsus Adoption 139
Table 7.7. Sensitivity analysis showing the effect of changes in key parameterson the profitability of using calliandra (US$ per cow year−1).
Calliandra as supplement Calliandra as substitute
Net present Annualized Net present Annualizedvalue net benefit value net benefit
Base analysis 258 118 300 139Milk price +30% 344 158 300 139Milk price −30% 172 78 300 139Dairy meal price +30% 258 118 395 184Dairy meal price −30% 258 118 205 95Discount rate 30% 199 118 231 140Labour cost +30% 250 114 292 1362 kg dairy meal or 1 kg 354 162 300 139dry calliandra gives1 kg milk
2 kg dairy meal or 1 kg 163 73 300 139dry calliandra gives0.5 kg milk
Data based on Tables 7.5 and 7.6.
Trees on Farms Ch7 16/2/02 11:51 am Page 139

duced two other fodder shrubs to farmers, Leucaena trichandra and Morus alba(mulberry), and one herbaceous legume, Desmodium intortum.
Calliandra appears to be appropriate for smallholder dairy farmers throughouteastern Africa – it can grow at altitudes between sea level and 1900 m, requires aminimum of 1000 mm rainfall, can withstand dry seasons up to 4 months longand is suitable for cut-and-carry feeding systems or for grazing systems (Roothaertet al., 1998). There are approximately 625,000 smallholder dairy farmers in Kenyawith improved cows; each has about 1.7 cows per farm (Omore et al., 1999).Therefore, the potential benefits from adopting calliandra, as measured in thischapter, amount to about US$139,000,000 year−1 in the Kenya smallholder dairysector alone.
Calliandra’s actual potential benefits are much higher. Calliandra also hasimportant potential in the large-scale dairy sector, which supplies 30% of Kenya’smilk, and in the dairy goat sector, which is growing rapidly and is particularly suitedto resource-poor farmers. Moreover, the shrub is being used by dairy farmers atnumerous other sites in east and southern Africa, including Rwanda, Uganda,Tanzania and Zimbabwe, and results are promising. But several important problemsremain; the proposed measures in the following section can help to solve these prob-lems and enhance the benefits that calliandra can offer to African dairy farmers.
Issues for research and extension
Whereas the project has successfully expanded the use of fodder shrubs across sevendistricts, it is still reaching only a small percentage of dairy farmers in these districts,and less than 1% of Kenya’s smallholder dairy farmers. Like many agroforestry prac-tices, fodder trees spread slowly on their own; considerable facilitation in terms oftraining, information and germplasm is required. Further scaling up should focuson institutions working in areas of the country where smallholder dairy farmers pre-dominate. ICRAF, the Oxford Forestry Institute, the Regional Land ManagementUnit and other partners are planning a project that will help the government exten-sion services, NGOs, and farmer organizations throughout East Africa to assistfarmers to plant fodder trees.
Commercial seed production and distribution are slowly emerging in projectareas, but it is not clear if seed production will continue to grow and meet localdemand. Greater emphasis is needed on promoting community-based seed produc-tion and distribution through a range of partners: farmer groups, individual seedproducers and private nurseries. Research is also needed to compare the effective-ness and efficiency of different mechanisms for producing and distributing plantingmaterial.
Four other on-farm research issues need to be addressed:
1. Greater diversification of fodder shrubs is needed to reduce the risk of pest anddisease attacks and improve feed quality. KARI-Embu has a strong on-farm researchprogramme for evaluating fodder trees and is increasing its emphasis on the testingof indigenous species.
140 S. Franzel et al.
Trees on Farms Ch7 16/2/02 11:51 am Page 140

2. Many farmers now have 5–10 years of experience feeding calliandra to theircows; the knowledge that these farmers have gained on feeding calliandra needs tobe captured and shared.3. More research is needed on the constraints and incentives affecting the adoptionof calliandra. For example, a survey of neighbours of calliandra adopters could beuseful for identifying the problems they have in testing and adopting calliandra.4. Networks of farmer experimenters need to be established. During the surveyreported in this chapter, a considerable amount of farmer experimentation wasobserved. For example, individual farmers were found to be experimenting on theeffect of different cutting heights, on substitutability between dairy meal and cal-liandra, and on methods of establishment. Farmers and researchers could both gainif farmers were able to organize themselves to conduct research on particular issues,using farms as replicates. Farmer-experimenters working together on a topic couldmeet periodically to assess progress and, at the end of the experiment, could drawconclusions.
Finally, more research is needed for expanding smallholder dairy production.Milk demand in Africa greatly outstrips locally available supplies. Dwindling feedresources and high transaction costs for production and marketing limit productiv-ity and smallholder participation (Winrock International, 1992; Staal et al., 1996).Fodder shrubs help reduce costs and improve the productivity and profitability ofsmallholder dairying. Even when dairy production is stagnant, fodder shrubs maybe attractive to farmers as substitutes for purchased concentrates. But expansion offodder shrubs will likely be greatest when dairy production is increasing.
Factors contributing to success and challenges
Several factors have contributed to the achievements thus far in developing and dis-seminating fodder shrubs:
1. The demand among farmers for fodder shrubs was huge, mainly because theshrubs save cash, farmers’ scarcest resource, and require only small amounts of landand labour.2. Initial on-farm trials were farmer-designed and farmer-managed, permittingfarmers to plant the trees in farm niches of their choice and to manage them as theysaw fit.3. The project area is noted for the dynamism of its farmers, and access to marketsis fairly high, enhancing the adoption of new practices.4. Because researchers and extensionists worked through partner organizations,they were able to build on local organizational skills and knowledge and reach farmore farmers than would otherwise have been possible.5. The strong partnership between researchers, extensionists and farmers in theproject facilitated the flow of information among the three.
Assessment of C. calothyrsus Adoption 141
Trees on Farms Ch7 16/2/02 11:51 am Page 141

Acknowledgements
The authors are grateful to the following for their advice and assistance: John Curry,Peterson Mwangi, Paul Ongugo, Mick O’Neill, Rob Paterson, Ralph Roothaert,Sara Scherr and Meredith Soule. They are also grateful to the following organiza-tions that supported the research and development work reported in this chapter:the Swedish International Development Cooperation Agency, the SystemwideLivestock Programme of the CGIAR, and the Forestry Research Programme of theUnited Kingdom Department for International Development.
References
142 S. Franzel et al.
Gutteridge, R.C. and Shelton, H.M. (1993) Thescope and potential of tree legumes in agro-forestry. Agroforestry Systems 23(2–3),177–194.
Haugerud, A. (1984) Household dynamics andrural political economy among Embu farm-ers in the Kenya highlands. PhD disserta-tion, Department of Anthropology,Northwestern University, Chicago, Illinois.
ICRAF (1992) Annual Report, 1991.International Centre for Research inAgroforestry, Nairobi.
Jabbar, M.A., Larbi, A. and Reynolds, L. (1996)Alley Farming for Improving Small RuminantProductivity in West Africa: ILRI’sExperiences. Socioeconomics and PolicyResearch Working Paper No. 20.International Livestock Centre for Africa,Addis Ababa.
Kimenye, L. (1998) Assessment of technologydissemination and utilization by womenand men farmers. A case study of Embu andMbeere Districts. In: Curry, J., Kooijman,M. and Recke, H. (eds) InstitutionalisingGender in Agricultural Research: Experiencesfrom Kenya. Proceedings of the GenderConference, Kenya Agricultural ResearchInstitute 5–7 October 1998, Nairobi, pp.201–204.
Kiruiro, E.M., Ouma, O. and Arimi, H.K.(1999) The Potential for Improving MilkProduction from Dual Purpose Goats by UsingCalliandra calothyrsus on Smallholder Farmsof the Coffee/tea Land-use System of EmbuDistrict. Annual Report, 1999. KenyaAgricultural Research Insitute, RegionalResearch Centre Embu, Kenya.
Minae, S.E., Kaumi, S., Avila, M., Okorio, J.,
Kaboneka, S. and Ghahamanyi, A. (1988)Agroforestry Research Project Proposal for theCoffee Based System in the BimodalHighlands, Central and Eastern Provinces,Kenya. AFRENA Report No. 16.International Centre for Research inAgroforestry, Nairobi, Kenya.
Murithi, F.M. (1998) Economic evaluation of therole of livestock in mixed smallholder farmsof the central highlands of Kenya. PhD the-sis, Department of Agriculture, Universityof Reading, UK.
NAFRP (1993) National Agroforestry ResearchProject. KARI Regional Research Centre,Embu. Annual Report: March 1992–April1993. AFRENA Report No. 69.International Centre for Research inAgroforestry, Nairobi.
Nyaata, O.Z., O’Neil, M.K. and Roothaert, R.L.(1998) Comparison of Leucaena leuco-cephala with Calliandra calothyrsus in Napier(Pennisetum purpureum) fodder banks. In:Shelton, H.M., Gutteridge, R.C., Mullen,B.F. and Bray, R.A. (eds) Leucaena-Adaptation Quality and Farming Systems,Proceedings of a workshop held in Hanoi,Vietnam, 9–14 February 1998. AustralianCentre for International AgriculturalResearch, Canberra, pp. 257–260.
Omore, A., Muriuki, H., Kenyanjui, M., Owango,M. and Staal, S. (1999) The Kenyan DairySub-sector: a Rapid Appraisal. SmallholderMinistry of Agriculture/Kenya AgriculturalResearch Institute/International LivestockResearch Institute, Kenya.
Ondieki, F. (1999) The adoption of Calliandracalothyrsus in the Embu area, Kenya. MScthesis, Oxford University, UK.
Trees on Farms Ch7 16/2/02 11:51 am Page 142

O’Neill, M., Gachanja, S., Karanja, G.M.,Kariuki, I.W., Kanampiu, F., Kiruiro, E.,Murithi, F., Okoba, B., Nyaata, Z.,Mwangi, J., Tuwei, P., Roothaert, R. andPaterson, R. (1997) National AgroforestryResearch Project, Kenya Agricultural ResearchInstitute, Regional Research Centre, Embu,Annual Report: March 1995–March 1996,AFRENA Research Report No. 108.International Centre for Research inAgroforestry, Nairobi.
Paterson, R.T., Kiruiro, E. and Arimi, H.K.(1996a) The use of Calliandra calothyrsusfor milk production. National AgroforestryResearch Project, Embu.
Paterson, R.T., Roothaert, R. and Kariuki, I.W.(1996b) Fodder trees in agroforestry: theKenyan approach. In: Mugah, J.O. (ed.)People and Institutional Participation inAgroforestry for Sustainable Development.Proceedings of the First Kenya NationalAgroforestry Conference, 25–29 March1996. Kenya Forestry Research Institute,Muguga.
Paterson, R.T., Roothaert, R., Nyaata, O.Z.,Akyeampong, E. and Hove, L. (1996c)Experience with Calliandra calothyrsus as afeed for livestock in Africa. In: Evans, D.O.(ed.) Proceedings of an InternationalWorkshop on the Genus Calliandra, 23–27January 1996. Winrock International,Bogor, Indonesia.
Reynolds, L., Didomenico, C., Atta-Krah, A.N.and Cobbina, J. (1991) Alley farming insouthwest Nigeria: the role of farming sys-tems research in technology development.In: Tripp, R. (ed.) Planned Change inFarming Systems: Progress in On-FarmResearch. John Wiley & Sons, Chichester,UK.
Roothaert, R., Arimi, H.K. and Kamau, E.N.(1997) Indigenous fodder species in Kenya– assessing the wealth. Agroforestry Today9(3), 17–20.
Roothaert, R., Karanja, G.M., Kariuki, I.R.,Paterson, P., Tuwei, P., Kiruiro, E., Mugwe,J. and Franzel, S. (1998) Calliandra forLivestock. Technical Bulletin No. 1.Regional Research Centre, Embu, Kenya.
Spencer, D.S.C., Byerlee, D. and Franzel S.(1979) Annual costs, returns, and seasonallabour requirements for selected farm andnon-farm enterprises in rural Sierra Leone.Working Paper No. 27. Department ofAgricultural Economics, Michigan StateUniversity, East Lansing, Michigan.
Staal, S., Delgado, C.L. and Nicholson, C.F.(1996) Smallholder Dairying UnderTransactions Costs in East Africa. MSSDDiscussion Paper No. 9. IFPRI,Washington, DC.
Stewart, J.L. (2000) The DFID/FRP Project‘Investigation of factors affecting the nutri-tive value of Calliandra calothyrsus leaf asfodder for ruminants: overview of the pro-ject and results from Latin America and theUnited Kingdom’. In: Mwangi, M.,Franzel, S. and Stewart, J.L. (eds)Calliandra calothyrsus and Other FodderTrees: Moving Forward in Research andDevelopment. Proceedings of an interna-tional workshop, Nairobi, 6–8 June 2000.ICRAF, Nairobi.
Thijssen, R., Murithi, F.M. and Nyaata, O.Z.(1993) Existing Hedges on Farms in theCoffee Based Land Use System of EmbuDistrict, Kenya. AFRENA Report No. 65.International Centre for Research inAgroforestry, Nairobi.
Thomas, D. and Sumberg, J. (1995) A review ofthe evaluation and use of tropical foragelegumes in Sub-Saharan Africa. Agriculture,Ecosystems, and the Environment 54,151–163.
Winrock International (1992) Assessment of ani-mal agriculture in sub-Saharan Africa.Winrock International Institute forAgricultural Development, Arkansas, USA.
Assessment of C. calothyrsus Adoption 143
Trees on Farms Ch7 16/2/02 11:51 am Page 143

Trees on Farms Ch7 16/2/02 11:51 am Page 144

Summary
Successful diffusion and adoption of new agroforestry practices depend not onlyupon the technical performance of those practices and their ‘fit’ with farming sys-tems, but also on the broader policy environment. Key policy factors relate to: treegermplasm supply, agricultural input supply, markets for agroforestry products, landand forest tenure systems and strategies and institutional arrangements for exten-sion and research support. On-farm research during the technology developmentprocess provides a strategic opportunity to begin evaluating policy constraints andways to address them. Researchers need to involve policy makers in the design andevaluation of assessments and to communicate effectively with them. Based on dataand experience from on-farm research programmes in Kenya and Zambia, generalpolicy lessons are drawn, and specific policy recommendations are made for pro-moting hedgerow intercropping, improved fallows, pole and timber trees, and fod-der banks in the eastern and southern Africa context.
Introduction
Successful diffusion and adoption of new agricultural practices depend not onlyupon the technical performance of those practices and their ‘fit’ with farming sys-tems and management constraints, but also on the broader policy environment.The successful dissemination of improved maize production technology inZimbabwe, Zambia and Malawi, for example, was due not just to varietal improve-
Promoting New AgroforestryTechnologies: Policy
Lessons from On-farmResearch
S.J. SCHERR1 AND S. FRANZEL2
1Agricultural and Resource Economics Department, University ofMaryland, College Park, MD 20742, USA; 2International Centre
for Research in Agroforestry, ICRAF House, PO Box 30677, Gigiri, Nairobi, Kenya
© CAB International 2002. Trees on the Farm (eds S. Franzel and S.J. Scherr) 145
8
Trees on Farms Ch8 22/2/02 11:44 am Page 145

ments on farm, but also to technological innovations in processing, price and sup-port policies, institutional and market changes, and coordination of these variouscomponents (Howard et al., 1997).
The technology development and testing phase of on-farm research provides astrategic opportunity to begin evaluating policy effects and devising options to dealwith policy constraints and opportunities. Research results reported in this volumeindicate that there is considerable potential for many agroforestry practices toincrease farm income, meet household needs, contribute to local economic growthand possibly improve environmental conditions in different regions of Africa.However, those same studies revealed the need for specific types of policy action toachieve widespread adoption and significant aggregate impact from the new agro-forestry practices. Key factors strongly influenced by public policy include: treegermplasm supply, agricultural input supply, markets for agroforestry products, landand forest tenure systems, technology design for extension and institutionalarrangements for on-farm research and extension support (Oram, 1993; Place andDewees, 1999). In this chapter, we review briefly key findings and insights in rela-tion to these six policy areas, and recommend priorities for policy action.
Tree Germplasm Supply
Place and Kindt (1997) note many weaknesses in current policy frameworkstowards improved agroforestry tree germplasm supply, including the fragmentationof institutional mandates and functions, lack of coordination of planning, lack offorecasting demand for species, and the poor and unstable funding environment ofinstitutions. The case studies revealed specific issues of germplasm supply for thevarious agroforestry practices being developed, related to the cost of tree establish-ment, seedling production and seed supply.
Promote low-cost planting methods
For fodder banks in central Kenya, establishment costs represent only a modestshare of total costs, and for timber and pole trees in western Kenya, seedling qualityis a much more important consideration than cost. But for improved fallows inwestern Kenya and Zambia and for hedgerow intercropping in western Kenya,establishment costs are much more important, because tree densities are high and,in the case of improved fallows, trees need to be replanted after only 3–5 years.Reducing the cost and labour required for planting is thus an important means forincreasing the adoption potential of improved fallows and hedgerow intercropping.
Two strategies are to promote the use of bare-root seedlings and direct seeding.For hedgerow intercropping in western Kenya, the economic break-even maize yieldincrease drops from 10.5% to 6% by using bare-root rather than potted seedlings.In the case of improved fallows in western Kenya, direct seeding (where feasible) isfar more profitable than the use of potted seedlings. Even in these cases, though,
146 S.J. Scherr and S. Franzel
Trees on Farms Ch8 22/2/02 11:44 am Page 146

there is no evidence that financial subsidy policies are required to promote thesetypes of agroforestry practices, except perhaps during an initial trial period for farm-ers to become familiar with the species or practice.
Promote small-scale farm seedling supply
While centralized tree nurseries offer some advantages for training, seed dissemina-tion and quality control early in the extension process, they appear to be neitherneeded nor likely to persist as important sources for farmers once broader adoptiontakes place. As shown in the Zambian on-farm research experience, they also pre-sent some tricky problems for division of labour inputs and of seedling outputs.
The alternative of using small-scale farm nurseries has been very successful.Such nurseries have several advantages. The production of seedlings from seeds orcuttings is a very labour-intensive process; farmers can manage nurseries as comple-mentary activities to farming, thus keeping labour costs lower than in large-scalenurseries where full-time hired labour is used. Also, they are more convenient forfarmers who avoid the costs of transporting seedlings long distances, and also thedamage and loss experienced during transport. Nurseries also provide additionalincome opportunities for farmers. The only major disadvantage of farm nurseries isthat farmers usually require training in nursery establishment. Nevertheless, a smallamount of facilitation can go a long way. For example, a single extension facilitatorin central Kenya was able to assist 150 farmer groups, composed of about 2600farmers, to establish 250 calliandra nurseries over an 18-month period, 1999–2000(ILRI, 2000).
An active market mechanism has developed for seedlings of multipurpose treesin western Kenya, through small-scale private nurseries. In the case of fodder treesin central Kenya, there has been a rapid switch from project to farmer group andprivate nurseries, some of which use farm-produced seed. The major recommenda-tions for promoting small-scale nurseries, once farmers are aware of the potentialbenefits of a practice, are: (i) to focus training on existing farmer groups and privatenurseries rather than individual farmers; (ii) to work through non-governmentalorganizations (NGOs) and community-based organizations as well as governmentextension services; (iii) to facilitate farmer-to-farmer training and exchange visits;and (iv) to assist farmers to maintain quality and genetic diversity of seed stocks.The case from central Kenya mentioned above illustrates how these recommenda-tions can be effectively implemented. The extension facilitator was able to reach somany farmers by collaborating closely with three departments of the Ministry ofAgriculture, two provincial administrations, one international NGO, four localNGOs, ten community-based organizations and 150 farmer groups (ILRI, 2000).Nearly all the groups had been formed for other purposes, such as church groups,groups to buy water storage tanks, and groups to manage dairy goat breeding stock.Groups managed one or more nurseries; in most cases the nursery was located inthe field of a member where water was available during the dry season, and groupmembers shared the labour and distributed the seedlings equally. The groups them-
Promoting New Agroforestry Technologies 147
Trees on Farms Ch8 22/2/02 11:44 am Page 147

selves paid for the exchange visits and these were useful for motivating them andenabling them to exchange information on how nurseries and fodder trees could bemanaged and used. Group nurseries are not necessarily permanent, in many casesfarmers indicated that they worked together only to attract assistance and trainingand that their future plans were to start their own nurseries.
Expand the supply of high-quality seed through decentralized seedorchards
The lack of tree seed has already become a significant constraint for expansion ofimproved fallows in Zambia, pole and timber trees in western Kenya, and foddertrees in central Kenya. The on-farm research projects are currently the major sourceof seeds for farmers, either producing seed or helping to procure it from elsewhere. Inaddition, farmer seed collection has become increasingly important for the more pop-ular new species, such as calliandra in western Kenya, and for traditionally availablespecies, such as sesbania and grevillea in western Kenya. But a reliable seed supplyand distribution system on a much greater scale is required for large-scale adoption.
In contrast to the situation for annual crop seed, where the private sector isbecoming more active in development and replication throughout Africa (althoughgovernment agencies continue to play a critical role), there are as yet few incentivesfor private sector investment. Some trees require many years before they produceseeds, which delays investment returns and locks producers into selected products;future markets for the variety of tree species and provenances are highly uncertain.We suggest several policy actions to promote seed production and distribution.
First, we propose that high-quality, high-productivity seed orchards be estab-lished earlier in the technology development process. These typically require severalyears to be in full production. Past policy has been to wait until species and on-farmresearch trials have been completed and superior species and varieties are selected,before establishing seed orchards. The on-farm research experience in Kenya andZambia suggests that a more effective strategy is to establish seed orchards in thetechnology development process, so that sufficient seed is available for large-scaleadoption by the end of the trial period (Simons, 1996). This may result ultimatelyin the seed of large numbers of trees not being used. However, the cost is not highrelative to the benefits foregone from farmers’ having to wait many years untilgermplasm is available.
The argument for earlier seed orchards is validated by the economic analysis pre-sented in Table 8.1, which compares the strategy of earlier orchards with later ones,using data from calliandra trials and seed orchards in central Kenya. On-farm foddertree trials began in 1991 involving three species, but, by 1993, it was clear that onlycalliandra was appreciated by farmers. Seed orchards were established in 1994 andseed became available for on-farm distribution in 1996. The question analysed in theeconomic analysis is, ‘Would it have been better to start 1-ha seed orchards for eachof the three species at the beginning of the on-farm trial in 1991, so that calliandraseed would have been available 2 years earlier, even though two of the seed orchards
148 S.J. Scherr and S. Franzel
Trees on Farms Ch8 22/2/02 11:44 am Page 148

Promoting New Agroforestry Technologies 149
Tab
le 8
.1.
Net
pre
sent
val
ue o
f est
ablis
hing
ear
ly s
eed
orch
ards
, whe
n kn
owle
dge
of w
hich
spe
cies
to e
xten
d is
stil
l unc
erta
in, v
ersu
sw
aitin
g un
til tr
ials
are
com
plet
ed (
US
$).
(A)
Mod
el 1
: On-
farm
tria
ls b
egin
in y
ear
1 on
thre
e sp
ecie
s. O
ne-h
ecta
re o
rcha
rds
are
esta
blis
hed
in y
ear
3 fo
r th
e on
e sp
ecie
s th
atpe
rfor
ms
wel
l. A
dopt
ion
begi
ns in
yea
r 5.
Y1
Y2
Y3
Y4
Y5
Y6
Y7
Y8
Y9
Y10
Y11
Y12
Y13
Y14
Y15
Cos
tsS
eed
and
18in
ocul
ant
Land
prep
arat
ion
42N
urse
ry29
7P
lant
ing
85W
eedi
ng34
34H
arve
stin
g an
d0
678
678
678
678
678
678
678
678
678
678
678
678
post
-har
vest
Fen
cing
212
Gua
rdin
g10
210
2S
tand
17m
anag
emen
tLa
nd r
enta
l25
425
425
425
425
425
425
425
425
425
425
425
425
4To
tal c
osts
00
1,06
01,
068
932
932
932
932
932
932
932
932
932
932
932
Ben
efits
00
00
023
,316
93,2
6518
6,52
927
9,79
437
3,05
846
6,32
355
9,58
765
2,85
274
6,11
683
9,38
1N
et b
enefi
ts0
0−1
,060
−1,0
68−9
3222
,384
92,3
3218
5,59
727
8,86
137
2,12
646
5,39
055
8,65
565
1,91
974
5,18
483
8,44
8N
et p
rese
nt48
7,75
4va
lue
See
d ha
rves
t0
00
11.1
22.2
33.4
44.5
44.5
44.5
44.5
44.5
44.5
44.5
44.5
44.5
(kg
ha−1
)N
o. fa
rmer
s0
00
035
91,
076
1,43
51,
435
1,43
51,
435
1,43
51,
435
1,43
51,
435
1,43
5re
ceiv
ing
seed
No.
farm
ers
00
359
1,43
52,
870
4,30
55,
739
7,17
48,
609
10,0
4411
,479
12,9
14ea
rnin
g be
nefit
s
Trees on Farms Ch8 22/2/02 11:44 am Page 149

150 S.J. Scherr and S. Franzel
Tab
le 8
.1.
Con
tinue
d.
(B)
Mod
el 2
: On-
farm
tria
ls b
egin
in y
ear
1 on
thre
e sp
ecie
s. O
ne-h
ecta
re o
rcha
rds
are
esta
blis
hed
in y
ear
1 fo
r al
l thr
ee s
peci
es. O
nesp
ecie
s pe
rfor
ms
wel
l and
ado
ptio
n be
gins
in y
ear
3.
Y1
Y2
Y3
Y4
Y5
Y6
Y7
Y8
Y9
Y10
Y11
Y12
Y13
Y14
Y15
Cos
tsS
eed
and
inoc
ulan
t53
Land
pre
para
tion
127
Nur
sery
890
Pla
ntin
g25
4W
eedi
ng10
210
2H
arve
stin
g an
d0
678
678
678
678
678
678
678
678
678
678
678
678
678
678
post
-har
vest
Fen
cing
636
Gua
rdin
g20
320
3S
tand
51m
anag
emen
tLa
nd r
enta
l76
376
325
425
425
425
425
425
425
425
425
425
425
425
425
4To
tal c
osts
3,07
91,
746
932
932
932
932
932
932
932
932
932
932
932
932
932
Ben
efits
00
023
,316
93,2
6518
6,52
927
9,79
437
3,05
846
6,32
355
9,58
765
2,85
274
6,11
683
9,38
193
2,64
51,
025,
910
Net
ben
efits
−3,0
79−1
,746
−932
22,3
8492
,332
185,
597
278,
861
372,
126
465,
390
558,
655
651,
919
745,
184
838,
448
931,
713
1,02
4,97
7N
et p
rese
nt83
9,30
8va
lue
See
d ha
rves
t0
11.1
22.2
33.4
44.5
44.5
44.5
44.5
44.5
44.5
44.5
44.5
44.5
44.5
44.5
(kg
ha�
1 )N
o. fa
rmer
s 0
035
91,
076
1,43
51,
435
1,43
51,
435
1,43
51,
435
1,43
51,
435
1,43
51,
435
1,43
5re
ceiv
ing
seed
No.
farm
ers
00
035
91,
435
2,87
04,
305
5,73
97,
174
8,60
910
,044
11,4
7912
,914
14,3
4815
,783
earn
ing
bene
fits
Dat
a ar
e ba
sed
on e
xper
ienc
es d
evel
opin
g C
allia
ndra
cal
othy
rsus
seed
orc
hard
s an
d di
ssem
inat
ing
calli
andr
a in
the
Em
bu a
rea,
Ken
ya. 3
1 g
of s
eed
are
need
ed to
pla
nt 2
50tr
ees.
It is
ass
umed
that
an
adop
ting
farm
er p
lant
s 25
0 tr
ees,
whi
ch p
rovi
des
an in
crea
se in
ann
ual n
et in
com
e U
S$6
5, b
egin
ning
in th
e se
cond
yea
r (C
hapt
er 7
). T
he d
isco
unt
rate
use
d in
the
anal
ysis
is 2
0%.
Trees on Farms Ch8 22/2/02 11:44 am Page 150

Promoting New Agroforestry Technologies 151
would have been of no use?’. The analysis shows that the net present value of the strat-egy of early seed orchards was 72% higher than the strategy of waiting for the resultsof the on-farm trial before establishing seed orchards. In fact, early seed orchardswould be justified even if 20 1-ha seed orchards were established early in order to geta head start in disseminating, but only one of the species was ever disseminated. Theresults highlight the huge benefits associated with getting a head start on disseminat-ing new practices, as compared to the costs of establishing seed orchards.
We also propose that a range of different entities be involved in seed produc-tion; ICRAF and partners are currently helping research institutions, NGOs, pri-vate nurseries, farmer groups and individual farmers to establish seed orchards. Inwestern Kenya, ICRAF has supplied seed and information to several farmers plant-ing calliandra orchards and has agreed to purchase seed at an agreed price duringthe first 2 years of production, after which they will have to market seed on theirown (James Were, ICRAF, personal communication).
Maintaining genetic diversity is critical because, after planting some technolo-gies, such as trees for fodder, poles or firewood, farmers may not plant again foranother 20 years. Participants in fodder on-farm trials have been encouraged to har-vest seed from at least 30 trees, but this has been very difficult for them, as allowinga tree to seed means it will shade an area that might otherwise be used for crops.One option being pursued is to promote members of farmer groups to each estab-lish 5–10 different seed trees, which are used as sources by the whole group.
The active local seed propagation and distribution of calliandra by on-farmresearch participants in central Kenya suggests that a strategy of decentralized distri-bution to trained farmers in different geographic areas could induce broad diffu-sion. In the future, as adoption demand for seed increases, there is also potential forfarmer-managed seed orchards to develop commercial supply agreements with localagricultural supply stores and other rural retail outlets.
Agricultural Input Supply
The market distribution networks, price and price variability and regulations affect-ing agricultural input supply have significant impacts on the adoption and prof-itability of the agroforestry systems evaluated here. In some cases, agroforestryrepresents an option for farmers to bypass poorly functioning input marketsthrough direct substitution of agroforestry products or services. In other cases, theseare complementary to non-agroforestry inputs and depend for their effectiveness orprofitability on a stable supply of those inputs. Financial credit appears to be lessimportant for agroforestry in this region than commonly assumed.
Promote agroforestry for input substitution
In many African smallholder farming systems, working capital is a binding con-straint to expanding production (Ellis, 1988). Thus one of the most attractive fea-
Trees on Farms Ch8 22/2/02 11:44 am Page 151

tures of many agroforestry systems is the provision of products that substitute forcash inputs, for example, the substitution of improved fallows for mineral nitrogenfertilizer or of leaf fodder for dairy meal.
In the Zambian case study, farmers especially appreciated improved fallows asnitrogen fertilizer became unaffordable after the elimination of the parastatal distri-bution and credit systems in the late 1980s and early 1990s. These changes causedthe ratio between maize and fertilizer (urea) price to decline from 0.27 (1985–1988)to 0.13 (1989–1991) (FAO, 1998). There was a dramatic decline in maize area andin the use of improved inputs, especially fertilizer, the use of which declined by 70%between 1987/88 and 1995/96 (Howard et al., 1997). Farmers had seen the benefitsof using nitrogen fertilizer, but it was no longer affordable; they were thus excitedabout the possibility of using improved fallows to supply nitrogen.
In western Kenya, fertilizer is widely available, but is used by only about 20%of farmers and at low rates of application. The ratio between the maize and fertilizer(urea) price ranged between 0.18 and 0.26 between 1985 and 1995, but did not fol-low any noticeable trend (FAO, 1998). Available evidence suggests that farmers pre-fer to spend scarce working capital on other investments, such as off-farm businessesor education, rather than on fertilizer (Crowley et al., 1996). The recent high enthusi-asm for planting improved fallows suggests that farmers are more willing to useadditional labour, rather than working capital, to increase the fertility of their soils.
The on-farm research studies found that while improved fallows in Zambia didnot produce yields as high as those with fertilizer, yields were far higher than innon-fertilized fields, and returns to labour were actually highest with improved fal-lows. Sensitivity analysis shows that a decline in fertilizer prices (or increase inmaize prices) does greatly increase the profitability of fertilized, continuous maizerelative to improved fallows, although in drought years improved fallows offer amuch lower-risk alternative.
Calliandra tree fodder is highly attractive to farmers as a substitute for dairymeal on central Kenyan dairy farms, in part because of the poor performance of thedairy meal market. Meal prices fluctuate sharply, because maize, the nation’s mainfood staple, is the main ingredient. Also, farmers are often uncertain about thecomposition, and hence quality, of the meal (Chapter 7). Many farmers face cashconstraints which make purchase difficult, and many also face difficulties in trans-porting the meal to their farms. Financial sensitivity analysis suggests that the use ofcalliandra is not very sensitive to the price of dairy meal, and these other favourablefactors should lead to a robust demand for fodder bank technology. At this time,nearly two-thirds of the farmers using calliandra feed it together with dairy meal,but this is, in part, because of limited calliandra supplies. The share of calliandracan be expected to increase unless there is a very large decline in meal prices.
Ensure availability of complementary inputs
Agroforestry returns and adoption are not always more attractive where input mar-kets are poorly developed. Chemical fertilizer can, in some cases, be complementary
152 S.J. Scherr and S. Franzel
Trees on Farms Ch8 22/2/02 11:44 am Page 152

to soil nutrients provided by trees and shrubs, such that assured fertilizer access isimportant to the productivity of agroforestry systems. Agroforestry technologies canprovide nitrogen, but phosphorus is a limiting nutrient in many farming systems,and can only be replenished from off-farm sources (either rock phosphate or phos-phate fertilizers) (Sanchez et al., 1997). Phosphorus deficiency will become animportant issue in Zambia as the farming system intensifies. In western Kenya,improved fallows may not work at all in some of the areas with severe phosphorusdeficiency. In many areas, there appears to be a strong nitrogen × phosphorus inter-action. Thus current efforts to make phosphorus more available to farmers areessential to the long-term success of these agroforestry systems, and should be pro-moted vigorously (Sanchez et al., 1997).
Encourage self-financing of agroforestry
The provision of credit is commonly mentioned as an important policy issue foragroforestry and forestry, because of the presumed lag in time between initial invest-ment in tree establishment and maintenance and the beginning of significant bene-fit streams (Gregersen et al., 1992). The five case studies in this volume suggest thatlack of financial credit should not be a significant constraint to widespread adoptionamong smallholders in Africa. This is largely due to small farm size (and hence asmall scale of operation), farmers’ incrementalist approach to tree establishment,and their preference for strategies that reduce cash costs and reduce risks. Paybackperiods for fodder trees and improved fallows were 3 years or less, since farmerswere able to intercrop annual crops with trees, or harvest some tree products, suchas fuelwood or leaf fodder, during the first and second years.
Lack of credit is certainly a constraint to smallholder use of inputs such as fer-tilizer, where cash costs account for a high proportion of total costs of the practice.But for all of these agroforestry practices, direct cash costs for seed or seedling pur-chase actually account for a relatively small share of total costs, even in the year ofestablishment, as most farmers rely on family labour for establishment, mainte-nance and harvest, and can usually time these operations so that they do not con-flict significantly with other income-earning activities. Largeholder farmers are, bycontrast, likely to require financial credit to establish agroforestry on a broad scale.
Where credit might be available, there is no evidence that subsidized rateswould increase smallholder agroforestry adoption. Financial sensitivity analysisshows relatively low sensitivity of returns to the discount rate used in improved fal-lows in Zambia, Kenyan fodder banks, and hedgerow intercropping. In the case ofimproved fallows in western Kenya, using low estimates of the opportunity cost ofland and labour, discount rate sensitivity is low; however, the effects become quiteimportant if high opportunity costs are assumed. For lenders, short-term agro-forestry systems are likely to be more attractive than long-term systems. However,given the severe limitations on agricultural credit in these areas, it is likely thatfarmers would divert any available credit to higher priorities, such as off-farm busi-nesses or education (Crowley et al., 1996).
Promoting New Agroforestry Technologies 153
Trees on Farms Ch8 22/2/02 11:44 am Page 153

Direct subsidies to farmers, in the form of cash payments for tree planting andmaintenance might indeed accelerate adoption. In some cases, not evaluated in thesestudies, they may be justified on social policy grounds. Even so, the record for sustain-ability of agroforestry practices established through subsidies has not generally beensuccessful in Africa or most other developing countries (Scherr and Current, 1999).
Processing industries involved in outgrower schemes for higher-value crop andlivestock products may be encouraged to subsidize some of the cash costs of agro-forestry investments that contribute to higher crop or livestock yields or reduceinput costs. This would most likely be provided in kind rather than in cash. Forexample, in Tanzania, private tobacco companies are providing seedlings to farmersso that the farmers can produce fuelwood to cure their tobacco (Ruvuga et al.,1999). But in the case studies presented in this volume, where the end products aremaize, milk and construction wood, processing industries are not involved, or likelyto become involved, in subsidizing agroforestry investments.
Product Markets
In the past, agroforestry extension has often been ‘supply-driven’; that is, theemphasis has been on increasing production levels of trees and crops, with littleattention paid to trends in product demand or price. Recent studies and experiencesuggest that product market conditions and market institutions can play a criticalrole in farmer adoption and the economic contribution from agroforestry (Leakeyand Newton, 1994; Dewees and Scherr, 1996). For the agroforestry practices devel-oped and evaluated in these on-farm research trials, market conditions for bothtrees and associated agricultural products had important effects.
Promote marketing of farm-grown tree products
Having a marketable component contributed significantly to farm profits and to theincentive to expand agroforestry technologies. Farmers testing hedgerow intercrop-ping in western Kenya did not find soil erosion control benefits sufficiently com-pelling for enthusiastic adoption, given the lack of significant impacts on cropyields or economically important tree by-products. Fuelwood, although economi-cally unimportant in eastern Zambia, was an important by-product from improvedfallows in western Kenya and sensitivity analysis showed that the price of fuelwoodhad a strong effect there on system profits. While multipurpose trees in westernKenya were grown mainly for timber and poles, early subsidiary products, such asmulch, fuelwood or fodder, provided important benefits.
Further development of new marketing channels, quality standards, efficientmarketing practices and market information systems will be essential for improvingsmallholder participation and benefits from new tree product markets. Poorly devel-oped tree product markets are a significant limitation for large-scale agroforestryadoption. For example, for any new tree species, sawmillers must learn their uses,
154 S.J. Scherr and S. Franzel
Trees on Farms Ch8 22/2/02 11:44 am Page 154

milling characteristics, strength, etc., and must be able to sell their product to con-sumers who want to know what they are getting (Tyndall, 1996). The lack of qual-ity criteria or regulation means that risks of dealing in new woods are high.Sawmillers in central and western Kenya still rely for their supplies mostly on illegaltimber from the forest. They are not very familiar with grevillea, which is widelygrown by smallholders, and at the moment have few market connections withsmallholders (Tyndall, 1996). Casuarina, by contrast, is known by constructionpeople in most urban areas and does not face similar market problems.
Product market characteristics and function should be analysed not only topredict price and supply trends, but also to estimate the nature and scale of environ-mental effects from market development. For example, studies of farmers withimproved fallows in both Zambia and western Kenya, and multipurpose trees inwestern Kenya, suggest that fuelwood and other products produced from farm-grown trees may actually be substituting, at least on a small scale, for supplies fromnatural forests and woodlands. More careful market analysis is needed to determinethe scale of impact, especially in Zambia, and whether more active public interven-tion to promote agroforestry may be used as a forest protection policy.
Promote agroforestry to reduce risk in unstable crop and livestockproduct markets
Conditions in basic grains markets have clearly affected farmers’ strategies in adopt-ing agroforestry. In Zambia, the parastatal maize and cash crop marketing systems –with their stable outlets and price subsidies for maize producers – collapsed in theearly 1990s, and private markets have not developed sufficiently to replace them.Farmers in Eastern Province are concerned that the marketing system itself (as dis-tinct from aggregate demand) will not be able to absorb big increases in basic grainsproduction. Thus many farmers indicated that they prefer to use improved fallows toreduce the area under maize, allowing them to emphasize higher-value cash crop pro-duction on their other fields. Financial sensitivity analysis shows that a future increasein maize prices would increase returns to fertilized maize much more than returns toimproved fallows. The instability common to markets for higher-value products alsoaffects farmer agroforestry strategies. For example, the milk industry in Kenyabecame very unstable after the Kenya Cooperative Creameries lost its monopoly, inpart due to mismanagement, and new dairies emerged. Increased risk motivatedfarmers to substitute farm-produced calliandra for dairy meal to reduce cash costs.Financial returns to calliandra are not very sensitive to changes in the milk priceitself, especially when calliandra is used as a substitute for dairy meal rather than as asupplement. Over the long term, policy makers should seek to improve milk-marketstability and livestock health services, to strengthen the sector. This would encouragewidespread adoption of calliandra as farmers learn about its benefits, even in a lower-risk environment. Policy analysts need to address broader sectoral reform, such asmilk-market reform or credit provision for purchasing dairy animals, in addition tospecific changes that encourage adoption of a particular agroforestry practice.
Promoting New Agroforestry Technologies 155
Trees on Farms Ch8 22/2/02 11:44 am Page 155

Promote agroforestry for high-value crops
Using trees to increase the production of higher-value crops, rather than basicgrains, may greatly increase the income effects of agroforestry adoption. In westernKenya, researchers tested new agroforestry practices on maize, because maizeaccounted for most of the cultivated area and because increasing yields of the staplegrain was seen as the way to improve food security. But many farmers preferred totest the practices on higher-value crops because, if the agronomic response ofhigher-value crops were similar to that of maize for equal inputs, then profitabilitywould be higher. These farmers may have been motivated by food security as well,but their means to achieve it was to increase their cash income by growing morehigh-value crops, not by increasing maize production. For example, farmers in west-ern Kenya with good market access are improving soil fertility through the applica-tion of mulch from Tithonia diversifolia hedges on kale (Brassica oleracea) andtomatoes, rather than on maize plots (ICRAF, 1997). Policy makers, extensionistsand researchers should redirect more of their investment to promote agroforestrythat increases production and income from high-value crops.
Land and Forest Tenure and Regulatory Systems
Land and forest tenure and regulatory systems, including rules governing women’scontrol and management of tree resources, have been widely cited as constraints toagroforestry adoption (Bruce and Fortmann, 1989; Gregersen et al., 1992).However, Place (1995) examined tree planting in four countries of east and south-ern Africa and did not find tenure issues to be as constraining as supply-side issues,such as the availability of planting material or information. On-farm researchreported in this volume did not reveal tenure issues to be especially important forthe practices studied in Kenya and Zambia, which were generally established byfarmers on privately owned or controlled crop fields. Nor did regulatory issuesemerge as constraints in any of the case studies.
Few tenure limitations at all were observed for hedgerow intercropping,improved fallow or agroforestry tree planting in western Kenya. Only 3 of 50 farm-ers dropped out of hedgerow intercropping trials in western Kenya because of landtenure disputes. In central Kenya, farmers did not plant fodder trees on fields awayfrom the homestead. However, this was not due to tenure concerns, but to the diffi-culty in carrying fodder from the fields back to the homesteads where the cows arekept. Most farmers in this location do have at least one such far field.
Promote agroforestry equally to women and men
Traditional or legal rules on women’s control or management of land and treesappeared to have little effect on the adoptability of the agroforestry practices studiedhere. Only 2 of 14 women dropped out of hedgerow intercropping trials because of
156 S.J. Scherr and S. Franzel
Trees on Farms Ch8 22/2/02 11:44 am Page 156

disagreements with their spouses. Traditional taboos against tree planting by womenappear to have broken down, or are not applied to the planting of agroforestry species.
Women in western Kenya did not participate in the pruning of hedges inhedgerow intercropping, but this may have been a way to encourage greater labourcontributions by the men or a reflection of lower perceived benefits. There were fewproblems with women clearing trees in Zambia, as they have customarily beeninvolved in bush clearing. However, improved fallow plots of female farmers weresignificantly smaller than those of male farmers, probably because they had lessaccess to land and labour. In central Kenya, there are fewer female-headed house-holds than in Zambia and western Kenya, and in male-headed households, bothmen and women appeared to be involved in growing and harvesting calliandra forfodder. However, gender issues were not evaluated systematically.
Encourage community solutions to reduce free-grazing risks toagroforestry
In Zambia, the widespread practice of free grazing eliminated one species ofimproved fallow, and is a threat to others. Researchers are now seeking to introducespecies unpalatable to livestock. Free grazing also discourages intercropping ofunpalatable trees with crops because cows feeding on maize stalks trample the trees.
ICRAF and its partners have been active in organizing workshops of local pol-icy makers, including traditional chiefs, to address the free-grazing problem. Somelocal chiefs in Zambia are seeking to enforce controlled grazing, and some localadministrators in Uganda are establishing by-laws against tree destruction by free-grazing cattle. Researchers are monitoring these efforts to determine their successand potential application in other sites.
Technology Design for Extension
While the case studies of fodder trees in Kenya and improved fallows in Zambiaprovide some evidence of spontaneous diffusion of high-performing agroforestrypractices, all of these technologies are complex and farmers require information,training and assistance with planting materials, if they are to achieve productionand income potentials. Hence, extension must play a significant role in large-scaleimplementation. The case studies highlight several key elements for agroforestryextension, especially tailoring recommendations to farmer and regional socioeco-nomic conditions, the need to provide information on agroforestry management,and involving farmers strategically in technology selection and diffusion.
Tailor recommendations to farmer and regional conditions
The case studies clearly show the need for more systematic targeting of agroforestrypractices to the socioeconomic, as well as the biophysical, conditions of the pro-
Promoting New Agroforestry Technologies 157
Trees on Farms Ch8 22/2/02 11:44 am Page 157

gramme areas, and to the varying needs of individual farmers within those areas. Inparticular, the technical mix of land, labour and cash requirements affects their suit-ability for farmers with different resource endowments.
Expansion of hedgerow intercropping in western Kenya was associated withmanagement by males or couples, regular technical assistance, cash crops, goodhedge management and less depleted soils. The degree of expansion was notobserved, in this case, to be associated with wealth, off-farm income, farm size,crop sales, labour to land ratios, age or use of purchased inputs. Patterns of expan-sion for improved fallows were quite different in western Kenya and easternZambia. In the former, improved fallows were most attractive to farmers facinglabour scarcity or participating in off-farm employment and with serious fertilityproblems, while in the latter the major explanatory factors appeared to be soilwater-holding capacity, wealth and labour availability. By contrast, expansion ofcalliandra fodder banks in central Kenya was associated most with middle-aged,full-time, male farmers in the middle- to high-income range, who gave priority todairy production.
The opportunity cost for labour is a key factor operating at both regional andfarm scales. While hedgerow intercropping seems most suitable to areas and farmerswith low opportunity costs and less degraded soils, improved fallows are suited toareas of high opportunity costs and more depleted soils. In both technologies, theimportance of labour costs in farm profitability means that careful attention shouldbe paid in both research and extension to strategies for reducing labour costs (suchas direct seeding and relay cropping in improved fallows). In the case of fodderbanks, since farm profits are only minimally sensitive to labour costs, labour costsare a less important consideration.
The evidence of inter-farm diversity argues for a ‘basket of options’ approach,with extensionists well informed about technology performance under a range ofconditions. Greater species diversity is needed, to reduce risks and meet a widerrange of farmer needs and preferences as to niche, agroecological condition, use andmanagement.
Disseminate more information on agroforestry management
The case studies show how important it is for farmers to have good informationnot only about species selection and tree establishment – the principal foci ofmost extension programmes – but also on tree management. Different manage-ment practices are desirable for a given agroforestry technology under differentconditions, as illustrated by differences in optimal improved fallow managementin western Kenya and eastern Zambia, and for farmers with different farm sizeand commercial orientation. For example, intercropping trees with crops duringthe first year of establishment of improved fallows reduces tree and crop growth,but may be optimal for farmers with limited land and labour. Extensionistsshould be able to provide to farmers information relevant for this decisionprocess.
158 S.J. Scherr and S. Franzel
Trees on Farms Ch8 22/2/02 11:44 am Page 158

Strengthen farmers’ roles in technology selection and diffusion
The case studies illustrated that farmers can play a much more central role in extensionprogrammes, both in technology selection and design, and in the diffusion process.Farmer evaluation played a critical role, in several sites, in the selection and adaptationof technologies for subsequent promotion by extension services. The agroforestrystudy in western Kenya used a systematic approach to farmer evaluation – with farm-ers’ own on-farm trials as the evaluation focus – which has wide potential applicationin extension. Each farmer experimented on his or her own with the trees; farmersmonitored progress in group visits and researchers used participatory techniques, suchas an adaptation of the traditional bao game, to monitor farmer preferences. Using thistool, the popularity of certain species based on criteria unrelated to production, suchas the ornamental value of casuarina, was discovered. By evaluating farmers’ choices fornew plantings, a preference for external boundary niches was identified, which wouldnot have been predicted from existing patterns of farm tree location.
Farmers’ evaluation criteria for tree species and agroforestry practices may differfrom those of researchers or extensionists (Raintree, 1991; Franzel et al., 1996). Forexample, in the hedgerow intercropping trials in western Kenya, farmers evaluatedyield performance by comparing current with past yields, rather than control andtest plots. They compared hedgerow intercropping performance not with controlplots using no nutrient applications (as was common in researcher’s experimentsand extensionists’ demonstration plots), but rather with other nutrient managementstrategies known in the area. Such information can be valuable in designing exten-sion information and strategies for technology introduction.
There is considerable potential for improving agroforestry management by pro-moting active information exchange among farmer users. Over half of the farmersexperimenting with calliandra fodder in central Kenya had never even seen anotherfarmer growing the tree, which greatly limited their knowledge and the scope for gen-erating and sharing local innovations, as well as their economic returns. By contrast,the diffusion of improved fallows in Zambia and the community-wide assessmentprocesses in western Kenya expanded and institutionalized local knowledge about treemanagement. Specific mechanisms utilized in the case studies have promising appli-cation in extension networks, including farmer-to-farmer visits, group meetings toexchange information and evaluate new practices, identification of farmer experts andtheir integration into extension efforts, and village-based change processes.
Institutional Arrangements for On-farm Research andExtension
Agroforestry extension has been problematic in Africa because of the lack of rigor-ously validated and locally adapted extension messages, the general weakness andlimited resources of public extension systems, lack of agroforestry training for exten-sionists, and the unclear assignment of responsibility for agroforestry among agri-cultural and forestry extension institutions. Agroforestry research suffers from
Promoting New Agroforestry Technologies 159
Trees on Farms Ch8 22/2/02 11:44 am Page 159

similar institutional weaknesses, as well as a weak field presence (Kerkhof et al.,1990; Scherr, 1990b, 1995; Scherr and Müller, 1990), and poses particular chal-lenges for the implementation of on-farm research (Scherr, 1990b, 1991; Merrill-Sands, 1991; Shepherd and Roger, 1991). While enthusiasm for on-farm researchwithin the scientific community has increased steadily, it has been seen as an expen-sive instrument that cannot be replicated very widely. The evolution of large-scaleon-farm research efforts in Kenya and Zambia has generated insights and potentialmodels for the design of more robust, efficient, and farmer-responsive research andextension programmes which address these challenges.
Institutional evolution in the study sites
At all three sites – central Kenya, western Kenya and eastern Zambia – on-farmresearch in the early 1990s included both ‘researcher-led’ (type 1 and type 2) trialsand ‘farmer-led’ (type 3) trials, in which farmers experimented on their own withnew species and technologies. There was considerable exchange of informationbetween researchers and other organizations, such as extension services, develop-ment projects, NGOs and farmer groups. But there was initially little collaborationwith such organizations in the management of farmer surveys or on-farm trials.Farmers interacted with each other at group meetings and farmer-to-farmer visitsbut, in general, researchers interacted with farmers on an individual basis.Gradually, however, researchers at all three sites have strengthened working relation-ships with other institutions, especially farmer groups and extension services, pro-jects and non-governmental organizations involved in testing and disseminatingagroforestry practices. Different approaches evolved in the three sites.
Central Kenya
In Embu in 1993, extension staff became actively involved in the implementationof trials and monitoring surveys. The project began to facilitate broader adoption in1996–1997 when researchers and extension staff of three government serviceshelped 12 farmer groups, including 410 farmers, to start 14 calliandra nurseries.The farmers planted, on average, about 233 trees per farm. As a result of the highprofitability and suitability of the calliandra technology, there has been somefarmer-to-farmer diffusion of seeds and management information. None the less,the aggregate impact has been quite limited because of the geographic dispersion ofthe trials, shortages of seeds, and the small numbers of farmers initially involved.The recent emphasis on dissemination through farmer groups is designed to accel-erate diffusion of the technology.
Western Kenya
In western Kenya, the on-farm trials reported in this volume took place in the early1990s through women’s self-help groups. These groups helped select members to
160 S.J. Scherr and S. Franzel
Trees on Farms Ch8 22/2/02 11:44 am Page 160

participate in the trials and hosted meetings to discuss trials and provide feedback.No other organizations were involved in managing this first round of on-farm trials.Further on-farm research was started in 1996 on improved fallows and biomasstransfer. This second set of trials involved several other organizations, including theMinistry of Agriculture’s extension service, the Organic Matter ManagementNetwork and CARE International.1 A distinguishing feature of the programme wasa village-scale approach, in which members of entire villages jointly agreed to par-ticipate in selecting, testing and evaluating new technologies. The KARI-KEFRI-ICRAF team is the hub and coordinator of the research. In 1996, the team helpedfarmers establish 133 on-farm trials on the two technologies. Through involvementof the other organizations, especially the public extension service, they were able toexpand to 1642 farmers in 1997 and several thousand farmers in 1999.
Eastern Zambia
Since 1996, the Zambia-ICRAF project has helped facilitate the establishment of aninformal network of organizations to conduct adaptive research, training and facili-tate dissemination of improved fallows. The project and its collaborators helpedfarmers establish 194 improved fallow on-farm trials in 1994–1995; by 1998 therewere several thousand farmers using or experimenting with the technology. The on-farm research project included only one senior researcher and a technician. Theextension service was a full partner in the on-farm research, laying out most of theover 200 type 2 trials, supporting village nurseries and monitoring the trials.Managing on-farm trials was seen as a normal duty of extension and NGO staff.Development projects provided some incentives to extension staff, such as bicyclerepair allowances. Farmer groups managed nurseries, distributed seed and seedlings,and exchanged knowledge, training and experience on improved fallows. About 75representatives of the dozen or so organizations, including farmer groups, met oneto two times per year between 1996 and 2000 to plan for wider testing and exten-sion of the improved fallows, to review the problems and state of knowledge aboutthem, and to develop and update extension materials.
Promote integrated efforts of research and extension organizations
Experience in the three study sites demonstrates the potential benefits for farmeradoption of integrating research and extension activities. In Zambia and western
Promoting New Agroforestry Technologies 161
1 CARE’s Agroforestry Extension Program was originally designed in the mid-1980s tointegrate technology research and design with extension, in response to the lack ofagroforestry practices tested or adapted to local conditions (Buck, 1990). Researcher-controlled on-farm trials were established jointly with KEFRI and technology monitoring offarmer-designed trials (type 3) was instituted. As a result of staffing changes, high demandfor extension services, and an institutional mandate favouring extension (rather thanresearch), the on-farm technology design and testing component declined. None the less,CARE’s experience widely influenced thinking about agroforestry research and extensionlinkages (Scherr, 1990a).
Trees on Farms Ch8 22/2/02 11:44 am Page 161

Kenya, the enthusiastic interest of the many NGO and public extension pro-grammes, as well as spontaneous farmer-to-farmer diffusion of the improved fallowtechnology, led to the evolution of an integrated on-farm research approach thatresulted in rapid dissemination of new practices. The Zambia-ICRAF project coor-dinates the network for participatory monitoring and evaluation of on-farmresearch and acts as a catalytic and action-oriented group for widespread dissemina-tion of the technology in pilot areas. Furthermore, the Zambian network associa-tion provides a forum for identifying policy-related problems and opportunities andpromoting action to address them. For example, at a workshop of policy makersheld in 1996 several issues emerged, including the need to control free grazing, thatstimulated local policy action.
By contrast, in central Kenya, there was an almost complete absence of interna-tional and national NGOs involved in agricultural development, largely because thearea has a relatively high per capita income by Kenyan standards. The Ministry ofAgriculture has been active in on-farm research and extension, as have the many vil-lage-level farmer groups and community-based organizations. Research and exten-sion efforts have required more facilitation in central Kenya than in western Kenyaand Zambia, but have been just as effective.
Promote a village-based approach to on-farm research and extension
A second factor that distinguished the central Kenya experience was that the farm-ers involved in on-farm research in the early 1990s were geographically separatedand unrelated. They had no opportunity to generate the synergy or collective initia-tives that led to rapid farmer-to-farmer agroforestry learning and dissemination inthe other sites. The western Kenya and Zambia experiences demonstrate the bene-fits of using a village approach to on-farm research and extension. The village-widegroup ensured farmer-relevant trial design, attracted farmer collaborators, facilitatedfarmer evaluation of technologies, and encouraged rapid local dissemination of suc-cessful practices. In central Kenya, the new emphasis on working with farmergroups has led to greater farmer-to-farmer learning and increased opportunities forthe spontaneous spread of fodder-tree practices.
Informing the Policy-making Process
Effective policy analysis does not only include rigorous assessments and sound rec-ommendations; it also requires effective communication with policy makers. Anentire discipline, agricultural extension, exists for promoting communicationbetween researchers, development specialists and farmers. In contrast, little attentionis given to the area of communication between researchers and policy makers. Thisis indeed surprising, given researchers’ frequent difficulties in influencing policy.
Several critical lessons emerge from the case studies and from research else-where. First, policy makers need to be involved from the start in designing and
162 S.J. Scherr and S. Franzel
Trees on Farms Ch8 22/2/02 11:44 am Page 162

implementing policy research. Whereas farmer involvement in technology designand research is widely accepted, policy makers are often not consulted at thedesign stage. Workshops involving researchers and policy makers are an effectivemeans of improving consultation. At workshops in Tabora, Tanzania in 1997 and1998, policy makers discussed and chose among various policy problems and top-ics associated with agroforestry, food security and the environment. Proposedinterventions that required research included discouraging shifting cultivation,promoting herders to keep their livestock from harming crops, controlling andprotecting against burning, and assessing the causes of, and reducing, deforesta-tion (Ruvuga et al., 1999). Furthermore, policy makers provide crucial insightsabout their perception of problems and opportunities, and institutional mecha-nisms for policy implementation (Tomich et al., 1998). A key principle of market-ing is that the more consumers are consulted and involved in the design of aproduct, the more it is likely to be used. Certainly, the same principle applies topolicy research.
Further, policy research is most effective when it informs policy makers aboutthe implications of different options rather than simply advocating one policy overothers (Weber et al., 1988). In eastern Zambia, advocates of improved fallows oftenstate that livestock owners should be forced to prevent their cattle from destroyingimproved fallows, on the grounds of farmers’ rights to grow trees on their plots dur-ing the dry season. A more balanced and insightful approach to the problem wouldbe to bring together the various stakeholders, including cattle owners, assess theimplications of alternative policies, and inform policy makers about the implica-tions. In eastern Zambia, this would involve assessing the effects of allowing freegrazing, and thus limiting improved fallows, on maize yields and food security.Alternatively, how could improved fallows contribute to food security if free grazingwas curbed? And, finally, are there compromise arrangements where both livestockowners and improved fallow planters could reduce or share the burden of protec-tion, through, for example, a rotational grazing system?
Also, there is often considerable misunderstanding about who policy makersare. Policy makers are often characterized as high-level persons in the capital citywhen, in fact, local officials and traditional leaders in the countryside often wieldconsiderable power. Even if local officials and leaders do not make policies, they arethe ones responsible for implementing them, which is often at least as important! Infact, the influence of local leaders has increased in recent years as many govern-ments in eastern and southern Africa have decentralized authority and budgeting.ICRAF and its partners have also found that local leaders can play an importantrole as advocates of technology dissemination and in mobilizing communities totest new practices (Raussen et al., 2001).
Finally, the packaging of policy analyses is critical as policy makers, whetherlocal or national, lack the time to read lengthy academic reports. Policy communi-cations need to be brief, to the point, and targeted as specifically as possible to bod-ies responsible for making and implementing policy. Richards and Asare (1998)provide an example of an effective policy briefing note designed to assess incentivesfor Ghanaian farmers to keep timber trees in their cocoa plots.
Promoting New Agroforestry Technologies 163
Trees on Farms Ch8 22/2/02 11:44 am Page 163

Conclusions
The scale and pace of adoption of new agroforestry practices is likely to depend, toa greater extent than for new crop varieties, upon an improved policy environment.Table 8.2 summarizes some key policy recommendations for promoting the fouragroforestry practices, which were identified through on-farm research programmes.
Germplasm policy must focus more on reducing the cost of planting material,especially important for technologies such as hedgerow intercropping and improvedfallows. Large-scale seed supply and distribution networks are particularly impor-tant for improved fallows, and small-scale tree nursery promotion is needed forimproved fallows in Zambia and timber, pole and fodder trees in Kenya. Speciesdiversification is critical for all technologies. Subsidies and other direct incentivesare not needed.
Agroforesters working with improved fallows should follow closely the priceand availability trends for chemical fertilizers, and understand how these will affectfarmer adoption. More studies still need to be done on farmer nutrient manage-ment strategy under different price and risk regimes, and on the biophysical interac-tions of tree-derived nutrients and chemical fertilizers. A similar focus and studiesare needed for the dairy meal input market and farmer use. While formal and infor-mal financial credit markets will have indirect effects on farmers’ decisions to investin agroforestry, provision of production credit itself is unlikely to be a critical policyissue for smallholders.
For improved fallows and hedgerow intercropping, the main product marketsof importance are basic grains and high-value crops. More research is needed tounderstand the effectiveness of these technologies with crops other than basicgrains. In the case of fodder trees, the interactions of milk, dairy meal and maizemarkets need to be better understood, and linked with overall farmer decisionsabout feeding practices.
For the practices studied, there was little observed effect of tenure and regula-tory policy factors on agroforestry adoption or farm profitability. Damage to treesfrom free-grazing animals can probably be addressed through choice of suitabletree species and planting sites, although exploratory work on changing commu-nity-level norms and regulations is worth pursuing. Women’s participation in test-ing and using practices appears to be as high as men’s, but further monitoring isneeded and new mechanisms to enhance women’s participation should beexplored.
The general lessons about extension strategy can be applied to all of the tech-nologies studied. The on-farm trials already implemented can guide the targeting offarmers and design of extension messages, but probably need to be supplementedwith additional on-farm studies in other environments. More research is needed onthe functioning of farmer information networks and community group learningand diffusion mechanisms, as these are relevant for agroforestry practices. Suchinformation, at subregion or local levels, should be used to guide decisions aboutthe balance of extension communication effort among individuals, groups andacross communities.
164 S.J. Scherr and S. Franzel
Trees on Farms Ch8 22/2/02 11:44 am Page 164

Promoting New Agroforestry Technologies 165
Tab
le 8
.2.
Pol
icy
reco
mm
enda
tions
to p
rom
ote
adop
tion
of s
peci
fic a
grof
ores
try
prac
tices
.
Agr
icul
tura
lTe
nure
sys
tem
sA
grof
ores
try
prac
tice
Ger
mpl
asm
pol
icy
inpu
t sup
ply
Pro
duct
mar
kets
and
regu
latio
nE
xten
sion
str
ateg
ies
Hed
gero
w in
ter-
Red
uce
cost
/impr
ove
acce
ssN
one
Iden
tify
mar
ket d
eman
dN
one
Targ
et la
bour
-abu
ndan
tcr
oppi
ng (
wes
tern
to p
lant
ing
mat
eria
ls; i
ncre
ase
for
by-p
rodu
cts,
esp
ecia
llyfa
rms,
slo
ping
, ero
sive
Ken
ya)
spec
ies
dive
rsifi
catio
nfo
dder
and
fuel
woo
dla
nd, b
ette
r so
ilsIm
prov
ed fa
llow
sE
xpan
d se
ed s
uppl
y;P
rom
ote
whe
reP
rom
ote
dem
and
for
Non
eTa
rget
farm
ers
with
(wes
tern
Ken
ya)
redu
ce c
ost/i
mpr
ove
nitr
ogen
fert
ilize
rhi
gh-v
alue
cro
ps;
depl
eted
soi
ls, w
ith o
ff-ac
cess
to p
lant
ing
is c
ostly
or
asse
ss fu
elw
ood
farm
inco
me,
or
thos
em
ater
ials
; inc
reas
eun
avai
labl
e;m
arke
tsw
ho c
anno
t affo
rdsp
ecie
s di
vers
ifica
tion
incr
ease
sup
ply
min
eral
fert
ilize
rsof
pho
spho
rus
Impr
oved
fallo
ws
Exp
and
seed
sup
ply
and
Pro
mot
e w
here
Str
engt
hen
basi
cE
ncou
rage
Sup
port
diff
usio
n ne
t-(e
aste
rn Z
ambi
a)re
duce
cos
ts; p
rom
ote
nitr
ogen
fert
ilize
rgr
ain
mar
ketin
gco
mm
unity
wor
ks. T
arge
t far
mer
ssm
all-s
cale
tree
is c
ostly
and
syst
emno
rms/
regu
latio
nsw
ith d
eple
ted
soils
and
nurs
erie
s; in
crea
seun
avai
labl
eto
con
trol
free
thos
e w
ho c
anno
t affo
rdsp
ecie
s di
vers
ifica
tion
graz
ing
min
eral
fert
ilize
rsM
ultip
urpo
se tr
ees
Pro
mot
e sm
all-s
cale
Non
eP
rovi
de s
peci
esN
one
Targ
et b
ound
ary
(wes
tern
Ken
ya)
tree
nur
serie
s; in
crea
sein
form
atio
n fo
rni
che;
pro
mot
e us
ese
ed s
uppl
y fo
r ne
wpr
oces
sors
and
of fa
rmer
crit
eria
for
spec
ies;
incr
ease
cons
umer
s; li
nkse
lect
ing
spec
ies
spec
ies
dive
rsifi
catio
nsm
allh
olde
rs to
mar
kets
Fod
der
tree
sE
xpan
d se
ed s
uppl
y;P
rom
ote
whe
reS
tabi
lize
milk
Non
eS
uppo
rt d
iffus
ion
(cen
tral
Ken
ya)
supp
ort s
mal
l-sca
leda
iry m
eal i
sm
arke
ts; s
tren
gthe
nne
twor
ks a
nd n
urse
rytr
ee n
urse
ries
and
cost
ly, l
ow q
ualit
yliv
esto
ck h
ealth
grou
ps; p
rovi
de m
an-
grou
p se
ed-s
harin
gor
una
vaila
ble
serv
ices
agem
ent a
ssis
tanc
e
Trees on Farms Ch8 22/2/02 11:44 am Page 165

166 S.J. Scherr and S. Franzel
Bruce, J. and Fortmann, L. (1989) Agroforestrytenure and incentives. Paper No. 135. LandTenure Center, University of Wisconsin,Madison, Wisconsin.
Buck, L. (1990) Planning agroforestry extensionprojects, the CARE International Approachin Kenya. In: Budd, W.W., Ducchart, I.,Hardesty, L.H. and Steinder, F. (eds)Planning for Agroforestry. Elsevier SciencePublishers B.V., Amsterdam, pp. 101–131.
Crowley, E.L., Soule, M.J. and Carter, S.E.(1996) Off-farm Income and Farming inWestern Kenya. Tropical Soil Biology andFertility Program/International Centre forResearch in Agroforestry, Nairobi, Kenya.
Dewees, P.A. and Scherr, S.J. (1996) Policies andMarkets for Non-timber Tree Products.Environment and Production TechnologyDivision Discussion Paper No. 16.International Food Policy ResearchInstitute, Washington, DC.
Ellis, F. (1988) Peasant Economics. CambridgeUniversity Press, Cambridge.
FAO (1998) FAOSTAT statistics database.http://faostat.fao.org/default.htm
Franzel, S., Jaenicke, H. and Janssen, W. (1996)Choosing the Right Trees: Setting Priorities forMultipurpose Tree Improvement. ISNARResearch Report No. 10. ISNAR, TheHague.
Gregersen, H., Oram, P. and Spears, J. (1992)
Priorities for Forestry and Agroforestry PolicyResearch: Report of an InternationalWorkshop, 9–12 July 1991, IFPRI,Washington, DC.
Howard, J.A., Rubey, L. and Crawford, E.W.(1997) Getting technology and the technol-ogy environment right: Lessons from maizedevelopment in southern Africa.International Association of AgriculturalEconomists Conference, 10–16 August 1997,Sacramento, USA.
ICRAF (1997) Annual Report 1996. ICRAF,Nairobi.
ILRI (2000) CGIAR Systemwide LivestockProgramme: Biennial Report 1999–2000.ILRI, Nairobi, Kenya
Kerkhof, P., Foley, G. and Barnard, G. (1990)Agroforestry in Africa: A Survey of ProjectExperience. Panos, London.
Leakey, R.B. and Newton, A.D. (1994)Domestication of Tropical Trees for Timberand Non-timber Products. MAP Digest 17.UNESCO, Paris.
Merrill-Sands, D.M., Biggs, S.D., Bingen, R.J.,Ewell, P.T., McAllister, J.L. and Poats, S.V.(1991) Institutional considerations instrengthening on-farm client-orientedresearch in national agricultural researchsystems: lessons from a nine-country study.Experimental Agriculture 27(4), 343–375.
Oram, P. (ed.) (1993) Priorities for forestry and
The most suitable institutional arrangements to foster useful interactionbetween agroforestry research and extension will vary, depending upon the densityand type of existing extension and farmers’ organizations and the commitment tofield-based operations by research organizations. That adaptive research and exten-sion represent points along a continuum, rather than distinct activities, suggeststhat integrating research and extension efforts should receive high priority. Theprinciple of linking research and extension efforts by working together in specificsites around core on-farm research activities, rather than through centralizedbureaucratic mechanisms, is strongly endorsed.
Acknowledgements
We are grateful for the advice and input from Frank Place of ICRAF, and commentsfrom an anonymous IFPRI reviewer.
References
Trees on Farms Ch8 22/2/02 11:44 am Page 166

Promoting New Agroforestry Technologies 167
agroforestry policy research in sub-saharanAfrica. Summary of a regional workshop co-sponsored by ICRAF, IFPRI and CIFOR,30 November–4 December 1992, Nairobi,Kenya.
Place, F. (1995) The role of land and tree tenureon the adoption of agroforestry technologiesin Zambia, Burundi, Uganda, and Malawi:a summary and synthesis. Land TenureCenter, University of Wisconsin, Madison,Wisconsin.
Place, F. and Dewees, P. (1999) Policies, incen-tives, and the adoption of improved fallows.Agroforestry Systems 47, 323–343.
Place, F. and Kindt, R. (1997) The complexities ofsupply of tree germplasm: the need for pol-icy interventions. In: ICRAF, InternationalWorkshop on Policy Aspects of TreeGermplasm Demand and Supply.Unpublished proceedings of a workshoporganized at ICRAF, Nairobi, Kenya, 6–8October 1997. ICRAF, Nairobi.
Raintree, J.B. (1991) Socioeconomic Attributes ofTrees and Tree Planting Practices. FAO,Rome.
Raussen, T., Ebong, G. and Musiime, J. (2001)More effective natural resources managementthrough democratically elected, decentralizedgovernment structures in Uganda.Development in Practice (11)4, pp. 460–470.
Richards, M. and Asare, A. (1998) Incentives forGhanaian cocoa farmers to keep timbertrees. Policy Briefing Note. ForestryResearch Project–UK Department for Inter-national Development–Overseas Develop-ment Institute, London.
Ruvuga, S.A., Otsyina, R., Kusekwa, M., Gama,B., Nyadzi, G.I. and Msangi, R.B. (1999)Agroforestry and Environment, Proceedings ofthe Second Workshop on Sensitisation andParticipatory Planning on Agroforestry andthe Environment for Policy Makers andother Partners in Tabora Region, 3–4 May1999, Tumbi, Tanzania. ICRAF, Shinyanga,Tanzania.
Sanchez, P.A., Shepherd, K.D., Soule, M.J.,Place, F.M., Buresh, R.J., Izac, A.N., UzoMokwunye, A., Kwesiga, F.R., Nderitu,C.G. and Woomer, P.L. (1997) Soil fertilityreplenishment in Africa: an investment innatural resource capital. In: Buresh, R.J.,Sanchez, P.A. and Calhoun, F.G. (eds)Replenishing Soil Fertility in Africa. SSSA
Special Publication Number 51. SoilScience Society of America and AmericanSociety of Agronomy, Madison, Wisconsin,pp. 1–46.
Scherr, S.J. (1990a) The diagnosis and designapproach to agroforestry project planningand implementation: examples from westernKenya. In: Budd, W.W., Duchhart, I.,Hardesty, L.H. and Steiner, F. (eds)Planning for Agroforestry. Elsevier,Amsterdam, pp. 132–160.
Scherr, S.J. (1990b) Evaluating institutionalcapacity for agroforestry research. In:Echeverria, R.G. (ed.) Methods forDiagnosing Research System Constraints andAssessing the Impact of Agricultural Research.Vol. I. Diagnosing Agricultural ResearchSystem Constraints. International Service toNational Agricultural Research, The Hague,pp. 179–208.
Scherr, S.J. (1991) On-farm research: the chal-lenges of agroforestry. Agroforestry Systems15(2–3), 95–110.
Scherr, S.J. (1995) Economic factors in farmeradoption of agroforestry: patterns observedin western Kenya. World Development 23(5),787–804.
Scherr, S.J. and Current, D. (1999) Incentives foragroforestry development: experience inCentral America and the Caribbean. In:Sanders, D.W., Huszar, P.C., Sombatpanit,S. and Enters, T. (eds) Incentives in SoilConservation: From Theory to Practice.Science Publishers, Enfield, NewHampshire, pp. 345–366.
Scherr, S.J. and Müller, E. (1990) Evaluatingagroforestry interventions in extension pro-jects. Agroforestry Systems 11(1), 23–44.
Shepherd, K.D. and Roger, J.H. (1991)Approaches to On-farm Testing andEvaluation of Agroforestry Technology.Working paper No. 67. ICRAF, Nairobi.
Simons, A.J. (1996) Seed orchards and breeding.In: Gliricidia sepium. Genetic Resources forFarmers. Tropical Forestry Paper No. 33.Oxford Forestry Institute, Oxford, UK.
Spears, J., Oram, P., Byron, N., Scherr, S. andIzac, A.M. (1994) A review of tropicalforestry and agroforestry problem areas andpolicy research needs and the plannedresponse of the CGIAR system. CIFORWorking Paper No. 5, CIFOR, Bogor,Indonesia.
Trees on Farms Ch8 22/2/02 11:44 am Page 167

Tomich, T.P., Thomas, D.E., Kusumanto, Y. andvan Noordwijk, M. (1998) Policy researchfor sustainable upland systems in southeastAsia. ICRAF Southeast Asian RegionalResearch Program, Bogor, Indonesia.
Tyndall, B. (1996) The Socioeconomics ofGrevillea robusta Within the Coffee Land-use System of Kenya. AFRENA Research
Paper No. 109. Agroforestry ResearchNetwork for Africa. ICRAF, Nairobi.
Weber, M.T., Staatz, J., Holtzman, J., Crawford,E. and Bernsten, R. (1988) Informing foodsecurity decisions in Africa: empiricalanalysis and policy dialogue. AmericanJournal of Agricultural Economics 705,1044–1052.
168 S.J. Scherr and S. Franzel
Trees on Farms Ch8 22/2/02 11:44 am Page 168

Land degradation, low soil fertility and lack of quality livestock feed are increasinglyrecognized as key problems for farmers throughout sub-Saharan Africa. Theresearch reported in this volume documents the experiences of farmers in testingand assessing the potential of agroforestry practices to address these problems andincrease their incomes. The volume presents five case studies from three contrastingzones: a humid, highland area in central Kenya located close to major markets; ahumid, highland area in western Kenya with poorer soils and further from markets;and a subhumid plateau area in eastern Zambia with degraded soils, lower popula-tion density, and far from major markets. Maize, the main food staple in easternand southern Africa, is the most important crop component of all of the agro-forestry practices examined in the case studies.
Three case studies assess soil fertility interventions, including improved tree fal-lows and hedgerow intercropping (Table 9.1). In eastern Zambia, the number offarmers using improved, 2-year tree fallows rose from 20 in 1993 to about 10,000in 2000. Main trees planted were Sesbania sesban, which requires a nursery, andTephrosia vogelii, which may be direct seeded. In western Kenya, farmer-managedexperiments in the early 1990s helped researchers identify a range of brief, one-sea-son fallow species, which, by 1999, were being planted by several thousand farmers.The most popular species were Crotalaria grahamiana, Crotalaria ochroleuca, andtephrosia, all of which were direct seeded. Hedgerow intercropping in westernKenya, while not contributing significantly to improving soil fertility and cropyields in the short run (1–4 years), was shown to be an important means of reduc-ing soil erosion, and can thus improve fertility and yields in the long run. The mainspecies included Calliandra calothyrsus and Leucaena leucocephala. One case study,also from western Kenya, assesses the introduction of trees for wood production,
Assessing Adoption Potential: Lessons Learned and
Future Directions S. FRANZEL1 AND S.J. SCHERR2
1International Centre for Research in Agroforestry, PO Box 30677, Gigiri, Nairobi, Kenya; 2Agricultural and Resource Economics
Department, University of Maryland, College Park, MD 20742, USA
© CAB International 2002. Trees on the Farm (eds S. Franzel and S.J. Scherr) 169
9
Trees on Farms Ch9 16/2/02 11:52 am Page 169

170 S. Franzel and S.J. ScherrTa
ble
9.1
.R
ecom
men
datio
n do
mai
ns: c
ondi
tions
mos
t sui
ted
to s
elec
ted
agro
fore
stry
pra
ctic
es.
Oth
erco
untr
ies
Oth
erM
ain
Pay
back
whe
refa
ctor
sP
ract
ices
and
prob
lem
Agr
icul
tura
lLa
ndLa
bour
Cas
hpe
riodb
prac
tice
isaf
fect
ing
area
addr
esse
dE
core
gion
Soi
lsin
tens
itya
requ
irem
ents
requ
irem
ents
requ
irem
ents
(yea
rs)
bein
g us
edad
optio
n
Impr
oved
fallo
ws,
Nitr
ogen
Sub
hum
idS
esba
nia
Sui
ted
for
Rel
ativ
ely
Hig
h, p
lant
ing
Non
e –
3C
amer
oon,
east
ern
Zam
bia
defic
ienc
yar
eas,
poor
ly s
uite
dm
ediu
m z
one
high
is a
t pea
km
inim
alU
gand
a,(S
esba
nia
sesb
anin
soi
lun
imod
alto
san
dy,
perio
d. L
ess
ofTa
nzan
ia,
and
Teph
rosi
ara
infa
llsh
allo
w s
oils
a pr
oble
m if
Mal
awi,
voge
lii)
tree
s ar
e di
rect
Zim
babw
ese
eded
Impr
oved
fallo
ws,
Nitr
ogen
Sub
hum
idS
uite
d fo
rM
ediu
mM
ediu
m, o
nly
Non
e –
2U
gand
aw
este
rn K
enya
defic
ienc
yar
eas,
med
ium
zon
e,tr
ees
that
are
min
imal
(Cro
tala
riasp
p.in
soi
lbi
mod
also
me
dire
ct s
eede
dan
d Te
phro
sia
rain
fall
pote
ntia
l for
are
suita
ble
voge
lii)
high
zon
eH
edge
row
inte
r-S
oil e
rosi
onH
umid
,S
uite
d to
Sui
ted
for
Min
imal
Hig
h, p
lant
ing
Low
3+T
hrou
ghou
tF
emal
escr
oppi
ng, w
este
rnsu
bhum
ider
osiv
e,hi
gh z
one,
and
prun
ing
sub-
may
hav
eK
enya
(Le
ucae
naar
eas.
Up
slop
ing
som
ear
e at
pea
kS
ahar
anpr
oble
ms
leuc
ocep
hala
and
to 1
900
mar
eas
pote
ntia
l in
perio
ds. D
elay
sA
fric
apr
unin
gC
allia
ndra
in a
ltitu
dem
ediu
m z
one
in p
runi
ng m
aytr
ees
calo
thyr
sus)
in K
enya
redu
ce c
rop
yiel
dsB
ound
ary
plan
ting
Fue
lwoo
dG
revi
llea:
Sui
ted
for
Min
imal
Low
, pla
ntin
g is
Low
, onl
y fo
r5+
Uga
nda,
of u
pper
-sto
rey
shor
tage
,hu
mid
and
high
and
at p
eak
perio
dse
edlin
gsR
wan
datr
ees,
wes
tern
pole
s an
dsu
bhum
idm
ediu
m z
ones
but p
robl
em n
otK
enya
(G
revi
llea
timbe
r fo
rhi
ghla
nds.
whe
re fa
rmer
sse
rious
as
few
robu
sta
and
cons
truc
tion
Cas
uarin
a:la
ck a
cces
s to
tree
s ar
eC
asua
rina
and
cash
hum
id,
tree
s of
f the
plan
ted
jung
huhn
iana
)su
bhum
id a
ndfa
rmse
mia
ridar
eas
Trees on Farms Ch9 16/2/02 11:52 am Page 170

Assessing Adoption Potential 171
Fod
der
tree
s,F
odde
rH
umid
,S
usce
ptib
leS
uite
d fo
rM
inim
al,
Low
, pla
ntin
gN
one
–2
Uga
nda,
Sui
ted
for
cent
ral K
enya
shor
tage
s in
subh
umid
to fr
ost,
high
zon
e,es
peci
ally
is d
urin
g pe
akm
inim
alR
wan
da,
cut a
nd(C
allia
ndra
dairy
area
s. U
p to
wat
erlo
ggin
gso
me
whe
n pl
ante
dpe
riod
but
Bur
undi
,ca
rry
dairy
calo
thyr
sus)
ente
rpris
es19
00 m
inpo
tent
ial f
oron
bou
ndar
yre
lativ
ely
few
Tanz
ania
,sy
stem
s.al
titud
e in
med
ium
tree
s ar
eZ
imba
bwe
May
hav
eK
enya
plan
ted
pote
ntia
l in
othe
r, m
ore
exte
nsiv
eda
irysy
stem
s
a Low
: far
mer
s us
e na
tura
l fal
low
s to
res
tore
fert
ility
. Med
ium
: mos
t far
mer
s fa
llow
but
fallo
w p
erio
ds n
ot s
uffic
ient
to r
esto
re fe
rtili
ty. H
igh:
con
tin-
uous
cul
tivat
ion
is c
omm
on, m
ost f
allo
ws
are
brie
f, th
at is
, one
or
two
seas
ons.
b The
pay
back
per
iod
is th
e tim
e re
quire
d fo
r re
venu
e ea
rned
to c
over
the
cost
of t
he in
vest
men
t.
Trees on Farms Ch9 16/2/02 11:52 am Page 171

such as Grevillea robusta and Casuarina junghuhniana, planted along boundariesand in other arrangements. The last case study reports on the uptake of calliandra inthe mid-1990s, which farmers planted to provide fodder for increased milk produc-tion in central Kenya. By 2000, about 4000 smallholder dairy farmers had plantedcalliandra and numbers expanded rapidly over the next 3 years.
This chapter reviews the adoption potential of the practices within and outsidethe areas they were tested and assesses policy support needed to promote their adop-tion. Next, we summarize lessons learned for improving the effectiveness and effi-ciency of developing and disseminating new practices, focusing on thecomplementarity of different types of on-farm trials, the promotion of farmer par-ticipation, adaptation and innovation, and on creating adaptive research and dis-semination networks. Finally, suggestions are made concerning areas for futureresearch.
Adoption Potential of Promising Agroforestry Practices
Benefits to farmers
Agroforestry practices, as shown in this volume, can increase farmers’ incomes andmake important contributions to solving some of their most important problems.For example, farmers in Zambia planting improved fallows can increase theirannual net farm income from maize, their most important enterprise, by US$130(more than twofold). In central Kenya, calliandra substituted for purchased dairymeal increases household income by US$220 per household, an increase of about10%. Moreover, both technologies have important by-products and services that aredifficult to quantify and value – improved fallows provide firewood and improvethe soil’s structure and organic matter content and calliandra improves milk quality,provides firewood and helps conserve the soil.
The other two practices examined in this volume, hedgerow intercropping andupper-storey trees, offer more modest, but still important, benefits. While the con-tributions of hedgerow intercropping to soil fertility are minimal in the short term,this practice is effective in curbing soil erosion and providing useful by-products,such as fodder and fuelwood. Grevillea trees planted along boundaries in westernKenya provide fuelwood and timber, and earn net benefits as high as the maize theydisplace. In addition, the trees have other difficult-to-quantify benefits as wind-breaks, boundary markers and in controlling erosion.
The studies also demonstrate that farmers value agroforestry practices for three‘hidden’ reasons aside from the products and services they provide. First, agro-forestry reduces the considerable risks that farmers face from input markets by pro-viding home-produced substitutes for purchased inputs such as mineral fertilizer ordairy concentrates. For example, farmers in central Kenya complain that concen-trates are, at times, not available, are difficult to transport because of poor road net-works, and are of unreliable quality. With home-produced calliandra, none of theseproblems arise.
172 S. Franzel and S.J. Scherr
Trees on Farms Ch9 16/2/02 11:52 am Page 172

Secondly, agroforestry practices help reduce risk from uncertain rainfall. Forexample, in Zambia the benefits of improved fallows are spread over a 2–3-yearperiod, whereas nitrogen fertilizer provides benefits for only a single year. A farmerexperiencing a crop failure would lose her cash investment in fertilizer, US$154 ha−1, whereas a farmer planting an improved fallow would lose only her investmentin planting the trees, which amounts to one-quarter of the fertilizer cost. In addi-tion, tree fallows improve the soil’s structure and organic matter content, thusenhancing its ability to retain moisture during drought years.
Finally, farmers in the case studies expressed a strong preference for investingtheir labour, through agroforestry practices, rather than their cash, which in mostcases is scarce or unavailable for investment. Farmers in Zambia emphasized thatthe profitability of mineral fertilizer is irrelevant to them – they simply do not havethe cash to purchase it. In western Kenya, farmers prefer to plant trees on theirfarms for fuel and construction wood rather than purchasing wood from outside.Even in central Kenya, where incomes are higher and cash more available, farmersgreatly appreciate the cash that they can save by feeding calliandra as a high-proteinsupplement to their cows instead of purchasing dairy meal.
Suitability of practices outside areas where they were tested
The case studies indicate the usefulness of agroforestry practices in the sites inwhich they were tested. But how likely are they to be of use to farmers in otherareas? As discussed in Chapter 2, the boundary conditions of a technology aredefined by identifying the variables that are most important in determining whowill and will not use the practice. Information on variables affecting biophysicalperformance, profitability and acceptability are thus critical.
Improved tree fallows
Improved tree fallows have greatest potential in areas where farmers have ‘someexperience with the struggle to maintain soil fertility’ but still have lands that theyleave fallow (Raintree and Warner, 1986). Eastern Zambia and large portions ofZambia, Zimbabwe, Tanzania and central Malawi fit this picture. But the researchpresented on improved fallows in western Kenya shows that the technology haspotential in certain densely populated areas as well; that is, where rainfall isbimodal, permitting farmers to fallow for one season per year. The technology isthus of relevance to farmers throughout the highlands of Ethiopia, Kenya, Tanzaniaand Uganda, where most of the people of these countries live.
Type 1 trials (on-farm trials designed and managed by researchers) in fourcountries of southern Africa showed that sesbania-improved fallows performedwell across a range of environments, but not on sandy soils (because of nematodeattacks), on shallow soils (because of mortality during the dry season), or in frost-prone areas. Tephrosia appears to be more widely adapted than sesbania. Cajanuscajan is of limited use because it is susceptible to browsing by livestock, which
Assessing Adoption Potential 173
Trees on Farms Ch9 16/2/02 11:52 am Page 173

range freely during the dry season in most of southern Africa. By 2000, improvedtree fallows were being planted by roughly 25,000 farmers in four countries insouthern Africa, two countries in eastern Africa, and Cameroon. Each of theseplantings involved ICRAF and its partners; in addition, improved fallows werereported to be planted by farmers in North West Province, Cameroon, withoutICRAF involvement.
Hedgerow intercropping
Widely promoted for improving soil fertility, hedgerow intercropping has not beenfound to increase crop yields under farmers’ conditions in eastern and southernAfrica. But it still has an important role to play in curbing soil erosion and provid-ing important by-products, such as fuelwood and fodder. It is suited to farmers onsloping, erosive land where population densities are fairly high and labour is avail-able for planting and pruning the hedges. Hedgerow intercropping is only suitablein humid and subhumid areas, because in drier areas trees and crops compete foravailable moisture.
Upper-storey trees for wood production
Often planted on boundaries, these are appropriate for farmers in a range of cir-cumstances. As forests and other off-farm sources of wood become scarce, farmersin many areas of eastern and southern Africa have started planting trees on theirown farms, because the cost of growing trees is less than the cost of collecting wood.But there is often a lag in this transition, primarily because farmers lack informationor planting material. Research and extension programmes throughout eastern andsouthern Africa are helping farmers to plant upper-storey trees that meet their needsand circumstances – that is, those that are compatible with crops and that providehigh-quality wood for fuel and construction. Eucalyptus spp. and grevillea are prob-ably the two most commonly planted species for wood production, the former inwoodlots and the latter along boundaries.
Calliandra as a fodder tree
This is suitable for smallholder dairy farmers throughout eastern and southernAfrica. In Kenya, there are about 625,000 smallholder dairy farmers – withimproved breed or cross-bred dairy animals fed in zero- or minimum-grazing sys-tems. Smallholder dairy farmers are less numerous in other countries of eastern andsouthern Africa but are found around virtually every city and large town in theregion. By 1998, calliandra was being used by several thousand farmers aroundseven cities of Kenya, Uganda, Zimbabwe and Tanzania, each with support fromICRAF and partner institutions. Fodder trees are probably profitable only when fedto improved or cross-bred dairy animals, as indigenous-breed animals convert onlysmall percentages of additional feed to increased milk production.
174 S. Franzel and S.J. Scherr
Trees on Farms Ch9 16/2/02 11:52 am Page 174

Wealth level and gender
Many policy makers are particularly interested in whether poor and female farmerscan adopt income-increasing technologies such as agroforestry practices. Wealthlevel can influence adoption in several ways. Poor farmers may be more risk averse,have less access to information, have a higher discount rate and thus a shorter-termplanning horizon, and have less capacity to mobilize resources (Hoekstra, 1985;CIMMYT, 1993). In fact, most adoption studies find strong correlations betweenwealth and adoption. Results from Zambia confirm that the higher the wealth sta-tus, the greater the use of improved fallows. But, on the other hand, about 20% ofthe poor and very poor households in four sample villages planted improved fallowsduring the first 4 years of testing, which suggests that there are no absolute barrierspreventing low-income farmers from doing this. Moreover, low-income farmers aremore likely to adopt improved fallows than mineral fertilizers because the fallowsrequire no cash input.
Female farmers provide most of the labour for African food production(Quisumbing et al., 1995) and the percentage of households that are female-headedranges from 18% in central Kenya, to about 30% in Zambia and 50% in westernKenya. One would expect that females’ use of agroforestry practices would be lowerthan that of males, for two reasons. First, female household heads tend to havelower incomes than male household heads (Quisumbing et al., 1995). Thus,females would be less likely to test and adopt improved fallows for the reasons men-tioned above concerning poor households. Secondly, those choosing participants forexperiments and distributing planting material, usually extension staff, tend toselect men. Thus, even if the technology itself is gender neutral, adaptive researchand dissemination programmes are often biased towards males (CIMMYT, 1993).
Data from Zambia indicate that 32% of the males and 23% of the females inthe sampled villages were planting improved fallows, and that there was no signifi-cant difference between the two proportions. In fact, in one of the villages wherewomens’ groups were particularly strong, the proportion of females using improvedfallows was higher than that of males. Moreover, whereas single females are oftendisadvantaged relative to female heads of household whose husbands live away(Bonnard and Scherr, 1994), the Zambia data showed that the same proportions ofthese two groups were testing the technology. Available data thus suggest thatimproved fallow practices are suitable for poor and female farmers.
Policy Support for Agroforestry Adoption
A conducive policy environment is important for the adoption of any agriculturaltechnology, but there are several reasons why policies are particularly critical foragroforestry practices. First, the production and distribution of planting material fortrees is more complicated than for crops, because trees often require nurseries andbecause most countries have few mechanisms for the production and distribution oftree germplasm. Moreover, agroforestry practices tend to be more complex than
Assessing Adoption Potential 175
Trees on Farms Ch9 16/2/02 11:52 am Page 175

many agricultural practices, because they involve mixing trees with crops andbecause several years are often required before they generate returns. Agroforestrypractices thus may rely on supportive policies for their development and diffusionto a greater extent than do other agricultural practices.
The case studies in this volume suggest that germplasm policy must focus moreon reducing the cost of planting material, especially important for technologiessuch as improved fallows, which require large numbers of seedlings per unit areaand over time. Small-scale tree nursery promotion is needed for improved fallows inZambia and for timber, pole and fodder trees in Kenya. Whereas centralized, vil-lage-level nurseries offer some advantages for training, seed dissemination and qual-ity control early in the extension process, individual farm nurseries appear to bemore viable over the longer term.
While the case studies suggest that an improved policy environment can helpfacilitate agroforestry adoption, they do not suggest that subsidies and other directincentives are needed. Similarly, the provision of production credit for agroforestryshould not be an important priority for policy makers.
For the practices studied, there was little observed effect of tenure and regula-tory policy factors on agroforestry adoption or farm profitability. In southern Africa,free-grazing livestock damage trees during the dry season but this problem is beingaddressed by using non-palatable tree species. Moreover, some exploratory work onchanging community-level norms and regulating grazing appears to be promising.
Increasing the Effectiveness of Technology Development andDissemination
The case studies described in this book reflect the evolution of a new approach toaccelerate the process of technology development and dissemination. This approachhas promise not only for the development of agroforestry practices, but also forother types of agricultural and natural resource management innovations in highlyheterogeneous environments such as those found in Africa. The key elements of thisapproach are:
● on-farm trials, with differing levels of researcher and farmer involvement, as acentral locus for collaborative technology development;
● farmer participation, adaptation and innovation as key inputs in technologydevelopment; and
● adaptive research and dissemination networks.
On-farm trials as a central locus for technology development
On-farm trials greatly expand the potential contributions of research to technologydevelopment. The case studies confirm the importance and complementarity of thethree types of on-farm trials: type 1, type 2 (trials designed by researchers and man-
176 S. Franzel and S.J. Scherr
Trees on Farms Ch9 16/2/02 11:52 am Page 176
aged by farmers) and type 3 trials (trials designed and managed by farmers), whichare suited to different objectives. Where biophysical data are needed, type 1 trialsare generally best, because conditions can be controlled between treatments andacross farms. For data on farmer assessment and innovation, type 3 trials are pre-ferred, because farmers plant and manage technologies in these trials as they wish.Type 2 trials are useful for economic analysis, because farmers manage the trials andbecause plot sizes are standardized, facilitating the measurement of labour use andother inputs. The optimal sequencing of trial types depends on specific circum-stances. For example, in Zambia, in the early 1990s, type 1 trials were used to assessthe effect of improved fallows on crop yields, and type 3 trials to monitor farmers’assessments and innovations. In the mid-1990s, other type 1 trials were conductedacross four countries to assess biophysical constraints to adoption. In addition, type2 trials were carried out to estimate yield response and economic returns to a rangeof options under farmers’ management.
It is not always necessary to conduct all three types of trials, or to alwaysbegin with type 1 trials. In three of the case studies, researchers started with type 3trials, for different reasons. In the agroforestry tree trials in western Kenya, muchinformation was already available from on-station trials on the performance of thefive species under consideration; thus type 3 trials were started in which farmerstested whether the species could be grown in different niches of the farm. For cal-liandra in central Kenya, researchers started with type 3 trials as much was knownabout growing the tree. Several years later, a type 2 trial was conducted to assessthe effect of calliandra on milk yields. In western Kenya, a type 2 sesbaniaimproved-fallow trial started before any work on the technology’s performancehad been conducted on station or on farm. Researchers were particularly inter-ested in understanding farmers’ constraints to adoption, and feeding this informa-tion back for further research. The trial demonstrated the potential for thetechnology to increase returns and the main constraint fed back to research wasthe problem of establishing sesbania when direct seeded. Type 1 trials were insti-tuted to screen new species and, 2 years later, promising species were introducedin type 2 and type 3 trials.
The case studies also highlight the complementarity of different research andassessment methods. No single type of assessment, such as crop yield increases orprofitability, can alone explain farmer preference for an agroforestry practice.Rather, an integrated assessment of biophysical performance, profitability andacceptability is usually needed to explain farmers’ uptake of a practice. Assessmentsof acceptability are particularly challenging because of agroforestry’s complexity,that is, the length of the cycle of technologies (3+ seasons as opposed to single-sea-son cycles) and the number and diversity of components (intercropping trees andcrops, as opposed to crops in pure stand). A range of different methods were foundto be effective for assessing farmers’ preferences during and following on-farm trials,including monitoring farmers’ use of technologies, risk assessments, matrix rankingand decision trees (Chapter 2).
Finally, the case studies show that although farmers have a greater degree ofcontrol in type 3 trials, all three of the trial types need to be participatory. For
Assessing Adoption Potential 177
Trees on Farms Ch9 16/2/02 11:52 am Page 177
example, at farmer workshops to design the type 2 hedgerow intercropping trials inwestern Kenya, farmers made important decisions on such experimental factors asthe spacing between trees, spacing between lines of trees and crops, and the crops togrow between the hedges (Chapter 5).
Fostering farmer participation, adaptation and innovation
Indeed, the case studies demonstrate the importance of the participatory researchapproach for improving the effectiveness of the design, implementation and evalua-tion of on-farm research. Participatory research involves giving farmers control overthe research process, as in type 3 trials, in which farmers test new technologies asthey wish, adapting them to their specific needs and circumstances. Participatoryresearch also strengthens researcher–farmer partnerships, as when farmers andresearchers collaborate in the design, implementation and evaluation of a type 1 ortype 2 trial. Researchers contribute their scientific knowledge and farmers con-tribute their indigenous technical knowledge and information about their needs,preferences and circumstances.
A key lesson from the case studies is that farmers do not adopt practices as ini-tially introduced; they adapt them to their needs and circumstances. Simply stated,in agroforestry, researchers can rarely get a technology ‘right’ tinkering with it inon-station research or even in type 1 and type 2 trials. In Zambia, for example,farmers in type 3 trials made two important modifications in the improved fallowsthey planted in the early 1990s, these modifications were then tested together byresearchers and farmers. One of the farmer modifications, bare-rooted seedlings,was first used by a female farmer who obtained some left-over potted seedlings froma type 1 trial and removed them from their pots so she could pack them in a basin,which she carried on her head to her farm. Bare-rooted seedlings, grown in raisedbeds, have now completely replaced the higher-cost alternative, potted seedlings. Asecond modification was to intercrop trees with crops during the year of establish-ment, instead of planting them in pure stand. This method economizes on land andlabour use relative to planting trees in pure stands and, by 1997, was used by about42% of farmers planting improved fallows.
Similarly, in central Kenya, farmers determined the best niches for calliandraon their own, in type 3 trials. Whereas researchers had expected that farmers wouldplant calliandra in small plots, few did. Rather, farmers planted in other niches, oninternal and external boundaries, around the homestead, and intercropped withnapier grass.
The importance of farmer adaptation and innovation has several implicationsfor an effective technology generation programme. First, researchers need to estab-lish a partnership with farmers in which the latter understand that their role is toinnovate, not simply to follow instructions, or worse, pretend to follow instruc-tions while innovating in secret! In many areas, farmers are accustomed to workingwith change agents who have a top-down, we-know-what-is-best-for-you attitude;they are generally not used to working as partners with research and extension
178 S. Franzel and S.J. Scherr
Trees on Farms Ch9 16/2/02 11:52 am Page 178

staff. Thus, a great deal of time is required to establish effective research partner-ships with farmers.
Secondly, researchers need to present farmers with different options to test. Forexample, in the type 2 trials on improved fallows in Zambia, farmers chose amongthree tree species and two planting methods: pure stand and intercropping. In addi-tion, many farmers also conducted type 3 trials in which they planted as theywished, modifying operations such as spacing, timing of planting, or crop plantedafter the fallow. The rationale for testing multiple options is fourfold. Some optionsmay not work; thus it is better to introduce several. Even if all work, farmers appre-ciate diversifying as a means for coping with the risk that one of the options mayfail at some future time; for example, when a species succumbs to disease. An addi-tional reason for testing multiple options is that different farmers have differentpreferences, resource constraints and circumstances that lead them to choose differ-ent options. For example, some farmers in Zambia prefer tephrosia, which econo-mizes on labour but gives a lower crop yield response than sesbania. Others prefersesbania and are willing to invest the extra labour required in order to get a higherreturn. Finally, the option approach is important for enhancing biodiversity at thelandscape level for ecological reasons, as well as at the household level for economicreasons.
Thirdly, involving farmers early on in type 3 trials is important for encouragingmodification and for providing feedback to researchers. Many researchers prefertesting technologies on research stations and releasing them to farmers only whenthey are ‘proven’. But the experiences in this volume show that what is optimal toresearchers may not be optimal to farmers and, indeed, in the above-mentioned caseof sesbania and tephrosia in Zambia, different farmers in the same villages may finddifferent technologies to be optimal. Farmers should thus be encouraged to test newtechnologies on their own before, or at the same time as, they are tested on researchstations. In western Kenya, a type 2 improved fallow trial was started before thetechnology was tested on station. Following planting, it evolved into a type 3 trial,as farmers modified the technology in several ways, changing such operations asspacing, the length of fallow and the crop planted after the fallow. Several farmermodifications, such as increasing the plant density, led to new researcher-designedtrials. At the end of the on-farm testing period, the technology was not deemed fitfor disseminating. Nevertheless, the lessons learned were critical and fed back to on-station research, where new species were identified and a successful on-farmresearch and dissemination programme was launched several years later.
Fourthly, a monitoring system needs to be in place so that researchers, exten-sionists and other farmers can learn from innovating farmers. Our experience is thatquestionnaires are of little value in identifying innovation. Rather, informal interac-tion between researchers and farmers, and farmer-to-farmer visits, are much moreuseful. Monitoring surveys involving questionnaires do have a role – they are usefulfor determining the extent to which different farmers use different practices. Forexample, monitoring surveys in Zambia have documented the increased use oftephrosia, relative to sesbania, and the increase in intercropping, relative to plantingtrees in pure stand.
Assessing Adoption Potential 179
Trees on Farms Ch9 16/2/02 11:52 am Page 179

Building adaptive research and dissemination networks
The on-farm research experiences in Zambia demonstrate a new paradigm ofresearch–extension collaboration, as explained in Chapter 2. An interactive,rather than linear, sequential mode of on-farm experiments exploits the comple-mentary strengths of farmers, extensionists and researchers at a reasonable cost.Building a coalition of organizations to conduct on-farm research and dissemina-tion together appears to be more effective and efficient than leaving each to workindependently.
Whenever a farmer tests a new technology, dissemination can be said to takeplace as neighbouring farmers are exposed to it and take it up. Similarly, in a dis-semination programme, farmers using a technology for the first time are conductingresearch to see if new practices work effectively for them. That adaptive researchand extension represent points along a continuum, rather than distinct activities,suggests that integrating research and extension efforts should receive high priority.The case studies show the importance of integrated approaches to on-farm researchand dissemination. In eastern Zambia, for example, representatives of research,extension, NGOs and farmer groups meet twice a year to plan, implement andevaluate on-farm research, training and dissemination activities. There the networkhas already had important impacts, including (Cooper, 1999):
● reduced cost of conducting on-farm research, as field-based extensionists andNGOs establish and monitor on-farm trials;
● enhanced breadth of input into and relevance of the research;● expanded range of sites under experimentation with relatively little additional
cost;● partners increasingly well-informed on key aspects of technology options and
better placed to disseminate technologies and respond to farmer feedback;and
● partners have developed a sense of involvement, enthusiasm and ownership ofpromising innovations.
The most suitable institutional arrangements to foster useful interactionbetween agroforestry research and extension will vary, depending upon the densityand type of existing extension and farmers’ organizations and the commitment tofield-based operations by research organizations. The principle of linking researchand extension efforts by working together in specific sites around core on-farmresearch activities, rather than through centralized bureaucratic mechanisms, isstrongly endorsed.
Some of the lessons learned from the case studies for developing a successfuladaptive research and dissemination network are that:
1. Needs and responsibilities of each actor must be clearly defined.2. Testing should begin with a few (five) pioneer farmers who are risk-takers.Numbers can be greatly increased in the following seasons, based on the experiencesof the initial testers.
180 S. Franzel and S.J. Scherr
Trees on Farms Ch9 16/2/02 11:52 am Page 180

3. A range of options within and across technologies should be tested, to minimizethe risk of any single option or technology failing.4. The network can begin informally, without a leader or host organization, andshould evolve naturally. But participants should meet regularly (twice a year) toreview progress and plan activities.5. On-farm trials should be jointly planned by research, extension and representa-tives of farmer groups.
These lessons about adaptive research and dissemination networks, highlightedin the Zambia case study (Chapter 3), can be applied to all of the technologies stud-ied. To promote this new paradigm on a larger scale may require policy makers toeffect institutional changes in programme structure and staff incentive and perfor-mance evaluation systems in both research and extension organizations. Staff train-ing is also required in participatory on-farm research and dissemination methodsadapted to agroforestry.
Future Directions
The experiences reported in this book demonstrate the importance of assessing theadoption potential of agroforestry practices and suggest that more such studies areneeded in the future, for several reasons. First, such assessments improve the effi-ciency of the technology development and dissemination process, by feeding backinformation on farmers’ problems, modifications and preferences to research, exten-sion staff and policy makers. The importance of feedback was especially critical inthe case of improved tree fallows in western Kenya, where assessments of adoptionpotential helped guide a research programme that has been successful in developingimproved fallow practices for thousands of farmers (Chapter 4). Secondly, theassessments help document the achievements in developing and disseminating newpractices, demonstrating the impact of investing in technology development anddissemination. For example, Chapter 7 shows that the potential benefits fromadopting calliandra as a fodder tree amount to US$139 million year−1 in Kenya’ssmallholder dairy sector. Thirdly, because the activities are conducted with partner-institutions, they facilitate interdisciplinary and inter-institutional cooperation. Theadaptive research and dissemination network in Zambia is an excellent example ofsuch cooperation (Chapter 3). Finally, the assessments help to identify the factorscontributing to successful technology development programmes as well as the con-straints limiting their achievements.
Several critical research themes emerge from all of the case studies examined inthis volume. Future assessments of adoption potential need to take advantage offarmers’ increased experience with agroforestry practices. Whereas the analyses inthis study are primarily at the plot and household level, increased adoption will per-mit assessment of impacts on community and regional scales. Moreover, whereasmost of the assessments in this volume concern economic and crop productivitygains, more information is needed on social and environmental impacts. There is a
Assessing Adoption Potential 181
Trees on Farms Ch9 16/2/02 11:52 am Page 181

particular need to examine the environmental impacts of agroforestry practised on alandscape scale, for example, on hydrological flows or patterns of sedimentation.
Research also needs to continue to establish the boundary conditions of differ-ent agroforestry practices, focusing on the main biophysical and socioeconomicconditions that influence uptake. Improvements in the development of spatiallyexplicit databases and models should permit the use of geographical informationsystems for assessing the boundary conditions of new technologies. Guidelinesbased on such systems can be useful for helping change agents decide which tech-nologies should be offered to farmers in specific areas and with particular featuresand circumstances. Recommendations need to be prepared, documenting not that aparticular technique is ‘best’, which is an oversimplification, but, rather, what theadvantages and disadvantages are of different options in differing biophysical andsocioeconomic circumstances. Moreover, technologies always need to be adapted byfarmers to suit local needs and circumstances, and change agents need to documentthese modifications for feedback to researchers and possible dissemination to otherfarmers.
In all of the case studies, the main agroforestry products were substitutes forpurchased inputs, such as mineral fertilizer, dairy meal concentrates or timber.Agroforesters need to follow closely the price and availability trends for these substi-tutes, and understand how these will affect farmer adoption. More studies still needto be done on farmer nutrient management strategy under different price and riskregimes, and on the biophysical interactions of tree-derived nutrients and chemicalfertilizers. A similar focus and studies are needed for the dairy meal input marketand farmer use.
Finally, research is needed on approaches to scaling up the benefits of agro-forestry across large areas; once participatory research succeeds and hundreds offarmers adopt a practice, how can these benefits be spread? Cooper and Denning(2000) highlight key elements of scaling up the impact of agroforestry research, andthe need to compare systematically different options. For example, access togermplasm was a common constraint in the case studies; more research is needed toassess ways of developing decentralized, village-level germplasm production and dis-tribution systems. Research is also needed to increase the number of tree speciesused in each practice, as a means of enhancing biodiversity as well as helping farm-ers to diversify in order to reduce risk. Scientists also need to reduce the costs ofestablishing trees, such as through direct seeding and bare-root seedlings as substi-tutes for potted seedlings.
Research on dissemination pathways is critical, and should focus on the func-tioning of farmer information networks and community group learning and diffu-sion mechanisms. Such information, at subregion or local levels, should be used toguide decisions about the content and balance of extension communication effortsamong individuals, groups and across communities. Efforts are also needed to handover many of the activities in assessing adoption potential to local institutions, suchas farmer groups and community-based, non-governmental organizations. Thegreater control farmers have over assessing adoption potential, the more responsivetechnology generation activities will be to their needs.
182 S. Franzel and S.J. Scherr
Trees on Farms Ch9 16/2/02 11:52 am Page 182

References
Assessing Adoption Potential 183
Bonnard, P. and Scherr, S. (1994) Within genderdifferences in tree management: is genderdistinction a reliable concept? AgroforestrySystems 25, 71–93.
CIMMYT Economics Program (1993) TheAdoption of Agricultural Technology: a Guidefor Survey Design. CIMMYT (InternationalMaize and Wheat Improvement Center),Mexico, D.F.
Cooper, P.J.M. (1999) Agroforestry: learning aswe go in Africa. In: Martin, G., Agama, A.and Leakey, R. (eds) Cultivating Forests: theEvolution of Agroforestry Systems, Plant andPeople Handbook, Issue 5. UNESCO, Paris,pp. 30–33.
Cooper, P.J.M. and Denning, G.L. (eds) (2000)Scaling up the Impact of Agroforestry Research.
Report of the Agroforestry DisseminationWorkshop, 14–15 September 1999, ICRAF,Nairobi, Kenya.
Hoekstra, D.A. (1985) Choosing the discountrate for analysing agroforestry systems/tech-nologies from private economic viewpoint.Forest Ecology and Management 10,177–183.
Quisumbing, A.R., Brown, L.R., Feldstein, H.S.,Haddad, L. and Pena, C. (1995) Women:the Key to Food Security. Food Policy Report.International Food Policy ResearchInstitute, Washington, DC.
Raintree, J. and Warner, K. (1986) Agroforestrypathways for the intensification of shiftingcultivation. Agroforestry Systems 4, 39–54.
Trees on Farms Ch9 16/2/02 11:52 am Page 183

Trees on Farms Ch9 16/2/02 11:52 am Page 184

adoption potential: The feasibility, profitability and acceptability of a practice, asviewed from the farmers’ perspective.
agroforestry: A dynamic, ecologically based, natural resource management systemthat, through the integration of trees on farms and in the agricultural landscape,diversifies and sustains production for increased social, economic and environmen-tal benefits for land users.
biomass: The weight of material produced by living plants. It is expressed in termsof dry weight or fresh weight.
boundary conditions: The biophysical and socioeconomic circumstances thataffect the adoption potential of a practice. The boundary conditions of using cal-liandra as a fodder tree may include secure land tenure, altitudes between sea leveland 1900 m in the tropics, and rainfall above 1000 mm.
break-even analysis: The calculation of the increase in net returns required to coverthe costs of establishment and maintenance of a practice. In practices aimed atincreasing crop yields, the break-even yield increase may be calculated, that is, theyield increase required to cover costs.
contour: A line joining all places at the same altitude.
coppice: Cutting certain tree species close to ground level to produce new shootsfrom the stump. Not all trees may be coppiced.
crown: The canopy or top of a single tree that carries its main branches and leavesat the top of a stem.
direct seeding: Sowing seeds directly where they are to develop into mature plants.
discount rate: The rate at which 1 unit at a future date is converted to assess itsvalue today. Discount rates are usually applied to monetary values but can also beapplied to other values, such as units of labour.
economic analysis: Analysis of costs and returns from the perspective of society, ascontrasted with the perspective of the individual farmer. Inputs and outputs are
Glossary
185
Trees on Farms Glossary 16/2/02 11:52 am Page 185

valued at prices society incurs. For example, if the government subsidizes the price offertilizer to farmers, then its price in economic analysis would be the unsubsidizedprice.
exotic: A plant growing anywhere outside its natural range.
fallow land: Land that is temporarily uncultivated.
financial analysis: Analysis of costs and returns from the perspective of the individ-ual farmer. Inputs and outputs are valued at prices farmers face and profitabilitymeasures represent the returns farmers would earn.
hedgerow intercropping: The practice of growing annual crops in the spacesbetween rows of trees or hedgerows. This is sometimes called alley cropping or alleyfarming.
herbaceous: A plant that is not woody.
improved tree fallow: Enrichment of natural fallows with trees or shrubs toimprove soil fertility.
indigenous: Native to a specified area, not introduced.
intercropping: Growing two or more crops in the same field at the same time in amixture.
net present value: A criterion for evaluating alternative investments that uses thediscounting formulae for a stream of costs and returns over a specified time periodto value the projected cash flows for each alternative at one point in time. In thisfashion, the net present value criterion directly accounts for the timing and magni-tude of the projected cash flows.
niche: A place on a farm or in the landscape that is suited to a particular plant.
nitrogen fixing: Having the ability to convert nitrogen in the air into a form thatcan be used by plants.
provenance: The place in which any stand of trees is growing or from which astock of seed originates.
pruning: The process of cutting back the growth of plants.
returns to labour: Returns (that is, earnings) expressed per unit of labour, such asper work day or per hour. This measure is especially relevant for farmers whosemost scarce input is labour.
returns to land: Returns (that is, earnings) expressed per unit of land. This measureis especially relevant for farmers whose most scarce input is land.
rhizobia: Type of bacteria with the capacity to invade the roots of certain species ofleguminous plants and to fix atmospheric nitrogen that is subsequently taken up bythe host plant.
186 Glossary
Trees on Farms Glossary 16/2/02 11:52 am Page 186

root collar diameter: The diameter at the root collar, that is, the transition zonebetween the root and the shoot of a plant.
shrub: A descriptive term, not subject to strict definition, referring to a perennialplant with wooden stem or trunk. It may be distinguished from a tree in that it issmaller and usually divided into separate stems from near the ground.
tree: A perennial plant with wooden stem or trunk.
type 1 trial: A trial that is designed and managed (implemented) by researchers onfarmers’ fields. It is similar to an on-station trial except that it takes place on farm-ers’ fields.
type 2 trial: A trial that is designed by researchers, in consultation with farmers,and implemented or managed by farmers.
type 3 trial: A trial that farmers design in order to test a new practice as they wish.The trial may not include a control plot, or uniform plots laid out side-by-side,unless the farmer wishes.
zero grazing: A livestock production system in which the animals are fed in pens orother confined areas and are not permitted to graze.
Glossary 187
Trees on Farms Glossary 16/2/02 11:52 am Page 187


acceptability of agroforestry practices 3, 6,12–17, 23, 24, 29, 33
of fodder shrubs, central Kenya136–137, 139–140
of hedgerow intercropping, westernKenya 91, 93, 103–106
of improved fallows, western Kenya 69,73, 81
of improved fallows, Zambia 53of trees in farmer-designed agroforestry
trials, western Kenyasee also expansion of use of agroforestry
practicesAcrisols 68, 91, 112adaptive research and dissemination
networks 4, 8, 21, 32, 55, 57, 59,121, 161, 180–181
adoption definition of 134factors affecting adoption of agroforestry
trees, western Kenyafactors affecting adoption of fodder
shrubs, central Kenya 134, 141factors affecting adoption of hedgerow
intercropping, western Kenya 15factors affecting adoption of improved
fallows, western Kenya 82–83factors affecting adoption of improved
fallows, Zambia 54–55, 58agroforestry tree trials, farmer-designed,
western Kenya 18, 19, 111–121,155, 156, 159, 169–170, 172–173,177
Alfisols 39, 44, 46
alley cropping or farming see hedgerowintercropping
anthropology 6, 31
banana 128bao game 28, 113, 116, 159bare-rooted seedlings 40, 42, 44, 45,
53–54, 55, 98, 102, 105, 129, 146,178
beans 96, 127, 128Benin 81biophysical performance of agroforestry
practices in agroforestry tree trials, western Kenya
111, 113, 116, 118, 120assessment of 14–15, 17, 18, 22, 24,
26, 28, 33in fodder shrubs, central Kenya 131in hedgerow intercropping, western
Kenya 90, 91, 93, 94–96, 98, 102,107
in improved fallows, western Kenya 66,72, 73, 82
in improved fallows, Zambia 38, 44–49boundaries, planting on farm 1, 5, 7, 27,
31, 105, 114, 128, 171, 178boundary conditions 12, 13, 17, 31, 33,
34, 119, 120, 129, 134, 138, 139, 159,173, 182
Brassica oleracea (kale) 82, 156break-even analysis 23–24, 65, 70, 87, 89,
93, 98–102, 102, 146browsing 40, 44, 45, 59, 72, 83, 95, 98,
114–116, 119, 120Burundi 171
Index
189
Trees on Farms Index 22/2/02 11:44 am Page 189
Cajanus cajan 38, 42, 44– 45, 53, 173calcium 105Calliandra calothyrsus 7, 26, 29, 32, 89,
91–92, 95–96, 105–106, 111–121,125–144, 148–152, 155, 157–158,169–171
Cameroon 106, 170–171, 173CARE International 161CARE-Kenya Agroforestry Extension
Project 91Casuarina junghuhniana 7, 111–121, 155,
173cation exchange capacities 105cattle 39, 68, 112, 113
see also dairy cows churches 56, 147coffee 68, 105, 126, 127, 135community-based organizations 57, 147
see also non-governmental organizationscomplexity of agroforestry practices 13,
18, 90, 175contours 26, 106, 128, 134cost–benefit analysis see financial analysis cotton 30credit 71, 151, 153, 176crop residues 45Crotalaria spp. 7, 84, 169–170
dairy cows 6, 24, 26, 32, 89, 94, 104, 106,125–141, 154, 156, 171
dairy meal concentrate 25, 128, 137, 152,155, 164, 182
dambos 39decision trees and decision tree modelling
6, 23, 28, 93, 104–105Desmodium intortum 140development projects, organizations and
practitioners 2, 4–5see also extension staff and programmes
direct seeding 40, 46, 53, 58, 78, 80,81–82, 83, 133, 146, 158, 178
discount rate 50, 51, 64, 70, 102, 131,137, 150, 153, 175
dissemination see extension staff andprogrammes
donors 3drought 44, 114–116, 119, 120
economic analysis 2see also financial analysis
Emuhaya 67enterprise budget see financial analysisenvironmental impact and services 8, 13,
58, 96, 146, 155, 181establishment of agroforestry trees 46Ethiopia 173Eucalyptus spp. 112–113, 116, 173exchange rate 100, 131expansion of use of agroforestry practices
27, 38, 53, 58, 119agroforestry trees, western Kenya 119fodder shrubs, central Kenya 125–126,
132–133, 136, 140hedgerow intercropping, western Kenya
93, 104, 106, 158improved fallows, western Kenya 73,
83–84improved fallows, Zambia 37, 53, 55
extension staff and programmes 2–3, 5–6,9, 12, 13, 20, 21, 30, 33–34, 145, 147,151, 173, 176–182
agroforestry trees, Kenya, 111, 121fodder shrubs, Kenya, 125, 136, 140–141hedgerow intercropping, Kenya, 90,
105–107improved fallows, Kenya 84, 156improved fallows, Zambia 41, 55–57, 59,
65policies 157–162role in assessing adoption potential of
agroforestry 12, 13, 19, 20, 21,22, 30, 31, 32, 33, 159–162
fallow, natural 40, 54, 65, 66, 68, 70, 71,79, 171
farm models 23, 25, 43, 52farm size 39, 68, 71, 93–94, 105,
112–114, 126, 132, 134, 153farmer-designed trials see type 3 trialsfarmer groups and organizations 3, 6, 8,
19, 20, 21, 30, 34, 151, 160, 180agroforestry tree trials, western Kenya
111fodder shrubs, central Kenya 140, 141,
147–148hedgerow intercropping, western Kenya
92
190 Index
Trees on Farms Index 22/2/02 11:44 am Page 190

improved fallows, western Kenya 69,119
improved fallows, Zambia 55, 56, 57, 58,175
farmer managed trials see type 2 and type 3trials
farmer-to-farmer diffusion 6, 27, 32, 139farmer-to-farmer visits and training 16,
56, 59, 93, 136, 147, 159, 160, 179farmer workshops 28farmers’ assessments of agroforestry practices
4–6, 177of agroforestry trees, western Kenya
112–113, 115–119, 121of fodder shrubs, central Kenya 130of hedgerow intercropping, western
Kenya 92–93, 98, 107of improved fallows, western Kenya 81of improved fallows, Zambia 40, 53–55,
59methods 14, 15, 16, 19, 21–22, 23, 27,
28, 31, 33farmers’ evaluations see farmers’ assessmentsfarmers’ experiments see type 3 trialsfarmers’ innovations 4–5, 13, 14, 17,
29–30, 32, 177–179of fodder shrubs, central Kenya
136–137, 141of improved fallows, western Kenya 83of improved fallows, Zambia 44, 53–54
farmers’ problems 12, 14, 23agroforestry trees, western Kenya 119fodder shrubs, central Kenya 136hedgerow intercropping, western Kenya
90–91, 98improved fallows, western Kenya 66improved fallows, Zambia 40, 43, 46,
59farming systems and farming systems
approach 4–5, 11, 12, 24, 112feasibility of agroforestry practices 3, 6,
13, 15, 17, 28agroforestry trees, western Kenya
114–115fodder shrubs, central Kenya 132–135hedgerow intercropping, western Kenya
96–98improved fallows, western Kenya 81improved fallows, Zambia 38, 44–47
feed 1, 25, 104, 105, 113, 128, 137, 152,155, 164, 169
feedback from farmers 12, 13, 14, 15, 16,21, 22, 27, 34
agroforestry trees, western Kenya 121improved fallows, western Kenya 83–84fodder shrubs, central Kenya 126, 136hedgerow intercropping, western Kenya
106–107improved fallow, Zambia 55–57, 59see also farmers’ assessments; farmers’
innovationsFerrasols 68, 91, 112fertilizer 1–2, 25, 27, 90, 99–100, 103,
112, 120, 153, 164, 173, 175, 182in comparison with improved fallows,
western Kenya 66, 68, 71in comparison with improved fallows,
Zambia 38, 40–41, 43, 46, 49, 51,52, 62–64
financial analysis of agroforestry practices2–6, 9, 13, 23–27, 31, 43, 152, 153,155, 176–179
of alternative seed supply approaches148–151
fodder shrubs 125, 126, 130, 131, 140,137–39
hedgerow intercropping 90, 91, 92–93,98–103, 106
improved fallows, western Kenya 65,66, 69, 70–71, 74–79, 80–82,87–88
improved fallows, Zambia 38, 41, 43,47–53, 62–64
methods for conducting 12, 13, 16, 17,23, 24–26, 28, 29, 31, 33
returns to capital 70returns to labour 49, 50, 52, 53, 70,
75–80, 87, 89, 93, 98returns to land 49, 50, 53, 74–78, 80,
87, 89, 93, 98, 102, 106fires 44, 95, 163fodder 24, 71, 90, 115, 117–118, 120,
125–141, 147–148, 153fodder shrubs, central Kenya 125–142,
146, 164, 165, 169, 171–173,177–178, 181
fodder trees 6–7, 23, 156, 157, 171food security 2, 8
Index 191
Trees on Farms Index 22/2/02 11:44 am Page 191

forests 1, 8, 145, 146, 153, 155, 156–157,174
French beans 68fuelwood 1, 5, 7, 47, 53, 153–155, 170
in agroforestry tree trials, western Kenya112, 115, 117–119
in fodder shrubs, central Kenya 135,138
in hedgerow intercropping, westernKenya 91, 99–101, 102, 105
in improved fallows, western Kenya 66,71–78, 80
in improved fallows, Zambia 47, 48
gapping up in improved fallows, western Kenya 69in improved fallows, Zambia 44, 45,
46, 54gender issues and women farmers 19, 20,
26, 29, 156–157, 160, 164agroforestry trees, western Kenya 111,
113, 114, 115, 119fodder shrubs, central Kenya, 126, 130,
132hedgerow intercropping, western Kenya
93, 97, 105–106improved fallows, western Kenya 68, 72improved fallows, Zambia 43, 46, 54,
58genetic diversity 147, 151geographic information systems 34, 182germination 44, 136
see also survival ratesgermplasm production and distribution see
seed production and distributionGhana 163Gliricidia sepium 42, 58, 91, 92goats 39, 127, 129, 132, 135, 140, 147grazing communal 45, 59, 83, 157, 163,
164, 176Grevillea robusta 7, 11, 148, 155, 170,
173, 174groundnuts 39, 54, 95
hedgerow intercropping 2, 6–7, 17, 18,22, 23, 26, 28, 31, 89–108, 113, 146,153, 156, 157, 158, 159, 165,169–170, 172
hedges 69, 128herbaceous legumes 58, 126Heteropsylla cubana (psyllid) 96, 116, 120
International Centre for Research inAgroforestry (ICRAF) 12, 20, 59,128, 139, 140, 161, 162, 173
impact assessment 4, 28, 59see also farmers’ assessments; financial
analysis improved fallow 2, 6–7, 22, 151, 156, 158
western Kenya 18, 23, 24, 31, 32,65–88, 146, 153, 154, 155, 165,177, 179, 181
Zambia 18, 19, 22, 23, 24, 25, 26, 27,28, 29, 30, 37–64, 146, 148, 154,155, 157, 164, 165, 169–170,172–181
incentives, extension staff 57incentives, providing to farmers 2–4, 8,
21–22, 90, 176India 80Indonesia 80induced innovation 82inflation 48, 50input use and supply 151–154
see also tree management, fertilizerinstitutional support for on-farm research
and extension 19–22, 29–31, 32–34,157–162, 164–166, 175–182
fodder shrubs 140–141improved fallows, western Kenya 86–87improved fallows Zambia 55–57
intercropping trees and crops 18, 30, 153,178
in fodder trees central Kenya 134in hedgerow intercropping, western
Kenya 101, 103in improved fallows, western Kenya 69,
70, 73in improved fallows, Zambia 40–42,
43, 45, 46, 47, 48, 53–54, 58, 59,157, 179
International Livestock Research Institute(ILRI) 128, 139
Java 80
192 Index
Trees on Farms Index 22/2/02 11:44 am Page 192

kale 82Kenya Agricultural Research Institute
(KARI) 136, 140Kenya Forestry Research Institute (KEFRI)
112, 161Kenya 6, 19, 20, 23, 24, 29, 32, 34,
65–144, 146, 147–148, 157, 162,169–170
Kenya Agricultural Research Institute(KARI) 128, 139, 161
Kisumu District 67, 112
labour availability and use 5, 14, 25, 26,31, 170–171, 173
costs see financial analysisestimation of 14, 16, 17fodder shrubs, central Kenya 141hedgerow intercropping, western Kenya
89, 92, 96–103, 106, 146improved fallows, western Kenya 68,
70–71, 74, 76, 79, 80improved fallows, Zambia 41, 46, 47,
48, 50, 52, 58land and soil degradation 1, 8, 37, 80, 81,
82, 158, 169 land transactions 71Leucaena diversifolia 111–121Leucaena leucocephala 7, 89, 91, 92, 95,
105 111–121, 128, 169–170Leucaena trichandra 129, 140livestock 45, 114–115, 118, 120livestock feed 1, 104, 105, 113, 169Lufisols 39, 44, 46
Madoqua kirki (antelopes) 72, 83, 95maize 154, 155, 156
in association with trees in agroforestrytree trials 112
in association with fodder shrubs 127,128, 132
in association with hedgerowintercropping, western Kenya 92,96–108
in association with improved fallows,western Kenya 65, 68, 69–71, 73,74, 75, 76
in association with improved fallows,Zambia 38–64, 152
Makoka Research Station 58Malawi 106, 170, 173manure
use in hedgerow intercropping, westernKenya 96, 99, 100, 103, 107
use in improved fallows, western Kenya66, 71
marigold 136markets and market access 4, 5–6, 13, 30,
41, 50, 59, 82, 141, 146, 147, 163,165, 172
Maseno Agroforestry Research Centre 95Maseno, Kenya 67, 80, 81, 94matrix ranking 6, 23, 28, 32medicine 1mesoplatys beetle 46, 58milk 155, 164minimum returns analysis 27, 93, 102models, economic 23, 25, 43, 52, 82monitoring 24, 25, 27, 57, 90, 93, 103,
179see also surveys
Msekera Research Station 55Mucuna pruriens 81mulch 117Morus alba (mulberry) 129, 140
napier grass 127, 128National Agroforestry Research Project
(NAFRP) 128, 132National Dairy Development Project
(NDDP) 130, 132natural resource management and associated
practices 1, 4, 13neem 136nematodes 58, 173networks, adaptive research and extension
networks 4, 8, 21, 32, 55, 57, 59,121, 161, 180–181
niches where trees are planted see treemanagement
Nigeria 106Nitisols 68, 91, 112, 126nitrogen
deficiency 7, 40, 68, 170fixation 1, 90see also fertilizer
Index 193
Trees on Farms Index 22/2/02 11:44 am Page 193
non-governmental organization 3, 8, 20,21, 55–56, 121, 140, 147, 151, 160,162, 180, 182
nurseries 147–151, 160, 161, 164,175–176
agroforestry trees, western Kenya 113hedgerow intercropping, western Kenya
92, 100, 105fodder shrubs, central Kenya 129,
132–134, 136, 140, 146improved fallows, Zambia 45, 46, 47,
57, 58, 59, 62–64
off-farm enterprises and income 68, 71,80, 82, 94, 105, 114
on-farm trials 4, 5–6, 8on-farm experiments, involvement of
extension 57on-farm trials 12–20, 159–162, 176–182
farmer and technology selection 19handling complexity 18–19monitoring 20objectives of 13–14suitability of trial types for different
objectives 16–19supervision of 20type 1 trials (designed and managed by
researchers) 15improved fallows, western Kenya 65,
66, 83, 160improved fallows, Zambia 54, 160
type 2 trials (designed by researchers butmanaged by farmers) 15, 16–17,29, 33, 120, 130, 160, 176
improved fallows, western Kenya 98,160
improved fallows, Zambia 40–42,43–44, 46, 49
type 3 trials (designed and managed byfarmers) 5, 16, 17–18, 29, 30, 33,177
agroforestry tree trials, western Kenya111–121
fodder shrubs, central Kenya 128,141
improved fallows Zambia, 40–41,43–44, 46, 49, 53
improved fallows, western Kenya 65,160
Organic Matter Management Network161
ornamental benefits of trees 115, 119, 138oxen 14, 19, 39, 44, 54, 98Oxford Forestry Institute (OFI) 140
parastatal 155partial budget 23–24, 32, 130–131, 137participatory on-farm trials see on-farm trials participatory rapid appraisals see surveys,
informal or semi-structuredparticipatory technology development see
technology design and developmentpayback period 48, 153, 170Pennisetum purpureum (napier grass) 127,
128pests and diseases 24, 115, 135, 136–137,
140Philippines 106–107phosphorus 24, 68, 83, 90, 95, 96, 106,
117, 121, 153see also fertilizer
pigeon pea 38, 42, 44– 45, 53, 173poles 7, 111–113, 115, 118–120, 148,
154, 164policy 3, 8, 13, 22, 145–166, 176
constraints 146input supply 151–154land and forest tenure and regulatory
systems 156–157makers 4, 12, 157, 162, 163, 181product markets 154–156recommendations 165tree germplasm supply 146–151
population density 1, 6central Kenya 126eastern Zambia 39, 169western Kenya 66, 68, 70, 72, 81, 83,
91, 106, 112poultry 132, 135private sector, Zambia 59profitability see financial analysispruning 18, 22, 73, 113, 128–130,
134–135, 139, 157in hedgerow intercropping, western
Kenya 89, 90, 95–97, 100,105–106, 113
194 Index
Trees on Farms Index 22/2/02 11:44 am Page 194

rabbits 132, 135rainfall
central Kenya 126, 140eastern Zambia 39, 44, 45, 46, 58western Kenya 67–68, 94, 95, 107, 113
recommendation domains 12, 170–171,173
Regional Land Management Unit (RELMA)140
regression 29, 30, 96, 114, 118relay cropping 81–82, 158rental rates, land 93research stations 2, 14, 55, 56, 58, 90, 95,
112, 120, 179research–development continuum 21,
161–162, 180–181resource budgets 23, 26rhizobia 40, 92risk 5, 23, 27, 153, 155, 172–173, 175risk, hedgerow intercropping relative to
other enterprises, western Kenya 91,93, 102, 106
risk, of improved fallow relative to fertilizedmaize, Zambia 50–51
rock phosphate 83, 153root system 45, 46, 54Rwanda 140, 170–171
sample size see surveys; trial designSapium ellipticum 129seed production and distribution 30, 140,
146–151, 164, 175, 182agroforestry trees, western Kenya 120 fodder shrubs, central Kenya 130,
135–136, 140hedgerow intercropping, western Kenya
105improved fallows, western Kenya 66,
69, 72, 76improved fallows, Zambia 57, 59
seeding, direct 40, 46, 53, 58, 78, 80,81–82, 83, 133, 146, 158
seedlings, bare-rooted 40, 42, 44, 45,53–54, 55, 98, 102, 105, 129, 146,178
seedlings potted 40, 42, 53–54, 76, 80,81–82, 92, 98, 129, 132–133, 178
sensitivity analyses see financial analysisSesbania sesban 7, 31, 128, 148, 169–170,
179improved fallows, western Kenya 65–84improved fallows, Zambia 37–64management of indigenous stands
71–72shade 73, 115shading, reduction 73sheep 132, 135Siaya district 67, 91, 112slope 89, 90, 91, 92, 96, 105, 106social analysis 3, 8, 92–93
see also farmer assessment or acceptabilitysocial time preference rate 70sociology 6soil
conservation 90, 115, 128, 135erosion 1, 7–8, 95, 104, 105, 106, 107,
120, 138, 154, 169–170fertility 2, 6, 169
agroforestry trees, western Kenya111, 113, 115, 117–19, 120
hedgerow intercropping, westernKenya 89, 90, 96, 98, 105
improved fallows, western Kenya66–68, 71–72, 152
improved fallows, Zambia 37–38, 40organic matter 38, 51structure 38, 51
sorghum 96, 100southeast Asia 11subsidies 147, 154, 164, 176sugarcane 68sunflower 39, 54surveys
diagnostic 14, 59, 160formal 27, 28, 31,
in assessing agroforestry trees, westernKenya 113
in assessing fodder shrubs, centralKenya 129–130, 130–137
in assessing hedgerow intercropping,western Kenya 92–93
in assessing improved fallows, westernKenya 68, 71–72
in assessing improved fallows, Zambia41, 43
Index 195
Trees on Farms Index 22/2/02 11:44 am Page 195

surveys, continformal or semi-structured 27, 28, 30,
33,in assessing fodder shrubs, central
Kenya 129in assessing agroforestry trees, western
Kenya 113in assessing hedgerow intercropping,
western Kenya 91, 92, 93in assessing improved fallows, western
Kenya 68, 72in assessing improved fallows, Zambia
43 sustainable agriculture 13sweet potato 73Systemwide Livestock Programme 139
Tanzania 83, 140, 163, 170, 173, 174tea 68, 105, 132, 135technology design and development 4, 6,
9, 11, 12, 13, 121, 146, 157–162, 164,176–182
see also on-farm trialstechnology testing 5
see also on-farm trials technology testing, village approach to
19–20tenancy 71tenure systems and regulations 30,
103–104, 126, 156–157, 165, 176Tephrosia vogelii 7, 136, 169–170, 179
western Kenya 84, 173Zambia 38, 42, 44, 45, 46, 47, 48, 53,
54, 58, 173termites 95, 115, 116, 118, 119, 120terraces 96, 114, 128threshing 47timber 1, 7, 111, 113, 115, 117, 119, 146,
148, 154, 164, 182Tithonia diversifolia 156tobacco 136, 154tomatoes 156transplanting 58tree germplasm supply policy 146–151tree growth
agroforestry trees, western Kenya114–17
fodder shrubs, central Kenya 137, 141
hedgerow intercropping, western Kenya89, 94–95, 103, 104, 105, 106
improved fallows, western Kenya 72, 83tree management 30, 146–148, 153, 158
agroforestry trees, western Kenya114–115, 120
fodder shrubs, central Kenya 128–29,132–137, 141
hedgerow intercropping, western Kenya89, 91, 94–95, 103, 104, 105, 106
improved fallows, western Kenya 69,72, 73, 83
improved fallows, Zambia 44, 46, 47tree survival rate
agroforestry trees, western Kenya 111,113, 114, 116, 120
fodder shrubs, central Kenya 132hedgerow intercropping, western Kenya
95improved fallows, western Kenya 72improved fallows, Zambia 44, 46, 53,
54–55, 57type 1, 2, and 3 trials see on-farm trialstree species and provenances 2, 5, 83, 95,
111, 120trial design 14–22
agroforestry tree trials, western Kenya113
hedgerow intercropping, western Kenya91–92, 178
improved fallows, western Kenya 69improved fallows, Zambia 40–41
Uganda 140, 170–171, 173, 174United States Agency for International
Development (USAID) 57upper-storey trees 7, 111, 159 128, 139uses of trees see tree management
Vihiga district 67, 91, 112village approaches 30
wealth status 14, 20, 29, 93, 94, 105, 114,134
of farmers planting improved fallows,Zambia 43, 44, 55, 57
196 Index
Trees on Farms Index 22/2/02 11:44 am Page 196
weeds and weeding, agroforestry trees, western Kenya 117,
120 hedgerow intercropping, western Kenya
87, 98improved fallows, western Kenya 66,
72, 73, 82improved fallows, Zambia 44, 46, 47,
54, 55western Kenya 28, 31, 32, 169–170Winam 67windbreaks 1, 120
wood 5, 73see also fuelwood or timber
World Vision International 57
Yala 67
Zambia 6, 16, 19, 20, 21, 22, 23–24, 26,27, 31, 32, 34, 37–64, 80, 146–148,152, 155, 157, 158, 160, 169–171
Zimbabwe 140, 170–171, 173, 174
Index 197
Trees on Farms Index 22/2/02 11:44 am Page 197

Trees on Farms Index 22/2/02 11:44 am Page 198