Assessing sustainability on a degrowth perspective · v Acknowledgments This dissertation...
183
Paula Inês Cosme Teixeira Licenciada em Ciências de Engenharia do Ambiente Assessing sustainability on a degrowth perspective Dissertação para obtenção do Grau de Mestre em Engenharia do Ambiente, perfil de Gestão e Sistemas Ambientais Orientador: Prof. Doutor Rui Ferreira dos Santos, Professor Associado, FCT/UNL Júri: Presidente: Prof. Doutora Maria Paula Baptista da Costa Antunes Arguente: Prof. Doutor Nuno Miguel Ribeiro Videira Costa Vogal: Prof. Doutor Rui Jorge Ferreira dos Santos Março de 2012
Transcript of Assessing sustainability on a degrowth perspective · v Acknowledgments This dissertation...
Paula Inês Cosme Teixeira
Licenciada em Ciências de Engenharia do Ambiente
Assessing sustainability on a degrowth perspective
Dissertação para obtenção do Grau de Mestre em Engenharia do Ambiente,
perfil de Gestão e Sistemas Ambientais
Orientador: Prof. Doutor Rui Ferreira dos Santos, Professor Associado, FCT/UNL
Júri:
Presidente: Prof. Doutora Maria Paula Baptista da Costa Antunes
Arguente: Prof. Doutor Nuno Miguel Ribeiro Videira Costa
Vogal: Prof. Doutor Rui Jorge Ferreira dos Santos
Março de 2012


Assessing sustainability on a degrowth perspective
Copyright © Paula Inês Cosme Teixeira
Faculdade de Ciências e Tecnologia
Universidade Nova de Lisboa
2012
A Faculdade de Ciências e Tecnologia e a Universidade Nova de Lisboa têm o direito,
perpétuo e sem limites geográficos, de arquivar e publicar esta dissertação através de
exemplares impressos reproduzidos em papel ou de forma digital, ou por qualquer outro
meio conhecido ou que venha a ser inventado, e de a divulgar através de repositórios
científicos e de admitir a sua cópia e distribuição com objectivos educacionais ou de
investigação, não comerciais, desde que seja dado crédito ao autor e editor.


v
Acknowledgments
This dissertation represents an important step towards a transition phase in my life and there are
several people to whom I have to say thank you for all the help and support given.
On top of all, I want to thank my mother, Isabel. There are no words to describe how your love and
support was important to me through all my life and during this particularly hard period. You made
all of this possible, and I have to thank you for that. I also want to thank my sister Ana for always
being there for me and for being so supportive, and to my brother-in-law, João, for his help too. A
very special thank you to my grandparents, Maria José and José, who also made my education
possible and always strived to give me the best support they could.
A special word to all my close friends for your patience when I was more upset or simply without
time to pay you more attention, and also for all your help!
The last thank you in this section, however one of the most important ones, goes to Filipe. Thank
you for your endless support and for the strength you gave me, without you this would have been
much harder to accomplish.
Now in the academic field, I have to thank all my university teachers, you were the ones who
guided me through this path and all of you gave a special contribution to my knowledge. A very
special thank you to Rui Santos, the teacher who guided me through this dissertation and gave me
all the help that I could ask for, it was a pleasure to work with you.
I would like to thank Giorgio Kallis, since he was the one who, without knowing, inspired me to work
on this theme and afterwards also gave a little help on choosing the specific field for my
dissertation. I would also like to thank Gualter Baptista for the bibliography that he provided me
and, finally, a big thank you to my cousin, Luís Malcato, for taking the time to read and review my
work.


vii
Agradecimentos
Esta dissertação representa um passo importante para uma fase de transição na minha vida e há
várias pessoas às quais tenho de dizer obrigada por todo a ajuda e apoio dado.
Acima de tudo, queria agradecer à minha mãe, Isabel. Não há palavras para descrever como o teu
amor e apoio foram importantes para mim durante toda a minha vida e durante este período
particularmente difícil. Fizeste com que tudo isto fosse possível, e tenho que te agradecer por isso.
Quero também agradecer à minha irmã Ana por estar sempre presente para mim e me dar tanto
apoio, assim como ao meu cunhado, João, também pela sua ajuda. Um agradecimento muito
especial também para os meus avós, Maria José e José, que também possibilitaram a minha
educação e sempre lutaram para me dar o melhor apoio que puderam.
Uma palavra especial para todos os meus amigos mais próximos pela vossa paciência quando
estava mais chateada ou simplesmente sem tempo para vos dar mais atenção, e também por toda
a vossa ajuda!
O último agradecimento nesta secção, porém um dos mais importantes, vai para o Filipe. Obrigada
pelo teu apoio inesgotável e por toda a força que me deste, sem ti este trabalho teria sido muito
mais difícil de concretizar.
Agora no campo académico, tenho de agradecer a todos os meus professores universitários,
foram vocês que me guiaram ao longo deste caminho e todos deram uma contribuição especial
para o meu conhecimento. Um agradecimento muito especial para Rui Santos, o professor que me
guiou na elaboração desta dissertação e deu-me toda a ajuda que eu poderia pedir, foi um prazer
trabalhar consigo.
Gostaria também de agradecer a Giorgio Kallis, visto que foi ele que, sem saber, me inspirou a
trabalhar neste tema e depois também deu uma pequena ajuda na escolha da área específica
para a dissertação. Também quero agradecer a Gualter Baptista pela bibliografia que me
dispensou e, finalmente, um grande obrigado para o meu primo, Luís Malcato, por se ter
disponibilizado para ler e rever o meu trabalho.

ix
Abstract
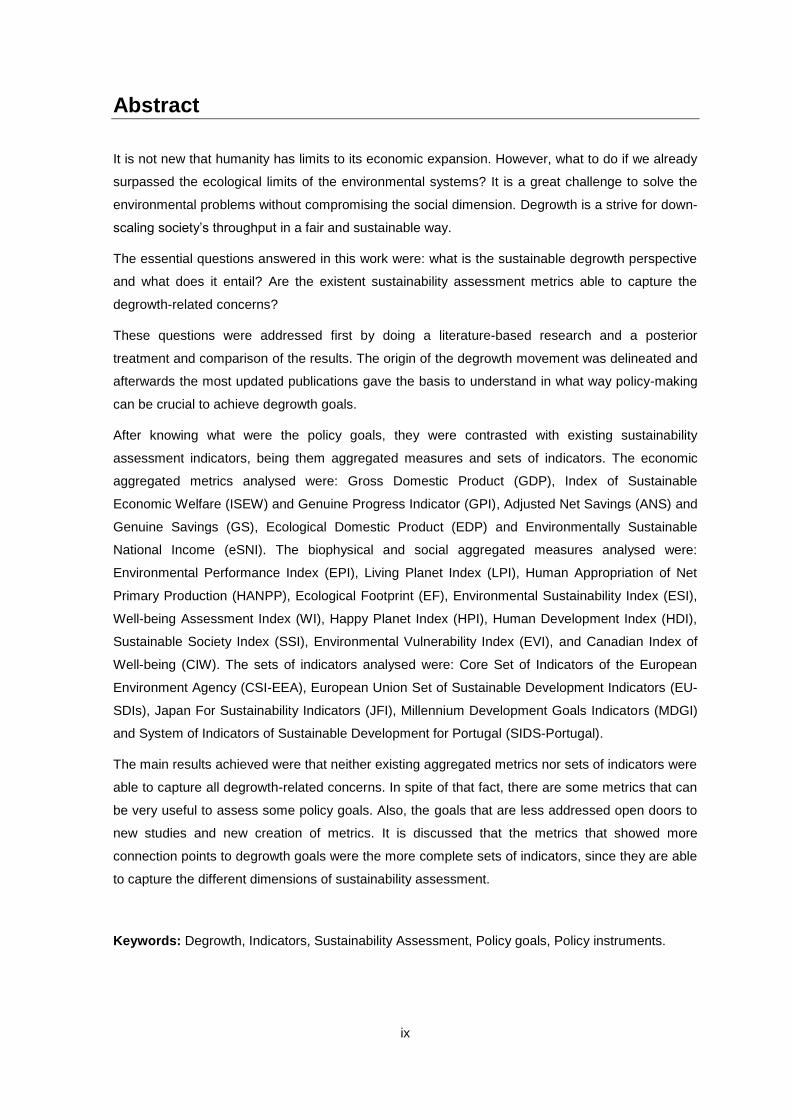
It is not new that humanity has limits to its economic expansion. However, what to do if we already
surpassed the ecological limits of the environmental systems? It is a great challenge to solve the
environmental problems without compromising the social dimension. Degrowth is a strive for down-
scaling society’s throughput in a fair and sustainable way.
The essential questions answered in this work were: what is the sustainable degrowth perspective
and what does it entail? Are the existent sustainability assessment metrics able to capture the
degrowth-related concerns?
These questions were addressed first by doing a literature-based research and a posterior
treatment and comparison of the results. The origin of the degrowth movement was delineated and
afterwards the most updated publications gave the basis to understand in what way policy-making
can be crucial to achieve degrowth goals.
After knowing what were the policy goals, they were contrasted with existing sustainability
assessment indicators, being them aggregated measures and sets of indicators. The economic
aggregated metrics analysed were: Gross Domestic Product (GDP), Index of Sustainable
Economic Welfare (ISEW) and Genuine Progress Indicator (GPI), Adjusted Net Savings (ANS) and
Genuine Savings (GS), Ecological Domestic Product (EDP) and Environmentally Sustainable
National Income (eSNI). The biophysical and social aggregated measures analysed were:
Environmental Performance Index (EPI), Living Planet Index (LPI), Human Appropriation of Net
Primary Production (HANPP), Ecological Footprint (EF), Environmental Sustainability Index (ESI),
Well-being Assessment Index (WI), Happy Planet Index (HPI), Human Development Index (HDI),
Sustainable Society Index (SSI), Environmental Vulnerability Index (EVI), and Canadian Index of
Well-being (CIW). The sets of indicators analysed were: Core Set of Indicators of the European
Environment Agency (CSI-EEA), European Union Set of Sustainable Development Indicators (EU-
SDIs), Japan For Sustainability Indicators (JFI), Millennium Development Goals Indicators (MDGI)
and System of Indicators of Sustainable Development for Portugal (SIDS-Portugal).
The main results achieved were that neither existing aggregated metrics nor sets of indicators were
able to capture all degrowth-related concerns. In spite of that fact, there are some metrics that can
be very useful to assess some policy goals. Also, the goals that are less addressed open doors to
new studies and new creation of metrics. It is discussed that the metrics that showed more
connection points to degrowth goals were the more complete sets of indicators, since they are able
to capture the different dimensions of sustainability assessment.
Keywords: Degrowth, Indicators, Sustainability Assessment, Policy goals, Policy instruments.

xi
Resumo
Não é novidade que a expansão económica da humanidade tem limites. No entanto, o que fazer
se já tivermos ultrapassado os limites ecológicos dos sistemas ambientais? É um grande desafio
resolver os problemas ambientais sem comprometer a dimensão social. O decrescimento é uma
iniciativa para diminuir a escala do fluxo de actividade da sociedade, de uma forma justa e
sustentável.
As questões essenciais a que este trabalho deu uma resposta foram: qual é a perspectiva do
decrescimento sustentável e o que é que envolve? Serão as métricas de avaliação de
sustentabilidade capazes de apreender as preocupações relativas ao decrescimento?
Estas questões foram abordadas primeiramente fazendo uma pesquisa de literatura e um posterior
tratamento e comparação de resultados. A origem do movimento do decrescimento foi traçada e
depois, as publicações mais actualizadas serviram de base para perceber de que forma a
construção de políticas pode ser crucial para atingir os objectivos do decrescimento.
Após saber quais os objectivos do decrescimento, estes foram contrastados com os indicadores
de avaliação de sustentabilidade existentes, sendo estes medidas agregadas e grupos de
indicadores. As medidas económicas agregadas analisadas foram: Produto Interno Bruto, Índice
de Bem-estar Económico Sustentável e Indicador Genuíno de Progresso, Poupanças Líquidas
Ajustadas e Poupanças Genuínas, Produto Interno Ecológico e o Rendimento Nacional
Ambientalmente Sustentável. As medidas biofísicas e sociais agregadas analisadas foram: Índice
de Desempenho Ambiental, Índice Planeta Vivo, Apropriação Humana da Produção Primária
Líquida, Pegada Ecológica, Índice de Sustentabilidade Ambiental, Índice de Avaliação do Bem-
estar, Índice Planeta Feliz, Índice de Desenvolvimento Humano, Índice da Sociedade Sustentável,
Índice da Vulnerabilidade Ambiental e o Índice Canadiano de Bem-estar. Os grupos de indicadores
analisados foram: Indicadores-chave da Agência Europeia do Ambiente, Indicadores de
Desenvolvimento Sustentável da União Europeia, Indicadores da Organização Japão para a
Sustentabilidade, Indicadores dos Objectivos de Desenvolvimento do Milénio e o Sistema de
Indicadores de Desenvolvimento Sustentável de Portugal.
Os resultados principais atingidos foram que nem as métricas agregadas existentes nem os
grupos de indicadores são capazes de capturar todas as preocupações ligadas ao decrescimento.
Apesar desse facto, existem algumas métricas que podem ser muito úteis para avaliar alguns
objectivos de políticas. Da mesma forma, os objectivos que estão menos abordados abrem portas
para novos estudos e para a criação de novas métricas. É discutido que as métricas que mostram
mais pontos de conexão com os objectivos do decrescimento, são os grupos de indicadores mais
completos, visto que são capazes de apreender as diferentes dimensões da avaliação de
sustentabilidade.
Palavras-chave: Decrescimento, Indicadores, Avaliação de Sustentabilidade, Objectivos de
política, Instrumentos de política.

xiii
Index of subjects
Chapter 1. Introduction .................................................................................................................... 1
1.1. Context of the research theme ........................................................................................... 1
1.2. Personal motivation ............................................................................................................ 2
1.3. Purpose and objectives ...................................................................................................... 3
1.4. Framework of the dissertation ............................................................................................ 3
Chapter 2. From limits to growth to sustainable degrowth ......................................................... 5
2.1. Limits to growth .................................................................................................................. 5
2.2. The evolution of the sustainability concept ........................................................................ 6
2.3. Economic growth versus sustainable development ........................................................... 8
2.4. Sustainable degrowth hypothesis ..................................................................................... 11
2.4.1. Emergence of the idea ................................................................................................. 11
2.4.2. The divergence of opinions around degrowth .............................................................. 13
2.5. Transition to a Steady-State Economy (SSE) .................................................................. 20
Chapter 3. Importance of the degrowth viewpoint in today’s and tomorrow’s society .......... 23
3.1. Economic crisis as an opportunity .................................................................................... 23
3.2. New demands in terms of policy-making and sustainability assessment ........................ 24
3.2.1. Sustainability goals for policy-making .......................................................................... 24
3.2.2. Important principles for policy-making .......................................................................... 27
3.2.3. Specific policy goals in a sustainable degrowth perspective........................................ 29
3.2.4. Degrowth policy goals versus sustainability goals for policy-making ........................... 40
Chapter 4. Sustainability assessment indicators and the degrowth concept ......................... 43
4.1. The importance of measuring and how can the existing indicators be used to assess
degrowth ....................................................................................................................................... 43
4.2. Existing economic aggregated metrics ............................................................................ 44
4.2.1. Gross Domestic Product (GDP) ................................................................................... 44
4.2.2. Index of Sustainable Economic Welfare/Genuine Progress Indicator (ISEW/GPI) ..... 46
4.2.3. Adjusted Net Savings or Genuine Savings (ANS or GS) ............................................. 49

xiv
4.2.4. System of Environmental-Economic Accounting (SEEA) – Green National Product or
Environmentally Adjusted Net Domestic Product or Ecological Domestic Product (GNP or
eaNDP or EDP) ......................................................................................................................... 50
4.2.5. Environmentally Sustainable National Income (eSNI; former SNI) .............................. 51
4.3. Existing biophysical and social aggregated metrics ......................................................... 51
4.3.1. Environmental Performance Index (EPI) ...................................................................... 51
4.3.2. Living Planet Index (LPI) .............................................................................................. 52
4.3.3. Human Appropriation of Net Primary Production (HANPP) ......................................... 53
4.3.4. Ecological Footprint (EF) .............................................................................................. 54
4.3.5. Environmental Sustainability Index (ESI) ..................................................................... 55
4.3.6. Well-being Assessment Index (WI) .............................................................................. 56
4.3.7. Happy Planet Index (HPI) ............................................................................................. 56
4.3.8. UN Human Development Index (HDI) .......................................................................... 57
4.3.9. Sustainable Society Index (SSI) ................................................................................... 58
4.3.10. Environmental Vulnerability Index (EVI) ................................................................... 59
4.3.11. Canadian Index of Well-being (CIW) ........................................................................ 59
4.4. Existing sets of indicators for assessing sustainable development ................................. 60
4.4.1. Core set of Indicators – European Environmental Agency (CSI-EEA) ........................ 60
4.4.2. European Union set of Sustainable Development Indicators (EU-SDIs) ..................... 61
4.4.3. Japan for Sustainability Indicators (JSI) ....................................................................... 62
4.4.4. Millennium Development Goals Indicators (MDGI) ...................................................... 62
4.4.5. System of indicators of sustainable development for Portugal (SIDS-Portugal) .......... 63
4.5. Recent proposes of new metrics ...................................................................................... 63
Chapter 5. What to measure about sustainable degrowth? ...................................................... 65
5.1. What the existing indicators do and do not measure ....................................................... 65
5.2. Analysis of the economic aggregated metrics .................................................................. 66
5.3. Analysis of the biophysical and social aggregated metrics .............................................. 68
5.4. Analysis of the sets of indicators ...................................................................................... 73
5.5. Analysis of O’Neil’s set of indicators ................................................................................ 75
xv
Chapter 6. Conclusions and future developments ..................................................................... 77
6.1. Synthesis of the work ....................................................................................................... 77
6.2. Future developments ........................................................................................................ 79
References ...................................................................................................................................... 81
Annexes ........................................................................................................................................... 89
Annex I – Analysed policy goals from sustainable degrowth-related literature ............................ 90
Annex II – Components of the metrics analysed .......................................................................... 95
Annex III – Classification of the metrics analysed and its justification ........................................ 114

xvii
Index of figures
Figure 2.1 Representation of the balancing needed for reaching a steady-state world economy
(source: Kerschner, 2010). ............................................................................................................... 21
Figure 3.1 Adopted methodology for the analysis of degrowth-related literature in this work. ........ 30
Figure 4.1 Income versus happiness growth in the USA, between 1945 and 2005 (source: Victor,
2008). ............................................................................................................................................... 46
Figure 4.2 ISEW/GPI versus GDP results for Netherlands, Germany, Australia and USA, between
1950 and 1997 (source: http://www.foe.co.uk). ................................................................................ 48
Figure 4.3 EPI scores for 2010 (source: http://epi.yale.edu/). .......................................................... 52
Figure 4.4 LPI values for the time period between 1970 and 2007 (source: WWF, 2010). ............. 53
Figure 4.5 Global ecological creditor and debtor countries in 2007, based on the EF of consumption
of each country versus globally available biocapacity (source: Ewing et al., 2010). ....................... 54
Figure 4.6 Worldwide ESI values for 2005 (source: Esty et al., 2005)............................................. 55
Figure 4.7 World HPI values for 2005 presented in a colour scale (source: Abdallah et al., 2009). 56
Figure 4.8 HDI values for 1970 in comparison to the values of 2010 (source: UNDP, 2010a). ...... 57
Figure 4.9 Worldwide values for SSI in 2010 (adapted from van de Kerk and Manuel, 2010). ....... 58
Figure 4.10 Comparison between GDP and CIW trends (and of its components) from 1994 to 2008
(source: Michalos et al., 2011). ........................................................................................................ 60
Figure 4.11 The three-level pyramid structure of EU-SIDs (source: EC, 2011). .............................. 61
Figure 4.12 Conceptual framework on which is based O’Neill’s work (source: O’Neill, 2011). ....... 64
Figure 4.13 O’Neill’s potential set of indicators to measure degrowth transition to a SSE (source:
O’Neill, 2011). ................................................................................................................................... 64

xix
Index of tables
Table 2.1 Review of contributions for degrowth research – group A. .............................................. 16
Table 2.2 Review of contributions for degrowth research – group B. .............................................. 17
Table 2.3 Review of contributions for degrowth research – group B (continuation). ....................... 18
Table 2.4 Review of contributions for degrowth research – group C. .............................................. 19
Table 2.5 Review of contributions for degrowth research – group D. .............................................. 20
Table 3.1 Review of the main goals and their connection to specific ones through degrowth-related
literature analysis. ............................................................................................................................ 31
Table 3.2 Mentioned measures/policy instruments in the publications reviewed for Goal 1. .......... 32
Table 3.3 Mentioned measures/policy instruments in the publications reviewed for Goal 2. .......... 33
Table 3.4 Mentioned measures/policy instruments in the publications reviewed for Goal 3. .......... 34
Table 3.5 Mentioned measures/policy instruments in the publications reviewed for Goal 4. .......... 35
Table 3.6 Mentioned measures/policy instruments in the publications reviewed for Goal 5. .......... 36
Table 3.7 Mentioned measures/policy instruments in the publications reviewed for Goal 6. .......... 37
Table 3.8 Mentioned measures/policy instruments in the publications reviewed for Goal 7. .......... 39
Table 3.9 Comparison between degrowth policy goals and their general aim towards sustainability.
.......................................................................................................................................................... 40
Table 3.10 Comparison between degrowth policy goals and their general aim towards sustainability
(continuation). ................................................................................................................................... 41
Table 4.1. Comparison between the components of ISEW and GPI (based on information from
Talberth et al., 2006 and Beça and Santos, 2010)........................................................................... 47
Table 5.1 Comparison between degrowth policy goals and economic aggregated metrics. ........... 67
Table 5.2 Comparison between degrowth policy goals and biophysical and social aggregated
metrics (EPI, LPI, HANPP, EF and EVI). ......................................................................................... 69
Table 5.3 Comparison between degrowth policy goals and biophysical and social aggregated
metrics (EPI, LPI, HANPP, EF and EVI - continuation). .................................................................. 70
Table 5.4 Comparison between degrowth policy goals and biophysical and social aggregated
metrics (ESI, HPI, HDI, SSI, WI and CIW). ...................................................................................... 71
Table 5.5 Comparison between degrowth policy goals and biophysical and social aggregated
metrics (ESI, HPI, HDI, SSI, WI and CIW - continuation). ............................................................... 72
Table 5.6 Comparison between degrowth policy goals and the sets of indicators. ......................... 74

xx
Table 5.7 Comparison between degrowth policy goals and the system of indicators proposed by
O’Neill (2011).................................................................................................................................... 75
Table 5.8 Comparison between degrowth policy goals and the system of indicators proposed by
O’Neill (2011) (continuation). ............................................................................................................ 76

xxi
List of Abbreviations and Acronyms
ANS Adjusted Net Savings
APA Agência Portuguesa do Ambiente (Portuguese Environmental Agency)
CIW Canadian Index of Well-being
CSI-EEA Core Set of Indicators of the European Environment Agency
EC European Commission
EDP Ecological Domestic Product
EEA European Environmental Agency
EEA European Environment Agency
EF Ecological Footprint
EPI Environmental Performance Index
ESI Environmental Sustainability Index
eSNI Environmentally Sustainable National Income
EU European Union
EU SDIs European Union set of Sustainable Development Indicators
EU SDS European Union Sustainable Development Strategy
Eurostat Statistical office of the European Union
EVI Environmental Vulnerability Index
GDP Gross Domestic Product
GPI Genuine Progress Indicator
GS Genuine Savings
HANPP Human Appropriation of Net Primary Production
HDI Human Development Index
HPI Happy Planet Index
IMF International Monetary Fund
ISEW Index of Sustainable Economic Welfare
JFS Japan For Sustainability
JSI Japan For Sustainability Indicators
LPI Living Planet Index

xxii
MDGI Millennium Development Goals Indicators
NDP Net Domestic Product
NI National Income
NNI Net National Income
NPP Net Primary Product
OECD Organisation for Economic Co-operation and Development
SIDS-PT Sistema de Indicadores de Desenvolvimento Sustentável de Portugal (System of Indicators of Sustainable Development for Portugal)
SNA System of National Accounts
SSE Steady-state economy
SSI Sustainable Society Index
UN United Nations
UNDP United Nations Development Program
UNEP United Nations Environmental Program
WB The World Bank
WCED World Commission on Environment and Development
WI Well-being Index
WWF World Wide Fund for Nature


Introduction
1
Chapter 1. Introduction
1.1. Context of the research theme
The world is far behind from being managed in a sustainable way. Although the gap between
social, economic and environmental concerns is getting increasingly smaller, when a serious
problem with the economic system bursts, the other two issues are usually neglected in favour of
the strive for more economic growth. The most echoed words in the last few years were probably
‘economic crisis’ since that affected almost everyone directly and in a relatively short period of time
– and it still does. Particularly in recession periods, environmental problems are often seen almost
as ‘luxuries’ that we can address in the case we have spare time and funds. However, the
environmental crisis which we are experiencing is not disconnected from the rest of our lives, and
so it cannot be put into a shelf for later trouble while we only deal with the turmoil that surrounds
global economy. In fact, instead of being afraid of a change in our lifestyles due to crossing a
period where people have less money to spend, we should see that as an opportunity for going
back to being used to a less materialistic lifestyle.
An economic crisis is very useful for us to understand what our real priorities are. And this does not
necessarily mean that we choose our next step more carefully since we are limited with the budget.
Many people choose it more wisely as they fear what is going to happen next, since in these
unstable times we never know. Our current panorama is filled with fast changes, what helps to
show us that today’s reality might not be the mirror to tomorrow’s reality. But why do we subject
ourselves to this way of unstable living? Some things must change and as fast as possible.
Environmental problems might not have been very problematic in the distant past but they are
increasingly becoming great threats in many ways. Climate change is a very serious issue that is
not being taken care of as it should be by now, after all the failed attempts to get to a global
agreement. All the complex interactions between human-related activities and the environment are
opening doors to climate instability, biodiversity loss and the overall depletion of crucial natural
resources for our survival. Apart from all the ethical issues that arise due to our greed on
consuming and destroying all that we can, severe threats to our survival start being noticed with the
imminent food and water crisis. These problems along with natural catastrophes lead to massive
deaths, more hunger and more wars. Environmental-related issues might very soon turn into global
security issues. And as in a period of economic crisis, here too the poorest will suffer first and in a
more sever way. In the end, the puzzle to solve is always the same: how can we improve the
visibility of “long-term” problems when they are invisible to almost everyone until the day they
burst?
The key factor for solving this problem is only fully obtained by a massive change of minds and
priorities. This means turning the economy less dependent on fossil fuels, progressing in an ethical
and equal way, supporting developing countries to develop in an ecological path and, in the overall,

Introduction
2
striving for the enjoyment of life, decoupling it from the current overconsumption patterns. All of
these goals are a part of what sustainable degrowth means.
The scale of the economy turned bigger than we can afford within earth’s ecological limits, and so
to degrowth is evermore the only chance to achieve a sustainable way of development, since the
decoupling between economic growth and environmental damages is definitely not happening. This
means that any kind of strive for a ‘green growth’ is very unlikely to be successful in solving the
environmental and social problems.
Although economic degrowth is already occurring with the world economy, it is not occurring in a
sustainable way as intended. This shows that degrowth pursuance can have severe
consequences, unless it is turned into a manageable opportunity for change. It is important to
stress that a necessary sustainable degrowth of the scale of human influence is ultimately to
improve our life quality without putting in jeopardy the health of the environment.
All of this should make sense when one realises that a finite world can only support a limited
economic system. Nonetheless, it seems that for many this still does not make any sort of sense,
as the endeavour for ‘the more, the better’ continues to persist. Ultimately, what it does seem in
fact is that we do not have a clue of “how big can the economy possibly be before it overwhelms
and destroys the ecosystem in the short run” but apparently we have globally decided “to do an
experiment to answer that question empirically” (Daly in Jackson, 2009, p.xii).
In spite of some authors consider the sustainable degrowth movement as a sort of ‘wake-up call’, it
can also be interpreted as a more defined concept that already has many policy concerns behind it.
Policy-making is a strategic area for research since it turns ideas into possible solutions.
Nonetheless, and as obvious as it may sound, it is worth to reinforce the idea that it is crucial to
know where we are heading, what are the policy goals. Sustainability was since the beginning the
fight for a global state of welfare that does not compromise the future generation’s possibility of
welfare. Even if the sustainable degrowth movement is trying to show a different meaning of
sustainable development, in fact there is nothing wrong with this goal. The progressively more
utopic idea is that we are going to achieve it with a never-ending growing economy.
1.2. Personal motivation
Living in an era that is marked by the rapid technological evolution, where a gadget goes from
cutting-edge to outdated in a short period of time, by the still neglected concern of a climate and a
biodiversity crisis, by one more economic crisis that is widening the gap between rich and poor
people and putting the world at risk of a social collapse, inspired me to question our current
patterns of development. Already bearing these concerns in mind, the sustainable degrowth
perspective caught my attention, as it seemed a very pertinent and topical subject that needs much
more research and vocalization for being understood its crucial importance in the current days.
Introduction
3
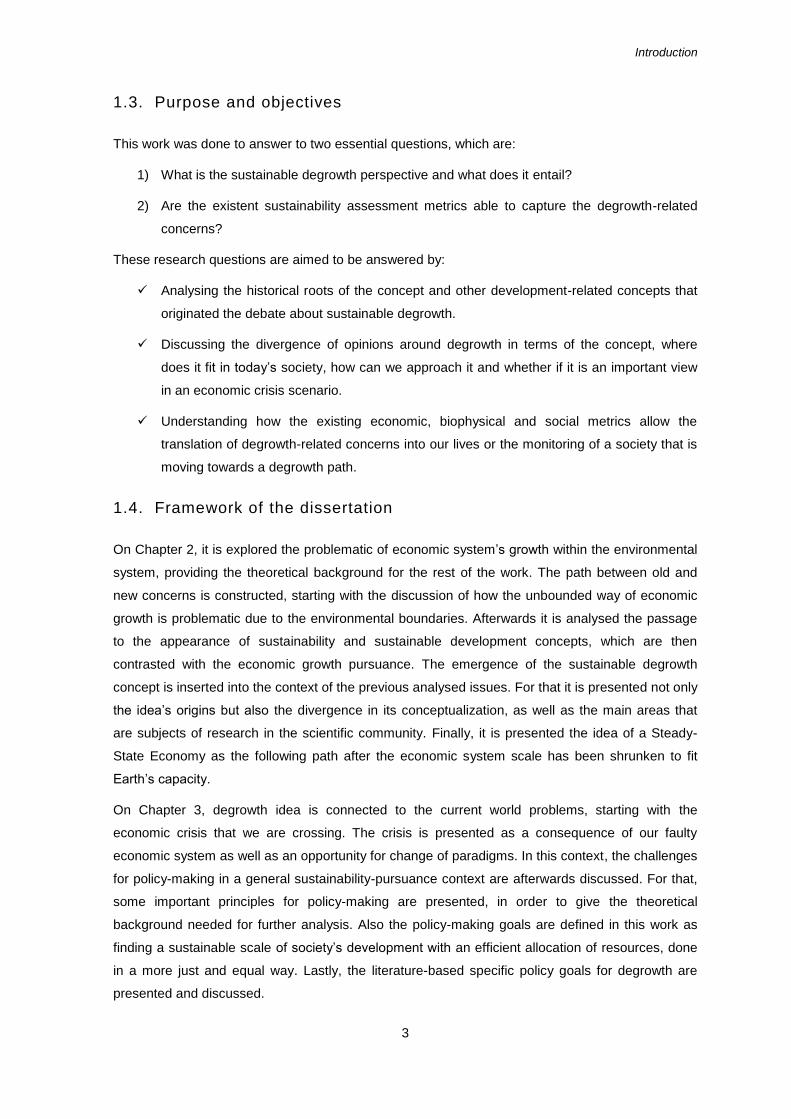
1.3. Purpose and objectives
This work was done to answer to two essential questions, which are:
1) What is the sustainable degrowth perspective and what does it entail?
2) Are the existent sustainability assessment metrics able to capture the degrowth-related
concerns?
These research questions are aimed to be answered by:
Analysing the historical roots of the concept and other development-related concepts that
originated the debate about sustainable degrowth.
Discussing the divergence of opinions around degrowth in terms of the concept, where
does it fit in today’s society, how can we approach it and whether if it is an important view
in an economic crisis scenario.
Understanding how the existing economic, biophysical and social metrics allow the
translation of degrowth-related concerns into our lives or the monitoring of a society that is
moving towards a degrowth path.
1.4. Framework of the dissertation
On Chapter 2, it is explored the problematic of economic system’s growth within the environmental
system, providing the theoretical background for the rest of the work. The path between old and
new concerns is constructed, starting with the discussion of how the unbounded way of economic
growth is problematic due to the environmental boundaries. Afterwards it is analysed the passage
to the appearance of sustainability and sustainable development concepts, which are then
contrasted with the economic growth pursuance. The emergence of the sustainable degrowth
concept is inserted into the context of the previous analysed issues. For that it is presented not only
the idea’s origins but also the divergence in its conceptualization, as well as the main areas that
are subjects of research in the scientific community. Finally, it is presented the idea of a Steady-
State Economy as the following path after the economic system scale has been shrunken to fit
Earth’s capacity.
On Chapter 3, degrowth idea is connected to the current world problems, starting with the
economic crisis that we are crossing. The crisis is presented as a consequence of our faulty
economic system as well as an opportunity for change of paradigms. In this context, the challenges
for policy-making in a general sustainability-pursuance context are afterwards discussed. For that,
some important principles for policy-making are presented, in order to give the theoretical
background needed for further analysis. Also the policy-making goals are defined in this work as
finding a sustainable scale of society’s development with an efficient allocation of resources, done
in a more just and equal way. Lastly, the literature-based specific policy goals for degrowth are
presented and discussed.
Introduction
4
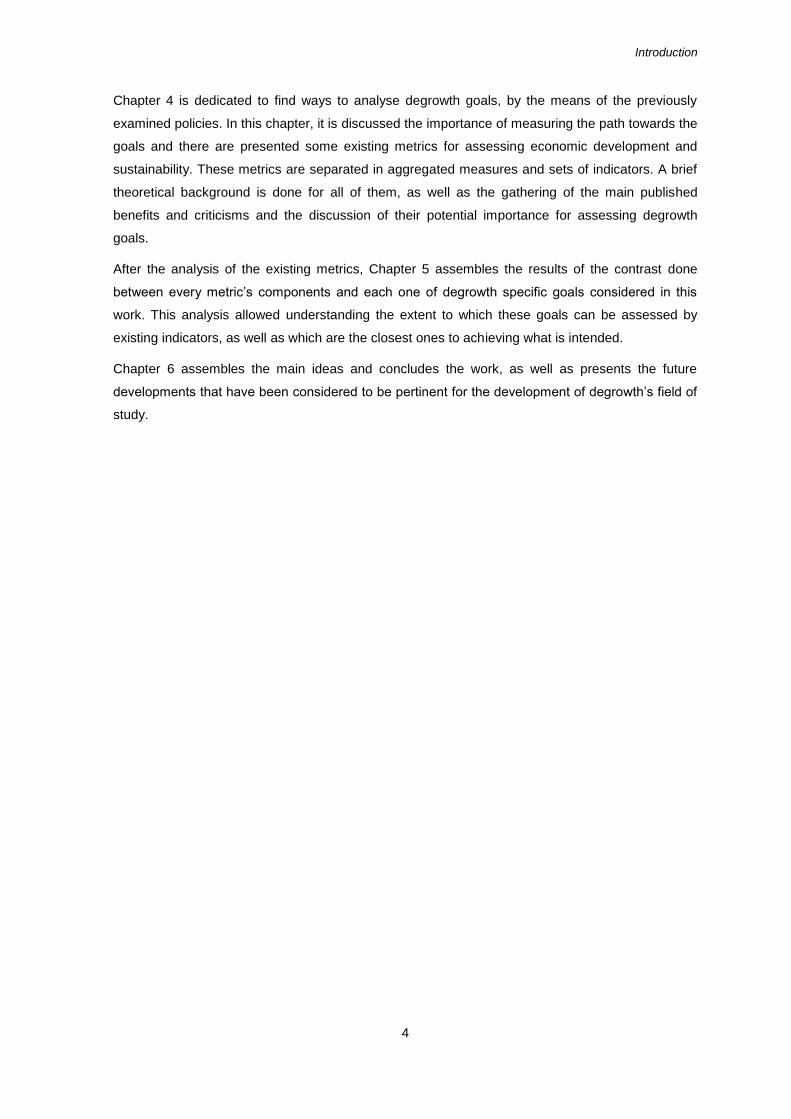
Chapter 4 is dedicated to find ways to analyse degrowth goals, by the means of the previously
examined policies. In this chapter, it is discussed the importance of measuring the path towards the
goals and there are presented some existing metrics for assessing economic development and
sustainability. These metrics are separated in aggregated measures and sets of indicators. A brief
theoretical background is done for all of them, as well as the gathering of the main published
benefits and criticisms and the discussion of their potential importance for assessing degrowth
goals.
After the analysis of the existing metrics, Chapter 5 assembles the results of the contrast done
between every metric’s components and each one of degrowth specific goals considered in this
work. This analysis allowed understanding the extent to which these goals can be assessed by
existing indicators, as well as which are the closest ones to achieving what is intended.
Chapter 6 assembles the main ideas and concludes the work, as well as presents the future
developments that have been considered to be pertinent for the development of degrowth’s field of
study.
From limits to growth to sustainable degrowth
5
Chapter 2. From limits to growth to sustainable degrowth
2.1. Limits to growth
It is not new that humanity is entirely dependent on natural resources and that we might experience
a limit to our unbridled way of growing. As soon as 1798, Thomas R. Malthus started to direct his
work towards this issue. When he wrote the book An Essay on the Principle of Population (Malthus,
1798), Malthus already knew that it seemed impossible to chase an infinite goal of growth and he
started to reflect about “whether man shall henceforth start forwards with accelerated velocity
towards illimitable, and hitherto unconceived improvement; or be condemned to a perpetual
oscillation between happiness and misery, and after every effort remain still at an immeasurable
distance from the wished-for goal” (Malthus, 1798, p.3). In other words, with this economic growth
path we will always be wavering between a period of economic crisis and a period of relatively
increased wealth, without having a very logical goal for growing.
While Malthus concerns were pointed towards the lack of food supply, in 1865 W. Stanley Jevons
was discussing the problematic of coal supply for the future as it was the great driving force of the
economy, just as oil is today (Victor, 2008). In his book, The Coal Question (Jevons, 1865), Jevons
expressed his concerns about the future of the British economy as the most prosperous economy
of the world at the time, due to the possible shortage of cheap coal that was coming from their own
mines (Victor, 2008).
Almost a century after, these worries were far from being forgotten. In 1963, Harold J. Barnett and
Chandler Morse published a study called Scarcity and Growth (Barnett & Morse, 1963), which
reviewed the inflated-adjusted prices and costs of natural resources traded in the United States in a
period of approximately 87 years (1970-1957) (Victor, 2008). With this study, they concluded that
economic growth was not threatened by the scarcity of the resources assessed, nor it was a threat
in the future. This study influenced the way economists thought at the time and opened the door for
the debate. That discussion lead to the publication of the books Scarcity and Growth Reconsidered
(V. K. Smith, 1979), a compilation of papers showing various viewpoints on the subject and, more
recently, Scarcity and Growth Revisited (Simpson et al., 2005). In the last review of this subject, the
authors analyse the evolution of the concerns of the first book and go further into the ‘new’
concerns with not only the natural resources assessed but also with the potential threats to
ecological services and other goods not included at the time.
However, it was in 1972 with the publication of Limits to Growth (D. H. Meadows et al., 1972) - the
first report of the Club of Rome1 - that this problematic was put into focus at a global level. With this
report, a group of experts wanted people to become aware of the fact that our planet has limitations
in terms of natural resources and in terms of the capacity to absorb emissions from our processes
1 The Club of Rome was founded in 1968 with the purpose of associating people from various fields such as
politics, business and science to discuss the future of the planet and of the humanity (www.clubofrome.org).

From limits to growth to sustainable degrowth
6
of transformation of land and materials. With the help of a computer model named “World3”, they
constructed scenarios for the following years, having in consideration population growth and
economic expansion. The conclusion achieved was that this human-related expansion would
gradually force us to spend more and more money on fighting earth’s limits or covering the
damages we made (D. H. Meadows et al., 2004). With this constant growth that humanity pursues,
the money we spent would get to a point where economic growth would be impossible to withstand.
Moreover, the material and energy sources are becoming much more expensive to explore, the
sinks (air, water and land) are already surpassing their limits and the ecosystems’ services are
deteriorating (Victor, 2008).
This would eventually lead to a decline in population what, without any planning, would occur along
with health issues, great inequalities, ecological collapse and social conflicts. This point is referred
as the point of overshoot and there are mentioned three causes for reaching it: a growth phase,
followed by getting to a limit which is foreseen that, if crossed, the system may not be able to
continue stable and finally, the phase of crossing that limit due to misperceptions and the struggle
to maintain the system inside its limits (D. H. Meadows et al., 2004).
These types of studies are still being done, and the sequels of the first Limits to Growth continue to
be published in order to update readers with further results of the research in every ten years,
approximately – Beyond the Limits (D. H. Meadows et al., 1992); The Limits to Growth: The 30-
Year update (D. H. Meadows et al., 2004). The most recent approach to this book, although not by
the same authors, was the publication of the book The Limits to Growth Revisited (Bardi, 2011) that
occurred last year.
2.2. The evolution of the sustainability concept
The term sustainability appeared with the increasing concerns with the environmental degradation
and with the limits our development is starting to experience. Along the years, it became more and
more important to give prominence to the balance between social, economic and environmental
issues.
Historically speaking, there are six lines of thought that appeared mainly after 1950 and lead to the
creation of the concept (Kidd, 1992). According to Kidd (1992) the most important root is the
ecology field discussion about how the human development-related activities would conduct to
sever consequences. This debate revolved around the concept of carrying capacity, the capacity
that a certain ecosystem has to support an indefinitely quantity of species, letting seasonal and
random alterations occur without environmental degradation and without retreating that capacity in
the future (Hardin, 1977; Kidd, 1992). When that maximum is exceeded, we call it overpopulation
and the number of individuals will tend to return to that maximum or below it, by the means of
several happenings (Kidd, 1992).
Other root is the emergent concern with resource uses and the environment and the discussions
about limits to development and growth. In the end of the 1960’s and throughout the 1970’s the
From limits to growth to sustainable degrowth
7
great preoccupation was about the quality of the environment and social pressure started to take
place in response to population’s frustration with the capitalist movement (Kidd, 1992). These
concerns were particularly common to the Western Europe countries and Japan, which led to the
organization of the first international conference on environmental issues, the Conference on the
Human Environment, which took place in Stockholm in 1972 (Kidd, 1992; Paul, 2008). This
conference focused the discussions on the conflicts between the priorities that we should give to
environment versus economic issues and also generated the United Nations Environmental
Program (UNEP), with the mission of leading humanity to improve the life quality without
threatening future generations (Paul, 2008).
A third root is referent to the awareness of the global scale of environmental problems. One of the
first authors to refer this was George P. Marsh in 1864 (Marsh, 1864), who wrote that the scale of
human influence was no more local but global (Kidd, 1992). However, the first author to focus that
the present generations have the moral responsibility to allow that the future ones have, in fact, a
future, was probably Nathanial Shaler in 1905 (Shaler, 1905; Kidd, 1992).
Another root is the criticism of technological progress. The historical origin of this movement
belongs probably to Henry David Thoreau, an American author who fervently criticized
development, as it can be seen in his book named Walden (Thoreau, 1957). Nevertheless, it was
only between the 1960’s and 1970’s that negative consequences of broad technology exportation
to developing countries were highlighted as, frequently, the projects were not designed to avoid
ecological implications on their implementation (Kidd, 1992). In contrast, technological progress in
developing countries was argued, by some authors (e.g. (Schumacher, 1973), as being an
important question when done in a moderate, ecological responsible way and also if adaptable to
their economic and social panorama (Kidd, 1992).
The movement against economic growth or in defence of a slower growth is also a root of the
sustainability concept, as the main discussion is around whether wealth is supposed to be the main
goal for human development or not (Kidd, 1992). Nonetheless, this root will be further explored on
a next sub-chapter.
Finally, the last root is considered by Kidd (1992) to be the ‘ecodevelopment’ emergence. This term
was created by Ignacy Sachs in 1977 as he aimed to take the development concept to a next level,
where social and economic issues would be managed in an ecological responsible way, in order to
protect the future for upcoming generations. On the year after, UNEP used the word ‘sustainability’
for the first time in the United Nations (UN) context having the ecodevelopment concept in mind.
Sachs also influenced many other authors, for instance, Robert Riddell, that published in 1981 his
own approach on the so-called ecodevelopment (Riddell, 1981), arguing that we should fight
poverty and hunger, seek for international equity and for political and administrative honesty while
also balancing the number of people with resource availability, among other things.
Despite all this approaches to the complex relationship between human development and
environment protection, it was not before 1987 that the ‘sustainable development’ most famous
concept appeared, result of the publication of the Brundtland Report - Our Common Future
From limits to growth to sustainable degrowth
8
(WCED, 1987a). This report was the outcome of the 1972 Conference on the Human Environment
results. This concept translates the same ideas that evolved along the past centuries by defining it
as a development that assures “the needs of the present without compromising the ability of future
generations to meet their own needs” (WCED, 1987b).
In 1992, Rio de Janeiro welcomed the UN Conference on Environment and Development, also
known as Rio Earth Summit. This was a major event on the ‘sustainability’ scene, producing as
results the Rio Declaration, Agenda 21 and the Commission on Sustainable Development, and
thus giving a key importance to sustainable development of world’s nations and launching the
concept to a truly international level (Paul, 2008).
The following milestone in the concept’s evolution was probably the agreement of the Millennium
Development Goals in the 2000 Millennium Summit. These goals helped to mark what were some
of the humanitarian, economic and environmental priorities needed to get fixed by 2015. These
goals were reconfirmed and complemented in 2002 in the World Summit on Sustainable
Development, held in Johannesburg. The last time these were revised was in 2010 at the UN
Summit on the Millennium Development Goals, held in New York.
It is interesting to note that this concept is broadly accepted and still largely used in every sector
nowadays. It is believed that this acceptance has occurred because the concept was agreed and
published and has resisted to a single interpretation along the years (Dietz & Neumayer, 2007).
2.3. Economic growth versus sustainable development
The economic growth discourse is based on the premise that the more the better, i.e. the optimal
growth rate is the maximum possible rate (Spangenberg, 2010). The parallelism between the type
of development that we are pursuing and the one that it is in fact taken as sustainable may sound
contradictory in many ways. However, it is usual to talk about economic growth and sustainable
development in the same sentence, even though with barely any reference of how to intercept the
concepts. There is a clear negligence when it comes to present numbers, to define limits or the so-
called extremes for population growth or exploitation of resources, to connect the need to fight
climate change and the depletion of natural resources with the future of economic growth (Bartlett,
2006; Spangenberg, 2010).
In this context, it is argued that it will not be possible to pursue a sustainable economic growth due
to the contradiction of the concepts. Bartlett (2006) analysed the Brundtland report and argued that
the term ‘sustainable growth’ is an oxymoron. In his work, he concludes that pursuing this type of
growth points towards a limitless increase of the economy, i.e. tending to infinite, what it is
impossible to accompany with our finite earth.
Daly (2006) also argues about this contradiction, giving an interesting view of sustainable
development as we know it today. The author reflects about the typical definition of development as
growth in Gross Domestic Product (GDP) as well as about the hope that this growth will go to the
poor as well. The truth is that all development programs focus the need to fight poverty but the
From limits to growth to sustainable degrowth
9
policies that would help the redistribution of GDP are pointed out as deterrents of economic growth.
Moreover, welfare and poverty are essentially functions of relative income, what lead this author to
the conclusion that economic growth is, in fact, unable to increase the relative income of everyone
in the world what seems to be the goal of the policies.
Focusing on the environmental part of sustainability, Hueting (2010) presents several reasons for
the improbable combination of growth production/consumption and the improvement/maintenance
of environmental quality. The author argues that this combination would mean having available
technology which was clean enough, that did not require the depletion of renewable natural
resources and simultaneously found a way to substitute non-renewable ones, that did not have
impacts on the soil and did not limit its ecological uses and finally, this will all be worthless if this
technology is not cheaper than the current available ones. In these conditions, economic growth
would be occurring within its ecological limits, and so it would occur what can be called as ‘absolute
decoupling’, between economic output and material throughput. The decoupling can be relative or
absolute, being the first one the decline of environmental impacts relatively to GDP growth,
whereas the second one is the absolute decline of those impacts (Jackson, 2009). The relative
decoupling is not very interesting since it does not guarantee that impacts are really decreasing.
The absolute decoupling is not possible to achieve with present technology, however it is vital to
pursue it with or without the endeavour for economic growth (Jackson, 2009).
There are also other reasons pointed out by Hueting (2010) that sustain the contradiction of these
two principles. Among them we can find that production growth is affected by the increase of prices
due to the internalization of environmental costs. We can also find that in the calculation of National
Income (NI), the environmental burden is directly related to population size, and if on the one hand
we say that we have to decrease world’s population to pursue a sustainable way of development,
on the other hand we have the fact that if population diminishes, production will also be lower and
so it will be economic growth. Following these ideas is also Bartlett (2006), who defends that future
programs for development should plan ahead a scenario of zero, or even negative for a period,
growth of population and also of the rates of resources consumption, if they want to be called
sustainable. The author argues that it will be everyday more difficult to progress to sustainability
conditions if population continues to grow to feed economic growth.
As reasoned by Daly (2006), economic growth is in fact becoming “uneconomic”, meaning that
what we call economic growth is making us poorer instead of richer as we wanted to. This is due to
the fact that economic growth comprises throughput growth, i.e. an increase in the metabolic flow
that has raw materials as an input and waste as outputs (Daly & Farley, 2011). The direct
consequences of this are the depletion of natural resources (low-entropy sources) and the
degradation of the environmental sinks (high-entropy sinks). Being this flow measured with physical
units, the laws of the thermodynamics are useful to understand why is economic growth raising
costs faster than benefits. According to the First Law of Thermodynamics, matter and energy
cannot be created nor destroyed, what makes us understand that the inputs to our economic
system result in output, plus accumulation (Daly & Farley, 2011) or, in other words, outputs to
From limits to growth to sustainable degrowth
10
environmental systems and economic growth. According to the Second Law of Thermodynamics,
entropy always increases in an isolated system, i.e. the level of “randomization of the structure or
capacity of matter or energy to be useful to us” (Daly & Farley, 2011, p.32) continuously increases,
while the quantity of matter and energy stays equal. With this, one can claim that throughput is a
one-way flow, and despite materials can be recycled, energy cannot be recycled without spending
more energy (Daly & Farley, 2011). This makes no sense to do since it would always bring more
costs, and the economy cannot survive without recycling its outputs, since we are not able to use
waste as raw material as it was a perfect circular system where nothing is lost. When the economy
does not respect this recycling, when it uses inputs in an unmeasured way, the costs start to rise
faster than benefits.
Bearing this in mind, it can be observed that, at today’s rate, it seems that we want macroeconomy
to grow into an infinite, unreachable point, what also is in concordance with Bartlett’s viewpoint.
Nonetheless, in reality, macroeconomy has trespassed its limits and has created opportunity costs
of natural capital and ecological services, which are often more beneficial than the production
outputs that were their cause (although we cannot know that accurately since with GDP we only
measure benefits and not costs – see Chapter 4).
In this context, it can be easy to understand the need to limit this “uneconomic” growth in wealthy
countries in order to give poorer countries to pursue their still possible economic growth, an
ideology that emphasis development and growth as a global goal instead. Daly (2006) does an
interesting parallelism with the microeconomics line of thoughts. This author poses the question
that if in microeconomics one accepts that optimization is to only pursue growth until marginal cost
is equal to marginal benefit, why there is no translation of this to macroeconomics, why there are
no plans of a stopping point when it comes to economic growth of a country.
All of these viewpoints are focused on an economic growth as we know it today, i.e. without limits
and with higher consumption of goods and services to ‘feed the machine’, whether they bring good,
neutral or bad consequences for the environment and for social welfare. The question inherent to
this discussion is whether we want to destroy our natural resources now or later. As Bartlett (2006,
p.26) puts forward:
“Smart growth is better than dumb growth, but smart growth destroys the environment; and dumb
growth destroys the environment. The difference is that smart growth destroys the environment
with good taste. So it’s a little like buying a ticket on the TITANIC. If you’re smart you go first class.
If you’re dumb you go steerage. But either way, the result is about the same”.
Nonetheless, this is not the only line of opinions throughout the scientific community. Harris (2010)
disagrees that economic growth and the maintenance of good environmental conditions are
impossible goals to combine, at least for our current conditions. The author defends that one has to
consider that not all types of GDP growth are harmful for the environment and differentiate those of
increases in global consumption, which generally have that kind of impact. However, he also
argues that general GDP growth is already unaffordable on the developed world and still essential
on the developing one.

From limits to growth to sustainable degrowth
11
In his work, the author proposes a change in the macroeconomic system in order to differentiate
sectors in which we need to grow, the ones that have to stop growing and the ones that have to
experience a decline in their growth, for having already grown too much. The sectors that should
grow are pointed out as health, education, culture and activities that push forward energy and
resource conservation. The sectors that should have limitations to growth are consumption and
investments highly intensive in terms of resource exploitation and also infrastructures with high
rates of energy consumption. The sectors that should decline are related to the use of carbon-
intensive fuels.
Harris divides our economic model transition in two periods. The first one (roughly between 2010-
2050) contemplates an unavoidable period of economic growth, which he foresees as increases in
the sectors that should actually grow, what should put the rich North on the way of a transition to a
low-carbon, service-oriented economy and the poor South into an ascending growth path with
investments within a carbon-free and energy efficient focus. The second period (after 2050) is seen
as a possible beginning of a stable economy (see sub-chapter 2.5), where economic growth is
naturally not an important pressure anymore.
It is interesting to connect this last viewpoint with the sustainable degrowth view, that will be put on
more detail on the next sub-chapter. Even though Harris does not talk specifically about the
degrowth hypothesis, his proposal reaches many points argued by degrowth defenders. Harris
talks about the possible solution scenarios for surpassing the economic crisis that the failure of the
present economic model has put the world into, while degrowth is a movement that has basically
the same ideas but has the objective of launching the debate around economic growth and around
of how should be the future of sustainable development.
2.4. Sustainable degrowth hypothesis
2.4.1. Emergence of the idea
After a research in humanity’s development problematic, one can reach the conclusion that the
solution for our problems is yet to come. We are already experiencing limits to our development as
natural resources are becoming scarcer and our economic model is failing. We can now discuss
that the sustainable development concept defended so fervently in the two past decades may be a
contradictory theory and its goals will not be a reality if we do not change some of our old
paradigms.
In this context, the scientific community started to talk about an alternative suggestion to save our
existence, and that is the sustainable degrowth hypothesis. Although there is not an agreement on
the sustainable degrowth definition yet, some authors consider it as an emerging paradigm that will
go beyond the ‘sustainable development’ paradigm that appeared in the 1980s (Martínez-Alier et
al., 2010); others go further and consider it as a “political slogan” (Latouche, 2010) or as a “multi-
faceted political project” (Kallis, 2011).

From limits to growth to sustainable degrowth
12
There have been many efforts in defining this ‘new’ word, finding its different contexts and also
tracking the historical roots of the movement. Even though this movement has gained strength
relatively recently, its nomenclature can be due to Nicholas Georgescu-Roegen, the father of
ecological economics or “bioeconomics”, as the author defined it in 1977 (Gowdy & Mesner, 1998).
This author was a pioneer in the criticism of economic growth defended by most mainstream
economists, claiming that we should only use services that came from renewable resources
instead of using flows from depletable ones (Kerschner, 2010). Moreover, he defended that a
declining state was necessary and possible and also that we should focus on the “enjoyment of
life”, a central concept in the degrowth movement (Kerschner, 2010; Martínez-Alier et al., 2010).
The word ‘degrowth’ appeared due to the translation of the French word décroissance. In turn, the
French term appeared in the scientific community with the publication of the book Demain la
décroissance in 1979, a compilation of translated works of Georgescu-Roegen done by Ivo Rens
and Jacques Grinevald (Georgescu-Roegen, 1995). At this point, the key ideas behind this term
were that, on the one hand, degrowth was inevitable due to the limits of nature and, on the other
hand, human knowledge (technological progress) should be used to control degrowth rather than
be used to incentive growth, that will only lead to rising unemployment, to more inequality between
rich and poor countries and ultimately to an “irremediable disaster” (Georgescu-Roegen, 1995;
Fournier, 2008).
The degrowth movement has gained strength in France mostly because of the journals that spread
the word about it, namely Casseurs de pub, Silence, the Ecologist (French edition) and la
Décroissance (Baykan, 2007). Some publications helped to launch this discussion in the political
arena and some people that believed in this movement formed the Degrowth party (Parti pour la
Décroissance). This party has the objective of increasing the debates on this issue and playing its
part in the opposition, not exactly to seize power, whereas they also defend that this has to be a
bottom-up process to avoid authoritarian regimes (Baykan, 2007). This is seen as a new political
frame that will contest the conventional line of thoughts in political and social terms, while it may
rejuvenate the environmental issues in this context (Baykan, 2007).
It is important to notice that, on a current basis, the décroissance movement is highly connected
with politics whereas the term sustainable degrowth is mostly explored by ecological economics
(Martínez-Alier et al., 2010). This might give degrowth different meanings and goals but the main
ideas remain the same.
In spite of these differences, the first time this issue was brought to a broader, worldwide
discussion was at the “First International Conference on Economic De-growth for Ecological
Sustainability and Social Equity”, held in Paris between 18th and 19
th April of 2008
2. The conference
produced a Declaration that gathers the main conclusions that were reached during the various
panels and workshops: the increase of economic growth is not reducing poverty as expected, result
of the uneven exchange in trade and financial markets; economic growth is connected with more
2 Further information on the website of the conference: http://events.it-sudparis.eu/degrowthconference/en/.
From limits to growth to sustainable degrowth
13
consumption/production and, therefore, with a greater use of land, materials and energy; a better
efficiency does not imply a decrease in extraction of natural resources, production of waste or
emissions; there are limits to the scale of global production/consumption and to the scale of
national economies after whose there will be environmental and social costs and there are
evidences that show that global economy (especially the industrialised North) has already
surpassed those limits; the richer countries use more than their reasonable portion of natural
resources, what causes a negative impact to poorer countries; we have to find ways to balance the
global economic activity with the natural boundaries and redistribute the wealth to avoid negative
social impacts and an uncontrolled economic recession or collapse (Research & Degrowth, 2010).
The second reunion of the scientific community with activists and other participants took place in
Barcelona between 26th
and 29th March of 2010 at the “Second Conference on Economic Degrowth
for Ecological Sustainability and Social Equity”3. The results of this conference were also put on
paper in a Declaration. In short, the matters debated on the conference were the following:
structuration of proposals to work towards a degrowth society that will pursue ecological
sustainability and societal equity; discussions about issues that are commonly put aside in the
mainstream conversations about sustainable development, for instance currencies and financial
institutions, working hours and resource consumption; construction of new proposals for putting in
practice the theory about degrowth (Research & Degrowth, 2011).
These gatherings had the goal to inform and launch this subject to a more comprehensive group of
people, so that it could be discussed not only by a small niche of the scientific community but also
by other researchers and the public in general. Since then, the number of publications about
degrowth has been boosting, as well as the debate about the meaning of degrowth, its
consequences and the measures/policies that may be connected to the movement is also gaining
ground.
2.4.2. The divergence of opinions around degrowth
The most recent publications on degrowth are still quite divergent in terms of the word definition,
partly maybe because some degrowth defenders find irrelevant to have a precise definition when
one thinks of the purposes of the movement itself. There are also different types of approaches, as
some authors focus only on theoretical aspects of degrowth (especially in terms of criticizing our
development model – e.g. (Martínez-Alier, 2009; Martínez-Alier et al., 2010; Latouche, 2010) and
others focus also on measures and policies that are important for the future (Schneider et al., 2010;
Harris, 2010; Kallis, 2011). Nevertheless, there are several authors that have tried to define the
word on their publications.
According to Kallis (2011), in ecological economics the sustainable degrowth perspective means “a
socially sustainable and equitable reduction (and eventually stabilisation) of society's throughput”.
3 For more information about the results of the working groups consult the website of the conference:
http://www.degrowth.eu/.
From limits to growth to sustainable degrowth
14
In contrast, for van den Bergh (2011) there are several definitions and interpretations of degrowth,
which can be assembled in five main categories:
GDP degrowth: This concept offers an economic perspective as it presupposes that it is
necessary a reduction in GDP or a negative GDP growth. This could only be achieved with a
steep change in the environmental policies, putting degrowth as a measure and then hoping
that it can be the solution to the environmental problems. Thus, the author does not consider
this approach as a very efficient measure since it has a very hypothetical basis.
Consumption degrowth: Here it is the overconsumption that it is pointed out as the cause for
the excessive resource use and pollution. The solution here would be the reduction of
consumption but this is proving to be a very vague and imprecise method as it raises the
question of how to apply it and how to measure its effectiveness. Would people get used to buy
fewer things if they have the economic power to buy them? Would it be a voluntary system or
would it be necessary to create measures to achieve that reduction? Both hypotheses have
many problems. On one hand, people could be informed to be aware of the problems that
overconsumption raises and then we would hope that people started to consume less
(voluntary simplicity). On the other hand, the governments could tax consumption or restrict it
equally, but that would raise many social and political questions as people could feel that their
liberty was being violated.
This approach may also be prejudicial to the environment as it may lead to a rebound effect
which is a possible consequence of the consumption reduction. If people with a certain income
start to reduce their consumption of certain goods that are harmful for the environment, they
will be saving money. In turn, that extra money will be available to be used for other types of
consumption that in the end will have the same result, an outcome that turns degrowth efforts
into nothing.
Nonetheless, recent studies (Lorek & Fuchs, 2011) alert for the fact that reducing consumption
is going to be a reality whether people want it or not, it is not an option anymore. They also
argue that it is not possible to go into a sustainable degrowth path without pursuing what they
call of strong sustainable consumption or, in other words, an approach that presupposes a
reduction in global consumption accompanied by other measures that promote human well-
being through not only material goods. Despite all the difficulties that this might bring about, the
authors defend that it would rather be sooner than later that these kinds of measure should be
put forward by the governments, as they believe that it is very improbable to achieve this with
voluntary simplicity alone.
Work-time degrowth: Another option is the reduction of the working hours as well as the
reduction of the retirement age and also the increase of the holidays while working. This
interpretation is the one with more focus on well-being by increasing people’s free time while
lowering their work stress. By diminishing the work-time we could reduce the production while
the wages would also be lower, what would lead to a decrease in consumption since people
would have less money to spend.

From limits to growth to sustainable degrowth
15
The author considers this option as the most accurate one as the reduction of working hours is
a fairly clear measure, it would not leave room for too much disagreement. He also argues that
it could be the most efficient measure as it would aim to both production and consumption
although he also discusses that it would not be ideal in terms of reducing environmental
pressures connected to consumption.
Radical degrowth: According to this author, a radical change in our economic and social
systems is the main line of thought among degrowth defenders. This option presupposes major
changes in our economic and social structures, implying values, individual preferences,
markets and even the role of money in society.
This degrowth approach encompasses the first two definitions but it is much broader as it goes
as far as a change in people’s minds, lifestyles and the whole economic structure as we know
it. This leads the author to have reservations about it, as he claims that it is a very unclear point
of view with no specific measures. He considers specially blurred the view of the path that
connects the small groups of people that defend or will defend degrowth to the society as a
whole, as this presupposes a global change for being effective.
Apart from all the uncertainty and lack of a throughout analysis, van den Bergh also argues
that this is a very risky strategy. Moreover, it does not assure us any environmental
improvements as it is based on a hope that they will appear as long as we fight the causes. In
contrast, the author proposes that a less risky and slower change would allow producers,
consumers and investors adapt to it, avoiding economic instability and social chaos. This
viewpoint is shared with Harris (2010), who also claims that the change must be slow and in
two distinct periods, as explained on the previous sub-chapter.
Physical degrowth: This interpretation is seen as a new approach for the same concept that
has begun to be discussed in the 1970’s when Limits to Growth (D. H. Meadows et al., 1972)
and Nicholas Georgescu-Roegen writings were published. The focus is on the direct reduction
of resource use and polluting emissions. The aim is to construct a sustainable economy with
less harmful actions against the environment and therefore it is connected to Herman Daly’s
Steady-State Economy hypothesis.
Even so, the author argues that to bring something new it should give more focus on policy
review and on the social and political acceptance and viability. He also points out that it can
easily confused with GDP degrowth if not well defined.
Kallis (2011) disagrees with the categorization of degrowth ideas, calling it as an “umbrella
keyword” that provides a context for the linkage of policies and civil movements and has not the
main objective of being a precise concept.
Apart from this disagreement in terms of a specific concept, degrowth literature has evolved in the
last few years and it has been studied in connection to many subjects. Some contributions to
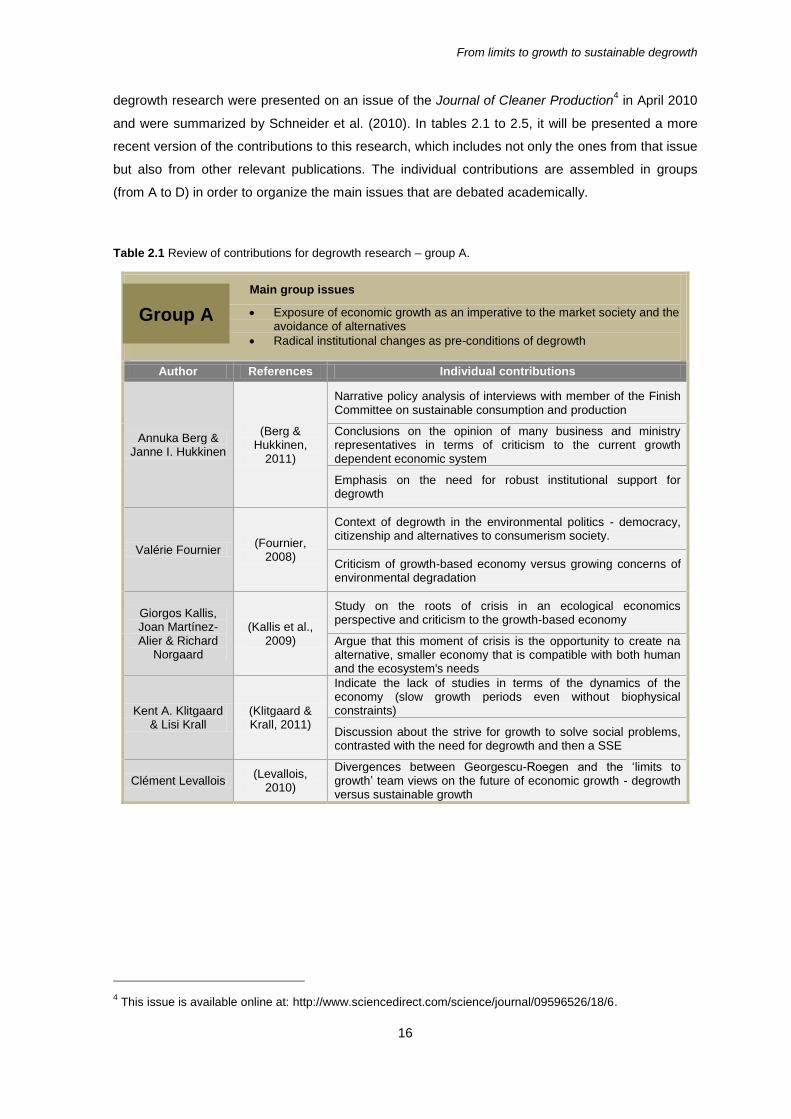
From limits to growth to sustainable degrowth
16
degrowth research were presented on an issue of the Journal of Cleaner Production4 in April 2010
and were summarized by Schneider et al. (2010). In tables 2.1 to 2.5, it will be presented a more
recent version of the contributions to this research, which includes not only the ones from that issue
but also from other relevant publications. The individual contributions are assembled in groups
(from A to D) in order to organize the main issues that are debated academically.
Table 2.1 Review of contributions for degrowth research – group A.
4 This issue is available online at: http://www.sciencedirect.com/science/journal/09596526/18/6.
Main group issues
Exposure of economic growth as an imperative to the market society and the avoidance of alternatives
Radical institutional changes as pre-conditions of degrowth
Author References Individual contributions
Annuka Berg & Janne I. Hukkinen
(Berg & Hukkinen,
2011)
Narrative policy analysis of interviews with member of the Finish Committee on sustainable consumption and production
Conclusions on the opinion of many business and ministry representatives in terms of criticism to the current growth dependent economic system
Emphasis on the need for robust institutional support for degrowth
Valérie Fournier (Fournier,
2008)
Context of degrowth in the environmental politics - democracy, citizenship and alternatives to consumerism society.
Criticism of growth-based economy versus growing concerns of environmental degradation
Giorgos Kallis, Joan Martínez-Alier & Richard
Norgaard
(Kallis et al., 2009)
Study on the roots of crisis in an ecological economics perspective and criticism to the growth-based economy
Argue that this moment of crisis is the opportunity to create na alternative, smaller economy that is compatible with both human and the ecosystem's needs
Kent A. Klitgaard & Lisi Krall
(Klitgaard & Krall, 2011)
Indicate the lack of studies in terms of the dynamics of the economy (slow growth periods even without biophysical constraints)
Discussion about the strive for growth to solve social problems, contrasted with the need for degrowth and then a SSE
Clément Levallois (Levallois,
2010)
Divergences between Georgescu-Roegen and the ‘limits to growth’ team views on the future of economic growth - degrowth versus sustainable growth
Group A
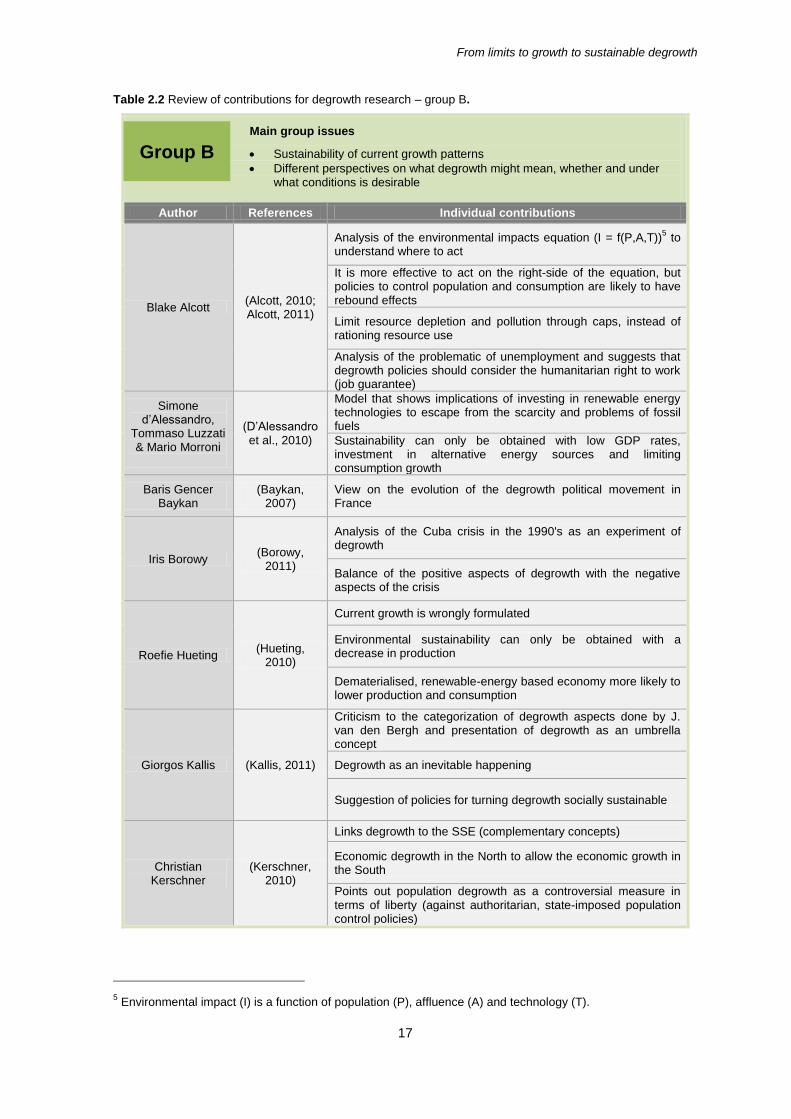
From limits to growth to sustainable degrowth
17
Table 2.2 Review of contributions for degrowth research – group B.
Main group issues
Sustainability of current growth patterns
Different perspectives on what degrowth might mean, whether and under what conditions is desirable
Author References Individual contributions
Blake Alcott (Alcott, 2010; Alcott, 2011)
Analysis of the environmental impacts equation (I = f(P,A,T))5 to
understand where to act
It is more effective to act on the right-side of the equation, but policies to control population and consumption are likely to have rebound effects
Limit resource depletion and pollution through caps, instead of rationing resource use
Analysis of the problematic of unemployment and suggests that degrowth policies should consider the humanitarian right to work (job guarantee)
Simone d’Alessandro,
Tommaso Luzzati & Mario Morroni
(D’Alessandro et al., 2010)
Model that shows implications of investing in renewable energy technologies to escape from the scarcity and problems of fossil fuels
Sustainability can only be obtained with low GDP rates, investment in alternative energy sources and limiting consumption growth
Baris Gencer Baykan
(Baykan, 2007)
View on the evolution of the degrowth political movement in France
Iris Borowy (Borowy,
2011)
Analysis of the Cuba crisis in the 1990's as an experiment of degrowth
Balance of the positive aspects of degrowth with the negative aspects of the crisis
Roefie Hueting (Hueting,
2010)
Current growth is wrongly formulated
Environmental sustainability can only be obtained with a decrease in production
Dematerialised, renewable-energy based economy more likely to lower production and consumption
Giorgos Kallis (Kallis, 2011)
Criticism to the categorization of degrowth aspects done by J. van den Bergh and presentation of degrowth as an umbrella concept
Degrowth as an inevitable happening
Suggestion of policies for turning degrowth socially sustainable
Christian Kerschner
(Kerschner, 2010)
Links degrowth to the SSE (complementary concepts)
Economic degrowth in the North to allow the economic growth in the South
Points out population degrowth as a controversial measure in terms of liberty (against authoritarian, state-imposed population control policies)
5 Environmental impact (I) is a function of population (P), affluence (A) and technology (T).
Group B
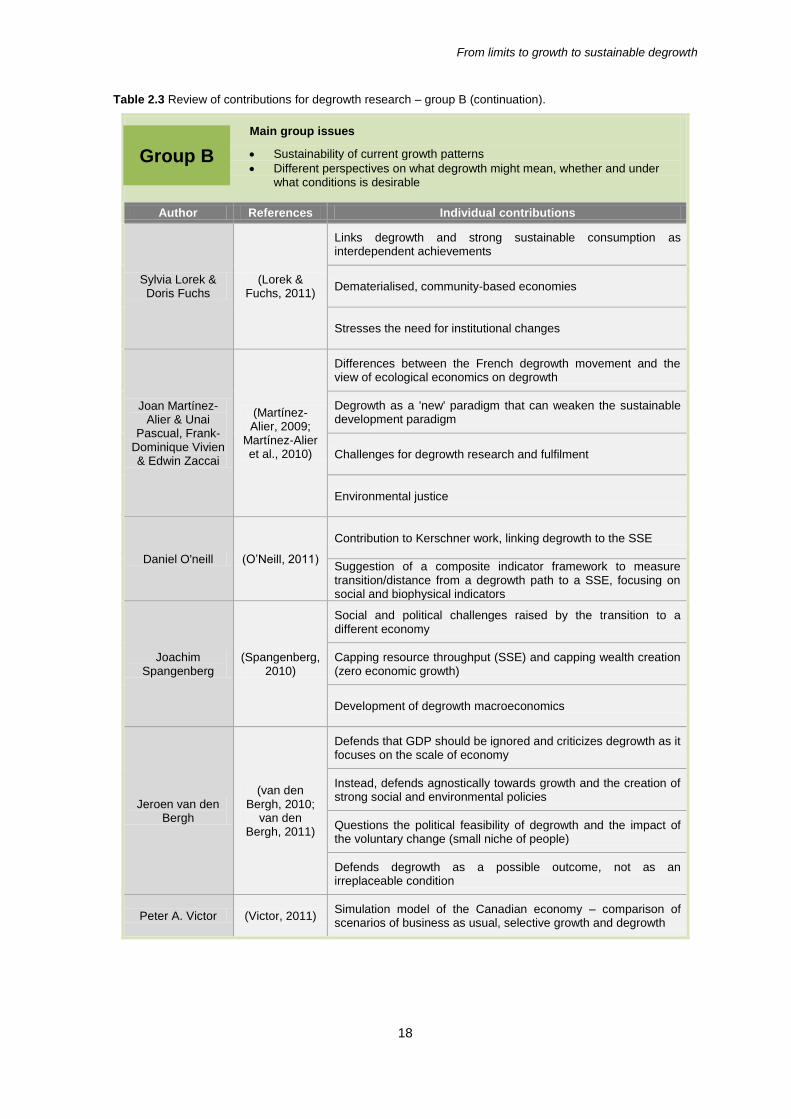
From limits to growth to sustainable degrowth
18
Table 2.3 Review of contributions for degrowth research – group B (continuation).
Main group issues
Sustainability of current growth patterns
Different perspectives on what degrowth might mean, whether and under what conditions is desirable
Author References Individual contributions
Sylvia Lorek & Doris Fuchs
(Lorek & Fuchs, 2011)
Links degrowth and strong sustainable consumption as interdependent achievements
Dematerialised, community-based economies
Stresses the need for institutional changes
Joan Martínez-Alier & Unai
Pascual, Frank-Dominique Vivien & Edwin Zaccai
(Martínez-Alier, 2009;
Martínez-Alier et al., 2010)
Differences between the French degrowth movement and the view of ecological economics on degrowth
Degrowth as a 'new' paradigm that can weaken the sustainable development paradigm
Challenges for degrowth research and fulfilment
Environmental justice
Daniel O'neill (O’Neill, 2011)
Contribution to Kerschner work, linking degrowth to the SSE
Suggestion of a composite indicator framework to measure transition/distance from a degrowth path to a SSE, focusing on social and biophysical indicators
Joachim Spangenberg
(Spangenberg, 2010)
Social and political challenges raised by the transition to a different economy
Capping resource throughput (SSE) and capping wealth creation (zero economic growth)
Development of degrowth macroeconomics
Jeroen van den Bergh
(van den Bergh, 2010;
van den Bergh, 2011)
Defends that GDP should be ignored and criticizes degrowth as it focuses on the scale of economy
Instead, defends agnostically towards growth and the creation of strong social and environmental policies
Questions the political feasibility of degrowth and the impact of the voluntary change (small niche of people)
Defends degrowth as a possible outcome, not as an irreplaceable condition
Peter A. Victor (Victor, 2011) Simulation model of the Canadian economy – comparison of scenarios of business as usual, selective growth and degrowth
Group B

From limits to growth to sustainable degrowth
19
Table 2.4 Review of contributions for degrowth research – group C.
Main group issues
Practical living experiments that relate to degrowth principles (cohousing, squatters and work-sharing)
Author References Individual contributions
Giacomo D'Alisa & Claudio Cattaneo
(D’Alisa & Cattaneo,
2011)
Example of Catalonia case-study - comparison between unpaid and paid work, using hours as unit of measure, to give emphasis of the importance of unpaid work
Energy consumption is increasing due to changes in the typology of the households (more one single and single-parent households)
Suggestion of co-housing and work-sharing as solutions for degrowth at a local level
Avoid the fake ecological urban-planning that claims a "smart growth"
Claudio Cattaneo & Marc Gavaldà
(Cattaneo & Gavaldà,
2010)
Example of squatters in Barcelona - empirical study of energy and time consumption
Self-sufficiency instead of 'delocalization' of the economy and mutual aid instead of capitalistic competition
Autonomy in terms of individual or collective allocation of time: instead of full-time jobs the time is directly employed for the satisfaction of needs
Economic and material degrowth as an outcome of a change in the socio-political system and as a democratic, collective choice
Matthieu Lietaert (Lietaert,
2010)
Co-housing as a solution for social and environmental improvements in an urban context - efficient-sharing habits: sharing of house appliances, cars and constructing community resilience
Tackle individualism and environmentally damaging lifestyle
Degrowth at a family/neighbourhood level
Group C
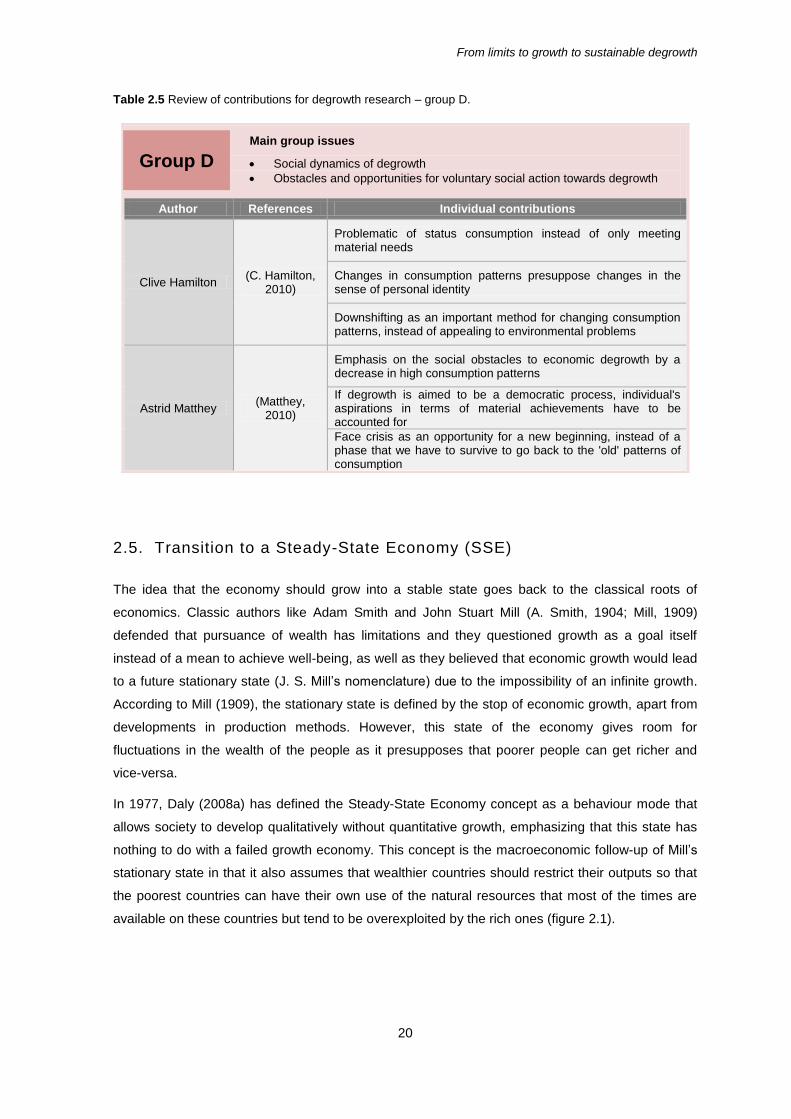
From limits to growth to sustainable degrowth
20
Table 2.5 Review of contributions for degrowth research – group D.
2.5. Transition to a Steady-State Economy (SSE)
The idea that the economy should grow into a stable state goes back to the classical roots of
economics. Classic authors like Adam Smith and John Stuart Mill (A. Smith, 1904; Mill, 1909)
defended that pursuance of wealth has limitations and they questioned growth as a goal itself
instead of a mean to achieve well-being, as well as they believed that economic growth would lead
to a future stationary state (J. S. Mill’s nomenclature) due to the impossibility of an infinite growth.
According to Mill (1909), the stationary state is defined by the stop of economic growth, apart from
developments in production methods. However, this state of the economy gives room for
fluctuations in the wealth of the people as it presupposes that poorer people can get richer and
vice-versa.
In 1977, Daly (2008a) has defined the Steady-State Economy concept as a behaviour mode that
allows society to develop qualitatively without quantitative growth, emphasizing that this state has
nothing to do with a failed growth economy. This concept is the macroeconomic follow-up of Mill’s
stationary state in that it also assumes that wealthier countries should restrict their outputs so that
the poorest countries can have their own use of the natural resources that most of the times are
available on these countries but tend to be overexploited by the rich ones (figure 2.1).
Main group issues
Social dynamics of degrowth
Obstacles and opportunities for voluntary social action towards degrowth
Author References Individual contributions
Clive Hamilton (C. Hamilton,
2010)
Problematic of status consumption instead of only meeting material needs
Changes in consumption patterns presuppose changes in the sense of personal identity
Downshifting as an important method for changing consumption patterns, instead of appealing to environmental problems
Astrid Matthey (Matthey,
2010)
Emphasis on the social obstacles to economic degrowth by a decrease in high consumption patterns
If degrowth is aimed to be a democratic process, individual's aspirations in terms of material achievements have to be accounted for
Face crisis as an opportunity for a new beginning, instead of a phase that we have to survive to go back to the 'old' patterns of consumption
Group D

From limits to growth to sustainable degrowth
21
Nonetheless, there are some core differences between the classical and the neoclassical views of
the concept. The classic line of thoughts is that population and capital stock are an established fact
(they are constant) and we have to adjust our technologies and wants to the earth’s limits in order
to maintain our throughput at a certain low level that respects the regenerative capacities of the
system. Oppositely, the neoclassic view is that technology and wants have to maintain a
sustainable level of use and what has to be adjusted to them are population and capital stocks.
As one can see, the neoclassical concept is connected to the sustainable degrowth concept. A
sustainable global level of stock and throughput cannot be obtained with an infinite growth path of
the two hemispheres and so, for the poor South to grow the rich North will have to degrow
(Kerschner, 2010). When this agreement reaches the optimal point, then the economy should
proceed to be in a mild stable state, the so-called steady-state.
Figure 2.1 Representation of the balancing needed for reaching a steady-state world
economy (source: Kerschner, 2010).

From limits to growth to sustainable degrowth
22

Importance of the degrowth viewpoint in today’s and tomorrow’s society
23
Chapter 3. Importance of the degrowth viewpoint in today’s and tomorrow’s society
3.1. Economic crisis as an opportunity
The economic crisis that took over the world in 2008-2009 is considered by some authors as a sign
of the failure of the conventional economics due to boundless growth (Schneider et al., 2010; van
den Bergh, 2010) and its harshness is considered as the worst since the 1930’s one (Harris, 2010).
It is important to note that this crisis is a recession, thus it cannot be considered as a sustainable
economic degrowth as it was defined previously. A recession occurs when a growth-based
economy reaches a negative GDP growth or, in other words, experiences economic degrowth,
which can ultimately lead to economic and social collapses (Schneider et al., 2010; Kallis, 2011).
This decline in economic growth has been having repercussions as, for instance, the reduction of
productivity in industries, and also consumers got more worried about the future of the economy
and therefore started to consume less to save money. These changes had a positive retroaction in
terms of pollutant emissions and also in terms of the extraction of natural resources and may have
partly led to a reduction in the relocation of environmental impacts (Schneider et al., 2010).
In this scope, the current recession of the economy can be an opportunity for some changes in the
matter that it is demonstrating that the economic model that we have adopted has limits and it is
uncovering the massive growth that we have been pursuing fervently (by boosting a fast
accumulation of physical, financial and human capital) as the main cause of reaching this point of
rupture (Schneider et al., 2010; UNEP, 2011). It is argued that the finance assets (loans made to
private sector and to the state) grew too much and at an exaggerated rate in comparison to the real
economy (GDP at constant prices), being mistaken for growth of real wealth (Daly, 2008b; Kallis et
al., 2009). The private and public debts grew too much and the solutions presented to their
payment are the debasement of the value of the money (inflation) or economic growth, through
more production and consumption (Kallis et al., 2009). Nevertheless, more production means the
use of more fossil fuels. The fuel price shock (during 2007-2008) revealed how depend we are on
petrol as well as what are the consequences of that dependency, namely the structural flaws of the
world’s finances and also uncertain risks like the rise of the price of food and services (UNEP,
2011).
The present crisis can also be an excuse to pursue more economic growth although in a supposed
‘sustainable’ way, what turns it into a threat instead of an opportunity (Schneider et al., 2010).
Nonetheless, it is an opportunity for decision-makers to get focused on people’s well-being instead
of pursuing GDP growth as a goal itself and as the one and only solution to minimize
unemployment and restore societies’ trust in the economy (van den Bergh, 2010). The last two
decades were marked by massive investments in fossil fuels, property and structured financial
assets in detriment of investments on energy efficiency, public transportation, biodiversity

Importance of the degrowth viewpoint in today’s and tomorrow’s society
24
protection, water and land conservation and other important resource-conserving sectors (UNEP,
2011).
It has been noted by some authors (Martínez-Alier, 2009; Jackson, 2009; Harris, 2010) that the
recession has made many countries to go back to some sort of Keynesian way of thinking, using
very aggressive fiscal and monetary policies. Harris (2010) defends an ecologically-focused
Keynesianism, which has not the objective of promoting growth as the ‘classical’ interpretation of
Keynesianism suggests but instead it is focused only on the pure analysis of investment and
consumption, in order to pursue more important economic goals such as more employment,
fulfilment of basic needs and income equity. This path towards getting away from the neoliberal
economics due to the recession and getting back to Keynesian measures also provides an
opportunity for the sustainable degrowth path to be more accepted as it requires a restructuration
in many social and institutional sectors. These old but revitalized theories may be a good start point
for the transition to a more sustainable economy if used for giving governments more space for
monetary and fiscal policy and for deciding which sectors are worth to invest or not, allowing
degrowth in harmful sectors (resource and energy-intensive) and growth in important ones, key
factors to surpass this crisis. In fact, the measures may be right but applied in the wrong way; it all
depends on the final goal. Nonetheless, this “Green Keynesianism” (Martínez-Alier, 2009) cannot
be another excuse to pursue incessant economic growth, or else it will also become a threat.
Even with all the evidences that our economic model is failing and with the awareness of all the
problems associated with climate change and resource depletion, we have difficulties in really
understanding that reducing consumption does not mean to lose quality of life. Instead, it is
suggested (Abdallah et al., 2009) that it is possible to reduce resource consumption with the
maintenance or even with improving our lifestyle, we only have to disconnect from the obsession of
maintaining everything the exactly the same as we know it.
3.2. New demands in terms of policy-making and sustainability
assessment
3.2.1. Sustainability goals for policy-making
With the awareness of the opportunity come new demands in terms of policy. As discussed
previously, the degrowth debate is still very theoretical and seen as utopian in many angles.
Hence, there are many concerns in terms of how will degrowth occur, and whether it is a
prescription or a diagnosis tool, albeit in the context of the current economic crisis it is really a
diagnosis of what is happening right now. It is also debatable whether the government should
interfere more or not in the economy and if the return of the Keynesian measures to fight the crisis
are an added value, at least the “green” ones.
Firstly, it is important to understand which are the main sustainability goals for policy-making and
then the main pillars for constructing useful policy for attaining those goals.
Importance of the degrowth viewpoint in today’s and tomorrow’s society
25
According to Daly (1992), there are three goals for creating policy – allocation of resources,
distribution of wealth and scaling the size of the economy inside the physical limits of the earth.
When one focus on a ‘real’ sustainable development of the global economy, this means to use
policy for pursuing an efficient allocation of resources, a just distribution of wealth and, above all, to
find a sustainable scale for human activity that does not compromise the resources for the future.
But what do these goals specifically mean in terms of policy-making?
Starting with the scale issue, it is argued (Daly, 1992; Daly & Farley, 2011) that this should be the
first priority when constructing policy. The scale of the economy can be referred as to the physical
volume of the throughput of the economic subsystem, measured as stock of population and their
consumed goods or as the flow of inputs necessary for upholding those stocks. According to these
viewpoints, using policy instruments for limiting scale could mean to focus the attention on the
resources stocks or flows, being the flows maybe the most approachable way of putting limits on
the throughput (Daly & Farley, 2011). Therefore, to maintain the resource extraction inside the
regenerative capacity of the ecosystems and the posterior wastes also within their absorptive
capabilities, it is crucial to find this equilibrium and only after defining those limits are we ready to
worry about the equity on the distribution of the outputs of what we are using and about an efficient
allocation of those resources through the global activities.
For Daly and Farley (2011), it is logical to put scale first as when we are limiting how to use
nature’s services and resources, we are adding value to former non-market goods (in spite of the
fact that not all goods are passible to be marketable – e.g. ozone layer). As we do that, they
automatically have to belong to someone, becoming valuable assets with property rights (whether
these rights are private, communitarian, public or belong to everyone - global community) and
gaining a place in the market.
The next problem is how to dispense the assets, the entitlements of resource uses and also the
environmental costs in an equitable way, and this is where the justice issue begins. This
problematic is one of extreme importance for many reasons. On the one hand, extremely poor
people are uniquely worried about their survival and so, in a general basis, it is natural that they are
not so worried about the environment or global sustainability questions. On the other hand, the
wealthier people are also not very concerned with environmental issues, as they tend to over-
consume resources that may be already threatened to become unavailable.
This goal’s definition is going to be broaden to a more comprehensive concept than Daly’s
distribution concept, in order to include aspects not only related to the wealth of people. According
to Svarstad et al. (2011), there are three types of environmental justice. What it is called the
distributive justice – the distribution issue – is the aspect that relates to equal distribution of goods
as well as environmental costs between the applicable parties. This distribution can be done
according to contribution or to needs, being the first one related to the type of contribution (positive
and/or negative) certain party has on a situation and the second one related to the human right of
having the opportunity to fulfil the basic needs.

Importance of the degrowth viewpoint in today’s and tomorrow’s society
26
But in a complex system as the Earth is, with wide-ranging types of problems and therefore
solutions, how can policy be coherent in terms of justice in the distribution? The setback here is to
find ways through policy enforcement to guarantee a limited range of inequality that it is acceptable
(Daly & Farley, 2011), i.e. there would still be richer people and poorer people but the difference
between their wealth would be smaller and limited, to end situations of social collapse. There are
questions that have to be thought out when constructing policy and, in this context, it is important to
stress issues such as (1) the difference of benefits within groups of people, (2) cost-benefit analysis
between gains/losses and contributions and (3) the possible violation of future fulfilment of basic
needs with the enforcement of some policies (Svarstad et al., 2011).
The second type of justice is the procedural justice. Regarding this aspect is the assessment of
fairness of the decision-making process or, in other words, if policy decisions are made by having
in consideration the opinions of the stakeholders of a certain issue in a democratic manner. This
presupposes that people have access to the information about the process, the opportunity to
expose their worries and opinions and actually influence the process in their benefit. The way
public participation is done depends on the issue that is being assessed, what is important is that it
exists.
The third and last is the sense of justice, or the degree of legitimacy. The authors consider this an
important aspect as not always people feel that justice has been done simply when the two other
types of justice were addressed. This happens since the way certain issues affect people is
differently perceived and evaluated by them in order to form their own opinions. But then, there
also exists the group or community opinion as a whole and, for assessing that, it is necessary to
find out how the different viewpoints are connected.
In a more global view, it is also important to remember the physical limits that we encounter to
economic growth, as already discussed previously. A fair global distribution of the wealth and
resources is crucial as the over-consuming population is the one that must stop and diminish their
growth, not the ones who are still striving for a minimum quality of life.
Nevertheless, the present and near future are not the only milestones that we have to take into
account. The justice issue can be approached in terms of intragenerational justice and
intergenerational justice. Hence, a just policy ought also to embrace the idea of intergenerational
equity. In other words, it is our ethical duty to preserve the ecological resources and services to the
entire usufruct of the next generations, not to only throw them the environmental costs that we did
not pay or were unable to avoid.
After addressing to an appropriate scale and to the justice issue, we are in conditions of thinking in
how the market instruments may help to efficiently allocate the resources. A sustainable allocation
may be defined as to efficiently divide the resource flow between all its different uses in the
production process (Daly, 1992). Daly and Farley (2011) discuss that rather than focusing on the
Importance of the degrowth viewpoint in today’s and tomorrow’s society
27
typical Pareto optimum6 viewpoint, one should focus on a more technical, production-oriented
interpretation. In other words, these authors defend that a proper way of knowing if resource
allocation is being done efficiently is to calculate the ratio between the services7 gained with the
increase of human-made capital and the ecological services that were sacrificed for this end, in
order to evaluate if the resources are not being squandered. This definition defies the standard
efficiency meaning of allocating scarce resources where they will be more valuable in monetary
terms, what usually does not include non-market values. Moreover, it may be a more real meaning
of efficiency, a meaning that takes a step aside from the conventional market thinking and that
gives more importance to the natural capital stock. This is significant as it is questionable that even
if the natural capital is accounted in the market, there are several factors that can fail in real life
transactions that will prevent the market from efficiently allocate the resources only by trusting its
own means. There are market failures such as asymmetric information flows (e.g. the power of
advertising to change our individual preferences or even the effect that other person’s behaviour
has on our own actions), which can lead to spending resources in goods that are not significant for
human well-being (Daly & Farley, 2011), since our preferences are vulnerable to changes and not
always towards a better allocation of our own resources.
3.2.2. Important principles for policy-making
In order to build solid policy that truly matters in terms of human well-being, the discussed policy
goals are important to focus on, so that a certain path can be constructed bearing them in mind.
There are many aspects that are crucial for focusing policy-makers on that right path. They will be
divided in two, which in this work will be entitled as: general structural principles and behaviour-
based principles.
General structural principles8
Starting with an aspect that might seem simpler than it actually is, it is vital that for each policy goal
discussed previously, one should have independent policy instruments (Tinbergen, 1952) in (Daly
& Farley, 2011). This means that one single instrument cannot optimize more than one goal
simultaneously. However, this does not mean that a single instrument cannot be useful for pursuing
all the goals of policy that are part of a particular economic system, what is highly unlikely is to
serve all the purposes with the same efficiency.
In this context of complex design of policy schemes, it might make sense to adopt a policy-mix, a
method that combine a mix of objectives and policy instruments to answer to complex interactions.
This now revitalized concept is important as it allows the policy-maker to analyse the connections
between different policies that influence the degree to which the policy goals are being achieved
6 Pareto optimum or Pareto efficient allocation is a concept that presupposes that an allocation is efficient if it
is the only possible combination in which there is not one more person that could be better without leaving other person in a worse state. 7 Service is defined in this context as a “physical flux or satisfaction provided directly by natural capital” (Daly
and Farley, 2011, 475). 8 The structural principles were based on Daly and Farley (2011, 414-417).
Importance of the degrowth viewpoint in today’s and tomorrow’s society
28
(Flanagan et al., 2011). The mixed approaches can take many forms but it is argued (Santos et al.,
2006) that a joint scheme that includes regulation put forward by the government, economic
incentives and voluntary commitments is likely to be successful in the environmental, social and
economic spheres, as they tend to pursue the important policy goals in an integrated manner. The
benefit is that it becomes simpler to address to the decentralized power of nations, what allows us
to move away from the conventional models of governance that are highly centralized on the state
power and to get closer to the actual “multi-level” and “multi-actor governance” in which we are
aiming at (Flanagan et al., 2011). This implies not only the combination of new policy instruments
with the existing ones and also an active engagement of the stakeholders on the actual design of
new instruments, what will lead to a more accepted and clear policy scheme (Santos et al., 2006).
Other important aspect to be accounted for in policy-making is that it should attempt to define the
required macro-control for the specific problematic yet respecting the micro-variability of individual’s
freedom for manoeuvre. Moreover, this flexibility has to be extended to the general necessity of
policy to adapt to the everyday changes, since nothing is static in this world – the ecological
systems, our impacts and our own knowledge is vastly variable overtime. The posture for policy-
makers should always be one of being aware of changes and adapt the policies to those ‘new
truths’.
A further issue that involves policy flexibility is specifically when it is focused on biophysical
aspects. This is a sensible matter since the biophysical limits of the environmental systems cannot
be entirely predicted with full certainty and they often can be irreversible. Due to this fact, it is
crucial that policy contemplates a safety margin between human necessities and the assessment
of system’s capacity.
When we think of new policies it is also a fact that, besides they supposedly strive to achieve a
better state than the one we would have without them, we usually never start from scratch. We
already have well established central institutions (market system, private property, public property
and government regulation) and it might be a waste of time putting an end on them. According to
Daly and Farley (2011), it would rather be more effective to restructure them in the light of new
principles, achieving an integrated solution. For this, an institutional analysis may be useful to
understand the interdependence between natural resources and their users, as well as the conflicts
that emerge from those relations (Paavola & Adger, 2005). This is important as governance
solutions may be needed at various levels simultaneously and that may pose a problem not only in
terms of their own compatibility when overlapping but also in terms of compatibility with the
environmental interdependencies. Also, the conflicts that the interdependencies create can be
solved by combining different individual opinions in singular collective choices that are accepted by
all, what once again highlight the need of creating, altering or restating governance institutions
(Paavola & Adger, 2005).
Finally, the last structural issue that is going to be discussed is the importance of looking for policy
solutions with the same scale as the origins and consequences of the issue addressed. It makes

Importance of the degrowth viewpoint in today’s and tomorrow’s society
29
no sense to construct global-scaled policies for regional or local problems as well as it is not very
effective to endeavour global changes with only individual measures.
Behaviour-based principles9 (Dawnay & Shah, 2005)
For policies aimed to people, their behaviour must be accounted for. Conventional economics
principles are often based on the assumption that people will act always rationally but, as
discussed previously, our preferences are not that static.
To delineate comprehensible policy it is of extreme importance to note that people’s minds are
susceptible to change with other people’s actions – not only with their incorrect actions but also
with their right actions, an extra motivation for a better individual behaviour. Instead of focusing on
immediate effects of policy on people’s behaviour, the effort should be pursuing medium or long
term goals (for instance, stimulating education instead of only endorsing direct punishment for
dangerous actions) that will have more impact and therefore will promote an eclectic change by
altering the behaviour of specific types of people that are more likely to influence other’s actions.
Furthermore, every human-being has habits that are very influential on our behaviour and that can
be very hard to change, what can lead to questioning what will be the best incentive (financial or
not, making public commitments, etc.) to change them. Additionally, and in spite of having these
inherent preferences, people’s decisions are also influenced by other external aspects, such as the
exposition to advertisements or other forms of information that can shape our vision of certain
subjects.
Lastly, it is crucial that people feel involved in policy, that they are convinced that they can change
something by maintaining or changing their behaviour. This is mostly due to our own self-
expectations, and it should be an extra guideline for policy-making. Initiatives such as commitments
for pursuing certain goal and the call for direct and active involvement of communities can be very
important in terms of social cohesion for a widespread behaviour change.
3.2.3. Specific policy goals in a sustainable degrowth perspective
Now returning to degrowth specific approach, there have been many efforts on proposing umbrella-
goals as well as general measures and policy instruments to reach the global objective of a more
efficient and just society and a scale-appropriate human impact.
The sustainable degrowth literature is growing as it becomes an increasing debated issue, maybe
due to the current condition of world economy, which makes us particularly realise the urgent need
for a change. To the research of proposed policy instruments, informal measures and/or specific
goals to achieve, the focus was on getting to the contemporary roots of degrowth (reading French
authors such as Latouche (2010)) but also to the most recent articles by emergent authors, that
are much more inserted in the current problematic of the economic crisis.
9 The behaviour-based principles were based on Dawnay & Shan (2005).

Importance of the degrowth viewpoint in today’s and tomorrow’s society
30
The analysis that is going to be presented was based on the information retrieved from publications
that were considered relevant for understanding the various approaches to degrowth’s viewpoints
(Delacote & Montagné-Huck, 2012; Harris, 2010; Jackson, 2009; Kallis, 2011; Latouche, 2010;
Lorek & Fuchs, 2011; Martínez-Alier, 2009; Martínez-Alier et al., 2010; Recio, 2008; Schneider et
al., 2010; van den Bergh, 2011; Victor, 2008).
The method adopted for this analysis (which is schematized in figure 3.1) was to make a survey of
the cited measures/policy instruments/goals and then to aggregate similar ideas, in order to avoid
repetitions. Afterwards, there was a process of separating specific measures/policy instruments
from the particular goals, preceded by interpreting all the information and constructing particular
and overall goals that would allow the categorization of all the measures and policy instruments.
Finally, there was a separation of the particular goals into three categories: sustainable scale,
justice and efficient allocation. This was a way of knowing if the goals mentioned by the authors
were in accordance with the general policy goals that were discussed previously in this chapter.
Of all the objectives identified (table 3.1), the most suggested ones (connected or not with specific
policy instruments) along degrowth-related recent literature were the following (see Annex I for the
specific tables that connect the policy goals to the authors who refer them):
Identifying clear resource and emission caps and establishing reduction targets;
Investing in health and education;
Reducing working-time;
Decreasing material and energy use in regions that had almost or already surpassed their
ecological limits;
Encouraging community-based sustainability initiatives and ‘voluntary simplicity’;
Reducing non-essential consumption and also promoting a more conscientious consumption;
Investing in better selected technical innovations.
Figure 3.1 Adopted methodology for the analysis of degrowth-related literature in this work.

Importance of the degrowth viewpoint in today’s and tomorrow’s society
31
Table 3.1 Review of the main goals and their connection to specific ones through degrowth-related literature
analysis.
Overall goals Specific goals
GOAL 1 Increase community resilience,
fight social inequality and poverty
Create and protect shared public spaces
Encourage community-based sustainability initiatives and
‘voluntary simplicity’
Decentralize and deepen democratic institutions
Fight discrimination
Fight crime
Promote social cohesion and solidarity
Reduce working-time
Minify unemployment
Improve local environment in deprived areas
GOAL 2 Enhancing social capital
Reduce geographical labour mobility
Protect and invest in culture, sports and recreation
Investment in health and education
GOAL 3 Resource and emission caps
Identify clear resource and emission caps and establish reduction
targets - international climate change agreement for carbon
regulation
Reduce waste emissions
Reduce resource extraction
GOAL 4 Reduce the ecological footprint
of the North
Decrease material use
Decrease energy use
Promote environmentally beneficial sectors
Incentive the use of public transportation
Investment in better selected technical innovations
Investment in environmental and technological research
Reduce the ‘delocalization of the economy’ (transport of goods
and people on the planet)
GOAL 5 Down-scaling global
consumption
Reduce non-essential consumption
Promote a more conscientious consumption
GOAL 6 Support ecological transition in
developing countries
Promote an environmentally friendly development
Investment in protection of ‘carbon sinks’ and biodiversity
Increase material and energy use
Promote benefit-sharing between north and south
GOAL 7 Fiscal & economic system
reforms
Avoid monopolies/promote competition
Increase value of other types of capital
Fight poverty
Increase public control over the money supply
Reduce investment in inadequate infrastructures
Reform corporation charters to create more horizontality
Reform the regulation of national and international financial
markets
Revise income tax structures
Revise national accounts (GDP failures)
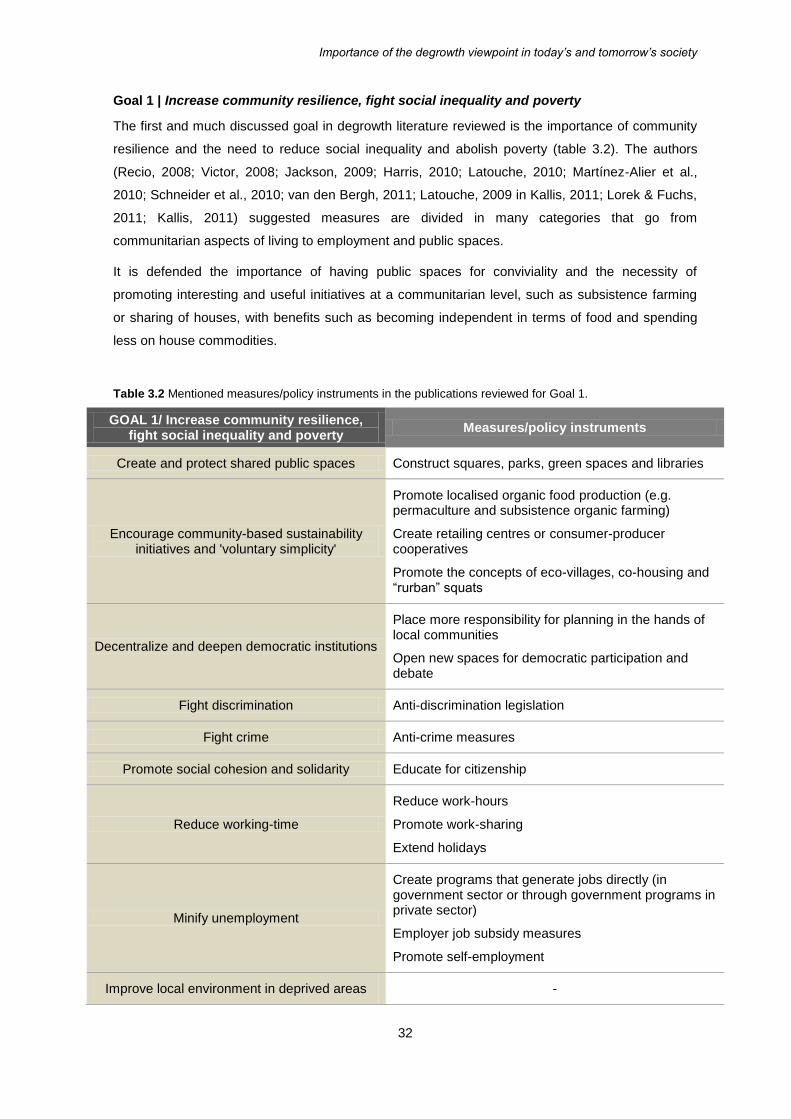
Importance of the degrowth viewpoint in today’s and tomorrow’s society
32
Goal 1 | Increase community resilience, fight social inequality and poverty
The first and much discussed goal in degrowth literature reviewed is the importance of community
resilience and the need to reduce social inequality and abolish poverty (table 3.2). The authors
(Recio, 2008; Victor, 2008; Jackson, 2009; Harris, 2010; Latouche, 2010; Martínez-Alier et al.,
2010; Schneider et al., 2010; van den Bergh, 2011; Latouche, 2009 in Kallis, 2011; Lorek & Fuchs,
2011; Kallis, 2011) suggested measures are divided in many categories that go from
communitarian aspects of living to employment and public spaces.
It is defended the importance of having public spaces for conviviality and the necessity of
promoting interesting and useful initiatives at a communitarian level, such as subsistence farming
or sharing of houses, with benefits such as becoming independent in terms of food and spending
less on house commodities.
Table 3.2 Mentioned measures/policy instruments in the publications reviewed for Goal 1.
GOAL 1/ Increase community resilience, fight social inequality and poverty
Measures/policy instruments
Create and protect shared public spaces Construct squares, parks, green spaces and libraries
Encourage community-based sustainability initiatives and 'voluntary simplicity'
Promote localised organic food production (e.g. permaculture and subsistence organic farming)
Create retailing centres or consumer-producer cooperatives
Promote the concepts of eco-villages, co-housing and “rurban” squats
Decentralize and deepen democratic institutions
Place more responsibility for planning in the hands of local communities
Open new spaces for democratic participation and debate
Fight discrimination Anti-discrimination legislation
Fight crime Anti-crime measures
Promote social cohesion and solidarity Educate for citizenship
Reduce working-time
Reduce work-hours
Promote work-sharing
Extend holidays
Minify unemployment
Create programs that generate jobs directly (in government sector or through government programs in private sector)
Employer job subsidy measures
Promote self-employment
Improve local environment in deprived areas -

Importance of the degrowth viewpoint in today’s and tomorrow’s society
33
The public participation is also an addressed issue of much importance, with suggested
improvements in terms of public opinion and empowerment. It is claimed that, on the one hand,
local communities should have more power and more responsibilities in terms of planning their own
space of action. On the other hand, more spaces for debate should be available for stakeholders
share their concerns and opinions about issues that matter in their daily lives. After all, degrowth is
not supposed to be an imposition but instead a collective choice for improving our lives.
However, if a community is not cohesive, there will be many social problems. There is a need to
fight discrimination in all its forms (gender, race, religious beliefs, etc.), to prevent crime, to improve
local deprived areas and also it is very important to educate people to citizenship, in order to
construct more cohesive societies.
When it comes to employment, a very popular measure in degrowth-related literature is the
reduction of working-hours. This measure has many objectives, being them not only the increase of
free time but also giving more space inside a company for employing more people. This measure
can also have effects on the global consumption, since it presupposes that incomes will decrease
and therefore people will have less money to spend on unnecessary purchases. Nevertheless,
unemployment has to be fought with other instruments, such as the direct creation of jobs on
existent public or private services or the promotion of entrepreneurship, for the construction of new
jobs.
Goal 2 | Enhancing social capital
As already discussed, economic growth should occur in benefit of increasing the life quality of the
population in the whole, not just to boost economies for the sake of some individuals. In degrowth
literature, some authors (Victor, 2008; Jackson, 2009; Harris, 2010; van den Bergh, 2011; Kallis,
2011; Raventós, 2007 in Kallis, 2011) defend that there are many types of capital that we have to
pay attention to, being one of them the social capital – the people themselves (table 3.3).
Table 3.3 Mentioned measures/policy instruments in the publications reviewed for Goal 2.
GOAL 2/ Enhancing social capital
Measures/policy instruments
Reduce geographical labour mobility -
Protect and invest in culture, sports and recreation
Protect public service broadcasting and museum funding
Investment in cultural activities
Investment in health and education
Guarantee minimum health services
Offer better access to lifelong learning and skills
Provide training for green jobs
Improve access to good quality education
Promote environmental communication and information (schools, media and books)

Importance of the degrowth viewpoint in today’s and tomorrow’s society
34
The health and education sectors are always the most crucial ones when it comes to enhance
social capital. On the one hand, it is important to guarantee the access to the minimum health
services to everyone. On the other hand, the access to quality education and the access to
environmental information are aspects that should be assured when constructing policy.
Nonetheless, people also broaden their knowledge and their way of seeing the world through
leisure time and cultural activities. There are references in the literature (Victor, 2008; Jackson,
2009; Harris, 2010) that defend that these aspects are essential to invest, in order to promote a
healthy use of free-time and the access to information and culture for everyone.
Goal 3 | Resource and emission caps
The third goal here presented is related to resource extraction, atmospheric emissions and waste
in general (table 3.4). This is an aspect that appears nearly every time degrowth is discussed, due
to its importance in the current global panorama.
The authors that suggest solutions for this problematic (Victor, 2008; Jackson, 2009; Martínez-
Alier, 2009; Harris, 2010; Schneider et al., 2010; Kallis & Martinez-Alier, 2010 in Kallis, 2011; Lorek
& Fuchs, 2011; Kallis, 2011; van den Bergh, 2011) focus the climate change agreement as an
imperative for achieving results in terms of carbon regulation. Resource extraction is referred as a
priority to regulate as well, not only the scarce non-renewable resources but also the rate of
exploitation of the renewable ones. The waste disposal is an aspect that is also brought to question
due to the dangerousness of some kinds of waste but also in the context of atmospheric emissions
in general, highlighting that instruments such as caps or taxes should be applied to these aspects.
Table 3.4 Mentioned measures/policy instruments in the publications reviewed for Goal 3.
GOAL 3/ Resource and emission caps
Measures/policy instruments
Identify clear resource and emission
caps and establish reduction targets
Carbon regulation through limits, taxes, cap-and-trade systems (e.g. equal per capita allowances)
Reduce waste emissions Caps and/or taxes on air pollution, on hazardous and toxic waste
Reduce resource extraction
Caps for the extraction of scarce non-renewable resources (e.g. fossil water), for the rate of harvesting of renewable resources
Establish commitments to leave resources on the ground; tax resource extraction at origin
Goal 4 | Reduce the ecological footprint of the North
The impact that development of the countries has may be one of the main problems that degrowth
is focused on (table 3.5). The relatively wealthiest countries are concentrated on the North
hemisphere, but their development did not occur only with their own available resources.

Importance of the degrowth viewpoint in today’s and tomorrow’s society
35
Therefore, the use of their own resources and of resources they do not have has to be controlled,
as well as reducing their impact on daily activities.
The measures that some authors (Recio, 2008; Victor, 2008; Jackson, 2009; Martínez-Alier, 2009;
Harris, 2010; Latouche, 2010; Martínez-Alier et al., 2010; Schneider et al., 2010; van den Bergh,
2011; Kallis, 2011; Lorek & Fuchs, 2011) suggest are divided into decreasing some activities,
better invest in others and changing lifestyles through policy measures that incentive better
behaviours.
Energy and material use assemble the big portion of our impacts, being necessary to reduce it
through using resources more wisely and also by redesigning the way we use them. It also
becomes important to benefit sectors that have fewer impacts on the environment through, for
instance, the creation of ecological subsidies for supporting those sectors or, in the case of the
public transports sector, to invest in infrastructures and change the conditions of use of the
services.
Table 3.5 Mentioned measures/policy instruments in the publications reviewed for Goal 4.
Other pernicious effect of development discussed in the literature is the negative effects of
globalization in production process. An issue that it is becoming out of control is the delocalization
of the economy, i.e. the phenomenon of, for example, assembling a product at country A, with
pieces that were produced at country B, C and D.
GOAL 4/ Reduce the ecological footprint of the North
Measures/policy instruments
Decrease material use -
Decrease energy use Energy efficiency measures
Redesign utility networks (electricity grid)
Promote environmentally beneficial sectors Ecological subsidies
Incentive the use of public transportation
Change the prices
Invest in infrastructures
Change the prerogatives of private transportation
Investment in better selected technical innovations
Renewable energy technologies
Retrofit buildings with energy- and carbon-saving measures
Investment in environmental and technological research
-
Reduce the 'delocalization of the economy' (transport of goods and people on the planet)
-
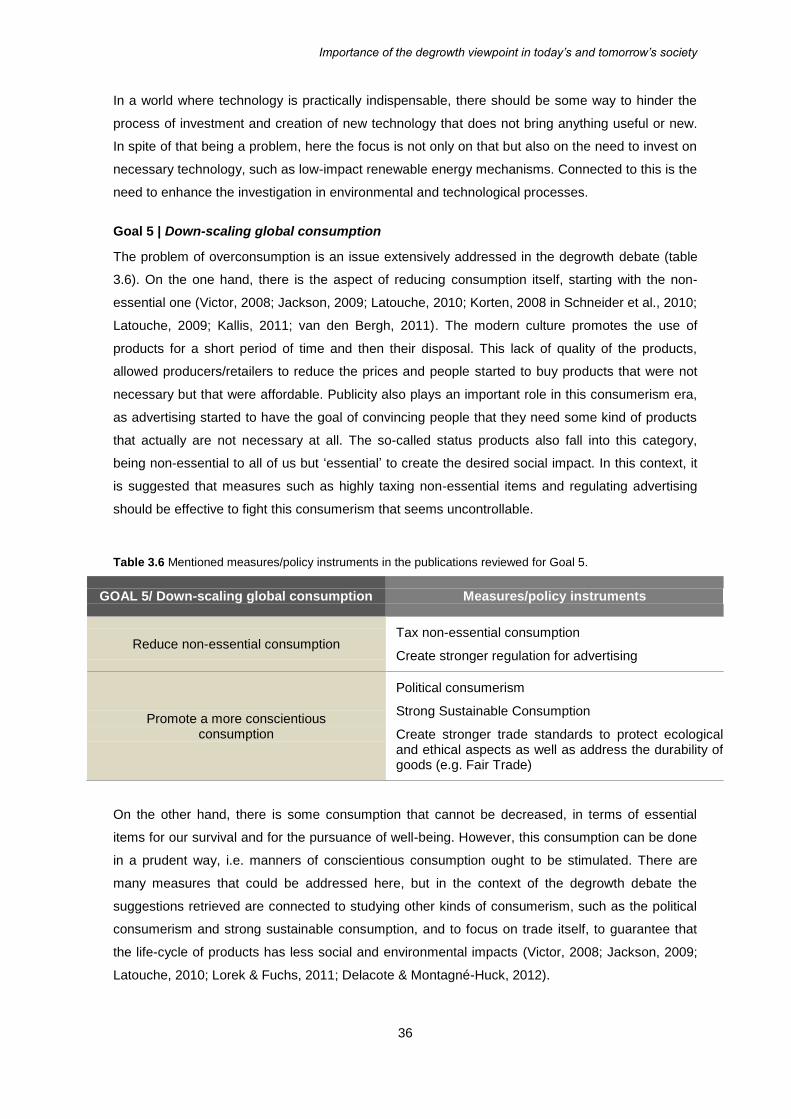
Importance of the degrowth viewpoint in today’s and tomorrow’s society
36
In a world where technology is practically indispensable, there should be some way to hinder the
process of investment and creation of new technology that does not bring anything useful or new.
In spite of that being a problem, here the focus is not only on that but also on the need to invest on
necessary technology, such as low-impact renewable energy mechanisms. Connected to this is the
need to enhance the investigation in environmental and technological processes.
Goal 5 | Down-scaling global consumption
The problem of overconsumption is an issue extensively addressed in the degrowth debate (table
3.6). On the one hand, there is the aspect of reducing consumption itself, starting with the non-
essential one (Victor, 2008; Jackson, 2009; Latouche, 2010; Korten, 2008 in Schneider et al., 2010;
Latouche, 2009; Kallis, 2011; van den Bergh, 2011). The modern culture promotes the use of
products for a short period of time and then their disposal. This lack of quality of the products,
allowed producers/retailers to reduce the prices and people started to buy products that were not
necessary but that were affordable. Publicity also plays an important role in this consumerism era,
as advertising started to have the goal of convincing people that they need some kind of products
that actually are not necessary at all. The so-called status products also fall into this category,
being non-essential to all of us but ‘essential’ to create the desired social impact. In this context, it
is suggested that measures such as highly taxing non-essential items and regulating advertising
should be effective to fight this consumerism that seems uncontrollable.
Table 3.6 Mentioned measures/policy instruments in the publications reviewed for Goal 5.
GOAL 5/ Down-scaling global consumption Measures/policy instruments
Reduce non-essential consumption Tax non-essential consumption
Create stronger regulation for advertising
Promote a more conscientious consumption
Political consumerism
Strong Sustainable Consumption
Create stronger trade standards to protect ecological and ethical aspects as well as address the durability of goods (e.g. Fair Trade)
On the other hand, there is some consumption that cannot be decreased, in terms of essential
items for our survival and for the pursuance of well-being. However, this consumption can be done
in a prudent way, i.e. manners of conscientious consumption ought to be stimulated. There are
many measures that could be addressed here, but in the context of the degrowth debate the
suggestions retrieved are connected to studying other kinds of consumerism, such as the political
consumerism and strong sustainable consumption, and to focus on trade itself, to guarantee that
the life-cycle of products has less social and environmental impacts (Victor, 2008; Jackson, 2009;
Latouche, 2010; Lorek & Fuchs, 2011; Delacote & Montagné-Huck, 2012).
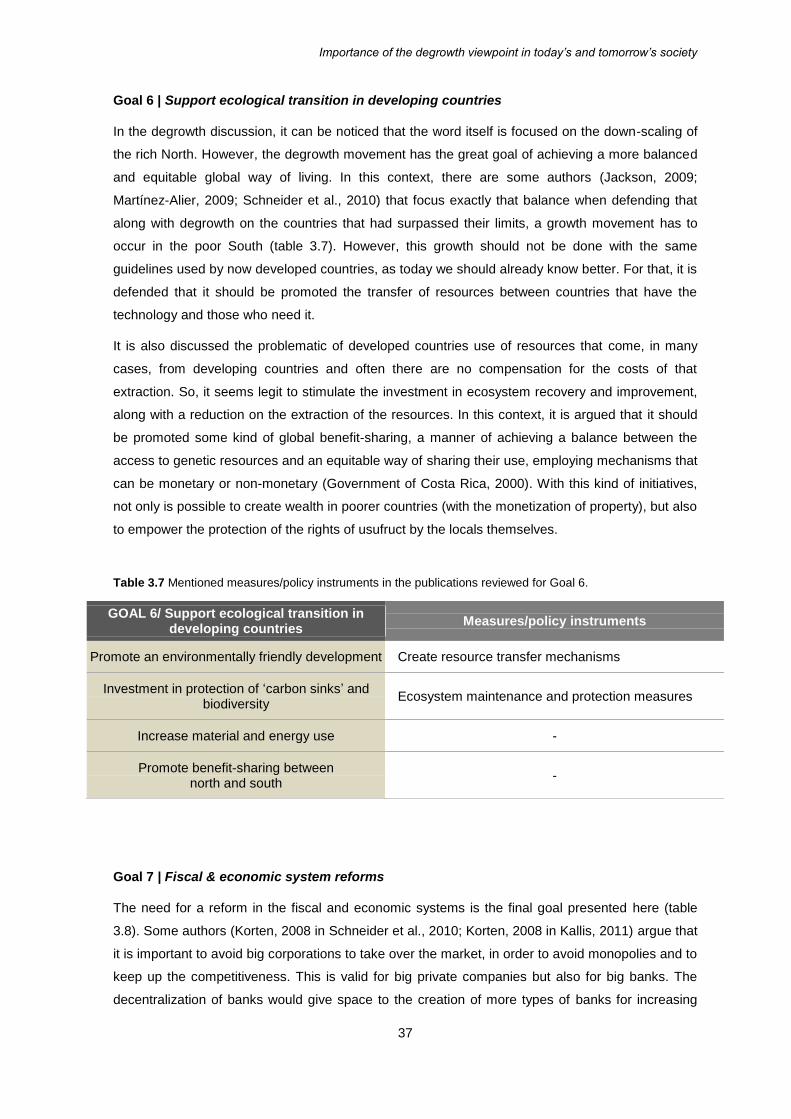
Importance of the degrowth viewpoint in today’s and tomorrow’s society
37
Goal 6 | Support ecological transition in developing countries
In the degrowth discussion, it can be noticed that the word itself is focused on the down-scaling of
the rich North. However, the degrowth movement has the great goal of achieving a more balanced
and equitable global way of living. In this context, there are some authors (Jackson, 2009;
Martínez-Alier, 2009; Schneider et al., 2010) that focus exactly that balance when defending that
along with degrowth on the countries that had surpassed their limits, a growth movement has to
occur in the poor South (table 3.7). However, this growth should not be done with the same
guidelines used by now developed countries, as today we should already know better. For that, it is
defended that it should be promoted the transfer of resources between countries that have the
technology and those who need it.
It is also discussed the problematic of developed countries use of resources that come, in many
cases, from developing countries and often there are no compensation for the costs of that
extraction. So, it seems legit to stimulate the investment in ecosystem recovery and improvement,
along with a reduction on the extraction of the resources. In this context, it is argued that it should
be promoted some kind of global benefit-sharing, a manner of achieving a balance between the
access to genetic resources and an equitable way of sharing their use, employing mechanisms that
can be monetary or non-monetary (Government of Costa Rica, 2000). With this kind of initiatives,
not only is possible to create wealth in poorer countries (with the monetization of property), but also
to empower the protection of the rights of usufruct by the locals themselves.
Table 3.7 Mentioned measures/policy instruments in the publications reviewed for Goal 6.
Goal 7 | Fiscal & economic system reforms
The need for a reform in the fiscal and economic systems is the final goal presented here (table
3.8). Some authors (Korten, 2008 in Schneider et al., 2010; Korten, 2008 in Kallis, 2011) argue that
it is important to avoid big corporations to take over the market, in order to avoid monopolies and to
keep up the competitiveness. This is valid for big private companies but also for big banks. The
decentralization of banks would give space to the creation of more types of banks for increasing
GOAL 6/ Support ecological transition in developing countries
Measures/policy instruments
Promote an environmentally friendly development Create resource transfer mechanisms
Investment in protection of ‘carbon sinks’ and biodiversity
Ecosystem maintenance and protection measures
Increase material and energy use -
Promote benefit-sharing between north and south
-
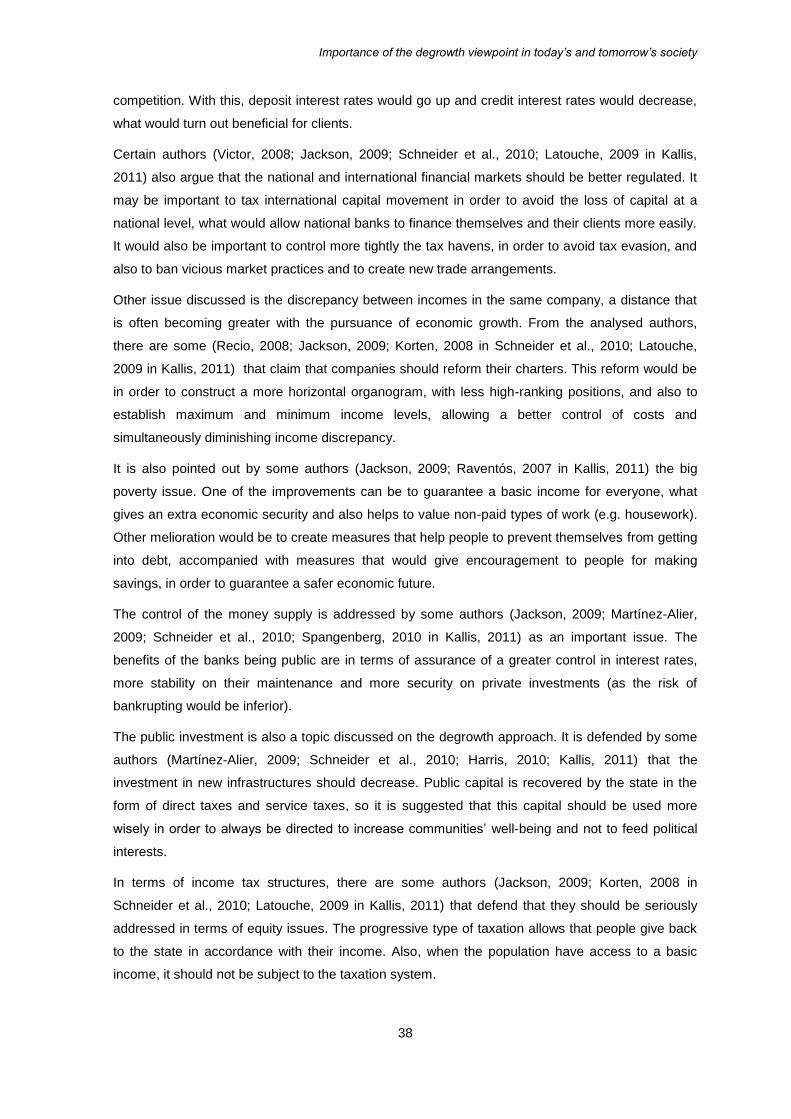
Importance of the degrowth viewpoint in today’s and tomorrow’s society
38
competition. With this, deposit interest rates would go up and credit interest rates would decrease,
what would turn out beneficial for clients.
Certain authors (Victor, 2008; Jackson, 2009; Schneider et al., 2010; Latouche, 2009 in Kallis,
2011) also argue that the national and international financial markets should be better regulated. It
may be important to tax international capital movement in order to avoid the loss of capital at a
national level, what would allow national banks to finance themselves and their clients more easily.
It would also be important to control more tightly the tax havens, in order to avoid tax evasion, and
also to ban vicious market practices and to create new trade arrangements.
Other issue discussed is the discrepancy between incomes in the same company, a distance that
is often becoming greater with the pursuance of economic growth. From the analysed authors,
there are some (Recio, 2008; Jackson, 2009; Korten, 2008 in Schneider et al., 2010; Latouche,
2009 in Kallis, 2011) that claim that companies should reform their charters. This reform would be
in order to construct a more horizontal organogram, with less high-ranking positions, and also to
establish maximum and minimum income levels, allowing a better control of costs and
simultaneously diminishing income discrepancy.
It is also pointed out by some authors (Jackson, 2009; Raventós, 2007 in Kallis, 2011) the big
poverty issue. One of the improvements can be to guarantee a basic income for everyone, what
gives an extra economic security and also helps to value non-paid types of work (e.g. housework).
Other melioration would be to create measures that help people to prevent themselves from getting
into debt, accompanied with measures that would give encouragement to people for making
savings, in order to guarantee a safer economic future.
The control of the money supply is addressed by some authors (Jackson, 2009; Martínez-Alier,
2009; Schneider et al., 2010; Spangenberg, 2010 in Kallis, 2011) as an important issue. The
benefits of the banks being public are in terms of assurance of a greater control in interest rates,
more stability on their maintenance and more security on private investments (as the risk of
bankrupting would be inferior).
The public investment is also a topic discussed on the degrowth approach. It is defended by some
authors (Martínez-Alier, 2009; Schneider et al., 2010; Harris, 2010; Kallis, 2011) that the
investment in new infrastructures should decrease. Public capital is recovered by the state in the
form of direct taxes and service taxes, so it is suggested that this capital should be used more
wisely in order to always be directed to increase communities’ well-being and not to feed political
interests.
In terms of income tax structures, there are some authors (Jackson, 2009; Korten, 2008 in
Schneider et al., 2010; Latouche, 2009 in Kallis, 2011) that defend that they should be seriously
addressed in terms of equity issues. The progressive type of taxation allows that people give back
to the state in accordance with their income. Also, when the population have access to a basic
income, it should not be subject to the taxation system.
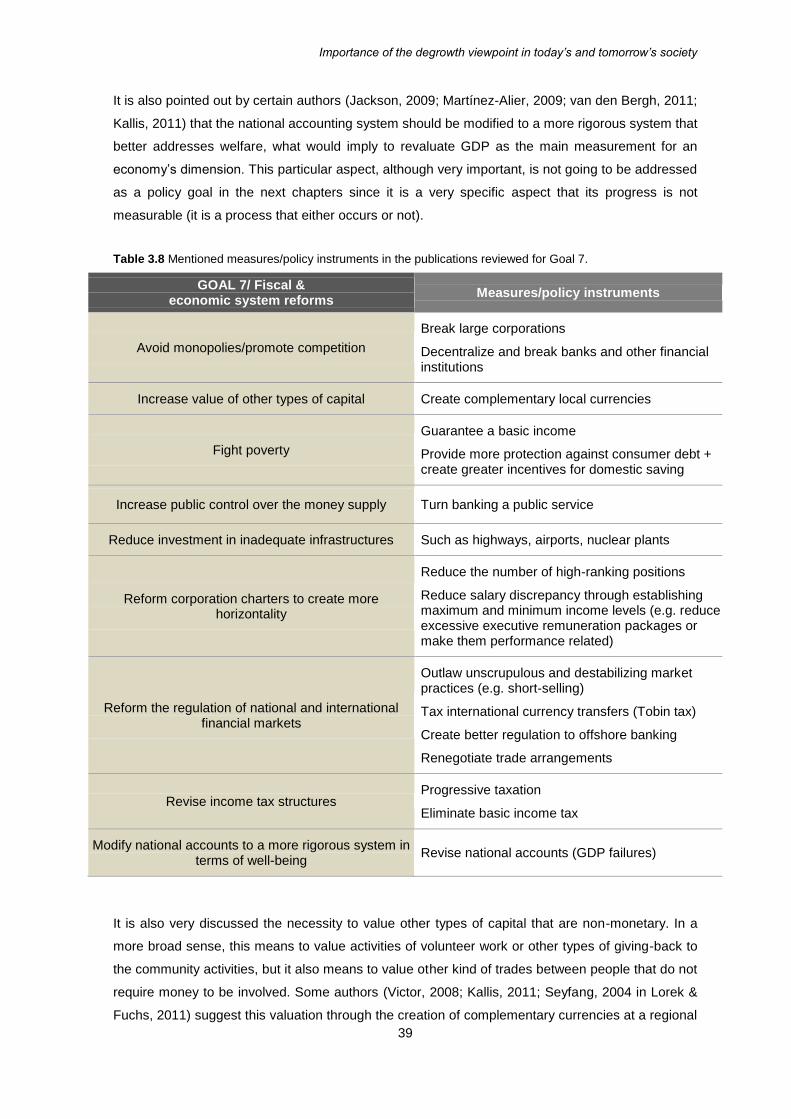
Importance of the degrowth viewpoint in today’s and tomorrow’s society
39
It is also pointed out by certain authors (Jackson, 2009; Martínez-Alier, 2009; van den Bergh, 2011;
Kallis, 2011) that the national accounting system should be modified to a more rigorous system that
better addresses welfare, what would imply to revaluate GDP as the main measurement for an
economy’s dimension. This particular aspect, although very important, is not going to be addressed
as a policy goal in the next chapters since it is a very specific aspect that its progress is not
measurable (it is a process that either occurs or not).
Table 3.8 Mentioned measures/policy instruments in the publications reviewed for Goal 7.
GOAL 7/ Fiscal & economic system reforms
Measures/policy instruments
Avoid monopolies/promote competition
Break large corporations
Decentralize and break banks and other financial institutions
Increase value of other types of capital Create complementary local currencies
Fight poverty
Guarantee a basic income
Provide more protection against consumer debt + create greater incentives for domestic saving
Increase public control over the money supply Turn banking a public service
Reduce investment in inadequate infrastructures Such as highways, airports, nuclear plants
Reform corporation charters to create more horizontality
Reduce the number of high-ranking positions
Reduce salary discrepancy through establishing maximum and minimum income levels (e.g. reduce excessive executive remuneration packages or make them performance related)
Reform the regulation of national and international financial markets
Outlaw unscrupulous and destabilizing market practices (e.g. short-selling)
Tax international currency transfers (Tobin tax)
Create better regulation to offshore banking
Renegotiate trade arrangements
Revise income tax structures Progressive taxation
Eliminate basic income tax
Modify national accounts to a more rigorous system in terms of well-being
Revise national accounts (GDP failures)
It is also very discussed the necessity to value other types of capital that are non-monetary. In a
more broad sense, this means to value activities of volunteer work or other types of giving-back to
the community activities, but it also means to value other kind of trades between people that do not
require money to be involved. Some authors (Victor, 2008; Kallis, 2011; Seyfang, 2004 in Lorek &
Fuchs, 2011) suggest this valuation through the creation of complementary currencies at a regional
Importance of the degrowth viewpoint in today’s and tomorrow’s society
40
level to fight globalization disadvantages, i.e. to ease the problems that some regions with less
market power face to be profitable in their economic activities. This complementary currency can
also be an advantage to poorer people, since it probably would be easier to fulfil the basic needs.
3.2.4. Degrowth policy goals versus sustainability goals for policy-making
In order to understand how the specific policy goals of degrowth movement were connected with
the sustainability goals for policy-making discussed previously, a comparison was done between
these two dimensions. This was done to understand where degrowth policy goals fitted in terms of
aiming for a sustainable scale, a just development and an efficient allocation. The policy goals can
have multiple interpretations of their final result, so some of them were considered to fit in more
than one category. Some of them are quite doubtful in their interpretation and therefore were
connected to the category that was thought to be the one which made more sense (policy goals
that have a question mark instead of a dot). The results are presented in tables 3.9 and 3.10.
Table 3.9 Comparison between degrowth policy goals and their general aim towards sustainability.
Policy goals Sustainable
scale Justice
Efficient allocation
Go
al 1
Create and protect shared public spaces
●
Encourage community-based sustainability initiatives and 'voluntary simplicity'
● ● ●
Decentralize and deepen democratic institutions
●
Fight discrimination
●
Fight crime
?
Promote social cohesion and solidarity
●
Reduce working-time ● ●
Minify unemployment
● ●
Improve local environment in deprived areas
● ●
Go
al 2
Reduce geographical labour mobility ●
●
Protect and invest in culture, sports and recreation
●
Investment in health and education
● ●
Go
al 3
Identify clear resource and emission caps and establish reduction targets
●
Reduce waste emissions ●
Reduce resource extraction ●
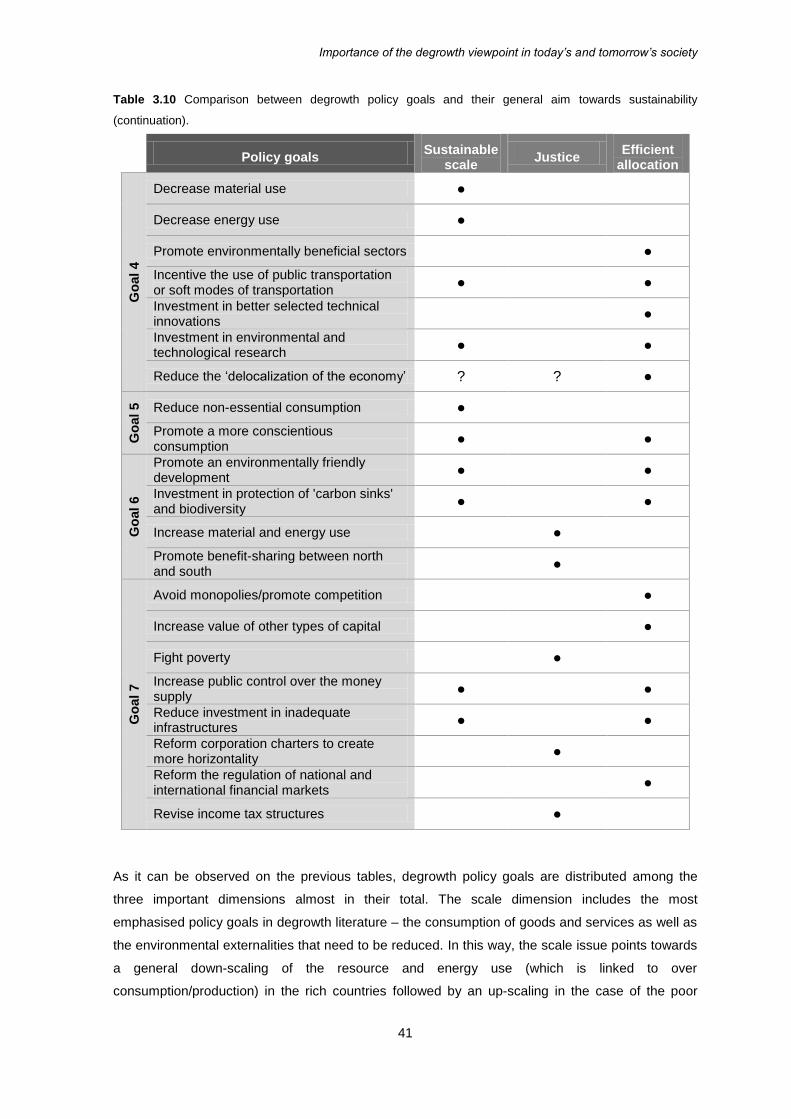
Importance of the degrowth viewpoint in today’s and tomorrow’s society
41
Table 3.10 Comparison between degrowth policy goals and their general aim towards sustainability
(continuation).
Policy goals Sustainable
scale Justice
Efficient allocation
Go
al 4
Decrease material use ●
Decrease energy use ●
Promote environmentally beneficial sectors ●
Incentive the use of public transportation or soft modes of transportation
● ●
Investment in better selected technical innovations
●
Investment in environmental and technological research
● ●
Reduce the ‘delocalization of the economy’ ? ? ●
Go
al 5
Reduce non-essential consumption ●
Promote a more conscientious consumption
●
●
Go
al 6
Promote an environmentally friendly development
●
●
Investment in protection of 'carbon sinks' and biodiversity
●
●
Increase material and energy use
●
Promote benefit-sharing between north and south
●
Go
al 7
Avoid monopolies/promote competition
●
Increase value of other types of capital
●
Fight poverty
●
Increase public control over the money supply
●
●
Reduce investment in inadequate infrastructures
●
●
Reform corporation charters to create more horizontality
●
Reform the regulation of national and international financial markets
●
Revise income tax structures
●
As it can be observed on the previous tables, degrowth policy goals are distributed among the
three important dimensions almost in their total. The scale dimension includes the most
emphasised policy goals in degrowth literature – the consumption of goods and services as well as
the environmental externalities that need to be reduced. In this way, the scale issue points towards
a general down-scaling of the resource and energy use (which is linked to over
consumption/production) in the rich countries followed by an up-scaling in the case of the poor

Importance of the degrowth viewpoint in today’s and tomorrow’s society
42
countries that still have space to grow, what will have implications on economic growth of both
types of countries.
The justice matter is also a very important one since it includes all the issues related to the
accessibility of services and resources, the processes of social inclusion and participation and also
the wealth equality. If a society goes through a process of economic degrowth without addressing
these social issues, the result is an even greater inequality between social classes.
In spite of the efficient allocation is the last policy-making goal to be addressed that does not
compromise its importance. Every goal that aims to improve the efficiency of an existing process or
to change the focus of investments is a part of this dimension.
Some of the policy goals analysed can be directly categorized as being a scale, justice of efficiency
issue, some of them are not that direct. This is the case of the crime issue as well as the
delocalization of the economy aspect. Fighting crime is a question of enhancing security and
therefore, people wellbeing. However, it is also a question of offering security in a global view, so
that everyone has the same opportunities for a good life. In this context, this goal was classified as
being a justice issue. As for the goal of reducing the delocalization of the economy, it can be
interpreted as being an efficiency issue, since it is very inefficient to produce a certain good in
Malaysia, to be packed in Spain and then being sold in Portugal. Nonetheless, this aspect in
particular can also be seen as a scale issue, since it is common that a product has pieces that
were produced in several different countries and then assembled in another one to create the final
piece, what enlarges the scale of the production process. Moreover, it can be seen as a justice
issue, since the delocalization of the production is often done to developing countries which do not
have environmental laws and have cheap labour.

Sustainability assessment indicators and the degrowth concept
43
Chapter 4. Sustainability assessment indicators and the degrowth concept
4.1. The importance of measuring and how can the existing indicators
be used to assess degrowth
Indicators are tools that are used to facilitate the analysis of complex systems, by dividing them in
different compounds so that they can be evaluated separately. When it comes to their
interpretation, indicators can be absolute values or show trends if we are talking about data within a
certain period of time. They can be composed of qualitative and/or quantitative information that try
to mirror reality, in spite of being based on indeterminate and flawed models of it (D. H. Meadows,
1998).
In terms of their utility, indicators can be used for monitoring progress and also they are a popular
method of comparing nations by creating rankings, what can bring benefits as they might function
like a coercion tool (Moldan et al., 2011). In the context of this work, it is important to understand
what their relevance is when it comes to assess specifically policy. This relevance can be
measured by what is called the ‘resonance’ of the indicator, i.e. if an indicator is able to show its
results to the specific audience that is intended (Hezri & Dovers, 2006). With this, it emerges the
question of who is that audience for whom the indicator systems are made for. Although indicators
can concern both means and ends of an analysis, in terms of ends they have distinguished by
having five main purposes (Dovers, 2001; Failing & Gregory, 2003 in Hezri & Dovers, 2006):
In an academic context, to distinguish between competing hypothesis;
To get a better understanding on the subjects, by structuring their aspects and then
conceptualise solutions;
To monitor performance (in a results-based context);
To differentiate between alternative policies (for specific decisions or general policy directions);
To inform the users (public, stakeholders, community).
There are some delicate issues when it comes to measure things. On the one hand, indicators can
be tools of change through information or creation of policies, since they should be able to measure
the distance from means to goals. On the other hand, there is the risk of them being overused and
becoming the goals itself. This happened, for instance, with GDP that the growth is now a goal
itself instead of being a mean to achieve other ends, such as ultimately human well-being. This is
not the purpose of degrowth, as itself should be a mean to pursue the desired final result, a
sustainable way of living, free of the economic growth pursuance without any social or
environmental goals.
In spite of being difficult, this is not a reason to avoid measuring. The truth is that “not only do we
measure what we value, we also come to value what we measure” (D. H. Meadows, 1998, p.2),
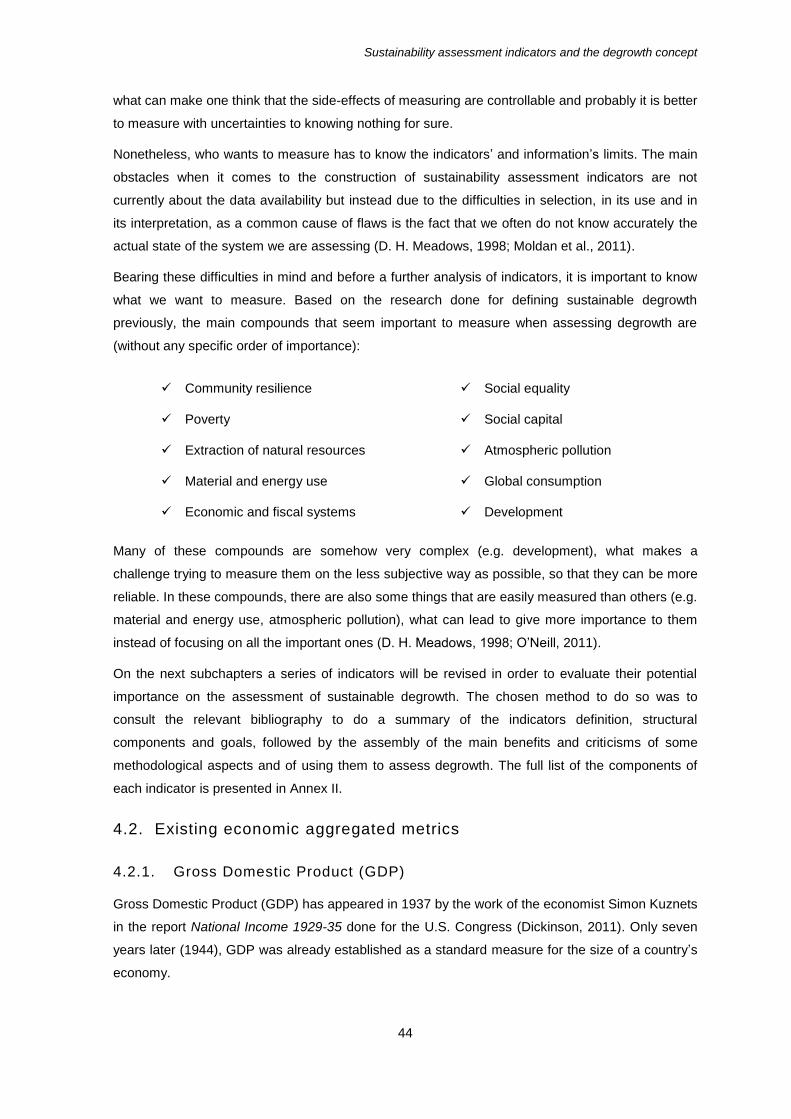
Sustainability assessment indicators and the degrowth concept
44
what can make one think that the side-effects of measuring are controllable and probably it is better
to measure with uncertainties to knowing nothing for sure.
Nonetheless, who wants to measure has to know the indicators’ and information’s limits. The main
obstacles when it comes to the construction of sustainability assessment indicators are not
currently about the data availability but instead due to the difficulties in selection, in its use and in
its interpretation, as a common cause of flaws is the fact that we often do not know accurately the
actual state of the system we are assessing (D. H. Meadows, 1998; Moldan et al., 2011).
Bearing these difficulties in mind and before a further analysis of indicators, it is important to know
what we want to measure. Based on the research done for defining sustainable degrowth
previously, the main compounds that seem important to measure when assessing degrowth are
(without any specific order of importance):
Many of these compounds are somehow very complex (e.g. development), what makes a
challenge trying to measure them on the less subjective way as possible, so that they can be more
reliable. In these compounds, there are also some things that are easily measured than others (e.g.
material and energy use, atmospheric pollution), what can lead to give more importance to them
instead of focusing on all the important ones (D. H. Meadows, 1998; O’Neill, 2011).
On the next subchapters a series of indicators will be revised in order to evaluate their potential
importance on the assessment of sustainable degrowth. The chosen method to do so was to
consult the relevant bibliography to do a summary of the indicators definition, structural
components and goals, followed by the assembly of the main benefits and criticisms of some
methodological aspects and of using them to assess degrowth. The full list of the components of
each indicator is presented in Annex II.
4.2. Existing economic aggregated metrics
4.2.1. Gross Domestic Product (GDP)
Gross Domestic Product (GDP) has appeared in 1937 by the work of the economist Simon Kuznets
in the report National Income 1929-35 done for the U.S. Congress (Dickinson, 2011). Only seven
years later (1944), GDP was already established as a standard measure for the size of a country’s
economy.
Community resilience Social equality
Poverty Social capital
Extraction of natural resources Atmospheric pollution
Material and energy use Global consumption
Economic and fiscal systems Development

Sustainability assessment indicators and the degrowth concept
45
This indicator is defined by the World Bank (2011, p.13) as “the sum of value added by all resident
producers plus any product taxes (less subsidies) not included in the valuation of output”. Even if
this is the definition mostly accepted, it is not the only interpretation. For instance, Jeroen van den
Bergh (2010) disagrees with this definition and believes that a best interpretation for this metric is
that, instead of estimating the benefits, it really estimates the costs of the market and other related
activities.
According to Samuelson and Nordhaus (2005), GDP can be calculated using three approaches.
The most common one is the expenditure approach, where GDP is calculated in a consumption
and investment view. The other one is the income approach, which is focused on gains as sources
of GDP growth. The third one is the product approach, which is focused on the market value-added
of the products (WB definition).
In spite of the possible ambiguity of the real meaning of GDP, it is currently the standard way of
measuring countries’ economic growth, by comparison. Also it is broadly used worldwide, despite
from having always been criticized as a country’s development indicator.
Benefits and limitations
GDP is an indicator largely accepted and used by worldwide decision-makers and so it has a major
influential role in economics and policy-making. Due to this it is arguable if it could continue to be
used in the future, at least for the real information that it gives instead of being directly used as a
nation’s development indicator. In terms of degrowth, it has already been argued (O’Neill, 2011)
that it can be used to demonstrate if it is occurring a decrease in economy (so it would be used with
the opposite sense that nowadays has).
Other benefit of GDP is that it represents the part of well-being connected to consumption on
established markets. Humanity well-being is composed by many things, being one of them the
consumption of services and goods that are valued on the market. GDP is able to measure in
monetary terms this part of well-being.
On the other hand, it is argued that GDP is not accurate in measuring national income (NI).
According to Lawn (2003), the concrete purpose of calculating NI is to know the maximum quantity
a nation can produce and consume without losing the capacity of producing and consuming the
same quantity on the forthcoming years. In GDP accounting this is not possible to quantify, since
(1) it would be compulsory that a percentage of annual GDP was saved to replace damaged
producer and consumer goods; (2) production and consumption is often unsustainable, which
brings side-effect costs and (3) the outcomes of plenty of economic activities do not go all to direct
consumption but instead they are also used for nations self-protection from the side-effects of
those past and present activities, values that in GDP are threated also as incomes when they
should be costs.
Moreover, GDP assumes as current benefits the production of further human-made capital (durable
producer and consumer goods), when they will only be useful in the future (Lawn & Clarke, 2010).
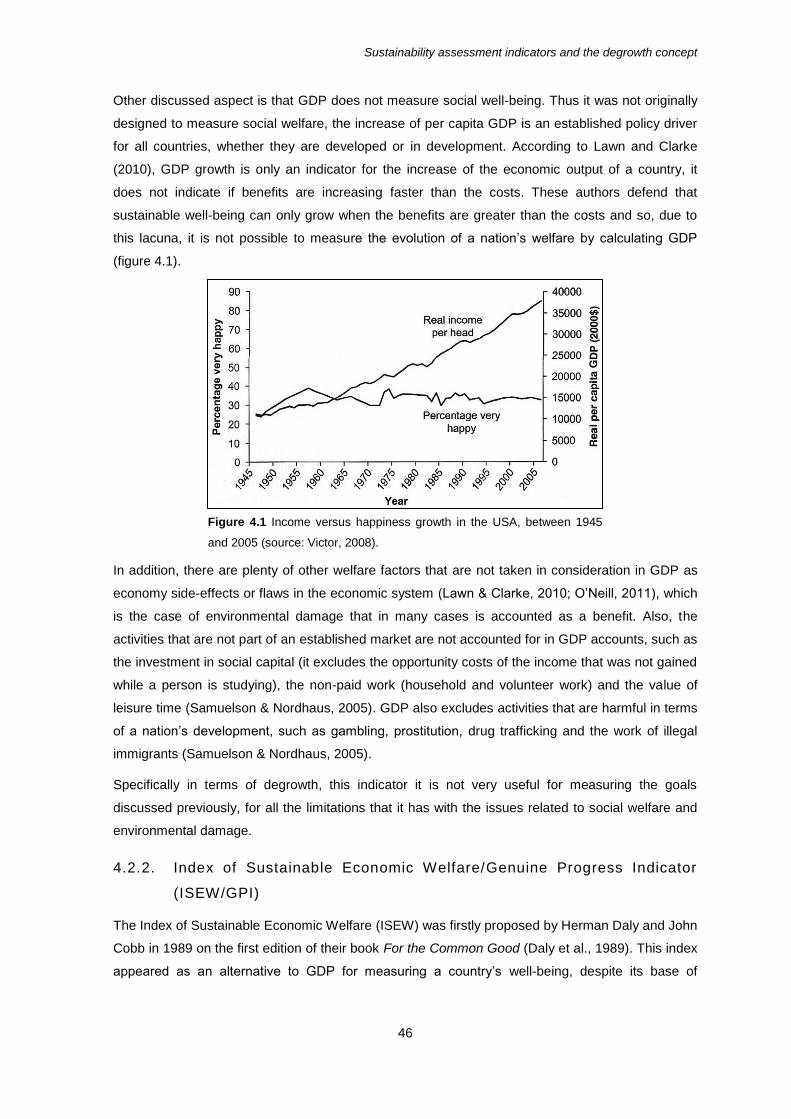
Sustainability assessment indicators and the degrowth concept
46
Other discussed aspect is that GDP does not measure social well-being. Thus it was not originally
designed to measure social welfare, the increase of per capita GDP is an established policy driver
for all countries, whether they are developed or in development. According to Lawn and Clarke
(2010), GDP growth is only an indicator for the increase of the economic output of a country, it
does not indicate if benefits are increasing faster than the costs. These authors defend that
sustainable well-being can only grow when the benefits are greater than the costs and so, due to
this lacuna, it is not possible to measure the evolution of a nation’s welfare by calculating GDP
(figure 4.1).
In addition, there are plenty of other welfare factors that are not taken in consideration in GDP as
economy side-effects or flaws in the economic system (Lawn & Clarke, 2010; O’Neill, 2011), which
is the case of environmental damage that in many cases is accounted as a benefit. Also, the
activities that are not part of an established market are not accounted for in GDP accounts, such as
the investment in social capital (it excludes the opportunity costs of the income that was not gained
while a person is studying), the non-paid work (household and volunteer work) and the value of
leisure time (Samuelson & Nordhaus, 2005). GDP also excludes activities that are harmful in terms
of a nation’s development, such as gambling, prostitution, drug trafficking and the work of illegal
immigrants (Samuelson & Nordhaus, 2005).
Specifically in terms of degrowth, this indicator it is not very useful for measuring the goals
discussed previously, for all the limitations that it has with the issues related to social welfare and
environmental damage.
4.2.2. Index of Sustainable Economic Welfare/Genuine Progress Indicator
(ISEW/GPI)
The Index of Sustainable Economic Welfare (ISEW) was firstly proposed by Herman Daly and John
Cobb in 1989 on the first edition of their book For the Common Good (Daly et al., 1989). This index
appeared as an alternative to GDP for measuring a country’s well-being, despite its base of
Figure 4.1 Income versus happiness growth in the USA, between 1945
and 2005 (source: Victor, 2008).

Sustainability assessment indicators and the degrowth concept
47
calculation it is not GDP but instead it is calculated by extracting the trades associated with human
well-being from national accounts (Lawn, 2003).
The Genuine Progress Indicator (GPI) was developed by a non-profitable association called
Redefining Progress and it is a variation from the ISEW mainly in terms of methodology as the data
used is almost the same (Talberth et al., 2007) and the comparison between their components is
represented in table 4.1.
Table 4.1. Comparison between the components of ISEW and GPI (based on information from Talberth et al.,
2006 and Beça and Santos, 2010)
Components ISEW GPI
Econo
mic
Costs of consumer durables Net capital investment Net foreign borrowing Public health and education expenses
Services of consumer durables
Value of higher education
Weighted personal consumption
Durable goods private expenses
Socia
l
Cost of family breakdown
Costs of automobile accidents Costs of commuting Costs of crime Costs of underemployment Loss of leisure time Services of highways and streets Value of housework and parenting Value of volunteer work
Enviro
nm
enta
l
Carbon dioxide emissions damage/cost of GHG emission Cost of marine and freshwater fisheries overexploitation
Cost of soil loss
Cost of the introduction of alien-invasive species
Costs of air pollution Costs of household pollution abatement Costs of noise pollution Costs of ozone depletion Costs of water pollution Depletion of non-renewable energy resources Loss of farmland Loss of primary forests and damage from logging roads Loss of wetlands
These two measures use a different sense of costs and benefits. For their calculation, the costs for
society include environmental degradation, income inequality, less free time and costs of crime
whereas benefits comprise volunteering work, housework, services from consumer durables and
public infrastructure (Talberth et al., 2007). With this, national accounts are calculated in a different
way than with GDP, trying to make the distinction between economic activity for itself and the one
that really adds benefits to human well-being. With this, consumption starts to be not only related to
market-related goods and services but instead defined considering well-being first and integrating
procedures that aim to change the value of capital stocks (C. Hamilton, 1999). Following this
viewpoint, there are benefits of also having a clear dissimilarity between economic activities that
improve natural and social capital and the ones which deplete it, whereas with GDP it is not
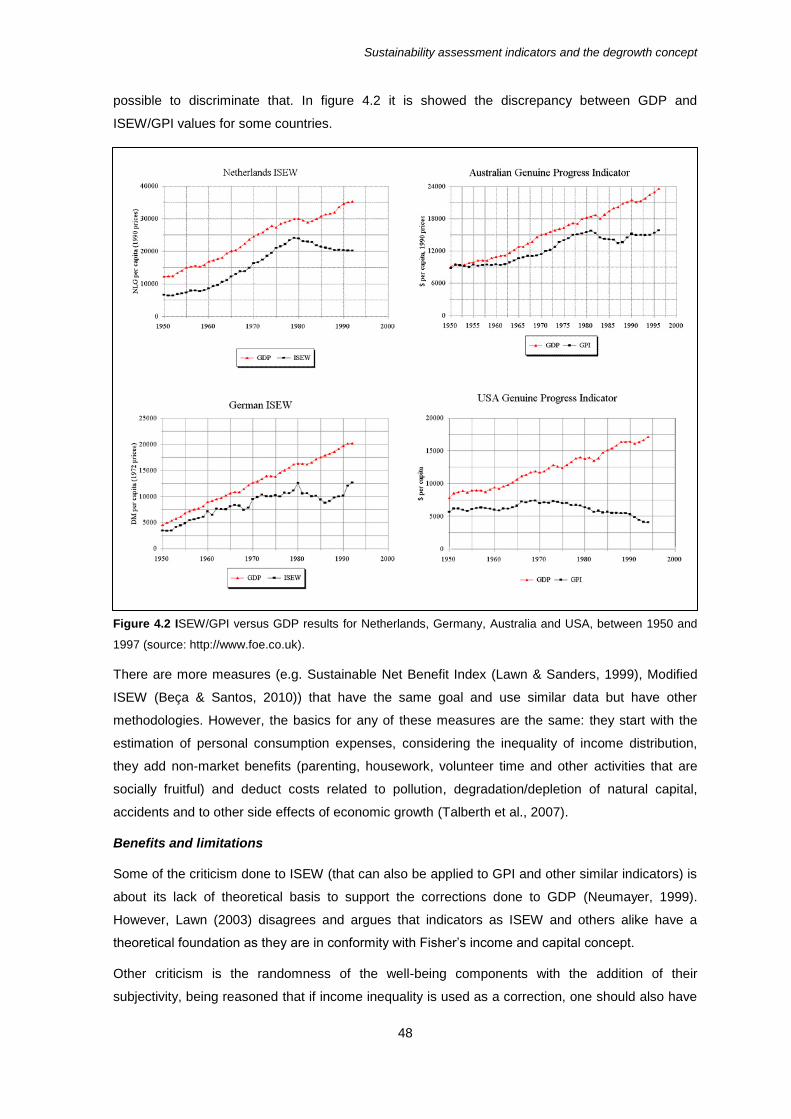
Sustainability assessment indicators and the degrowth concept
48
possible to discriminate that. In figure 4.2 it is showed the discrepancy between GDP and
ISEW/GPI values for some countries.
There are more measures (e.g. Sustainable Net Benefit Index (Lawn & Sanders, 1999), Modified
ISEW (Beça & Santos, 2010)) that have the same goal and use similar data but have other
methodologies. However, the basics for any of these measures are the same: they start with the
estimation of personal consumption expenses, considering the inequality of income distribution,
they add non-market benefits (parenting, housework, volunteer time and other activities that are
socially fruitful) and deduct costs related to pollution, degradation/depletion of natural capital,
accidents and to other side effects of economic growth (Talberth et al., 2007).
Benefits and limitations
Some of the criticism done to ISEW (that can also be applied to GPI and other similar indicators) is
about its lack of theoretical basis to support the corrections done to GDP (Neumayer, 1999).
However, Lawn (2003) disagrees and argues that indicators as ISEW and others alike have a
theoretical foundation as they are in conformity with Fisher’s income and capital concept.
Other criticism is the randomness of the well-being components with the addition of their
subjectivity, being reasoned that if income inequality is used as a correction, one should also have
Figure 4.2 ISEW/GPI versus GDP results for Netherlands, Germany, Australia and USA, between 1950 and
1997 (source: http://www.foe.co.uk).

Sustainability assessment indicators and the degrowth concept
49
correction terms for issues like political freedom or equality between sexes (Neumayer, 1999).
There are also other welfare factors not included, for instance the uselessness of certain forms of
work and the natural capital values of existence (Lawn, 2003).
In terms of methodology limitations, Beça and Santos (2010) compiled the main aspects referred in
the relevant literature: the method to define the value of externalities (flows versus stocks); the
faulty corroboration of some economic values of externalities; the need for an analysis to evaluate
the result of the ISEW when there are so many different methodologies. There are also aspects as
the dominance of some aspects relatively to others, what can lead to inflated values due to small
variations in the dominant ones, and the fact that personal consumption expenditure is assumed as
always have a contribution to well-being, what might not be that linear (Neumayer, 1999; Lawn,
2003; Beça & Santos, 2010).
When it comes to the assessment of degrowth goals, this measure is very focused on costs and so
it may not be the best metric to assess what is important in the goals discussed, in spite of covering
many interesting areas.
4.2.3. Adjusted Net Savings or Genuine Savings (ANS or GS)
In the context of emergent environmental concerns due to 1992 Rio Conference, the Adjusted Net
Savings appeared as an indicator of sustainability in 1993, by the early work of Pearce and
Atkinson that initially estimated this index for 18 countries (K. Hamilton et al., 1997; Dietz &
Neumayer, 2006). The work done by Hamilton in following years in terms of welfare measures
having in consideration living and non-living resources, potentially new resources and pollutants,
resulted in a savings measure equivalent to the ANS that was called “genuine saving” (K. Hamilton
et al., 1997). Since 1999 it has been calculated by the World Bank (WB) that publishes the results
on their annual reports: the World Development Indicators.
The ANS is an indicator of whether human activities lead to a depreciation of total capital that is
going to exceed investment in all forms of capital (Dietz & Neumayer, 2006). Its interpretation is
that values of ANS that are equal or above zero are the ones to pursue, albeit this is not a sufficient
condition to achieve sustainability (Dietz & Neumayer, 2006). This index is a measure of weak
sustainability as it does not count with the maximum use of natural assets or with limits to
substitutability of natural and produced assets and, similarly to ISEW, the values are in terms of
money with the aggregation method of summing them (K. Hamilton et al., 1997; Böhringer &
Jochem, 2007).
Benefits and limitations
The main criticisms to ANS were listed by Dietz and Neumayer (2006). These include the fact that
this index is based on a model of an always efficient economy, what may lead to ambiguities in the
positive or negative value of ANS (a positive ANS can be associated with the unsustainable
extraction of natural resources). This efficiency-based model is also a problem when it comes to
exogenous shocks, as exogenous technology progress, terms-of-trade effects and non-constant
discount rate. Also the basic calculation of ANS assumes a constant population, what leads to
Sustainability assessment indicators and the degrowth concept
50
inaccuracies especially in the developing world. The authors point out flaws in the measurement of
natural capital depreciation and on the estimation of environmental pollution damage (it is still only
available for carbon dioxide and particulate matter), on the WB method to calculate ANS.
The ANS is an indicator that is interesting to analyse aspects that are related to environmental
damages associated with human economic activity but it does not cover almost any other aspect
that is related to degrowth goals.
4.2.4. System of Environmental-Economic Accounting (SEEA) – Green
National Product or Environmentally Adjusted Net Domestic Product
or Ecological Domestic Product (GNP or eaNDP or EDP)
The System of Environmental-Economic Accounting was developed by the UN as a component of
the System of National Accounts (SNA) and has four categories: physical data (flows of materials
and energy) and hybrid flow accounts (physical and monetary terms combined); analysis of how to
explicit environmental-related transactions on elements of the existing SNA that have importance in
terms of good management of the environment; environmental assets measured in physical and
monetary terms; analysis of how to adjust the SNA to account the side-effects of our economy on
the environment (relating to depletion, defensive expenditures or degradation) (UN et al., 2003).
This system is currently under a revision process and it is planned to be released a new edition in
2014 (UN, 2012).
The Ecological Domestic Product (EDP) appeared in the context of this developed accounting
system. Despite of its many nomenclatures, EDP basic idea is being a somewhat ‘green’ version of
GDP. According to Shi et al. (2012), EDP can be interpreted as (1) accounting every economic loss
that occurs due to resource consumption and environmental pollution (an approach based on the
theories of resources and environment) or (2) accounting for the value of ecological services and
resources (ecological economics approach).
Its calculation starts with GDP as a basis (or Net Domestic Product – NDP) and then the costs of
the economy are subtracted. For its accounting, it has three versions: EDPI has in account the
depletion of natural resources due to their extraction and subtracts its costs to the net national
income (NNI); EDPII focuses on having the same environmental conditions at the begin and end of
a certain period, subtracting to the NNI the costs necessary to have those conditions; EDPIII
estimates the costs of environmental pressure and damages (willingness-to-pay approaches), adds
them and then subtracts the total to the NNI (Hanley, 2000).
Benefits and limitations
Dietz and Neumayer (2007) assembled some criticisms done to this index. The main problems
pointed out were that: the comparison between EDP value or its growth rate to the growth rate of
NDP it is not beneficial for construction of policies for sustainable development; the index gives an
instantaneous measure, what does not allow us to conclude if the economy is being developed on
a weak sustainability way or not. Another limitation is the fact that it was not calculated by the UN
Sustainability assessment indicators and the degrowth concept
51
yet. This index does some alterations to GDP but it still does not cover many degrowth-related
aspects.
A very recent publication (Shi et al., 2012) tried to deal with some of EDP’s problems by
constructing a similar but claimed as enhanced indicator called EcoDP. This indicator accounts for
benefits from natural ecosystems services and resources but also for the benefits of ecological
construction pointed towards our well-being. In terms of development costs, it accounts for costs of
natural disasters and for the costs of our activities that harm ecological systems.
4.2.5. Environmentally Sustainable National Income (eSNI ; former SNI)
The Environmentally Sustainable National Income (eSNI) was developed by Roefie Hueting during
his search for a ‘greener’ way of calculating the NI. This is an index that defines the maximum
value for production (possible with the available technology at the time of the analysis) that does
not compromise the vital environmental functions availability for future generations (Hueting, 2011).
This approach is obtained by analysing the trade-off between production and sustainable use of the
ecosystem functions, being the size of the population a crucial variable in the predicted sustainable
state (de Boer & Hueting, 2004).
This index alone measures the distance to which a country is from a sustainable situation,
compared with the current one. Furthermore, it is also used in combination with the standard NI to
analyse the progress of the part of the production that it is considered as non-sustainable, i.e. if it is
becoming a smaller portion or gaining ground (Hueting, 2011).
Benefits and limitations
As EDP, this index it is also very GDP dependent and it does some alterations to GDP but it still
does not cover many degrowth-related aspects. Despite that fact, it is an index that has the benefit
of accounting some degrowth goals more accurately than the latter.
4.3. Existing biophysical and social aggregated metrics
4.3.1. Environmental Performance Index (EPI)
The Environmental Performance Index (EPI) was developed with a great number of contributions
from experts in various areas and its results are published in a report from the Yale Center for
Environmental Law & Policy. This index has two main components - environmental health
(environmental stresses to human health) and ecosystem vitality (ecosystem health and natural
resource management) -, measured by a set of 25 indicators (Emerson et al., 2010).
This index functions with proximity-to-target scores and it ranges from the value 0 to 100,
corresponding to a country’s being at its worst performance or at target, respectively (Emerson et
al., 2010). These targets are, as far as possible, based on international treaties and agreements.
When they are inexistent for certain issues, the data can be based on environmental and public
health standards (published by international organizations and national government), scientific

Sustainability assessment indicators and the degrowth concept
52
literature or specialists’ opinion (Emerson et al., 2010). The results for 2010 are represented in
figure 4.3.
Benefits and limitations
This index is essentially a metric that analyses the environmental state of ecosystems and their
possible uses according to that. Due to this fact, its components are not very relevant for degrowth
assessment in the context that it is presented in this work, since they cover very few areas
discussed.
4.3.2. Living Planet Index (LPI)
The Living Planet Index (LPI) analysis the life trends of 7953 vertebrate population species (WWF,
2010) to evaluate ecosystems’ conditions, bearing in mind that their health is crucial to maintain
biodiversity and the ecological services essential to human survival.
This evaluation is done by comparing the annual rate of change for each species population with
the average change through all populations for each year from 1970 and 2007 (the first and last
years of data availability), with LPI=1 in 1970 (Collen et al., 2009; WWF, 2010). The most recent
trends for this range of years can be seen on figure 4.4.
Figure 4.3 EPI scores for 2010 (source: http://epi.yale.edu/).

Sustainability assessment indicators and the degrowth concept
53
Benefits and limitations
This index is very useful for assessing the state of biodiversity and that is the only component of
degrowth assessment that it covers. Nonetheless, it may be a suitable metric for that component.
4.3.3. Human Appropriation of Net Primary Production (HANPP)
The Human Appropriation of Net Primary Production (HANPP) was initially created by Vitousek et
al. (1986) with the original name of Human Appropriation of the Products of Photosynthesis. This
index makes explicit the land use intensity of a defined area, revealed by means of (1) changes in
land use that alter the net primary product (NPP) in plants in comparison to the potential that they
would have without changes and (2) the effects of extraction/destruction of NPP fraction for human
uses (Erb et al., 2009). HANPP is obtained by adding components (1) and (2), where the first one
is the result of the difference between the potential NPP of vegetation and the NPP of the actual
vegetation (modified by human processes). It is expressed in the same units as NPP: energy,
substance or material flow (Haberl et al., 2004).
This index can be directly linked to the socioeconomic issues of the world. That connection is given
to the fact that the HANPP influences the availability of the annual availability of trophic energy in
ecosystems. In its turn, this availability has a direct impact on energy flows that will influence
biodiversity, carbon and other elements flows and stocks, food webs, water flows, among others,
which are all crucial to nature’s ability to provide goods and services to humanity in long term (Erb
et al., 2009). Consequently, this index connects natural and socioeconomic processes by
measuring the human-induced exploration of the land system.
Benefits and limitations
According to Haberl et al. (2004), the main general restrictions to this index are: the argument
about ecosystems’ limits to productivity being very vague, what makes it impossible to know the
accurate ‘sustainability threshold’ above what the appropriation of NPP would be prejudicial
Figure 4.4 LPI values for the time period between 1970 and 2007 (source: WWF, 2010).

Sustainability assessment indicators and the degrowth concept
54
(excluding the maximum of 100% of usage, what would leave nothing to other species); the data
used, as the index is calculated to a defined territory and so it excludes the resources that the
people of that territory need from outside of it and also the uses from outside people of that same
territory in study; due to this focus on a defined area, it is also excluded the process of waste
absorption, except when it requires area or when it is considered as a land change activity that
alters the productivity of the territory.
Despite being related to socioeconomic aspects, in terms of degrowth assessment it only covers
the areas that relate to resources and ecological protection.
4.3.4. Ecological Footprint (EF)
The Ecological Footprint (EF) was created by Mathis Wackernagel and William Rees in the early
1990’s (Ewing et al., 2010) and it is now officially calculated by the Global Footprint Network, which
publish its results in annual reports.
This index measures the biologically productive area required to offer resources to a certain nation
and absorb the waste produced due to their activities, with the technology existent at the moment
of the analysis (Wackernagel et al., 1997). In other words, it evaluates how much ‘nature’ would we
need to fulfil all our needs and still have resources for future needs with the actual means we
possess today (not potential technological developments). As the area calculated is not a
continuous land, the calculation is simplified by assembling areas that have an average productivity
and are essential to provide the ecological services that we need (Wackernagel et al., 1997).
An interesting concept that this measure gives life to is the notion of ecological creditors and
debtors (figure 4.5). With the calculation of the index, it is possible to evaluate if a country is
depending on the biocapacity of not only their land but also of other regions (to extract resources
and to discharge of waste) – ecological debtor – or, on the contrary, if a country uses less than
their own biocapacity – ecological creditor (Ewing et al., 2010).
Figure 4.5 Global ecological creditor and debtor countries in 2007, based on the EF of
consumption of each country versus globally available biocapacity (source: Ewing et al., 2010).
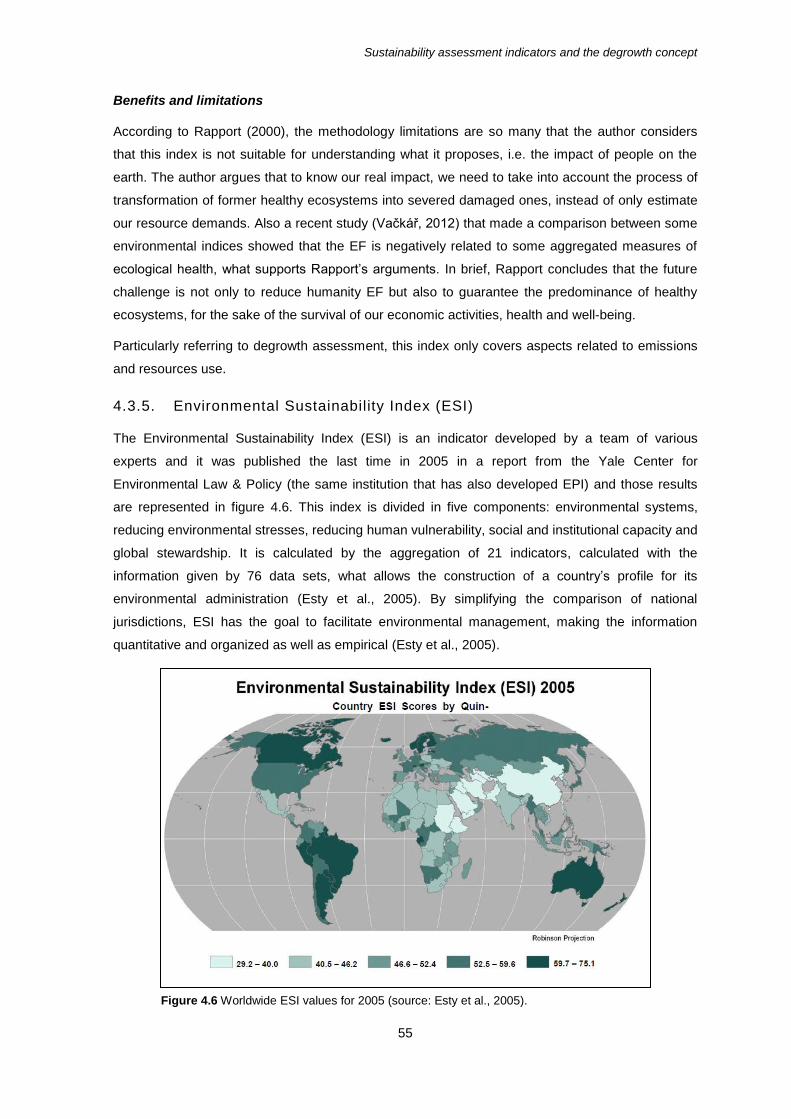
Sustainability assessment indicators and the degrowth concept
55
Benefits and limitations
According to Rapport (2000), the methodology limitations are so many that the author considers
that this index is not suitable for understanding what it proposes, i.e. the impact of people on the
earth. The author argues that to know our real impact, we need to take into account the process of
transformation of former healthy ecosystems into severed damaged ones, instead of only estimate
our resource demands. Also a recent study (Vačkář, 2012) that made a comparison between some
environmental indices showed that the EF is negatively related to some aggregated measures of
ecological health, what supports Rapport’s arguments. In brief, Rapport concludes that the future
challenge is not only to reduce humanity EF but also to guarantee the predominance of healthy
ecosystems, for the sake of the survival of our economic activities, health and well-being.
Particularly referring to degrowth assessment, this index only covers aspects related to emissions
and resources use.
4.3.5. Environmental Sustainability Index (ESI)
The Environmental Sustainability Index (ESI) is an indicator developed by a team of various
experts and it was published the last time in 2005 in a report from the Yale Center for
Environmental Law & Policy (the same institution that has also developed EPI) and those results
are represented in figure 4.6. This index is divided in five components: environmental systems,
reducing environmental stresses, reducing human vulnerability, social and institutional capacity and
global stewardship. It is calculated by the aggregation of 21 indicators, calculated with the
information given by 76 data sets, what allows the construction of a country’s profile for its
environmental administration (Esty et al., 2005). By simplifying the comparison of national
jurisdictions, ESI has the goal to facilitate environmental management, making the information
quantitative and organized as well as empirical (Esty et al., 2005).
Figure 4.6 Worldwide ESI values for 2005 (source: Esty et al., 2005).
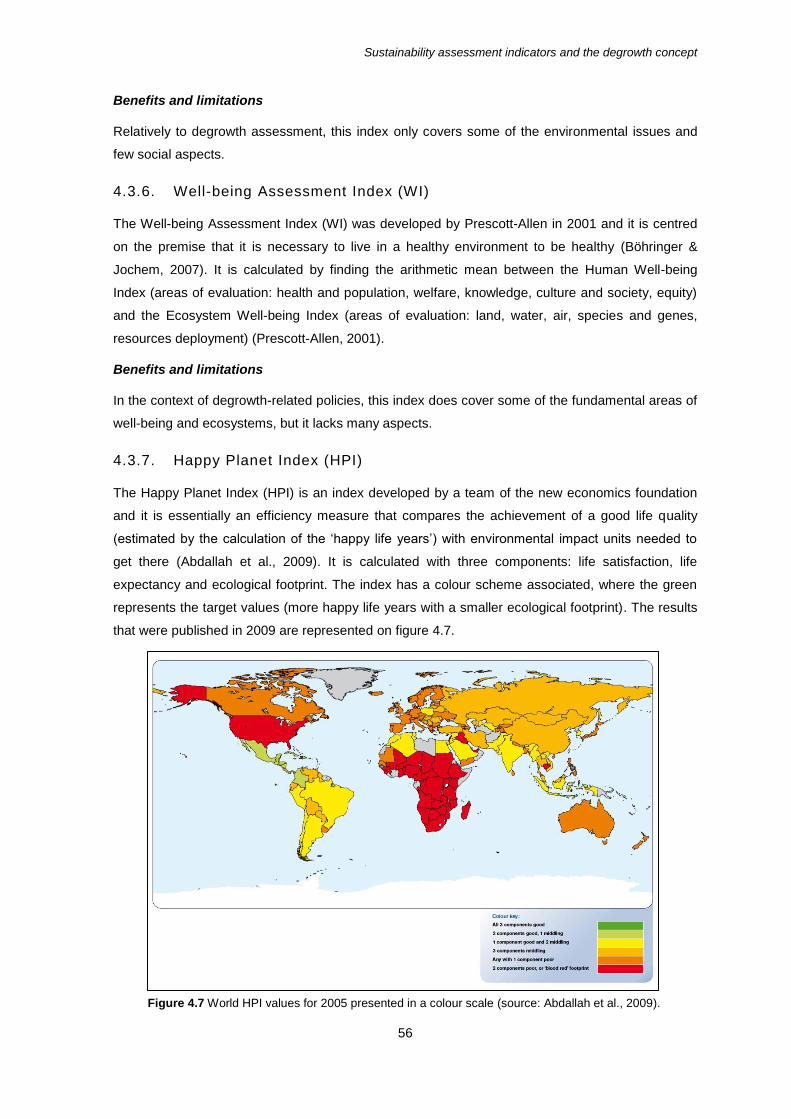
Sustainability assessment indicators and the degrowth concept
56
Benefits and limitations
Relatively to degrowth assessment, this index only covers some of the environmental issues and
few social aspects.
4.3.6. Well-being Assessment Index (WI)
The Well-being Assessment Index (WI) was developed by Prescott-Allen in 2001 and it is centred
on the premise that it is necessary to live in a healthy environment to be healthy (Böhringer &
Jochem, 2007). It is calculated by finding the arithmetic mean between the Human Well-being
Index (areas of evaluation: health and population, welfare, knowledge, culture and society, equity)
and the Ecosystem Well-being Index (areas of evaluation: land, water, air, species and genes,
resources deployment) (Prescott-Allen, 2001).
Benefits and limitations
In the context of degrowth-related policies, this index does cover some of the fundamental areas of
well-being and ecosystems, but it lacks many aspects.
4.3.7. Happy Planet Index (HPI)
The Happy Planet Index (HPI) is an index developed by a team of the new economics foundation
and it is essentially an efficiency measure that compares the achievement of a good life quality
(estimated by the calculation of the ‘happy life years’) with environmental impact units needed to
get there (Abdallah et al., 2009). It is calculated with three components: life satisfaction, life
expectancy and ecological footprint. The index has a colour scheme associated, where the green
represents the target values (more happy life years with a smaller ecological footprint). The results
that were published in 2009 are represented on figure 4.7.
Figure 4.7 World HPI values for 2005 presented in a colour scale (source: Abdallah et al., 2009).
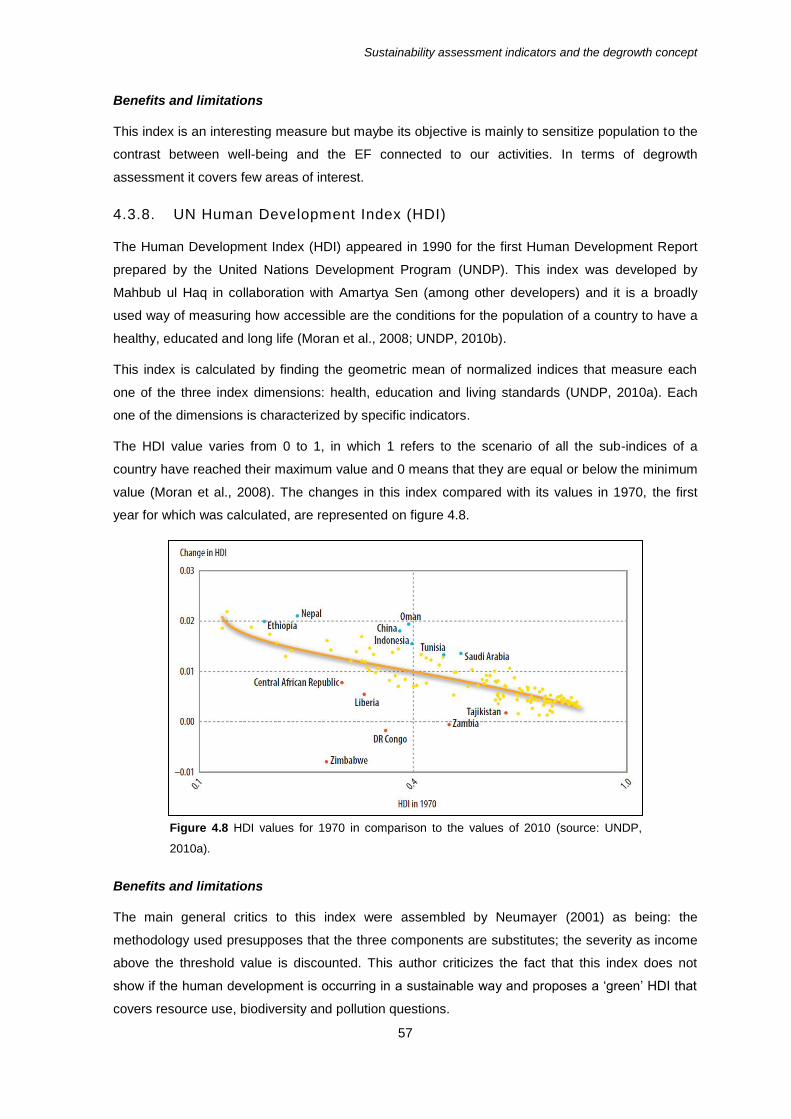
Sustainability assessment indicators and the degrowth concept
57
Benefits and limitations
This index is an interesting measure but maybe its objective is mainly to sensitize population to the
contrast between well-being and the EF connected to our activities. In terms of degrowth
assessment it covers few areas of interest.
4.3.8. UN Human Development Index (HDI)
The Human Development Index (HDI) appeared in 1990 for the first Human Development Report
prepared by the United Nations Development Program (UNDP). This index was developed by
Mahbub ul Haq in collaboration with Amartya Sen (among other developers) and it is a broadly
used way of measuring how accessible are the conditions for the population of a country to have a
healthy, educated and long life (Moran et al., 2008; UNDP, 2010b).
This index is calculated by finding the geometric mean of normalized indices that measure each
one of the three index dimensions: health, education and living standards (UNDP, 2010a). Each
one of the dimensions is characterized by specific indicators.
The HDI value varies from 0 to 1, in which 1 refers to the scenario of all the sub-indices of a
country have reached their maximum value and 0 means that they are equal or below the minimum
value (Moran et al., 2008). The changes in this index compared with its values in 1970, the first
year for which was calculated, are represented on figure 4.8.
Benefits and limitations
The main general critics to this index were assembled by Neumayer (2001) as being: the
methodology used presupposes that the three components are substitutes; the severity as income
above the threshold value is discounted. This author criticizes the fact that this index does not
show if the human development is occurring in a sustainable way and proposes a ‘green’ HDI that
covers resource use, biodiversity and pollution questions.
Figure 4.8 HDI values for 1970 in comparison to the values of 2010 (source: UNDP,
2010a).
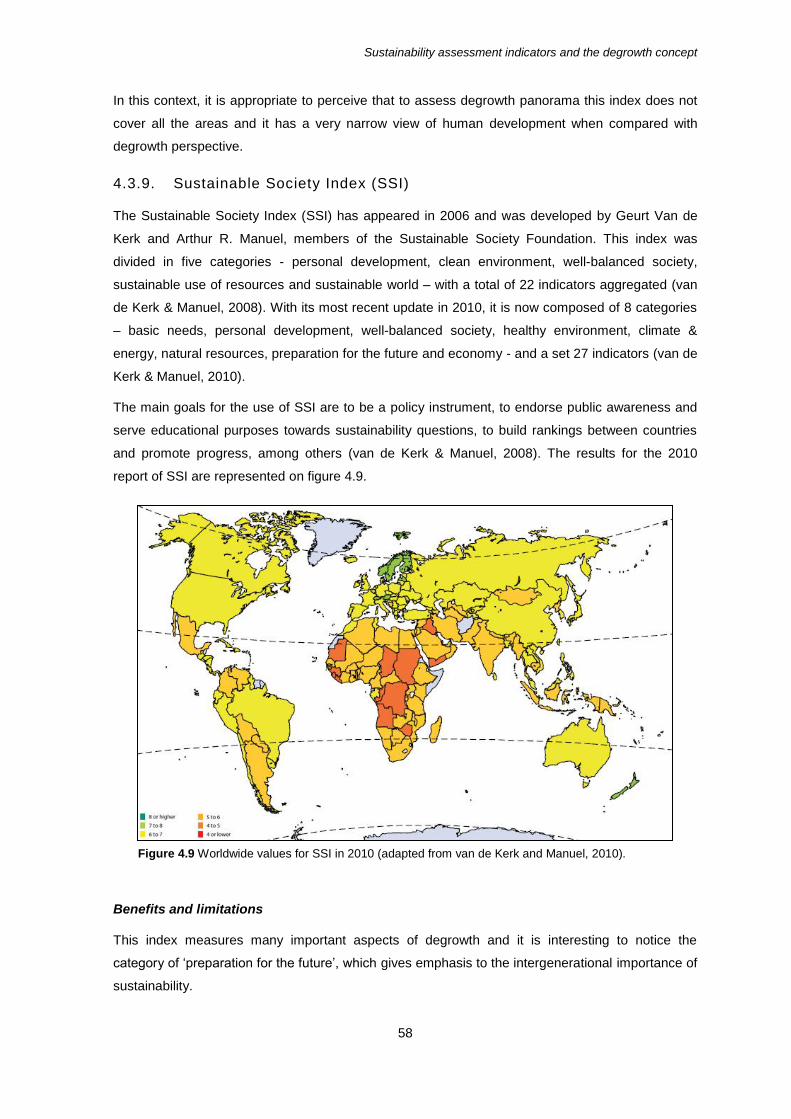
Sustainability assessment indicators and the degrowth concept
58
In this context, it is appropriate to perceive that to assess degrowth panorama this index does not
cover all the areas and it has a very narrow view of human development when compared with
degrowth perspective.
4.3.9. Sustainable Society Index (SSI)
The Sustainable Society Index (SSI) has appeared in 2006 and was developed by Geurt Van de
Kerk and Arthur R. Manuel, members of the Sustainable Society Foundation. This index was
divided in five categories - personal development, clean environment, well-balanced society,
sustainable use of resources and sustainable world – with a total of 22 indicators aggregated (van
de Kerk & Manuel, 2008). With its most recent update in 2010, it is now composed of 8 categories
– basic needs, personal development, well-balanced society, healthy environment, climate &
energy, natural resources, preparation for the future and economy - and a set 27 indicators (van de
Kerk & Manuel, 2010).
The main goals for the use of SSI are to be a policy instrument, to endorse public awareness and
serve educational purposes towards sustainability questions, to build rankings between countries
and promote progress, among others (van de Kerk & Manuel, 2008). The results for the 2010
report of SSI are represented on figure 4.9.
Benefits and limitations
This index measures many important aspects of degrowth and it is interesting to notice the
category of ‘preparation for the future’, which gives emphasis to the intergenerational importance of
sustainability.
Figure 4.9 Worldwide values for SSI in 2010 (adapted from van de Kerk and Manuel, 2010).

Sustainability assessment indicators and the degrowth concept
59
4.3.10. Environmental Vulnerability Index (EVI)
The Environmental Vulnerability Index (EVI) was developed by the South Pacific Applied
Geoscience Commission along with the UNEP and other partners. It is constituted by 50 indicators
of which 32 measure hazards, 8 measure resistance and 10 measure damage (SOPAC, 2005).
This index is calculated by giving the same weight to every indicator and aggregating the values by
an arithmetic mean. The EVI varies from the value 1 to 7, considering that the minimum
corresponds to high resilience/low vulnerability and the maximum value to low resilience/high
vulnerability.
Benefits and limitations
This index only covers environmental aspects and its focus is on the vulnerability that the countries
have towards mainly natural conditions and human pollution. In this context, there are indices that
might have more interest in terms of degrowth perspective.
4.3.11. Canadian Index of Well-being (CIW)
The Canadian Index of Well-being (CIW) was developed by a network with the same name, funded
in the Faculty of Applied Health Sciences at the University of Waterloo. This index is presented a
well-being measure since in its calculation the good and bad things of our lives are distinguished, it
considers volunteer and other forms of unpaid work and gives a value to non-market benefits as
social equity and environmental conditions (CIW Network, 2009).
In its most recent report (Michalos et al., 2011), this index is divided in eight categories (with eight
indicators each), being them: living standards, democratic engagement, healthy populations,
community vitality, time use, leisure and culture, education and environment. The index value for
each year (from 1994 to 2008) is found by calculating the arithmetic mean of all the domain
individual average values for each year. In its turn, the domain individual values (for each year) are
calculated by doing an arithmetic mean of all the values of their specific indicators. The results are
represented in figure 4.10.
Benefits and limitations
This index is able to measure many degrowth aspects, not only in the environmental sphere but
also on the social one. It has the particularity of giving importance to non-valuable aspects such as
volunteer work and leisure time. Nevertheless, it does not cover entirely all the policy goals
discussed.

Sustainability assessment indicators and the degrowth concept
60
4.4. Existing sets of indicators for assessing sustainable development
4.4.1. Core set of Indicators – European Environmental Agency (CSI-EEA)
The core set of indicators (CSI) list was assembled in 2004 by the European Environment Agency
(EEA) with the purpose to organize data flows and to create a foundation for indicator-based
environmental assessments, in favour of improving information certainty and comparability as well
as for policy-related purposes (EEA, 2005).
This set is composed by 27 indicators within six environmental themes - air pollution and ozone
depletion, climate change, waste, water, biodiversity and terrestrial environment -, all related to
European Union (EU) policy priorities (EEA, 2005). Apart from the themes, the indicators are also
categorized as descriptive or performance indicators.
Benefits and limitations
In general terms, the limitations of this core set are not accounting for issues such as eco-
efficiency, policy effectiveness and welfare, although the EEA proposes these categories as
challenges for a future improved set of indicators (EEA, 2005). This has implications for degrowth
assessment in particular since without those dimensions the indicators essentially only refer to
environmental aspects.
Figure 4.10 Comparison between GDP and CIW trends (and of its components) from 1994 to 2008
(source: Michalos et al., 2011).

Sustainability assessment indicators and the degrowth concept
61
4.4.2. European Union set of Sustainable Development Indicators (EU-SDIs)
In the context of the European Union Sustainable Development Strategy (EU SDS), seven key
challenges were defined for the EU countries in the most recent report on this issue: climate
change and clean energy, sustainable transport, sustainable consumption and production,
conservation and management of natural resources, public health, social inclusion, demography
and migration, global poverty and sustainable development challenges (EC, 2011).
These challenges are clarified with objectives, targets and lists of actions to put in practice. To
measure the progress of these measures it was developed a set of indicators, the European Union
set of Sustainable Development Indicators (EU-SDIs). There are a total of 140 indicators
distributed in 10 categories: socioeconomic development, sustainable consumption and production,
social inclusion, demographic changes, public health, climate change and energy, sustainable
transport, natural resources, global partnership and good governance. There are also indicators
that are presented as future developments.
They are divided in three levels (represented in figure 4.11): headline (or level 1) indicators, which
are related to the overall objectives of the EU SDS; the level 2 indicators, which are connected to
the operational objectives; the level 3 indicators, which analyse actions of the strategy or
progresses towards the objectives; and finally, the contextual indicators, which are not related to
any objective of the strategy or policy but they are useful to provide background information
relevant for the key indicators (EC, 2011).
Benefits and limitations
This set of indicators is connected to the specific policy goals of the EU and that alone presents a
limitation to degrowth assessment. This occurs because many of the policies presented in the
degrowth-related literature are concepts that do not fit on the EU guidelines yet. Nevertheless, the
Figure 4.11 The three-level pyramid structure of EU-SIDs (source: EC, 2011).
Sustainability assessment indicators and the degrowth concept
62
EU-SIDs is a very complete set of indicators that covers all the main group goals of the degrowth-
related policies specified in this work.
4.4.3. Japan for Sustainability Indicators (JSI)
The Japan for Sustainability Indicators (JSI) is a set of indicators put together by a non-profit
organization called Japan for Sustainability (JFS). This organization established the maximum
score as 100, which corresponds to the year 2050 (when they project to achieve their sustainability
goals) and the evaluation has already been done from 1990 to 2005. With this evaluation, they can
analyse how far Japan is from its sustainability objectives and also which is the progress of each
issue considered.
This set has 20 indicators distributed in 4 categories – nature (environment), economy, society and
individual well-being. JFS does not have any report published about this work but all the
information and also the results of the analysis done are published online10
.
Benefits and limitations
In terms of limitations for degrowth assessment, despite this list of indicators is able to measure
many aspects in terms of the policies discussed and in all their goals, it is very small to comprise all
the key aspects.
4.4.4. Millennium Development Goals Indicators (MDGI)
The Millennium Development Goals were agreed in the United Nations Millennium Declaration by
147 heads of State and 189 States in 2000. The eight goals were defined having in account the
issues that were considered as a priority for the nations worldwide: freedom, equality, solidarity,
tolerance, respect for nature and shared responsibility. In this context, the defined goals are (1)
eradicate extreme poverty and hunger, (2) achieve universal primary education, (3) promote
gender equality and empower women, (4) reduce child mortality, (5) improve maternal health, (6)
combat HIV/AIDS, malaria and other diseases, (7) ensure environmental sustainability and (8)
develop a global partnership for development (UN, 2003).
The Millennium Development Goals Indicators (MDGI) are a way of measuring whether the
development goals are being achieved or not and the overall progress towards the goals. On the
most recent report there are a total of 21 targets and 60 indicators that in their majority have 2015
as a deadline and 1990 as a baseline of comparison (UN, 2011).
Benefits and limitations
This set of indicators is very focused on what were considered the priority problems of the world
and it has been kept simple in terms of indicators. Due to that, some of the indicators are able to
measure the progress of some key policies discussed. However, on the overall, they do not cover
all the areas.
10 On JFS website: http://www.japanfs.org.

Sustainability assessment indicators and the degrowth concept
63
4.4.5. System of indicators of sustainable development for Portugal (SIDS-
Portugal)
The System of Indicators of Sustainable Development (SIDS) was developed by the Portuguese
Environmental Agency (APA) and published by the first time in 2000. This system consists on a set
of 118 indicators divided in four groups: ground indicators, key indicators (30), indicators that can
be regionalized (30) and indicators that can be applied to sectors (APA, 2007).
This is a compilation of indicators that was done bearing in mind the Portuguese reality and the
importance of answering to the information demanded by organizations like the EEA, the UN, the
statistical office of the European Union (Eurostat) or the Organisation for Economic Co-operation
and Development (OCDE). The set of indicators is not organized in themes but it embraces the
three great dimensions of sustainability by having indicators of the following themes: education,
social cohesion/exclusion, employment, health, culture, governance, environmental management
instruments, international cooperation, forests, nature and biodiversity, science and technology,
economics, tourism, justice, air and climate, water, energy, marine and coastal environment,
agriculture, industry, transports, population, soils and territory planning, residues and noise (APA,
2007).
Benefits and limitations
This set of indicators comprises all the overall goals of degrowth-related policy but not entirely.
However, as well as the EU-SDIs, there are indicators to measures many key aspects but the list
fails on aspects that are not explicit on the current policy goals for the country, for obvious reasons.
4.5. Recent proposes of new metrics
A recent article from Daniel W. O’Neill (2011) shows this author’s works on how to measure if
degrowth is happening and what is the distance between current national economies to Daly’s SSE
concept. O’Neill proposes a framework that contains a set of biophysical and social indicators
directly related to the degrowth objectives and to the SSE definition. This framework (figure 4.12) is
based on Daly’s “Ends-Means Continuum” and D. H. Meadows work on sustainable development
indicators, which are also based on Daly’s work.
The author’s work was focused on the path to follow, yet he shows the potential set of indicators
that could be used for this purpose, which is represented on figure 4.13. The main points to retain
from his work are that: the suggested indicators have the purpose to measure sustainability
(biophysical indicators) and sufficiency (social indicators); there are no “economic-alone” indicators
since this framework sees economic aspects as the transformation factor of ultimate means (nature
resources) to ultimate ends (human well-being); GDP is not in the picture since it is recognised as
a deficient indicator of social welfare and, in spite of some authors argue that it can be
reinterpreted, the author does not work with GDP but instead he replaces it with what he calls
“more relevant information” (O’Neill, 2011, p.8).
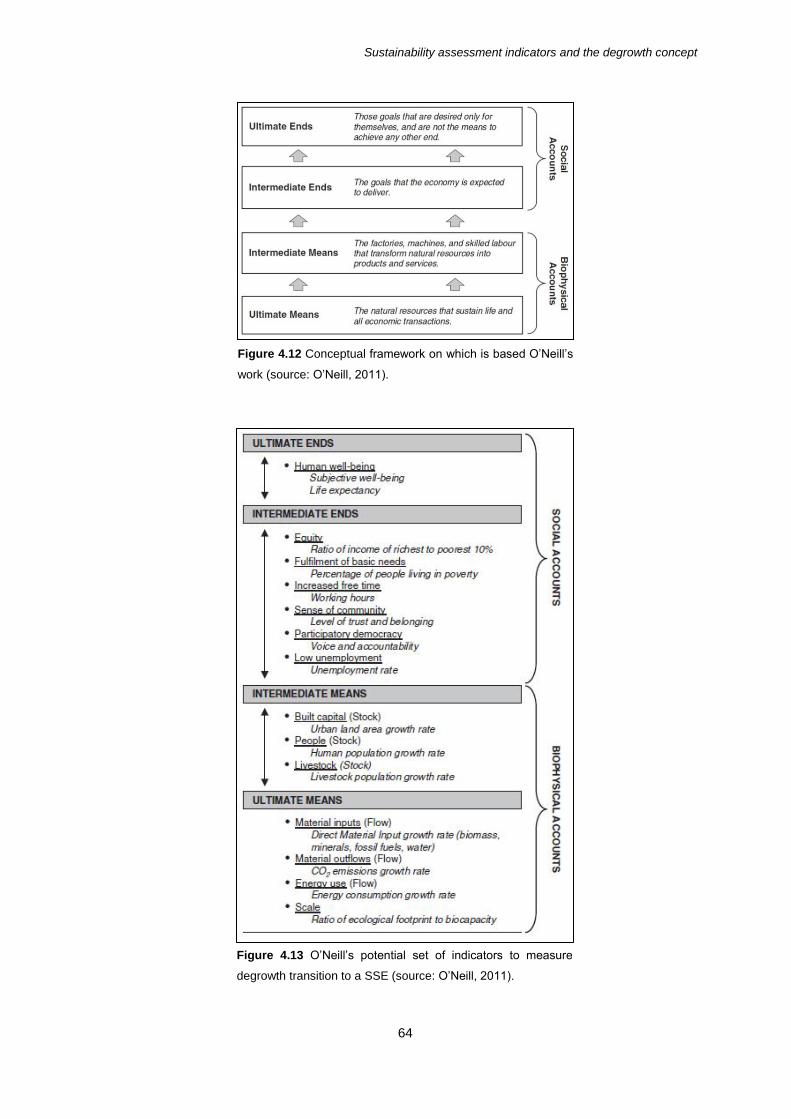
Sustainability assessment indicators and the degrowth concept
64
Figure 4.13 O’Neill’s potential set of indicators to measure
degrowth transition to a SSE (source: O’Neill, 2011).
Figure 4.12 Conceptual framework on which is based O’Neill’s
work (source: O’Neill, 2011).

What to measure about sustainable degrowth?
65
Chapter 5. What to measure about sustainable degrowth?
5.1. What the existing indicators do and do not measure
After the analysis of degrowth-related goals and also the analysis of a representative group of
sustainability assessment metrics, the next step was to compare the results and to find out if the
existing metrics are useful to capture this ‘new’ sustainability approach.
In the next sub-chapters that comparison between the specific policy goals and the indicators has
been done, divided in economic indicators, biophysical/social indicators and sets of indicators (the
full list of the components for each metric is presented on Annex II). The comparison was done by
defining in what way the components of the aggregated metrics or the sets of indicators are able to
measure the policy goals considered in Chapter 3. The classification method was divided in five
categories:
DP Measures directly but in a partial way
DT Measures directly and in a total way
IP Measures indirectly and in a partial way
IT Measures indirectly but in a total way
N Does not measure
? Dubious aspect
The direct/indirect classification relates to whether there are components that measure directly the
goal to be analysed or measure some aspect that is related to the goal or that indirectly allows
assessing it in some way. It is important to stress that a direct measurement was considered to be
something that captured the particular issue that was being analysed. On the other hand, an
indirect measure was considered to be an indicator that did not capture the exact issue but gave
some results that were dependent on that issue. For instance, if the specific goal to be analysed is
‘waste emissions’ a direct indicator would be the ‘domestic waste generated per capita’, whereas
an indirect indicator would be ‘land quality’. Due to the substantial amount of indicators classified,
some are more direct or indirect than others, even in the cases they have the same classification.
The partial or total classification relates to the more specific aspects of the goal, based on the
policy instruments/measures discussed in previously. In this work, an indicator is considered to
measure an aspect partially if it does not capture all the components that represent it. As there are
aspects that are constituted by more components than others, some of the measures which are
classified as partial are, in fact, more partial than others. This occurs since a measure is
considered to be partial if it captures one aspect of five possible but also if it captures four aspects
those possible five. An example of a partial measure for material use is “coal consumption per
populated land area”, while a total measure would be “material consumption”.
What to measure about sustainable degrowth?
66
Due to the variety of components that each aggregate indicator or set of indicators has, in some
cases it was necessary to do a double classification (e.g. DP/IP). This occurred in cases where the
components that were related to a certain policy goal were able to measure in different ways the
same goal.
The sixth aspect that appears in the classification (?) was used as a complement for the other five
categories when the components were considered less clear in terms of what they really try to
measure. In Annex III, the classification done is summarily justified for each indicator/set of
indicators versus the policy goals.
5.2. Analysis of the economic aggregated metrics
In spite of being the most accepted measures, as they are presented in the easiest unit to
understand by most people, monetary-based indicators have many technical and ethical problems
when it comes to measure social and environmental issues. Even monetary measurement to the
market goods dimension is not a totally objective action, since the monetary values are dependent
on the initial distribution of the wealth, concept that for itself poses its own ethical problems on its
assumptions (Daly & Farley, 2011). We can attribute a certain value to a resource, but that is
presupposing that natural and man-made capitals are perfect substitutes, what it is a major
problematic and ethical issue. Also resource prices have variations such as market goods prices,
and they are going to be a reflection of its rates of use by society (Daly & Farley, 2011), so they are
not objective either. Moreover, in the overall, the social welfare question is not something that can
be monetized.
In table 5.1 we can see the results of the analysis done to the economic aggregated measures.
Starting with GDP, in a general view is notorious that as expected it is not able to capture most of
the policy goals considered. When we look at the aggregate value that GDP is, the number only
can show us directly the expenditure or income patterns of a country in a certain year. Therefore, in
what that expenditure is done and by whom is not shown, as well as the distribution of income. This
means that GDP does not capture any aspects that are related to inequalities in terms of wealth
distribution. It does not capture either any aspect that is connected to quality issues, even if they
involve investments. For instance, GDP accounts for private consumption of goods but it is not
possible to know if those are essential or non-essential goods, it does not have that level of detail.
Another example is the investment in better selected technologies, that in spite of being accounted
in GDP in the general investment in technologies, it is impossible to capture that ‘better selection’
crucial aspect. In terms of other investments such as in health or culture, GDP accounts for them
directly, although in a partial way. This occurs since, for instance, it does not account for social
subsidies. The investments are in terms of fixed capital, what in terms of health is the construction
of hospitals or the acquisition of medical equipment. As already discussed, it does not capture any
of the negative environmental externalities that are related to economic activity.
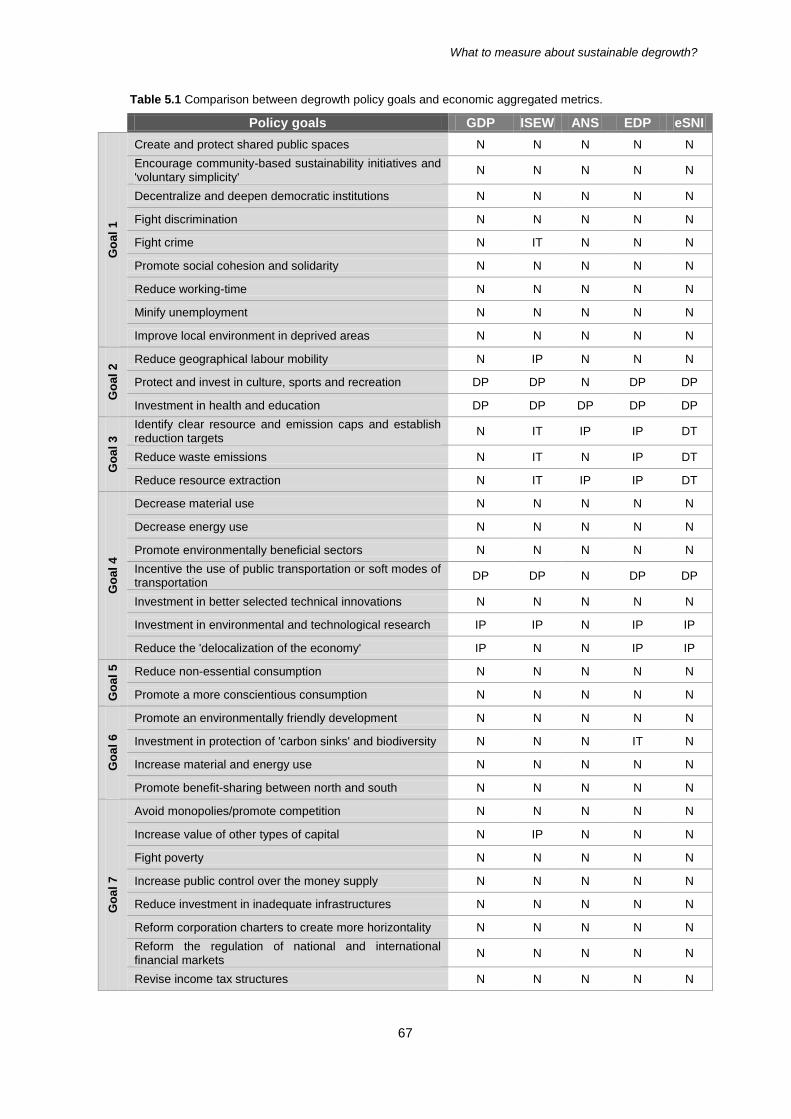
What to measure about sustainable degrowth?
67
Table 5.1 Comparison between degrowth policy goals and economic aggregated metrics.
Policy goals GDP ISEW ANS EDP eSNI G
oa
l 1
Create and protect shared public spaces N N N N N
Encourage community-based sustainability initiatives and 'voluntary simplicity'
N N N N N
Decentralize and deepen democratic institutions N N N N N
Fight discrimination N N N N N
Fight crime N IT N N N
Promote social cohesion and solidarity N N N N N
Reduce working-time N N N N N
Minify unemployment N N N N N
Improve local environment in deprived areas N N N N N
Go
al
2 Reduce geographical labour mobility N IP N N N
Protect and invest in culture, sports and recreation DP DP N DP DP
Investment in health and education DP DP DP DP DP
Go
al
3
Identify clear resource and emission caps and establish reduction targets
N IT IP IP DT
Reduce waste emissions N IT N IP DT
Reduce resource extraction N IT IP IP DT
Go
al
4
Decrease material use N N N N N
Decrease energy use N N N N N
Promote environmentally beneficial sectors N N N N N
Incentive the use of public transportation or soft modes of transportation
DP DP N DP DP
Investment in better selected technical innovations N N N N N
Investment in environmental and technological research IP IP N IP IP
Reduce the 'delocalization of the economy' IP N N IP IP
Go
al
5
Reduce non-essential consumption N N N N N
Promote a more conscientious consumption N N N N N
Go
al
6
Promote an environmentally friendly development N N N N N
Investment in protection of 'carbon sinks' and biodiversity N N N IT N
Increase material and energy use N N N N N
Promote benefit-sharing between north and south N N N N N
Go
al
7
Avoid monopolies/promote competition N N N N N
Increase value of other types of capital N IP N N N
Fight poverty N N N N N
Increase public control over the money supply N N N N N
Reduce investment in inadequate infrastructures N N N N N
Reform corporation charters to create more horizontality N N N N N
Reform the regulation of national and international financial markets
N N N N N
Revise income tax structures N N N N N
What to measure about sustainable degrowth?
68
Regarding to ISEW and EDP, they are similar when it comes to the aspects they capture in terms
of degrowth policy goals. In spite of EDP is based on GDP and ISEW is not, the aspects that both
can measure directly are the ones which are also measured directly with GDP (investment in fixed
capital and consumption). In terms of environmental externalities, both treat everything as costs
and thus they end up measuring consequences instead of solutions for environmental problems.
However, in spite of capturing them in an indirect way, they are able to catch important aspects,
such as pollutant and waste emissions, as well as resource extraction. In this particular issue,
ISEW is more wide-ranging than EDP, which captures environmental aspects in a more partial
way.
The ANS does not capture much of the aspects considered, as it is an indicator that intends to
show real savings. This means that it considers the depletion of natural capital as a cost that
cannot be ignored in the calculation of national savings. In spite of not being a good indicator when
it comes to these particular aspects, it may be important to show the balance between the
depreciated capital and the investment in all forms of capital to assess in which degree the human
activity is respecting the ecological limits to growth.
Lastly, the eSNI is an indicator based on GDP so it captures the same aspects. Nonetheless, its
real advantage is the fact that captures directly all the environmental aspects considered in goal 3
(resource and emission caps). This means that this indicator is much more complete than GDP as
it accounts for the size of the economy but also accounts for its negative side-effects.
In a general view, it can be pointed out that goal 7 (fiscal and economic system reforms) is almost
not addressed by these indicators, what makes sense since they are based on the economic model
that we have currently. The goal 2 (enhancing social capital) is the one which is addressed in a
more direct way by the generality of indicators, since it includes the investments in crucial areas
such as health, education and culture.
5.3. Analysis of the biophysical and social aggregated metrics
The biophysical and social aggregated metrics are usually used to create rankings between the
performances of many countries. The results of the analysis done to this type of indicators are
represented in tables 5.2 to 5.5. By observing the first group of indicators (tables 5.2 and 5.3), it is
possible to conclude that they are specifically connected to environmental aspects, although they
capture different things when it comes to the analysed policy goals.
The EPI is a very complete indicator for analysing pollutant emissions as it includes all the
important substances. It may also be good for analysing the investment in carbon sinks and
biodiversity protection, since it includes the study of biome and critical habitats protection, among
other variables. In the context of this policy goal, the LPI might also be a useful indicator to
understand the health of the ecosystems, as it is a very specific indicator for changes in vertebrate
species.

What to measure about sustainable degrowth?
69
The HANPP might capture in a very complete way the problematic of resource extraction.
However, the connection between the results of this index and their transposition to the specific
resources to be analysed is very indirect. It had to be more explored to know for sure if it is a useful
index in degrowth context or not. The index might also be suitable to evaluate ecosystems health
as it accounts for changes in land use, a major threat for habitat degradation and biodiversity loss.
The EF is also an index focused on land-use but it does not include all types of use, so it might not
be as complete in this topic. However, it also evaluates the carbon footprint of human activity and
so it is an index that in a more global way is important to show which countries have crossed the
line of the ecological limits.
The EVI is a very complete indicator in terms of environmental aspects. It captures very specific
topics such as eliminating waste trading or the management of terrestrial and aquatic ecosystems
and their resource use. It is the only indicator that accounts for international agreements for sharing
resources, an important specific policy instrument in terms of balancing resource use between the
countries. The index is also very complete in terms of protection of the carbon sinks and
biodiversity, as it accounts for numerous aspects of ecological preservation and monitoring.
Table 5.2 Comparison between degrowth policy goals and biophysical and social aggregated metrics (EPI,
LPI, HANPP, EF and EVI).
Policy goals EPI LPI HANPP EF EVI
Go
al
1
Create and protect shared public spaces N N N N N
Encourage community-based sustainability initiatives and 'voluntary simplicity'
N N N N N
Decentralize and deepen democratic institutions N N N N N
Fight discrimination N N N N N
Fight crime N N N N N
Promote social cohesion and solidarity N N N N N
Reduce working-time N N N N N
Minify unemployment N N N N N
Improve local environment in deprived areas N N N N N
Go
al
2 Reduce geographical labour mobility N N N N N
Protect and invest in culture, sports and recreation N N N N N
Investment in health and education IP N N N N
Go
al
3
Identify clear resource and emission caps and establish reduction targets
DT N N DP DP
Reduce waste emissions IP N N N DT
Reduce resource extraction DP N IT (?) N DT

What to measure about sustainable degrowth?
70
Table 5.3 Comparison between degrowth policy goals and biophysical and social aggregated metrics (EPI,
LPI, HANPP, EF and EVI - continuation). Policy goals EPI LPI HANPP EF EVI
Go
al
4
Decrease material use N N N N N
Decrease energy use N N N N N
Promote environmentally beneficial sectors N N N N N
Incentive the use of public transportation or soft modes of transportation
N N N N N
Investment in better selected technical innovations N N N N N
Investment in environmental and technological research
N N N N N
Reduce the 'delocalization of the economy' N N N N N
Go
al
5
Reduce non-essential consumption N N N N N
Promote a more conscientious consumption N N N N N
Go
al
6
Promote an environmentally friendly development N N N N N
Investment in protection of 'carbon sinks' and biodiversity
DT IP IT IP DT
Increase material and energy use N N N N N
Promote benefit-sharing between north and south N N N N N
Go
al
7
Avoid monopolies/promote competition N N N N N
Increase value of other types of capital N N N N N
Fight poverty N N N N N
Increase public control over the money supply N N N N N
Reduce investment in inadequate infrastructures N N N IP N
Reform corporation charters to create more horizontality
N N N N N
Reform the regulation of national and international financial markets
N N N N N
Revise income tax structures N N N N N
The second group of indicators presented in tables 5.4 and 5.5 is more wide-ranging, since the
indicators do not include only environmental aspects but also social ones. Starting with ESI, this
index is good for capturing social aspects of community resilience and public participation. It also
captures important environmental aspects such as atmospheric emissions and waste, as well as
water availability.
The HPI is a measure that includes the EF so it accounts for the same aspects with the addition of
measuring subjective well-being. In this context, this metric might be useful for giving an idea of
how is evolving the well-being of a nation in a general basis, that is the ultimate goal of all these
policies together. However, it is important to have in mind that this is a very subjective
measurement.
The HDI includes GDP so it accounts for the same things but it gives more emphasis on the
investment in education and health. It does not include any environmental aspect. The SSI also
includes GDP but it enters in detail with the distribution of wealth. It also includes employment

What to measure about sustainable degrowth?
71
concerns and the investment on health and education. As for the environmental aspects, the index
accounts for the material and energy use as well as for GHG emissions. In terms of resources, it is
more focused on their final quality (e.g. water quality) and so, on the final consequences of
economic activity.
The WI captures social aspects connected to discrimination, crime and unemployment. It includes
GDP so it also includes aspects that this index accounts for. As for the environmental aspects, the
components of this index are more focused on quality variables, as the SSI. As EF, it also accounts
for built-land, although that does not show directly if the infrastructures built are inadequate or not.
Another index of welfare is the CIW. This is a Canadian measure that does not include GDP in its
accounts, on the contrary of the WI. It is a very recent index, so it reflects modern concerns such
as the importance on the investment on culture and recreation. It is very comprehensive in that
area as well as in the area of the investment in health and education. It gives much importance to
community resilience and it is the only indicator in this analysis that has relevance in terms of
assessing the goal of reducing working-time. It also accounts for poverty issues and income
inequalities. In terms of environmental aspects it is not very complete, but accounts for some
concerns such as the GHG emissions.
Table 5.4 Comparison between degrowth policy goals and biophysical and social aggregated metrics (ESI,
HPI, HDI, SSI, WI and CIW).
Policy goals ESI HPI HDI SSI WI CIW
Go
al
1
Create and protect shared public spaces N N N IP N N
Encourage community-based sustainability initiatives and 'voluntary simplicity'
DP N N IP N IP
Decentralize and deepen democratic institutions
DT N N DT N N
Fight discrimination N N N DP DP IP
Fight crime N N N N DT DT
Promote social cohesion and solidarity DT N N N N N
Reduce working-time N N N N N DT
Minify unemployment N N N DT DT DT
Improve local environment in deprived areas N N N N N N
Go
al
2 Reduce geographical labour mobility N N N N N N
Protect and invest in culture, sports and recreation
N N DP DP DP DT
Investment in health and education IP IP DP/IP DT/IP DP DT
Go
al
3
Identify clear resource and emission caps and establish reduction targets
DT DP N DP IP DP
Reduce waste emissions DT/IP N N IP IP N
Reduce resource extraction DP N N IP DP DP

What to measure about sustainable degrowth?
72
Table 5.5 Comparison between degrowth policy goals and biophysical and social aggregated metrics (ESI,
HPI, HDI, SSI, WI and CIW - continuation).
Comparing in a global viewpoint, again goal 7 (fiscal and economic system reforms) is the one that
is less complete in terms of indicators. Despite that fact, this group of indicators includes more
aspects related to this goal than the economic ones. Aspects such as poverty and income
inequality are a concern in some of these metrics, as well as the problematic of land occupation. As
for the goal more explored, it is not obvious since each one of these metrics captures many
different aspects. It might be expected that goal 3 (resource and emission caps) would be very well
explored, what does not happen as it can be observed in the previous tables. These indicators
include many important environmental aspects but not always they are exactly presented as the
analysed policy goals show them.
Policy goals ESI HPI HDI SSI WI CIW
Go
al
4
Decrease material use DP N N DT DP N
Decrease energy use N N N DT DT IT
Promote environmentally beneficial sectors N N N N N N
Incentive the use of public transportation or soft modes of transportation
N N DP DP DP N
Investment in better selected technical innovations
N N N N N N
Investment in environmental and technological research
N N IP IP IP N
Reduce the 'delocalization of the economy' N N IP IP IP N
Go
al
5
Reduce non-essential consumption N N N N N N
Promote a more conscientious consumption N N N N N N
Go
al
6
Promote an environmentally friendly development
N N N N N N
Investment in protection of 'carbon sinks' and biodiversity
DP/IP IP N IP DP/IP DP/IP
Increase material and energy use DP N N DT DP IP
Promote benefit-sharing between north and south
N N N N N N
Go
al
7
Avoid monopolies/promote competition N N N N N N
Increase value of other types of capital N N N N N IP
Fight poverty N N N N N DT
Increase public control over the money supply N N N N N N
Reduce investment in inadequate infrastructures
N IP N N N N
Reform corporation charters to create more horizontality
N N N DT N DT
Reform the regulation of national and international financial markets
N N N N N N
Revise income tax structures N N N N N N
What to measure about sustainable degrowth?
73
5.4. Analysis of the sets of indicators
Degrowth-related policy goals are very comprehensive in terms of social, environmental and
economic matters. Due to that fact, the sets of indicators are the most complete metrics as they are
able to reach many aspects of the analysed policy goals. In table 5.6 the results of the analysis are
presented.
The EU-SDIs and SIDS are very similar, since the second one is based on the first one. They are
the most complete sets of indicators analysed in this dissertation, including a variety of important
matters. In terms of social aspects, they cover income inequality, unemployment and poverty
concerns. As for the environmental area, they are also very complete in terms of indicators. They
cover material and energy use by the society as well as they cover very well the assessment of the
investment in carbon sinks and biodiversity. Both of these groups of indicators account for the
imports from developing countries, an aspect that can be useful in assessing the delocalization of
the economic processes. The EU-SDIs is the only system analysed in this work which has
consumption disaggregated in purposes, which can be very suitable to analyse the patterns of non-
essential consumption. SIDS does not account for that, but it is more complete in terms of
community resilience and public participation.
The MDGI is a set of indicators which is more complete in terms of social aspects. It covers in a
very satisfactory way the area of investment in education and health. It also covers employment
and poverty issues. As the previous sets of indicators, it also has in consideration the imports from
developing countries. As for the environmental concerns, it has some indicators that are important
in assessing GHG emissions and water resources.
The CSI-EEA is a group of environmental indicators. Thus, it is very complete in terms of
environmental concerns such as energy use and the investment in the protection of natural
resources. It includes an indicator of land take, which can be useful to evaluate the problematic of
the excess of infrastructures.
The JSI is not a very extensive set of indicators, although it covers a little of every goal. In terms of
social aspects, it gives emphasis to volunteering and social participation. In terms of environmental
aspects, it covers some important ones such as GHG emissions and domestic and agricultural
waste emissions.
Globally speaking, these sets of indicators reach every goal in a more or less complete way.
Taking goal 7 (fiscal and economic system reforms) as a comparison point, the sets of indicators
cover much more aspects than the aggregated indicators. The environmental aspects are very well
covered, excluding the resource use matter, since it is the most incomplete one. For the first time, it
appears in this work a measurement of disaggregated consumption, which could be very useful to
assess one of the most important policy goals of degrowth, which is reducing the overconsumption
of non-essential items.

What to measure about sustainable degrowth?
74
Table 5.6 Comparison between degrowth policy goals and the sets of indicators. Policy goals EU-SDIs CSI-EEA MDGI SIDS JSI
Go
al
1
Create and protect shared public spaces N N N N N
Encourage community-based sustainability initiatives and 'voluntary simplicity'
IP IP N DP N
Decentralize and deepen democratic institutions DP N N DT IP
Fight discrimination IP N IP IP IP
Fight crime N N N DT DT
Promote social cohesion and solidarity N N N DT N
Reduce working-time N N N N N
Minify unemployment DT N DT DT N
Improve local environment in deprived areas N N N N N
Go
al
2 Reduce geographical labour mobility N N N N DP
Protect and invest in culture, sports and recreation DP N N DP N
Investment in health and education DP N DT DT DP
Go
al
3
Identify clear resource and emission caps and establish reduction targets
DT DT DP DT DP
Reduce waste emissions DT DT N DT DP
Reduce resource extraction DP DP DP DP N
Go
al
4
Decrease material use DT N N DT N
Decrease energy use DT DT N DT N
Promote environmentally beneficial sectors N N N N N
Incentive the use of public transportation or soft modes of transportation
DP DP N IP IP
Investment in better selected technical innovations IT (?) IT (?) N IP IT (?)
Investment in environmental and technological research IP N N IP N
Reduce the 'delocalization of the economy' DP N DP DP N
Go
al
5
Reduce non-essential consumption DT N N N N
Promote a more conscientious consumption DP N N DP DT
Go
al
6
Promote an environmentally friendly development N N N N N
Investment in protection of 'carbon sinks' and biodiversity DT DT DP DT N
Increase material and energy use DT DP N DT N
Promote benefit-sharing between north and south N N N N N
Go
al
7
Avoid monopolies/promote competition N N N N N
Increase value of other types of capital N N N N DP
Fight poverty DT N DT DT DT
Increase public control over the money supply N N N N N
Reduce investment in inadequate infrastructures N IP N N N
Reform corporation charters to create more horizontality DT N N DT N
Reform the regulation of national and international financial markets
N N N N N
Revise income tax structures N N N N N

What to measure about sustainable degrowth?
75
5.5. Analysis of O’Neil’s set of indicators
The set of indicators suggested by O’Neill (2011) is a recent attempt of measuring a society’s
degrowth path. The framework presented is very useful to organize the aspects to analyse, as well
as their relative priority. It is a step towards building a method of measuring what is important in a
society that it is pointing to degrowth as a solution and then to the transition to a steady-state
economy.
The comparison between the policy goals analysed in this work and the set of indicators proposed
by O’Neill is presented in tables 5.7 and 5.8. As it can be seen, the components suggested by
O’Neill still only cover some areas. In spite of covering some matters which have importance and
that usually are not covered, such as the reduced working time and the material use, it does not
cover the non-essential consumption aspect and it also does not address to resource extraction, at
least in a direct way.
Table 5.7 Comparison between degrowth policy goals and the system of indicators proposed by
O’Neill (2011).
Policy goals O’Neill’s system
of indicators
Go
al
1
Create and protect shared public spaces N
Encourage community-based sustainability initiatives and 'voluntary simplicity'
N
Decentralize and deepen democratic institutions DP
Fight discrimination N
Fight crime N
Promote social cohesion and solidarity N
Reduce working-time DT
Minify unemployment DT
Improve local environment in deprived areas N
Go
al
2 Reduce geographical labour mobility N
Protect and invest in culture, sports and recreation N
Investment in health and education N
Go
al
3 Identify clear resource and emission caps and establish reduction targets DP
Reduce waste emissions N
Reduce resource extraction N
Go
al
4
Decrease material use DT
Decrease energy use DT
Promote environmentally beneficial sectors N
Incentive the use of public transportation or soft modes of transportation N
Investment in better selected technical innovations N
Investment in environmental and technological research N
Reduce the 'delocalization of the economy' N
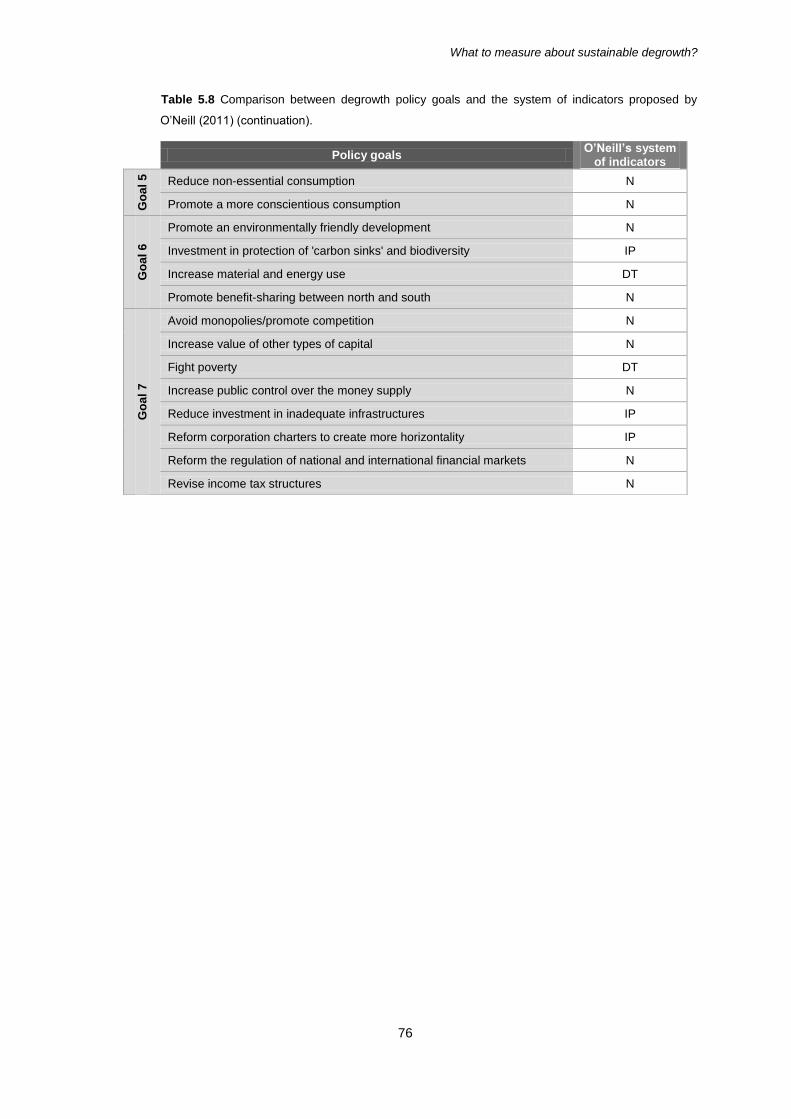
What to measure about sustainable degrowth?
76
Table 5.8 Comparison between degrowth policy goals and the system of indicators proposed by
O’Neill (2011) (continuation).
Policy goals O’Neill’s system
of indicators
Go
al
5
Reduce non-essential consumption N
Promote a more conscientious consumption N
Go
al
6
Promote an environmentally friendly development N
Investment in protection of 'carbon sinks' and biodiversity IP
Increase material and energy use DT
Promote benefit-sharing between north and south N
Go
al
7
Avoid monopolies/promote competition N
Increase value of other types of capital N
Fight poverty DT
Increase public control over the money supply N
Reduce investment in inadequate infrastructures IP
Reform corporation charters to create more horizontality IP
Reform the regulation of national and international financial markets N
Revise income tax structures N

Conclusions and future developments
77
Chapter 6. Conclusions and future developments
6.1. Synthesis of the work
The debate around limits to human expansion is going on for over two centuries, however things
change very slowly. Sustainability is a modern concern but also with old origins. It has appeared
when environmental concerns started to burst in a global scale and since then it has been echoed
as a priority to pursue. It has been argued that the concept perseveres until today due to the fact
that it maintained the same meaning along the years.
The strive for a sustainable development started with the Brundtland report publication in 1987,
being connected to economic growth since then. At the time, it was thought that a sustainable
growth was possible, meaning that it was conceivable to achieve a total decoupling between
environmental impacts and human activities. Nonetheless, more than twenty years have passed by
and the environmental sciences evolved, creating new paradigms but also facing new problems. In
the meanwhile, what is being evermore concluded is that a total decoupling is very utopian and that
we cannot continue to be as positive as we are about technological evolution. Technology might
not always solve all our problems, so instead we should focus on reducing them.
Economic growth is only possible with throughput growth, what generates more environmental
problems. Moreover, economic growth for its own sake only increases the wealth of some. This
creates major inequality issues and it does not necessary ends with poverty.
We now know that the developed countries have already surpassed their fair limits of growth,
relatively to the developing world. This is why it is important to promote a degrowth movement,
since we have already gone too far when we ignored those limits. Growth and development has to
be turned into a global goal, instead of a regional one.
The sustainable degrowth perspective does not have to have a negative connotation, in spite of
being easy to erroneously interpret it in that way. This is an endeavour for a decline on the harmful
sectors of our economic system and in the balanced growth of the beneficial ones, it is not
supposed to be a degrowth without a specific target. Nonetheless, degrowth cannot turn into a
radicalism as growth currently is, and it has to focus its target on the important ends – global
human well-being along with the respect for the environmental systems. Although these are the
ultimate ends, investigation is still needed to delineate the desired panorama for the future, since it
is crucial to know what are we longing for, to then understand how to get there.
In this context, the public debate has to be launched in order to give the opportunity for the most
adversely affected to express their interests. In spite of the degrowth transition has to be done in a
voluntary way, which comes with the desire for a change in this consumerist society, it is very
unlikely that this is going to happen as fast as it is needed, at least in a global way. This is partially
due to the conflict of interests between the ones who benefit with economic growth and the ones
who only end up worse. It is also due to the fact that even with the right knowledge, people have
Conclusions and future developments
78
difficulties in changing their behaviours, since that takes a great effort. Also, it is crucial to pressure
the most damaging sectors to change their conduct towards the environment, and that has to be
done mainly through policy creation.
The first priority when making sustainable policy is to address the scale issue, as it is essential to
contain society’s throughput to stay within the ecological regenerative capabilities of the
ecosystems. Justice is also a crucial matter, as a sustainable development presupposes the
respect of people’s needs and opinions as well as the limit of the range of inequality in terms of
wealth distribution, life opportunities and the distribution of environmental costs. Since the
beginning, sustainability was also a question of intergenerational justice, a strive for maintaining the
quantity and quality of resources for the next generations usufruct. The efficiency issue is also a
very important aspect to have into account when constructing policy. Although the efficiency itself is
not the only condition to achieve sustainability, it is very important that evermore we efficiently
allocate scarce resources, for avoiding their depreciation. The literature review showed that the
policy goals that are being discussed in the degrowth groups of research address all these policy-
making concerns.
An economic crisis is a great opportunity for the intended transition to occur, as it shows the
debilities of an economic system that only functions with constant growth. When growth stops, the
unemployment rate soars, the incomes go down, the social benefits start to disappear and, on the
overall, people start to feel hopeless on the political system. Moreover, although economic growth
does not have the goal of being benefited by harmful activities such as crime or due to the
reconstruction of an entire city after a catastrophic hurricane, this is what happens when we
measure an economy’s size using GDP. These types of costs to the society are included as
generators of wealth.
For this, new indicators of development should be emphasised, in order to measure what is really
important. It was shown in this study that the aggregate metrics might not be the best solution to
assess such a broad and complex perspective as sustainable degrowth is. This viewpoint has so
many aspects from so many different areas that it is not simple to find a single indicator that
captures all the important matters. As England (1998) puts forward, “perhaps the goal of a single
numerical measure of human well-being is a chimera and will never be achieved”. And maybe the
author is right, in spite of the aggregate measures are much simpler to analyse in terms of progress
of a certain aspect. However, when it comes to monitor the complex progress of a society’s
development, a system of indicators is maybe the more accurate way to stay in focus and to not
give more importance to aspects easier to measure in detriment of others. For this, it is important to
delineate targets and to assemble groups of indicators that can measure the progress towards the
goals. The recent propose of a system of indicators by O’Neill (2011) is already a step towards that
direction. Summarily, the policy goals that focus on growth are the social and environmental
investment for the increasing the human well-being and the environmental quality. The policy goals
that focus on degrowth are resource consumption and, consequently the scale of production as
well as the scale of the economy.
Conclusions and future developments
79
The method used in this work for analysing the metrics has limitations. The classification chosen is
a subject of debate itself, as it was done considering only the components of the metrics. However,
it gives a perspective of how can the existing metrics be used to assess the new concerns around
degrowth debate, as well as where can we intervene to adapt them to those concerns. The
analyses can also be considered as a reflection of what is being emphasised nowadays in terms of
policy making as well as what is lacking to be addressed. In the context of a world that is focused
on economic growth to solve all the problems, degrowth movement suggestions of minimizing our
consumption and restructuring the economic system are not an option nowadays and that is
reflected in the indicators chosen to evaluate our progress. Nonetheless, it is still arguable if
degrowth is a prescription or a diagnosis tool of what is already involuntarily happening to society.
6.2. Future developments
The area of research of this dissertation is very broad and it still has many matters to explore. The
sustainable degrowth debate includes a wide-range of areas that comprise economic, social,
ethical and environmental aspects. This means that a great number of experts are needed to cover
all the different areas and interconnect them.
Relatively to the policy goals analysed in this work, there are aspects that may not be included and
that should have further investigation. This could be done, for instance, by creating an experiment
with members from communities where people could debate the important things within degrowth
goals and propose policy goals or policy instruments as solutions. Many policy goals analysed lack
of policy instruments that materialize them, so that would be also an area of research that would
make sense to pursue, since it is crucial to know exactly how do degrowth concerns take shape
outside the theoretical foundation of their principles.
The work done in terms of analysing metrics to assess degrowth goals is not finished, since it has
still space to expand to other indicators not approached here. The results of the analysis done
show that on the one hand, it is very debatable how the indicators assess what is intended and, on
the other hand, many aspects are not covered yet. An interesting future work to be carried out is to
scrutinize the classification already done to find methods to adapt some indicators to measure or
monitor in a direct and total way the crucial aspects of a society’s path to a sustainable degrowth.
This means to analyse every indicator that measures an aspect in an indirect (partial and total) way
and also the ones which measure the aspects in a direct way but that still do not cover all the
intended components. Other work that can be done is to analyse the results and assemble the
indicators or components of indicators which already allow measuring the important matters and
with that create a system of indicators. Afterwards, it would be interesting to apply this system of
indicators to some countries and understand their development in terms of degrowth concerns.
This would be a great challenge but useful to assess if countries are heading to a sustainable path
in terms of a development that comprises less negative impacts on the environment and more
positive impacts on social well-being.

Conclusions and future developments
80

References
81
References
Abdallah, S., Thompson, S., Michaelson, J., Marks, N. & Steuer, N. (2009) The (un)Happy Planet Index 2.0. London, UK, The new economics foundation. Available from: <http://www.happyplanetindex.org/learn/download-report.html> [Accessed 26 September 2011].
Alcott, B. (2010) Impact caps: why population, affluence and technology strategies should be abandoned. Journal of Cleaner Production, 18 (6), pp.552–560.
Alcott, B. (2011) Should degrowth embrace the Job Guarantee? Journal of Cleaner Production, doi: http://dx.doi.org/10.1016/j.jclepro.2011.06.007.
APA (2007) Sistema de Indicadores de Desenvolvimento Sustentável – SIDS PORTUGAL. Lisbon, PT, Agência Portuguesa do Ambiente. Available from: <http://www.apambiente.pt/Instrumentos/sids/> [Accessed 3 October 2011].
Bardi, U. (2011) The Limits to Growth Revisited. New York, US, Springer.
Barnett, H.J. & Morse, C. (1963) Scarcity and growth: the economics of natural resource availability. Baltimore, US, Johns Hopkins Press.
Bartlett, A. (2006) Reflections on Sustainability, Population Growth, and the Environment—2006. In: M. Keiner ed. The future of sustainability. Dordrecht, NL, Springer, pp.17–37.
Baykan, B. (2007) From limits to growth to degrowth within French green politics. Environmental Politics, 16 (3), p.513-517.
Beça, P. & Santos, R. (2010) Measuring sustainable welfare: A new approach to the ISEW. Ecological Economics, 69 (4), pp.810–819.
Berg, A. & Hukkinen, J.I. (2011) The paradox of growth critique: Narrative analysis of the Finnish sustainable consumption and production debate. Ecological Economics, 72, pp.151–160.
van den Bergh, J. (2010) Relax about GDP growth: implications for climate and crisis policies. Journal of Cleaner Production, 18 (6), pp.540–543.
van den Bergh, J. (2011) Environment versus growth - A criticism of ‘degrowth’ and a plea for ‘a-growth’. Ecological Economics, 70 (5), pp.881–890.
de Boer, B. & Hueting, R. (2004) Sustainable National Income and Multiple Indicators for Sustainable Development. In: Measuring Sustainable Development: Integrated Economic, Environmental and Social Frameworks. Paris, FR, OECD Publishing, pp.39–52. Available from: <http://www.oecd-ilibrary.org/environment/measuring-sustainable-development/sustainable-national-income-and-multiple-indicators-for-sustainable-development_9789264020139-6-en> [Accessed 30 September 2011].
Böhringer, C. & Jochem, P. (2007) Measuring the immeasurable - A survey of sustainability indices. Ecological Economics, 63 (1), pp.1–8.
Borowy, I. (2011) Degrowth and public health in Cuba: lessons from the past? Journal of Cleaner Production, doi: http://dx.doi.org/10.1016/j.jclepro.2011.11.057.
Cattaneo, C. & Gavaldà, M. (2010) The experience of rurban squats in Collserola, Barcelona: what kind of degrowth? Journal of Cleaner Production, 18 (6), pp.581–589.
CIW Network (2009) How are Canadians Really Doing? Waterloo, CA, Canadian Index of Wellbeing and University of Waterloo. Available from: <http://ciw.ca/en/ResourcesAndDiscussion/Reports.html> [Accessed 29 September 2011].

References
82
Collen, B., Loh, J., Whitmee, S., McRae, L., Amin, R. & Baillie, J. (2009) Monitoring change in vertebrate abundance: the living planet index. Conservation Biology, 23 (2), pp.317–327.
D’Alessandro, S., Luzzati, T. & Morroni, M. (2010) Energy transition towards economic and environmental sustainability: feasible paths and policy implications. Journal of Cleaner Production, 18 (6), pp.532–539.
D’Alisa, G. & Cattaneo, C. (2011) Household work and energy consumption: a degrowth perspective. Catalonia’s case study. Journal of Cleaner Production, doi: http://dx.doi.org/10.1016/j.jclepro.2011.11.058.
Daly, H. (1992) Allocation, distribution, and scale: towards an economics that is efficient, just, and sustainable. Ecological Economics, 6 (3), pp.185–193.
Daly, H. (2006) Sustainable Development— Definitions, Principles, Policies. In: M. Keiner ed. The future of sustainability. Dordrecht, NL, Springer, pp.17–37.
Daly, H. (2008a) A Steady-State Economy. In: SDC workshop ‘Confronting Structure - achieving economic sustainability’. London, UK, Sustainable Development Commission. Available from: <http://www.sd-commission.org.uk/publications.php?id=775> [Accessed 15 May 2011].
Daly, H. (2008b) Credit Crisis, Financial Assets, and Real Wealth. The Oil Drum, (October 13). Available from: <http://www.theoildrum.com/node/4617> [Accessed 27 January 2012].
Daly, H., Cobb, J. & Cobb, C. (1989) For the common good: redirecting the economy toward community, the environment, and a sustainable future. Boston, US, Beacon Press.
Daly, H. & Farley, J. (2011) Ecological Economics: Principles and Applications. 2nd ed. Washington, US, Island Press.
Dawnay, E. & Shah, H. (2005) Behavioural economics: seven principles for policy-makers. London, UK, The new economics foundation. Available from: <http://neweconomics.org/publications/behavioural-economics> [Accessed 10 January 2012].
Delacote, P. & Montagné-Huck, C. (2012) Political consumerism and public policy: Good complements against market failures? Ecological Economics, 73, pp.188–193.
Dickinson, E. (2011) GDP: a brief history. Foreign Policy, (January/February). Available from: <http://www.foreignpolicy.com/articles/2011/01/02/gdp_a_brief_history> [Accessed 30 October 2011].
Dietz, S. & Neumayer, E. (2006) A critical appraisal of genuine savings as an indicator of sustainability. In: P. Lawn ed. Sustainable development indicators in ecological economics. Cheltenham, UK, Edward Elgar, pp.117–135.
Dietz, S. & Neumayer, E. (2007) Weak and strong sustainability in the SEEA: Concepts and measurement. Ecological Economics, 61 (4), pp.617–626.
Dovers, S. (2001) Informing institutions and policies. In: J. Venning & J. Higgins eds. Towards sustainability. Sydney, AU, UNSW Press, pp.196–220.
EC (2011) Sustainable development in the European Union - 2011 monitoring report on the EU sustainable development strategy. Luxembourg, LU, European Commission. Available from: <http://epp.eurostat.ec.europa.eu/portal/page/portal/product_details/publication?p_product_code=KS-31-11-224> [Accessed 27 February 2012].
EEA (2005) EEA core set of indicators - Guide — EEA. Copenhagen, DK, European Environment Agency. Available from: <http://www.eea.europa.eu/publications/technical_report_2005_1> [Accessed 27 September 2011].
References
83
Emerson, J., Esty, D., Kim, C., Srebotnjak, T., Levy, M.A., Mara, V., Sherbinin, A. & Jaiteh, M. (2010) 2010 Environmental Performance Index. New Haven, US, Yale Center for Environmental Law and Policy. Available from: <http://epi.yale.edu/file_columns/0000/0157/epi2010_report.pdf> [Accessed 22 September 2011].
England, R.W. (1998) Measurement of social well-being: alternatives to gross domestic product. Ecological Economics, 25 (1), pp.89–103.
Erb, K.-H., Krausmann, F., Gaube, V., Gingrich, S., Bondeau, A., Fischer-Kowalski, M. & Haberl, H. (2009) Analyzing the global human appropriation of net primary production -- processes, trajectories, implications. An introduction. Ecological Economics, 69 (2), pp.250–259.
Esty, D., Levy, M., Srebotnjak, T. & Sherbinin, A. de (2005) 2005 Environmental Sustainability Index: Benchmarking National Environmental Stewardship. New Haven, US, Yale Center for Environmental Law & Policy. Available from: <http://www.yale.edu/esi/> [Accessed 26 September 2011].
Ewing, B., Moore, D., Goldfinger, S., Oursler, A., Reed, A. & Wackernagel, M. (2010) The Ecological Footprint Atlas 2010. Oakland, US, Global Footprint Network. Available from: <http://www.footprintnetwork.org/en/index.php/GFN/page/publications/> [Accessed 16 January 2012].
Failing, L. & Gregory, R. (2003) Ten common mistakes in designing biodiversity indicators for forest policy. Journal of Environmental Management, 68 (2), pp.121–132.
Flanagan, K., Uyarra, E. & Laranja, M. (2011) Reconceptualising the ‘policy mix’ for innovation. Research Policy, 40 (5), pp.702–713.
Fournier, V. (2008) Escaping from the economy: the politics of degrowth. International Journal of Sociology and Social Policy, 28 (11/12), pp.528–545.
Georgescu-Roegen, N. (1995) La Décroissance. 2nd ed. I. Rens & J. Grinevald eds. Chicoutimi, CA, Sang de la terre. Available from: <http://classiques.uqac.ca/contemporains/georgescu_roegen_nicolas/decroissance/decroissance.html> [Accessed 15 May 2011].
Government of Costa Rica (2000) Benefit Sharing - Experience of Costa Rica. In: Second Regional Workshop of the UNCTAD ‘Project on Strengthening Research and Policy Making Capacity on Trade and Environment in the Developing countries’ (31 May to 2 June 2000 - Havana, CU). Available from: <http://r0.unctad.org/trade_env/discpapers2.htm> [Accessed 22 January 2012].
Gowdy, J. & Mesner, S. (1998) The Evolution of Georgescu-Roegen’s Bioeconomics. Review of Social Economy, 56 (2), pp.136–156.
Haberl, H., Wackernagel, M., Krausmann, F., Erb, K.-H. & Monfreda, C. (2004) Ecological footprints and human appropriation of net primary production: a comparison. Land Use Policy, 21 (3), pp.279–288.
Hamilton, C. (1999) The genuine progress indicator methodological developments and results from Australia. Ecological Economics, 30 (1), pp.13–28.
Hamilton, C. (2010) Consumerism, self-creation and prospects for a new ecological consciousness. Journal of Cleaner Production, 18 (6), pp.571–575.
Hamilton, K., Atkinson, G. & David, P. (1997) Genuine Savings as an indicator of sustainability. Norwich, UK, Centre for Social and Economic Research on the Global Environment. Available from: <http://www.cserge.ac.uk/publications/working-papers> [Accessed 27 February 2012].
Hanley, N. (2000) Macroeconomic Measures of ‘Sustainability’. Journal of Economic Surveys, 14 (1), pp.1–30.

References
84
Hardin, G. (1977) Ethical Implications of Carrying Capacity. Available from: <http://www.garretthardinsociety.org/articles/art_ethical_implications.html> [Accessed 7 July 2011].
Harris, J. (2010) The Macroeconomics of Development without Throughput Growth. Medford, US, Global Development and Environment Institute, Tufts University. Available from: <http://www.ase.tufts.edu/gdae/publications/working_papers/index.html> [Accessed 4 November 2011].
Hezri, A.A. & Dovers, S. (2006) Sustainability indicators, policy and governance: Issues for ecological economics. Ecological Economics, 60 (1), pp.86–99.
Hueting, R. (2010) Why environmental sustainability can most probably not be attained with growing production. Journal of Cleaner Production, 18 (6), pp.525–530.
Hueting, R. (2011) Environmentally Sustainable National Income and Other Ways to Improve Information About Growth. Problems of sustainable development, 6 (1), pp.31–46.
Jackson, T. (2009) Prosperity without growth: economics for a finite planet. 1st ed. London, UK, Earthscan.
Jevons, W.S. (1865) The coal question: an enquiry concerning the progress of the Nation, and the probable exhaustion of our coal-mines. London, UK, Macmillan.
Kallis, G. (2011) In defence of degrowth. Ecological Economics, 70 (5), pp.873–880.
Kallis, G. & Martinez-Alier, J. (2010) Caps yes, but how? A response to Alcott. Journal of Cleaner Production, 18 (15), pp.1570–1573.
Kallis, G., Martinez-Alier, J. & Norgaard, R.B. (2009) Paper assets, real debts: An ecological-economic exploration of the global economic crisis. Critical Perspectives on International Business, 5 (1/2), pp.14–25.
van de Kerk, G. & Manuel, A. (2008) A comprehensive index for a sustainable society: The SSI - the Sustainable Society Index. Ecological Economics, 66 (2-3), pp.228–242.
van de Kerk, G. & Manuel, A. (2010) Sustainable Society Index 2010. The Hague, NL, Sustainable Society Foundation. Available from: <http://www.ssfindex.com/information/publications/> [Accessed 26 September 2011].
Kerschner, C. (2010) Economic de-growth vs. steady-state economy. Journal of Cleaner Production, 18 (6), pp.544–551.
Kidd, C. (1992) The evolution of sustainability. Journal of Agricultural and Environmental Ethics, 5 (1), pp.1–26.
Klitgaard, K.A. & Krall, L. (2011) Ecological economics, degrowth, and institutional change. Ecological Economics, doi: http://dx.doi.org/10.1016/j.ecolecon.2011.11.008.
Korten, D. (2008) Agenda for a New Economy. 1st ed. San Francisco, USA, Berrett-Koehler Publishers.
Latouche, S. (2009) Farewell to Growth. Cambridge, UK, Polity.
Latouche, S. (2010) Degrowth. Journal of Cleaner Production, 18 (6), pp.519–522.
Lawn, P. (2003) A theoretical foundation to support the Index of Sustainable Economic Welfare (ISEW), Genuine Progress Indicator (GPI), and other related indexes. Ecological Economics, 44 (1), pp.105–118.

References
85
Lawn, P. & Clarke, M. (2010) The end of economic growth? A contracting threshold hypothesis. Ecological Economics, 69 (11), pp.2213–2223.
Lawn, P. & Sanders, R. (1999) Has Australia surpassed its optimal macroeconomic scale? Finding out with the aid of ‘benefit’ and ‘cost’ accounts and a sustainable net benefit index. Ecological Economics, 28 (2), pp.213–229.
Levallois, C. (2010) Can de-growth be considered a policy option? A historical note on Nicholas Georgescu-Roegen and the Club of Rome. Ecological Economics, 69 (11), pp.2271–2278.
Lietaert, M. (2010) Cohousing’s relevance to degrowth theories. Journal of Cleaner Production, 18 (6), pp.576–580.
Lorek, S. & Fuchs, D. (2011) Strong sustainable consumption governance - precondition for a degrowth path? Journal of Cleaner Production, doi: http://dx.doi.org/10.1016/j.jclepro.2011.08.008.
Malthus, T.R. (1798) An Essay on the Principle of Population. J. Johnson ed. Library of Economics and Liberty. Available from: <http://www.econlib.org/library/Malthus/malPop1.html> [Accessed 23 October 2011].
Marsh, G.P. (1864) Man and nature or physical geography as modified by human action. Cambridge, US, Harvard University Press.
Martínez-Alier, J. (2009) Socially Sustainable Economic De‐growth. Development and Change, 40 (6), pp.1099–1119.
Martínez-Alier, J., Pascual, U., Vivien, F.-D. & Zaccai, E. (2010) Sustainable de-growth: Mapping the context, criticisms and future prospects of an emergent paradigm. Ecological Economics, 69 (9), pp.1741–1747.
Matthey, A. (2010) Less is more: the influence of aspirations and priming on well-being. Journal of Cleaner Production, 18 (6), pp.567–570.
Meadows, D.H. (1998) Indicators and Information Systems for Sustainable Development. Hartland, UK, The Sustainability Institute. Available from: <http://www.donellameadows.org/archives/indicators-and-information-systems-for-sustainable-development/> [Accessed 26 October 2011].
Meadows, D.H., Meadows, D.L., Randers, Jorgen & Behrens III, W. (1972) The Limits to Growth. New York, US, New American Library.
Meadows, D.H., Meadows, D.L. & Randers, Jørgen (1992) Beyond the limits: confronting global collapse, envisioning a sustainable future. Toronto, CA, McClelland & Stewart.
Meadows, D.H., Randers, Jorgen & Meadows, D.L. (2004) The Limits to growth: the 30-year update. White River Junction, US, Chelsea Green Publishing Company.
Michalos, A., Smale, B., Labonté, R., Muharjarine, N., Scott, K., Moore, K., Swystun, L., Holden, B., Bernardin, H., Dunning, B., Graham, P., Guhn, M., Gadermann, A., Zumbo, B., Morgan, A., Brooker, A.-S. & Hyman, I. (2011) The Canadian Index of Wellbeing. Waterloo, CA, Canadian Index of Wellbeing and University of Waterloo. Available from: <http://ciw.ca/en/ResourcesAndDiscussion/Reports.html> [Accessed 13 January 2012].
Mill, J.S. (1909) Principles of Political Economy. W. Ashley ed. Library of Economics and Liberty. Available from: <http://www.econlib.org/library/Mill/mlP61.html#Bk.IV,Ch.VI> [Accessed 20 June 2011].
Moldan, B., Janoušková, S. & Hák, T. (2011) How to understand and measure environmental sustainability: Indicators and targets. Ecological Indicators, 17, pp.4–13.

References
86
Moran, D., Wackernagel, M., Kitzes, J., Goldfinger, S. & Boutaud, A. (2008) Measuring sustainable development -- Nation by nation. Ecological Economics, 64 (3), pp.470–474.
Neumayer, E. (1999) The ISEW - not an Index of Sustainable Economic Welfare. Social Indicators Research, 48 (1), pp.77–101.
Neumayer, E. (2001) The human development index and sustainability — a constructive proposal. Ecological Economics, 39 (1), pp.101–114.
O’Neill, D. (2011) Measuring progress in the degrowth transition to a steady state economy. Ecological Economics, p.doi: 16/j.ecolecon.2011.05.020.
Paavola, J. & Adger, W. (2005) Institutional ecological economics. Ecological Economics, 53 (3), pp.353–368.
Paul, B. (2008) A history of the concept of sustainable development: literature review. Analele Universitaţătii din Oradea - Ştiinţe Economice, II (Economy and Business Administration), pp.581–585.
Prescott-Allen, R. (2001) The wellbeing of nations: a country-by-country index of quality of life and the environment. Washington, US, Island Press.
Rapport, D. (2000) Ecological footprints and ecosystem health: complementary approaches to a sustainable future. Ecological Economics, 32 (3), pp.367–370.
Raventós, D. (2007) Basic income: the material conditions of freedom. London, UK, Pluto Press.
Recio, A. (2008) Apuntes sobre la economía y la política del decrecimiento. Ecología Política, (35), pp.25–34.
Research & Degrowth (2010) Degrowth Declaration of the Paris 2008 conference. Journal of Cleaner Production, 18 (6), pp.523–524.
Research & Degrowth (2011) Degrowth Declaration Barcelona 2010 [Internet]. Available from: <http://www.degrowth.org/Barcelona-2010-Declaration.119.0.html> [Accessed 15 May 2011].
Riddell, R. (1981) Ecodevelopment: economics, ecology and development : an alternative to growth imperative models. Farnham, UK, Gower.
Samuelson, P.A. & Nordhaus, W. (2005) Economia. 18th ed. Columbus, US, McGraw-Hill.
Santos, R., Antunes, P., Baptista, G., Mateus, P. & Madruga, L. (2006) Stakeholder participation in the design of environmental policy mixes. Ecological Economics, 60 (1), pp.100–110.
Schneider, F., Kallis, G. & Martinez-Alier, J. (2010) Crisis or opportunity? Economic degrowth for social equity and ecological sustainability. Introduction to this special issue. Journal of Cleaner Production, 18 (6), pp.511–518.
Schumacher, E. (1973) Small Is Beautiful: A Study of Economics as If People Mattered. London, UK, Blond & Briggs.
Seyfang, G. (2004) Working Outside the Box: Community Currencies, Time Banks and Social Inclusion. Journal of Social Policy, 33 (1), pp.49–71.
Shaler, N.S. (1905) Man and the earth. New York, US, Fox, Duffield & company.
Shi, Y., Zhou, C., Wang, R. & Xu, W. (2012) Measuring China’s regional ecological development through ‘EcoDP’. Ecological Indicators, 15 (1), pp.253–262.

References
87
Simpson, R.D., Toman, M.A. & Ayres, R.U. (2005) Scarcity and growth revisited: natural resources and the environment in the new millennium. Washington, US, Resources for the Future Press.
Smith, A. (1904) Wealth of Nations. Methuen & Co, Ltd ed. Library of Economics and Liberty. Available from: <http://www.econlib.org/library/Smith/smWN.html> [Accessed 20 June 2011].
Smith, V.K. (1979) Scarcity and Growth Reconsidered. Baltimore, US, Johns Hopkins University Press.
SOPAC (2005) Building Resilience in SIDS - The Environmental Vulnerability Index. Suva, FJ, South Pacific Applied Geoscience Commission. Available from: <http://www.vulnerabilityindex.net/EVI_2005.htm> [Accessed 29 September 2011].
Spangenberg, J. (2010) The growth discourse, growth policy and sustainable development: two thought experiments. Journal of Cleaner Production, 18 (6), pp.561–566.
Svarstad, H., Sletten, A., Paloniemi, R., Barton, D. & Grieg-Gran, M. (2011) Three types of environmental justice: From concepts to empirical studies of social impacts of policy instruments for conservation of biodiversity. Oslo, NO, Norwegian Institute for Nature Research - NINA. Available from: <http://policymix.nina.no/Publications/Reports.aspx> [Accessed 21 January 2012].
Talberth, J., Cobb, C. & Slattery, N. (2007) The Genuine Progress Indicator 2006: A tool for sustainable development. Oakland, US, Redefining Progress. Available from: <http://www.environmental-expert.com/Files%5C24200%5Carticles%5C12128%5CGPI202006.pdf> [Accessed 3 September 2011].
Thoreau, H.D. (1957) Walden. Boston, US, Ticknor and Fields.
Tinbergen, J. (1952) On the theory of economic policy. Amesterdam, NL, North-Holland Pub. Co.
UN (2003) Indicators for Monitoring the Millennium Development Goals. New York, US, United Nations. Available from: <http://mdgs.un.org/unsd/mdg/Host.aspx?Content=Indicators/Handbook.htm> [Accessed 27 September 2011].
UN (2011) The Millennium Development Goals Report 2011. New York, US, United Nations. Available from: <http://mdgs.un.org/unsd/mdg/Host.aspx?Content=Products/ProgressReports.htm> [Accessed 27 September 2011].
UN (2012) Environmental-Economic Accounting: SEEA Revision. Available from: <http://unstats.un.org/unsd/envaccounting/seearev/> [Accessed 14 February 2012].
UN, EC, IMF, OECD & WB (2003) Handbook of National Accounting - Integrated Environmental and Economic Accounting 2003. Available from: <http://unstats.un.org/unsd/envaccounting/pubs.asp> [Accessed 23 September 2011].
UNDP (2010a) Human Development Report 2010. New York, US, United Nations Development Program. Available from: <http://hdr.undp.org/en/reports/global/hdr2010/chapters/> [Accessed 23 August 2011].
UNDP (2010b) Indices & Data | Human Development Index | Human Development Reports (HDR) | United Nations Development Programme (UNDP). Available from: <http://hdr.undp.org/en/statistics/hdi/> [Accessed 24 August 2011].
UNEP (2011) Towards a Green Economy: Pathways to Sustainable Development and Poverty Eradication. New York, US, United Nations. Available from: <www.unep.org/greeneconomy> [Accessed 3 July 2011].

References
88
Vačkář, D. (2012) Ecological Footprint, environmental performance and biodiversity: A cross-national comparison. Ecological Indicators, 16, pp.40–60.
Victor, P. (2008) Managing without growth: slower by design, not disaster. Cheltenham, UK, Edward Elgar Publishing.
Victor, P. (2011) Growth, degrowth and climate change: A scenario analysis. Ecological Economics, doi: http://dx.doi.org/10.1016/j.ecolecon.2011.04.013.
Vitousek, P., Ehrlich, P., Ehrlich, A. & Pamela, M. (1986) Human Appropriation of the Products of Photosynthesis. Bioscience, 36 (6), pp.368–373.
Wackernagel, M., Onisto, L., Linares, A., Falfán, I., García, J., Guerrero, A.I. & Guerrero, M.G. (1997) Ecological Footprints of Nations: How much nature do they use? -- How much nature do they have? Xalapa, MX, Centro de Estudios para la Sustentabilidad - Universidad Anáhuac de Xalapa. Available from: <http://www.ucl.ac.uk/dpu-projects/drivers_urb_change/urb_environment/sustainability.htm> [Accessed 8 September 2011].
WB (2011) World Development Indicators. Washington, US, The World Bank. Available from: <http://data.worldbank.org/data-catalog/world-development-indicators/wdi-2011> [Accessed 15 July 2011].
WCED (1987a) Our common future. Oxford, UK, Oxford University Press.
WCED (1987b) Our Common Future. New York, US, United Nations. Available from: <http://www.un-documents.net/wced-ocf.htm> [Accessed 3 July 2011].
WWF (2010) Living Planet Report 2010. Gland, CH, World Wide Fund for Nature. Available from: <http://wwf.panda.org/about_our_earth/all_publications/living_planet_report/> [Accessed 22 September 2011].
89
Annexes
Annex I – Analysed policy goals from sustainable degrowth-related literature ...................... 90
Annex II – Components of the metrics analysed ........................................................................ 95
Economic aggregated metrics ..................................................................................................... 95
Biophysical & social aggregated metrics..................................................................................... 97
Sets of indicators ....................................................................................................................... 103
Annex III – Classification of the metrics analysed and its justification .................................. 114
Economic aggregated metrics ................................................................................................... 114
Biophysical & social aggregated metrics................................................................................... 122
Sets of indicators ....................................................................................................................... 144
D. W. O’Neill’s potential set of indicators to measure progress in the degrowth transition to a
steady state economy (OSI) ..................................................................................................... 157

Annex I – Analysed policy goals from sustainable degrowth-related literature
90
AI. Annex I – Analysed policy goals from sustainable degrowth-related literature
Table AI.1 Distribution of the specific objectives found on degrowth-related literature by authors that were reviewed (Goal 1 - Increase community resilience, fight social
inequality and poverty).
GOAL 1/ Increase community
resilience, fight social
inequality and poverty
Delacote &
Montagné-
Huck, 2011
Harris,
2010
Jackson,
2009
Kallis,
2011
Latouche,
2010
Lorek and
Fuchs,
2011
Martinez-
Alier, 2009
Martinez-
Alier et al.,
2010
Recio,
2008
Schneider
et al., 2010
van den
Bergh,
2011
Victor,
2008
Create and protect shared
public spaces ● ●
●
Encourage community-based
sustainability initiatives and
'voluntary simplicity'
● ● ● ●
●
●
Decentralize and deepen
democratic institutions ●
●
● ●
Fight discrimination
●
●
Fight crime
●
●
Promote social cohesion and
solidarity ●
●
Reduce working-time
●
●
● ● ● ● ●
Minify unemployment
● ●
●
Improve local environment in
deprived areas ●
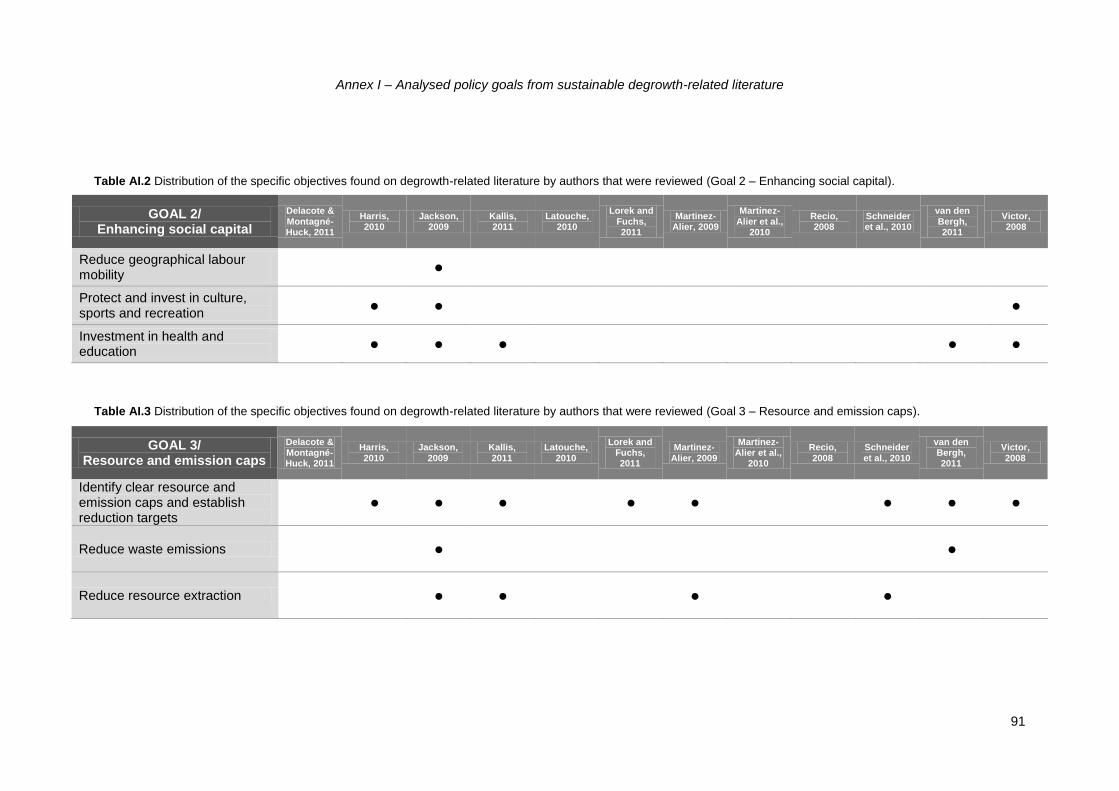
Annex I – Analysed policy goals from sustainable degrowth-related literature
91
Table AI.2 Distribution of the specific objectives found on degrowth-related literature by authors that were reviewed (Goal 2 – Enhancing social capital).
GOAL 2/ Enhancing social capital
Delacote & Montagné-Huck, 2011
Harris, 2010
Jackson, 2009
Kallis, 2011
Latouche, 2010
Lorek and Fuchs, 2011
Martinez-Alier, 2009
Martinez-Alier et al.,
2010
Recio, 2008
Schneider et al., 2010
van den Bergh, 2011
Victor, 2008
Reduce geographical labour mobility
●
Protect and invest in culture, sports and recreation
● ●
●
Investment in health and education
● ● ●
● ●
Table AI.3 Distribution of the specific objectives found on degrowth-related literature by authors that were reviewed (Goal 3 – Resource and emission caps).
GOAL 3/ Resource and emission caps
Delacote & Montagné-Huck, 2011
Harris, 2010
Jackson, 2009
Kallis, 2011
Latouche, 2010
Lorek and Fuchs, 2011
Martinez-Alier, 2009
Martinez-Alier et al.,
2010
Recio, 2008
Schneider et al., 2010
van den Bergh, 2011
Victor, 2008
Identify clear resource and emission caps and establish reduction targets
● ● ●
● ●
● ● ●
Reduce waste emissions
●
●
Reduce resource extraction
● ●
●
●

Annex I – Analysed policy goals from sustainable degrowth-related literature
92
Table AI.4 Distribution of the specific objectives found on degrowth-related literature by authors that were reviewed (Goal 4 – Reduce the ecological footprint of the North).
GOAL 4/ Reduce the ecological footprint in the North
Delacote & Montagné-Huck, 2011
Harris, 2010
Jackson, 2009
Kallis, 2011
Latouche, 2010
Lorek and Fuchs, 2011
Martinez-Alier, 2009
Martinez-Alier et al.,
2010
Recio, 2008
Schneider et al., 2010
van den Bergh, 2011
Victor, 2008
Decrease material use
● ● ● ●
●
●
Decrease energy use
● ●
●
● ●
●
●
Promote environmentally beneficial sectors
●
Incentive the use of public transportation
●
● ●
●
Investment in better selected technical innovations
● ● ●
● ● ●
●
●
Investment in environmental and technological research
●
●
Reduce the 'delocalization of the economy' (transport of goods and people on the planet)
● ●

Annex I – Analysed policy goals from sustainable degrowth-related literature
93
Table AI.5 Distribution of the specific objectives found on degrowth-related literature by authors that were reviewed (Goal 5 – Down-scaling global consumption).
GOAL 5/ Down-scaling global
consumption
Delacote & Montagné-Huck, 2011
Harris, 2010
Jackson, 2009
Kallis, 2011
Latouche, 2010
Lorek and Fuchs, 2011
Martinez-Alier, 2009
Martinez-Alier et al.,
2010
Recio, 2008
Schneider et al., 2010
van den Bergh, 2011
Victor, 2008
Reduce non-essential consumption
● ● ●
● ● ●
Promote a more conscientious consumption
●
●
● ●
●
Table AI.6 Distribution of the specific objectives found on degrowth-related literature by authors that were reviewed (Goal 6 – Support ecological transitions in developing
countries).
GOAL 6/ Support ecological transition in developing
countries
Delacote & Montagné-Huck, 2011
Harris, 2010
Jackson, 2009
Kallis, 2011
Latouche, 2010
Lorek and Fuchs, 2011
Martinez-Alier, 2009
Martinez-Alier et al.,
2010
Recio, 2008
Schneider et al., 2010
van den Bergh, 2011
Victor, 2008
Promote an environmentally friendly development
●
Investment in protection of 'carbon sinks' and biodiversity
●
Increase material and energy use
●
●
Promote benefit-sharing between north and south
●
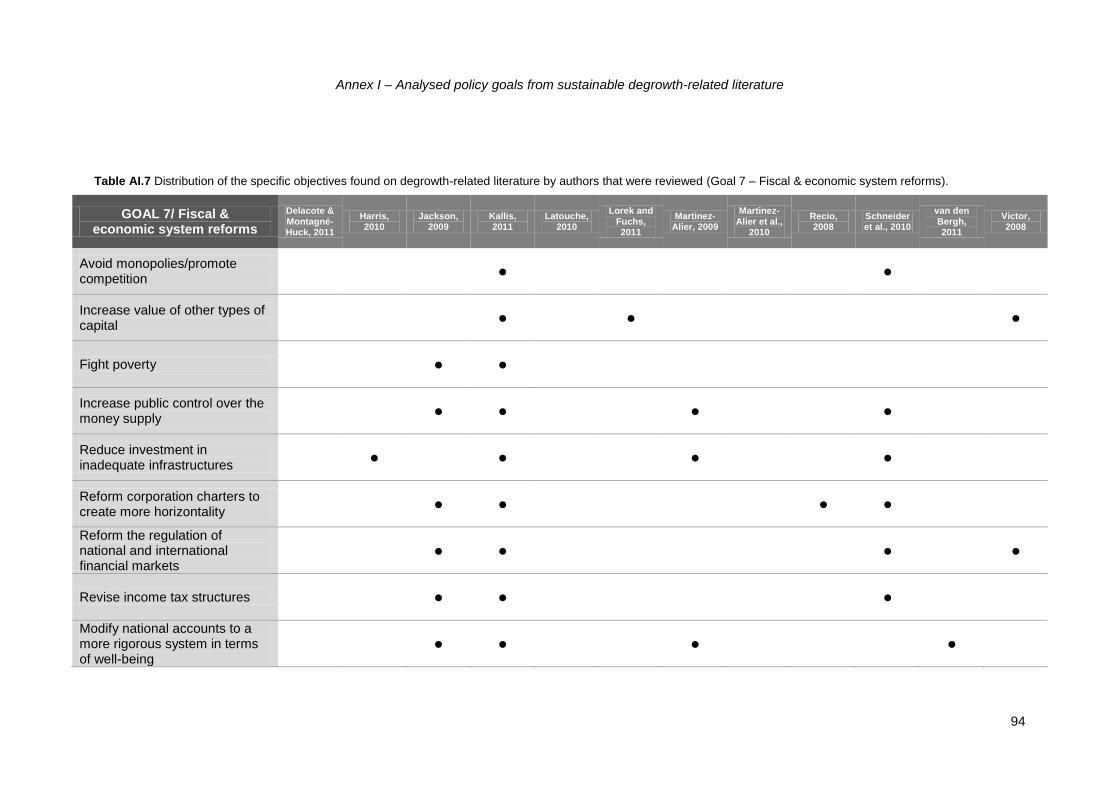
Annex I – Analysed policy goals from sustainable degrowth-related literature
94
Table AI.7 Distribution of the specific objectives found on degrowth-related literature by authors that were reviewed (Goal 7 – Fiscal & economic system reforms).
GOAL 7/ Fiscal & economic system reforms
Delacote & Montagné-Huck, 2011
Harris, 2010
Jackson, 2009
Kallis, 2011
Latouche, 2010
Lorek and Fuchs, 2011
Martinez-Alier, 2009
Martinez-Alier et al.,
2010
Recio, 2008
Schneider et al., 2010
van den Bergh, 2011
Victor, 2008
Avoid monopolies/promote competition
●
●
Increase value of other types of capital
●
●
●
Fight poverty
● ●
Increase public control over the money supply
● ●
●
●
Reduce investment in inadequate infrastructures
●
●
●
●
Reform corporation charters to create more horizontality
● ●
● ●
Reform the regulation of national and international financial markets
● ●
●
●
Revise income tax structures
● ●
●
Modify national accounts to a more rigorous system in terms of well-being
● ●
●
●
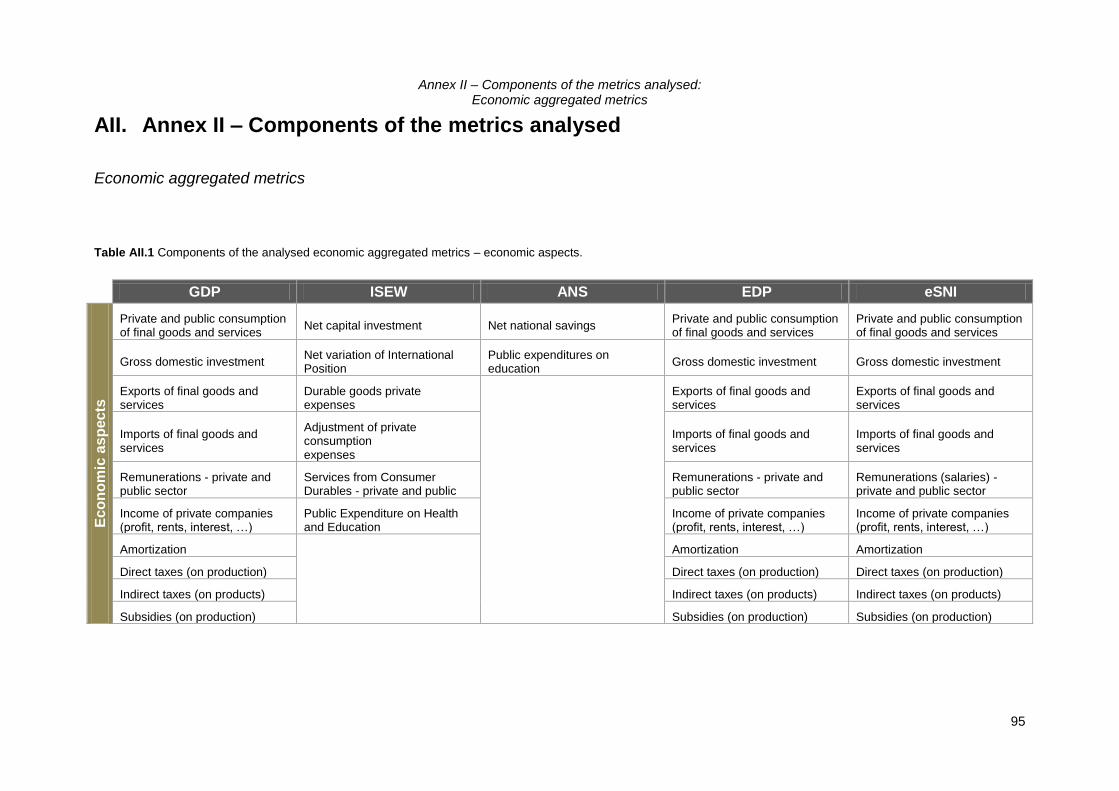
Annex II – Components of the metrics analysed: Economic aggregated metrics
95
AII. Annex II – Components of the metrics analysed
Economic aggregated metrics
Table AII.1 Components of the analysed economic aggregated metrics – economic aspects.
GDP ISEW ANS EDP eSNI
Ec
on
om
ic a
sp
ec
ts
Private and public consumption of final goods and services
Net capital investment Net national savings Private and public consumption of final goods and services
Private and public consumption of final goods and services
Gross domestic investment Net variation of International Position
Public expenditures on education
Gross domestic investment Gross domestic investment
Exports of final goods and services
Durable goods private expenses
Exports of final goods and services
Exports of final goods and services
Imports of final goods and services
Adjustment of private consumption expenses
Imports of final goods and services
Imports of final goods and services
Remunerations - private and public sector
Services from Consumer Durables - private and public
Remunerations - private and public sector
Remunerations (salaries) - private and public sector
Income of private companies (profit, rents, interest, …)
Public Expenditure on Health and Education
Income of private companies (profit, rents, interest, …)
Income of private companies (profit, rents, interest, …)
Amortization
Amortization Amortization
Direct taxes (on production)
Direct taxes (on production) Direct taxes (on production)
Indirect taxes (on products) Indirect taxes (on products) Indirect taxes (on products)
Subsidies (on production) Subsidies (on production) Subsidies (on production)

Annex II – Components of the metrics analysed: Economic aggregated metrics
96
Table AII.2 Components of the analysed economic aggregated metrics – social and environmental aspects.
ISEW ANS EDP eSNI
So
cia
l a
nd
en
vir
on
me
nta
l a
sp
ec
ts
Cost of commuting Net forest depletion Cost for environmental restoration, protection and enhancement
Use of space (ecological main structure)
Cost of unintentional accidents Carbon dioxide damage Cost of environmental pollution Emissions of acidifying substances in air
Services from household Labour Energy depletion Cost of resources consumption Emissions of GHG in air
Loss of leisure time Mineral depletion Cost of development's negative effect Emissions of nutrients in air/water/soil
Cost of crime Particulate emissions damage Emissions of ozone layer depleting substances in air
Cost of family breakdown
Emissions of toxic substances in soil
Cost of underemployment
Emissions of toxic substances in water
Harmful lifestyle
Use of non-renewable resources
Costs of Water Pollution Use of water
Costs of Air Pollution
Cost of wetland loss
Cost of forest loss
Cost of soil loss
Cost of the introduction of alien-invasive species
Cost of marine and freshwater fisheries overexploitation
Cost of non-renewable energy resources
Cost of GHG emission
Cost of ozone layer damage
Cost of noise pollution
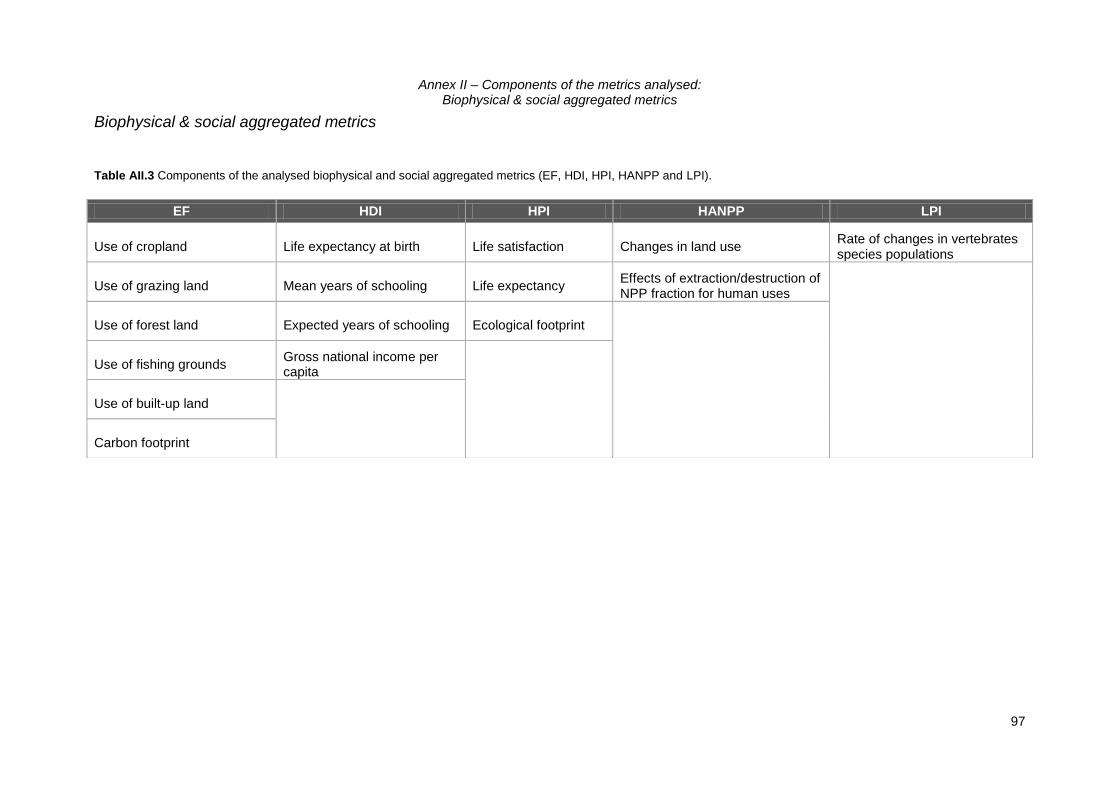
Annex II – Components of the metrics analysed: Biophysical & social aggregated metrics
97
Biophysical & social aggregated metrics
Table AII.3 Components of the analysed biophysical and social aggregated metrics (EF, HDI, HPI, HANPP and LPI).
EF HDI HPI HANPP LPI
Use of cropland Life expectancy at birth Life satisfaction Changes in land use Rate of changes in vertebrates species populations
Use of grazing land Mean years of schooling Life expectancy Effects of extraction/destruction of NPP fraction for human uses
Use of forest land Expected years of schooling Ecological footprint
Use of fishing grounds Gross national income per capita
Use of built-up land
Carbon footprint
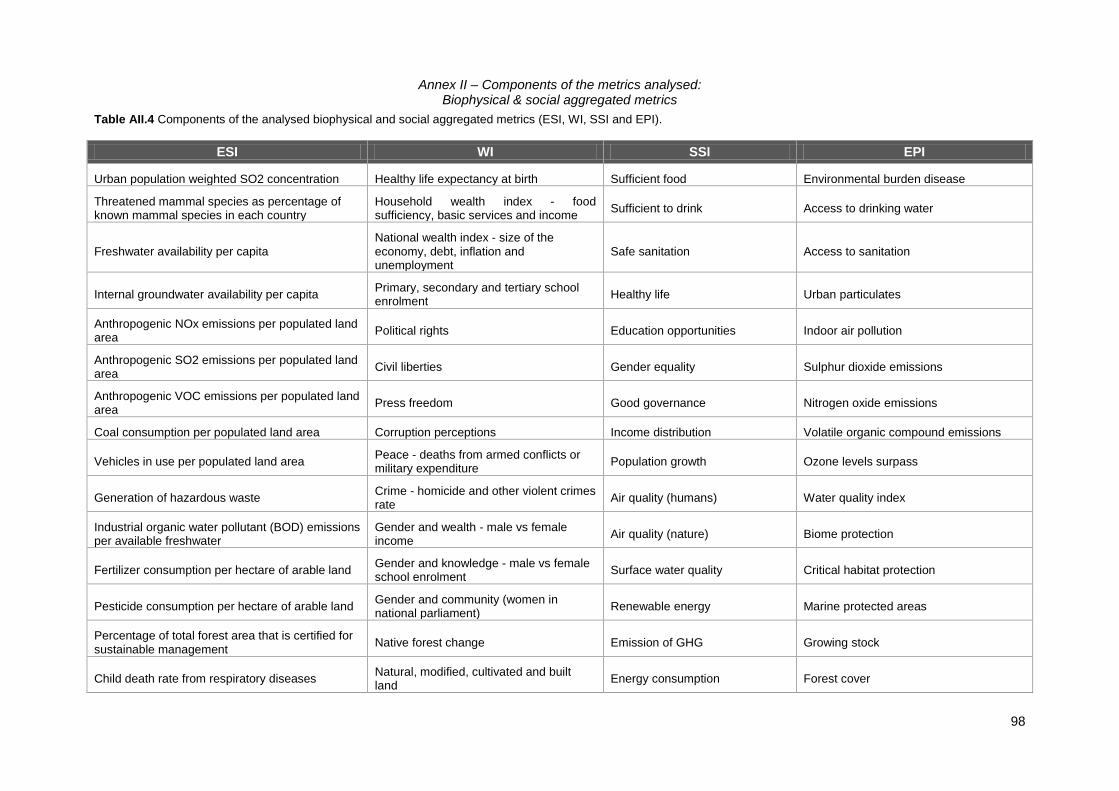
Annex II – Components of the metrics analysed: Biophysical & social aggregated metrics
98
Table AII.4 Components of the analysed biophysical and social aggregated metrics (ESI, WI, SSI and EPI).
ESI WI SSI EPI
Urban population weighted SO2 concentration Healthy life expectancy at birth Sufficient food Environmental burden disease
Threatened mammal species as percentage of known mammal species in each country
Household wealth index - food sufficiency, basic services and income
Sufficient to drink Access to drinking water
Freshwater availability per capita National wealth index - size of the economy, debt, inflation and unemployment
Safe sanitation Access to sanitation
Internal groundwater availability per capita Primary, secondary and tertiary school enrolment
Healthy life Urban particulates
Anthropogenic NOx emissions per populated land area
Political rights Education opportunities Indoor air pollution
Anthropogenic SO2 emissions per populated land area
Civil liberties Gender equality Sulphur dioxide emissions
Anthropogenic VOC emissions per populated land area
Press freedom Good governance Nitrogen oxide emissions
Coal consumption per populated land area Corruption perceptions Income distribution Volatile organic compound emissions
Vehicles in use per populated land area Peace - deaths from armed conflicts or military expenditure
Population growth Ozone levels surpass
Generation of hazardous waste Crime - homicide and other violent crimes rate
Air quality (humans) Water quality index
Industrial organic water pollutant (BOD) emissions per available freshwater
Gender and wealth - male vs female income
Air quality (nature) Biome protection
Fertilizer consumption per hectare of arable land Gender and knowledge - male vs female school enrolment
Surface water quality Critical habitat protection
Pesticide consumption per hectare of arable land Gender and community (women in national parliament)
Renewable energy Marine protected areas
Percentage of total forest area that is certified for sustainable management
Native forest change Emission of GHG Growing stock
Child death rate from respiratory diseases Natural, modified, cultivated and built land
Energy consumption Forest cover
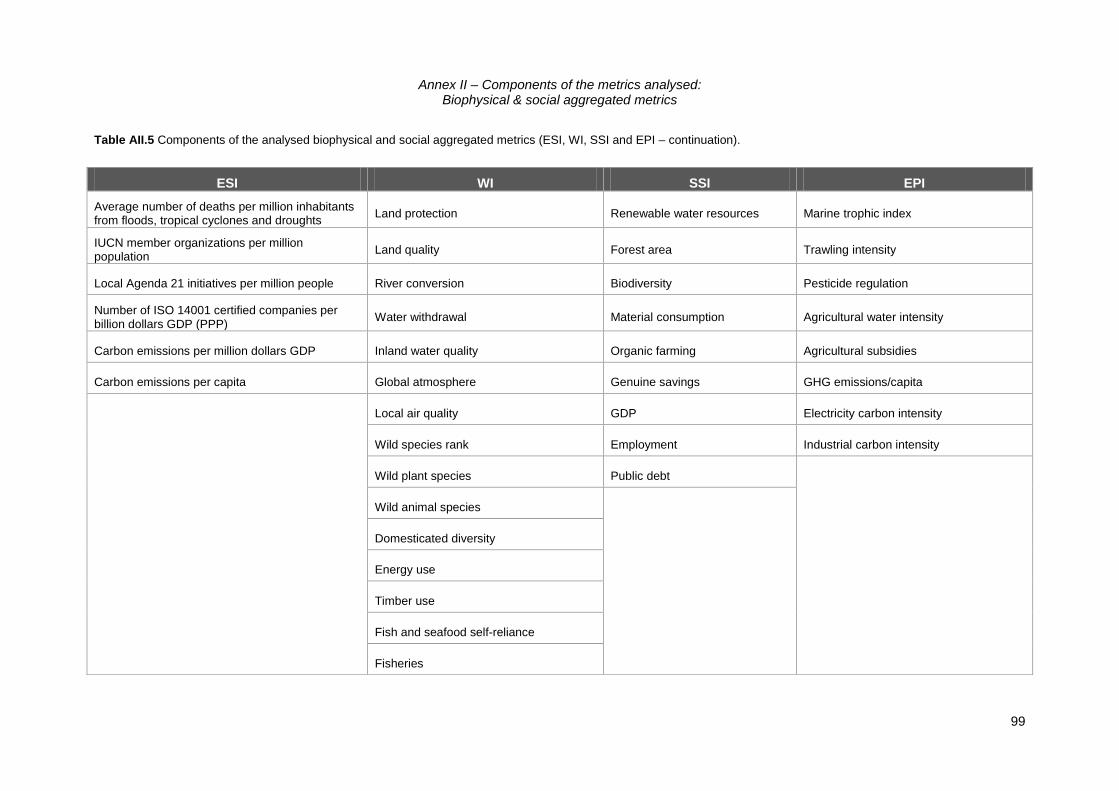
Annex II – Components of the metrics analysed: Biophysical & social aggregated metrics
99
Table AII.5 Components of the analysed biophysical and social aggregated metrics (ESI, WI, SSI and EPI – continuation).
ESI WI SSI EPI
Average number of deaths per million inhabitants from floods, tropical cyclones and droughts
Land protection Renewable water resources Marine trophic index
IUCN member organizations per million population
Land quality Forest area Trawling intensity
Local Agenda 21 initiatives per million people River conversion Biodiversity Pesticide regulation
Number of ISO 14001 certified companies per billion dollars GDP (PPP)
Water withdrawal Material consumption Agricultural water intensity
Carbon emissions per million dollars GDP Inland water quality Organic farming Agricultural subsidies
Carbon emissions per capita Global atmosphere Genuine savings GHG emissions/capita
Local air quality GDP Electricity carbon intensity
Wild species rank Employment Industrial carbon intensity
Wild plant species Public debt
Wild animal species
Domesticated diversity
Energy use
Timber use
Fish and seafood self-reliance
Fisheries
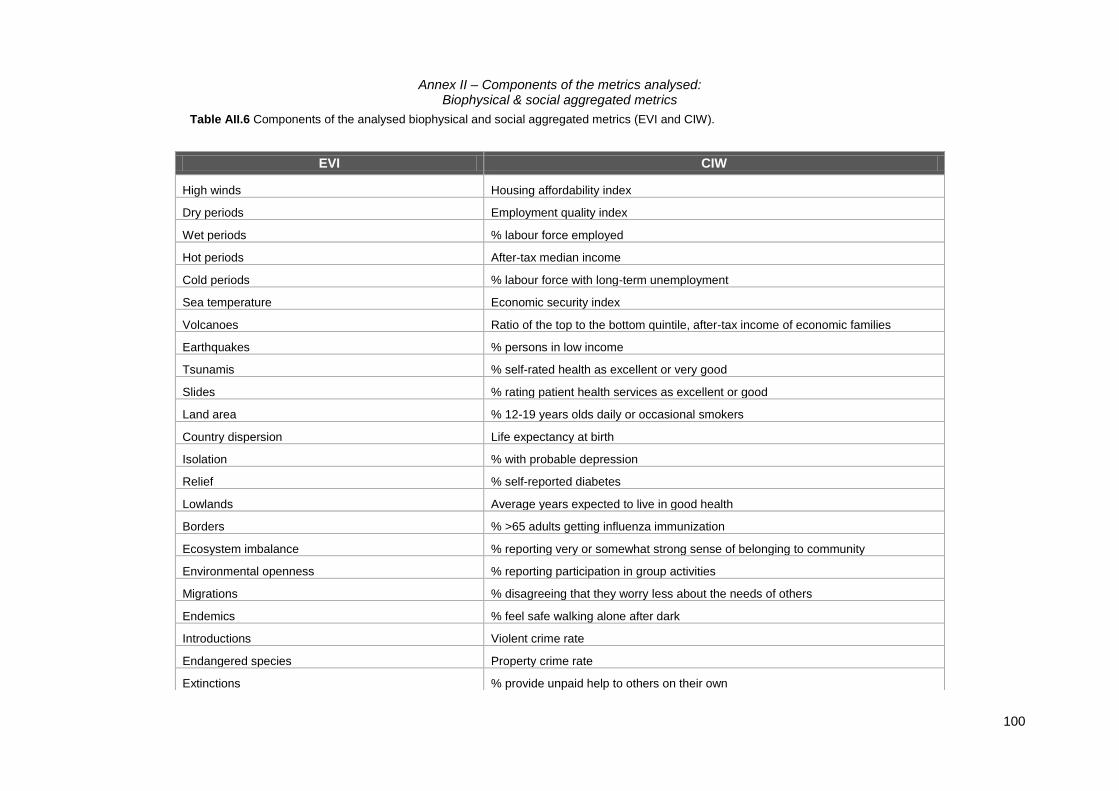
Annex II – Components of the metrics analysed: Biophysical & social aggregated metrics
100
Table AII.6 Components of the analysed biophysical and social aggregated metrics (EVI and CIW).
EVI CIW
High winds Housing affordability index
Dry periods Employment quality index
Wet periods % labour force employed
Hot periods After-tax median income
Cold periods % labour force with long-term unemployment
Sea temperature Economic security index
Volcanoes Ratio of the top to the bottom quintile, after-tax income of economic families
Earthquakes % persons in low income
Tsunamis % self-rated health as excellent or very good
Slides % rating patient health services as excellent or good
Land area % 12-19 years olds daily or occasional smokers
Country dispersion Life expectancy at birth
Isolation % with probable depression
Relief % self-reported diabetes
Lowlands Average years expected to live in good health
Borders % >65 adults getting influenza immunization
Ecosystem imbalance % reporting very or somewhat strong sense of belonging to community
Environmental openness % reporting participation in group activities
Migrations % disagreeing that they worry less about the needs of others
Endemics % feel safe walking alone after dark
Introductions Violent crime rate
Endangered species Property crime rate
Extinctions % provide unpaid help to others on their own

Annex II – Components of the metrics analysed: Biophysical & social aggregated metrics
101
Table AII.7 Components of the analysed biophysical and social aggregated metrics (EVI and CIW – continuation).
EVI CIW
Vegetation cover % with 6 or more close friends
Loss of cover % 20-64 adults working > 50h/week
Habitat fragmentation % 20-64 adults reporting high levels of time pressure
Degradation % 3-5 children daily read with parents
Terrestrial reserves % 6-9 children participating in organized activities
Marine reserves % 12-17 children spending >2h/day on TV or videogames
Intensive farming % >65 adults reporting volunteering activities
Fertilisers % >65 adults engaged in active leisure
Pesticides % 20-64 adults providing unpaid care to seniors
Biotechnology Average % time spent in social leisure activities
Productivity overfishing Average % time spent in arts and culture activities
Fishing effort Average hours spent in volunteering for cultural and recreation organizations
Renewable water Average monthly frequency of physical activity
Sulphur dioxide emissions Average attendance per performance at all attending performing arts performances
Waste production Average visits per site to all national parks and national historic sites
Waste treatment Average nights away/trip on vacation >80km of home
Industry Expenditures on culture and recreation as % total household expend
Spills % voter turnout at federal elections
Mining % not interested in politics at all
Sanitation % strongly agree it is every citizen's duty to vote in federal elections

Annex II – Components of the metrics analysed: Biophysical & social aggregated metrics
102
Table AII.8 Components of the analysed biophysical and social aggregated metrics (EVI and CIW – continuation).
EVI CIW
Vehicles % reporting they are very satisfied with the way democracy works in Canada
Population % reporting that policies of the federal government have made them better off
Population growth Ratio of registered to eligible voters
Tourists % women in parliament
Coastal settlements Net official development aid as a % gross national income
Environmental agreements Ratio of childcare spaces to children aged 0 - 5
Conflicts % children doing well on 5 development domains at age 5
Ratio of students to educators in public schools
Average of 5 social and emotional competence scores for 12 - 13 children
Basic knowledge and skills index for 13 - 15 children
% PISA scores explained by socio-economic background
% 20-24 adults in population completing high school
% 25-64 adults with a university degree
Ground level ozone
Absolute GHG emissions
Energy production
Water yield in southern Canada
Viable non-renewable energy reserves index
Viable metal reserves index
Canadian living planet index
Marine trophic index
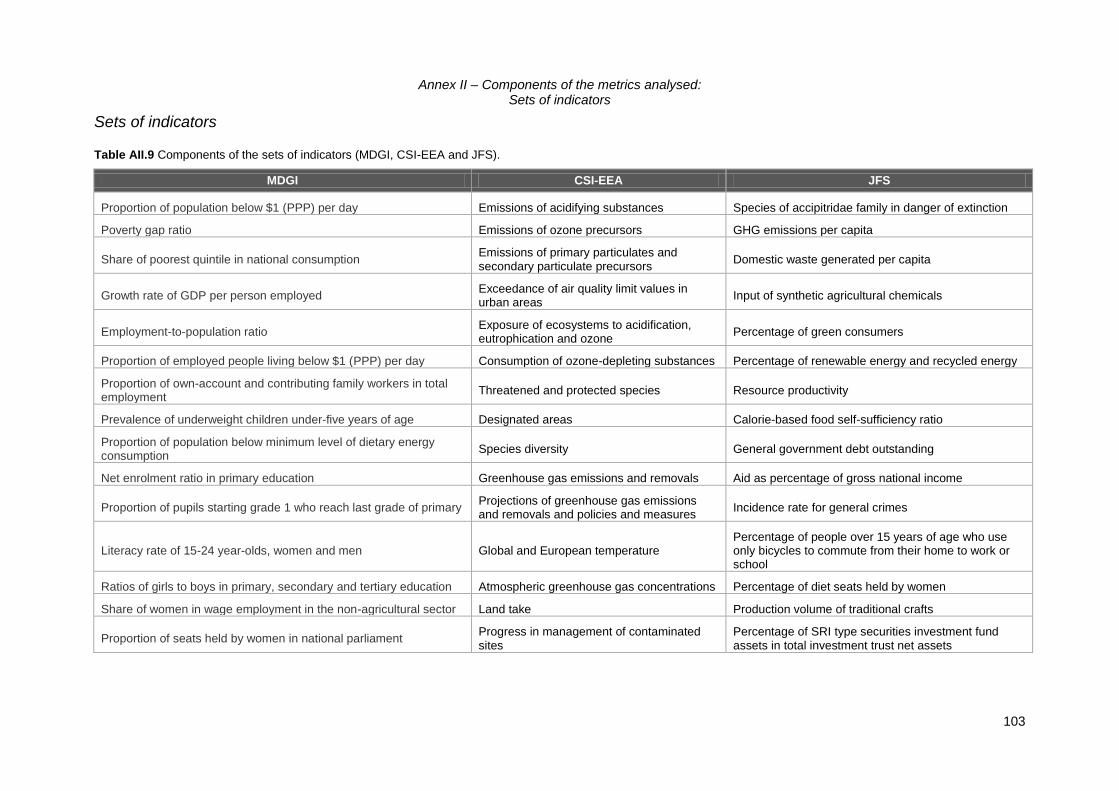
Annex II – Components of the metrics analysed: Sets of indicators
103
Sets of indicators
Table AII.9 Components of the sets of indicators (MDGI, CSI-EEA and JFS).
MDGI CSI-EEA JFS
Proportion of population below $1 (PPP) per day Emissions of acidifying substances Species of accipitridae family in danger of extinction
Poverty gap ratio Emissions of ozone precursors GHG emissions per capita
Share of poorest quintile in national consumption Emissions of primary particulates and secondary particulate precursors
Domestic waste generated per capita
Growth rate of GDP per person employed Exceedance of air quality limit values in urban areas
Input of synthetic agricultural chemicals
Employment-to-population ratio Exposure of ecosystems to acidification, eutrophication and ozone
Percentage of green consumers
Proportion of employed people living below $1 (PPP) per day Consumption of ozone-depleting substances Percentage of renewable energy and recycled energy
Proportion of own-account and contributing family workers in total employment
Threatened and protected species Resource productivity
Prevalence of underweight children under-five years of age Designated areas Calorie-based food self-sufficiency ratio
Proportion of population below minimum level of dietary energy consumption
Species diversity General government debt outstanding
Net enrolment ratio in primary education Greenhouse gas emissions and removals Aid as percentage of gross national income
Proportion of pupils starting grade 1 who reach last grade of primary Projections of greenhouse gas emissions and removals and policies and measures
Incidence rate for general crimes
Literacy rate of 15-24 year-olds, women and men Global and European temperature Percentage of people over 15 years of age who use only bicycles to commute from their home to work or school
Ratios of girls to boys in primary, secondary and tertiary education Atmospheric greenhouse gas concentrations Percentage of diet seats held by women
Share of women in wage employment in the non-agricultural sector Land take Production volume of traditional crafts
Proportion of seats held by women in national parliament Progress in management of contaminated sites
Percentage of SRI type securities investment fund assets in total investment trust net assets
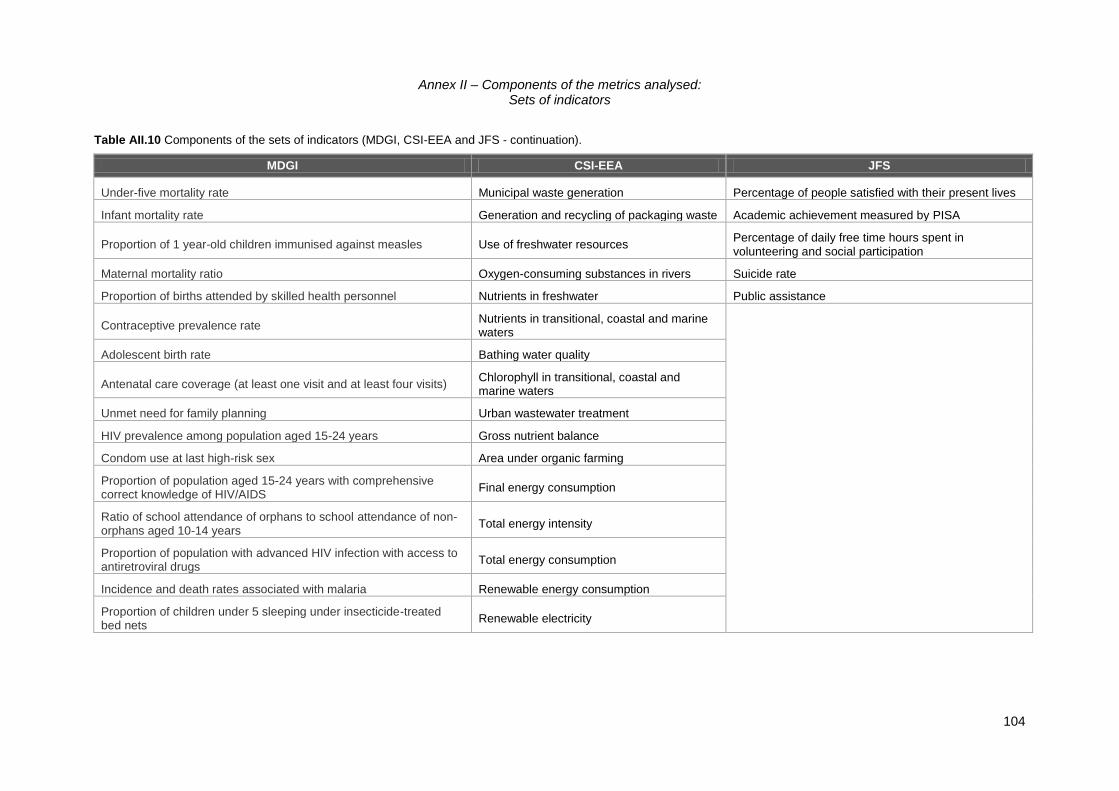
Annex II – Components of the metrics analysed: Sets of indicators
104
Table AII.10 Components of the sets of indicators (MDGI, CSI-EEA and JFS - continuation).
MDGI CSI-EEA JFS
Under-five mortality rate Municipal waste generation Percentage of people satisfied with their present lives
Infant mortality rate Generation and recycling of packaging waste Academic achievement measured by PISA
Proportion of 1 year-old children immunised against measles Use of freshwater resources Percentage of daily free time hours spent in volunteering and social participation
Maternal mortality ratio Oxygen-consuming substances in rivers Suicide rate
Proportion of births attended by skilled health personnel Nutrients in freshwater Public assistance
Contraceptive prevalence rate Nutrients in transitional, coastal and marine waters
Adolescent birth rate Bathing water quality
Antenatal care coverage (at least one visit and at least four visits) Chlorophyll in transitional, coastal and marine waters
Unmet need for family planning Urban wastewater treatment
HIV prevalence among population aged 15-24 years Gross nutrient balance
Condom use at last high-risk sex Area under organic farming
Proportion of population aged 15-24 years with comprehensive correct knowledge of HIV/AIDS
Final energy consumption
Ratio of school attendance of orphans to school attendance of non-orphans aged 10-14 years
Total energy intensity
Proportion of population with advanced HIV infection with access to antiretroviral drugs
Total energy consumption
Incidence and death rates associated with malaria Renewable energy consumption
Proportion of children under 5 sleeping under insecticide-treated bed nets
Renewable electricity
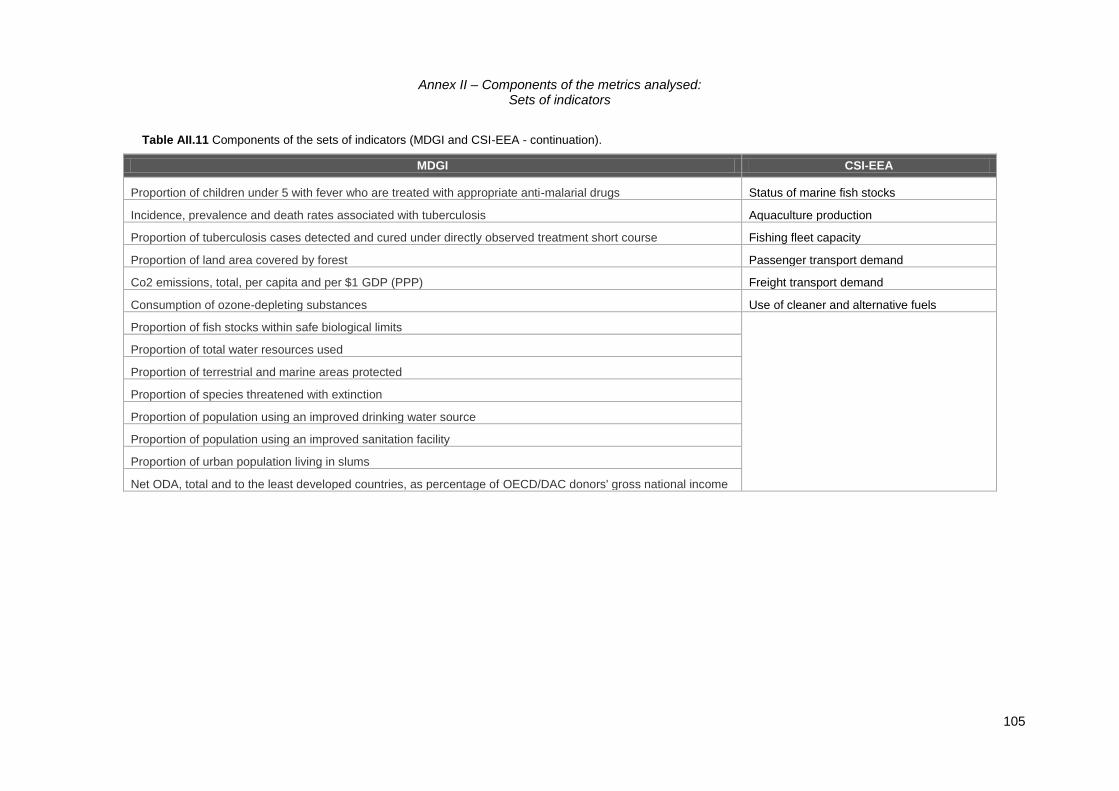
Annex II – Components of the metrics analysed: Sets of indicators
105
Table AII.11 Components of the sets of indicators (MDGI and CSI-EEA - continuation).
MDGI CSI-EEA
Proportion of children under 5 with fever who are treated with appropriate anti-malarial drugs Status of marine fish stocks
Incidence, prevalence and death rates associated with tuberculosis Aquaculture production
Proportion of tuberculosis cases detected and cured under directly observed treatment short course Fishing fleet capacity
Proportion of land area covered by forest Passenger transport demand
Co2 emissions, total, per capita and per $1 GDP (PPP) Freight transport demand
Consumption of ozone-depleting substances Use of cleaner and alternative fuels
Proportion of fish stocks within safe biological limits
Proportion of total water resources used
Proportion of terrestrial and marine areas protected
Proportion of species threatened with extinction
Proportion of population using an improved drinking water source
Proportion of population using an improved sanitation facility
Proportion of urban population living in slums
Net ODA, total and to the least developed countries, as percentage of OECD/DAC donors' gross national income

Annex II – Components of the metrics analysed: Sets of indicators
106
Table AII.12 Components of the sets of indicators (MDGI - continuation).
MDGI
Proportion of total bilateral, sector-allocable ODA of OECD/DAC donors to basic social services (basic education, primary health care, nutrition, safe water and sanitation)
Proportion of bilateral official development assistance of OECD/DAC donors that is untied
ODA received in landlocked developing countries as a proportion of their gross national incomes
ODA received in small island developing States as a proportion of their gross national incomes
Proportion of total developed country imports (by value and excluding arms) from developing countries and least developed countries, admitted free of duty
Average tariffs imposed by developed countries on agricultural products and textiles and clothing from developing countries
Agricultural support estimate for OECD countries as a percentage of their gross domestic product
Proportion of ODA provided to help build trade capacity
Total number of countries that have reached their HIPC decision points and number that have reached their HIPC completion points (cumulative)
Debt relief committed under HIPC and MDRI Initiatives
Debt service as a percentage of exports of goods and services
Proportion of population with access to affordable essential drugs on a sustainable basis
Fixed telephone lines per 100 inhabitants
Mobile cellular subscriptions per 100 inhabitants
Internet users per 100 inhabitants
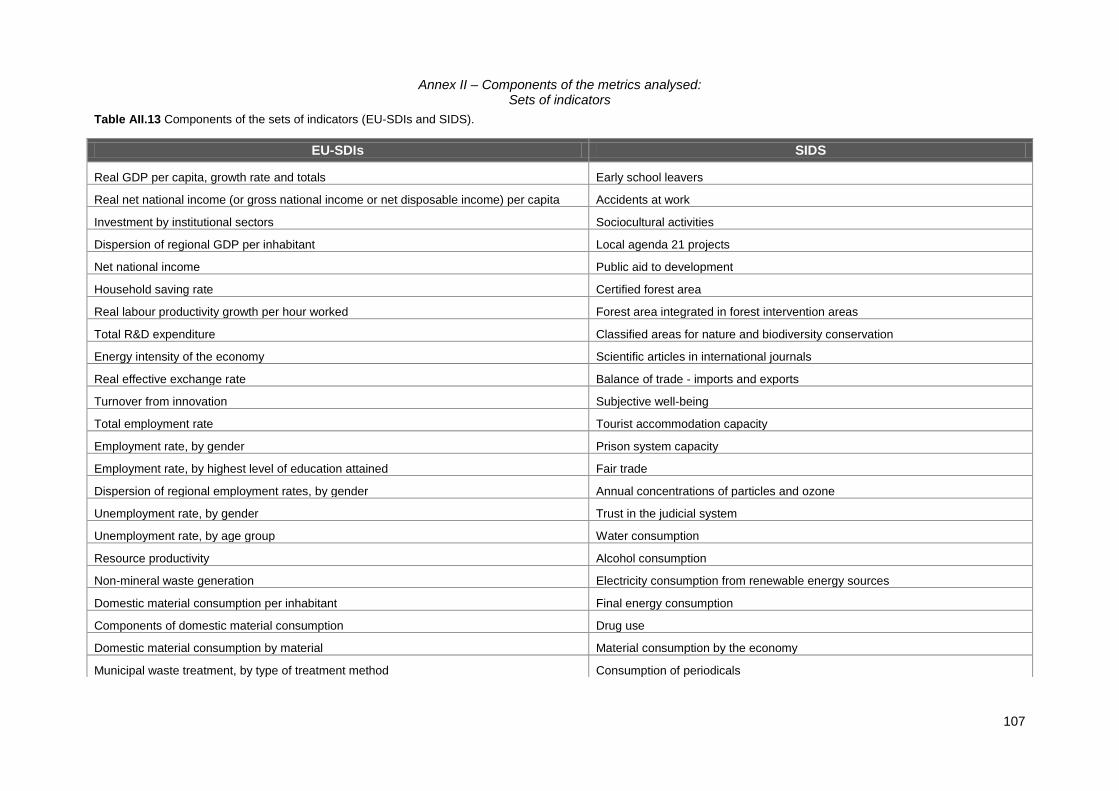
Annex II – Components of the metrics analysed: Sets of indicators
107
Table AII.13 Components of the sets of indicators (EU-SDIs and SIDS).
EU-SDIs SIDS
Real GDP per capita, growth rate and totals Early school leavers
Real net national income (or gross national income or net disposable income) per capita Accidents at work
Investment by institutional sectors Sociocultural activities
Dispersion of regional GDP per inhabitant Local agenda 21 projects
Net national income Public aid to development
Household saving rate Certified forest area
Real labour productivity growth per hour worked Forest area integrated in forest intervention areas
Total R&D expenditure Classified areas for nature and biodiversity conservation
Energy intensity of the economy Scientific articles in international journals
Real effective exchange rate Balance of trade - imports and exports
Turnover from innovation Subjective well-being
Total employment rate Tourist accommodation capacity
Employment rate, by gender Prison system capacity
Employment rate, by highest level of education attained Fair trade
Dispersion of regional employment rates, by gender Annual concentrations of particles and ozone
Unemployment rate, by gender Trust in the judicial system
Unemployment rate, by age group Water consumption
Resource productivity Alcohol consumption
Non-mineral waste generation Electricity consumption from renewable energy sources
Domestic material consumption per inhabitant Final energy consumption
Components of domestic material consumption Drug use
Domestic material consumption by material Material consumption by the economy
Municipal waste treatment, by type of treatment method Consumption of periodicals

Annex II – Components of the metrics analysed: Sets of indicators
108
Table AII.14 Components of the sets of indicators (EU-SDIs and SIDS - continuation).
EU-SDIs SIDS
Generation of hazardous waste, by economic activity Consumption of ozone-depleting substances
Emissions of sulphur oxides, by source sector Tobacco use
Emissions of nitrogen oxides (NOx) by source sector Religious beliefs
Emissions of non-methane volatile organic compounds (NMVOC) by source sector Criminality
Emissions of ammonia (NH3) by source sector Budget deficit
Electricity consumption of households Business demography
Final energy consumption by sector Discharges of oil and other harmful substances
Consumption of certain foodstuffs Discharges of fish
Motorisation rate Income distribution inequality
Organisations and sites with a registered environmental management system Household income and expenditures
Ecolabel licences I&D expenditures
Area under agro-environmental commitment Public expenditures
Area under organic farming Food diet
Livestock density index Differentiation of income by gender
Average number of persons per household Fleet size
Final consumption expenditure of households, by consumption purpose Graduates in science and technology
Population at risk of poverty or social exclusion Water availability
Persistent-at-risk-of-poverty rate Public debt
Persons at-risk-of-poverty after social transfers Notifiable diseases
Severely materially deprived persons Eco-efficiency of economic sectors of activity
Relative median at-risk-of-poverty gap Water use efficiency
Inequality of income distribution Judicial system efficiency

Annex II – Components of the metrics analysed: Sets of indicators
109
Table AII.15 Components of the sets of indicators (EU-SDIs and SIDS - continuation).
EU-SDIs SIDS
Persons living in households with very low work intensity Emissions of GHG
In work at-risk-of-poverty rate Emissions of acidifying and eutrophying substances
Total long-term unemployment rate Emissions of ozone depleting substances
Gender pay gap in unadjusted form Population aging
Early leavers from education and training Threatened fauna and flora species
At-risk-of-poverty rate, by highest level of education attained Life expectancy at birth
Persons with low educational attainment, by age group Healthy life expectancy
Life-long learning Surface water quality
Low reading literacy performance of pupils Groundwater quality
Individuals’ level of computer skills Structure of the road network and fragmentation of the territory
Individuals’ level of internet skills Evolution of the coast line
Employment rate of older workers Population evolution
Life expectancy at age 65, by gender Fertility
Total fertility rate Agricultural fertilizers
Crude rate of net migration plus adjustment Environmental management and social responsibility
Aggregate replacement ratio Waste management
At-risk-of-poverty rate of elderly people Electronic government
General government debt Average age of vehicles in circulation
Average exit age from the labour market, by gender Imports from less developed and developing countries
Old-age dependency ratio Forest fires
Projected old age dependency ratio Common birds index
Population structure or median age of population Human development index
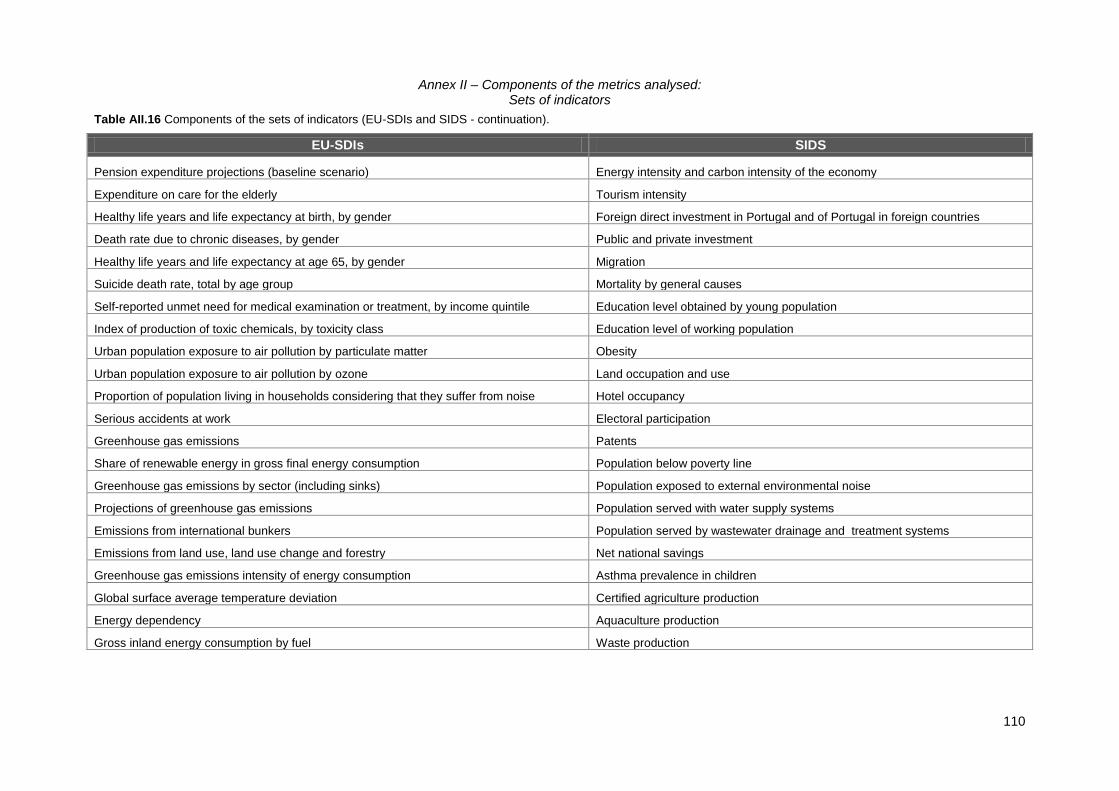
Annex II – Components of the metrics analysed: Sets of indicators
110
Table AII.16 Components of the sets of indicators (EU-SDIs and SIDS - continuation).
EU-SDIs SIDS
Pension expenditure projections (baseline scenario) Energy intensity and carbon intensity of the economy
Expenditure on care for the elderly Tourism intensity
Healthy life years and life expectancy at birth, by gender Foreign direct investment in Portugal and of Portugal in foreign countries
Death rate due to chronic diseases, by gender Public and private investment
Healthy life years and life expectancy at age 65, by gender Migration
Suicide death rate, total by age group Mortality by general causes
Self-reported unmet need for medical examination or treatment, by income quintile Education level obtained by young population
Index of production of toxic chemicals, by toxicity class Education level of working population
Urban population exposure to air pollution by particulate matter Obesity
Urban population exposure to air pollution by ozone Land occupation and use
Proportion of population living in households considering that they suffer from noise Hotel occupancy
Serious accidents at work Electoral participation
Greenhouse gas emissions Patents
Share of renewable energy in gross final energy consumption Population below poverty line
Greenhouse gas emissions by sector (including sinks) Population exposed to external environmental noise
Projections of greenhouse gas emissions Population served with water supply systems
Emissions from international bunkers Population served by wastewater drainage and treatment systems
Emissions from land use, land use change and forestry Net national savings
Greenhouse gas emissions intensity of energy consumption Asthma prevalence in children
Global surface average temperature deviation Certified agriculture production
Energy dependency Aquaculture production
Gross inland energy consumption by fuel Waste production

Annex II – Components of the metrics analysed: Sets of indicators
111
Table AII.17 Components of the sets of indicators (EU-SDIs and SIDS - continuation).
EU-SDIs SIDS
Electricity generated from renewable sources Primary energy production and consumption
Share of renewable energy in fuel consumption of transport Work productivity
Combined heat and power generation Gross national product
Implicit tax rate on energy Plant protection products
Energy consumption of transport relative to GDP Health professionals
Modal split of passenger transport Water quality in bathing areas
Modal split of freight transport Water quality for areas of protection of aquatic species with economic interest
Volume of freight transport relative to GDP Water quality for human consumption
Volume of passenger transport relative to GDP Air quality
Energy consumption by transport mode Recycling and recovery of municipal waste
Investment in transport infrastructure by mode Cultural resources
Greenhouse gas emissions by transport mode Net of social services and equipment
People killed in road accidents Modal split of transport of passengers and goods
Emissions of nitrogen oxides from transport Natural risks
Emissions of particulate matter from transport Technological risks
Average CO2 emissions per km from new passenger cars Food security
Annual harmonised index of consumer prices for transport Road accidents
Common bird index Land desertification
Fish catches taken from stocks outside safe biological limits Fish stocks outside the biological safety limits
Sufficiency of sites designated under the EU Habitats and Birds directive Illiteracy rate
Deadwood on forest land Unemployment rate
Surface and groundwater abstraction as a share of available resources Employment rate

Annex II – Components of the metrics analysed: Sets of indicators
112
Table AII.18 Components of the sets of indicators (EU-SDIs and SIDS - continuation).
EU-SDIs SIDS
Population connected to urban waste water treatment with at least secondary treatment Inflation rate
Biochemical oxygen demand in rivers Infant mortality rate
Fishing fleet, total engine power Air temperature
Increase in certain categories of land cover* Use of information and communication technologies
Forest increment and fellings Gross added value by sectors
Forest trees damaged by defoliation Protected areas surveillance
Percentage of total land area at risk of soil erosion Transport volume of passengers and commodities
Official Development Assistance as share of gross national income
EU imports from developing countries, by income group
EU imports from least-developed countries by group of products
Aggregated measurement of support for agriculture
Financing for developing countries, by type
Foreign direct investment in developing countries, by income group
Official development assistance, by income group
Untied official development assistance
Bilateral official development assistance dedicated to social infrastructure services
Bilateral official development assistance dedicated to debt
CO2 emissions per inhabitant in the EU and in developing countries
Bilateral official development assistance dedicated to water supply and sanitation
Population living on less than 1USD a day
Official Development Assistance per capita in donor and recipient countries
Population with sustainable access to an improved water source
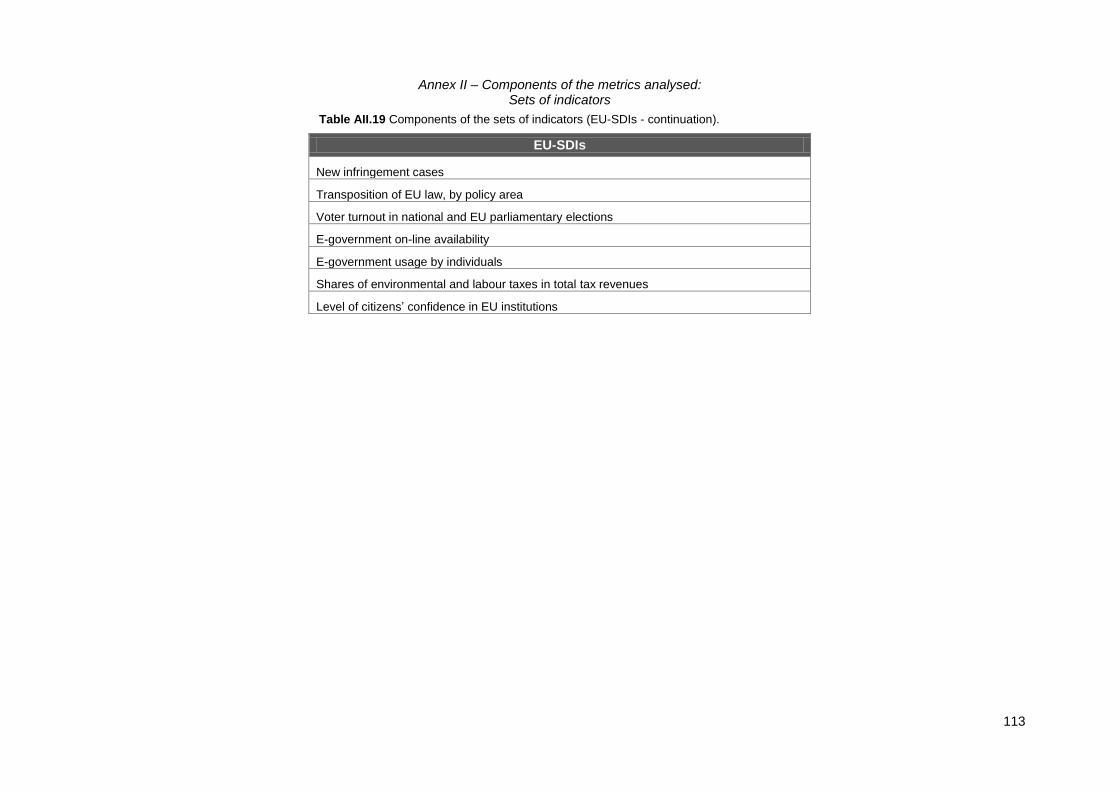
Annex II – Components of the metrics analysed: Sets of indicators
113
Table AII.19 Components of the sets of indicators (EU-SDIs - continuation).
EU-SDIs
New infringement cases
Transposition of EU law, by policy area
Voter turnout in national and EU parliamentary elections
E-government on-line availability
E-government usage by individuals
Shares of environmental and labour taxes in total tax revenues
Level of citizens’ confidence in EU institutions

Annex III – Classification of the metrics analysed and its justification: Economic aggregated metrics
114
AIII. Annex III – Classification of the metrics analysed and its justification
Economic aggregated metrics
Table AIII.1 Comparison between degrowth policy goals and economic aggregated metrics (GDP and ISEW).
Policy goals GDP Justification ISEW Justification
Go
al 1
Create and protect shared public spaces N Public investment N Net capital investment
Encourage community-based sustainability initiatives and 'voluntary simplicity'
N N
Decentralize and deepen democratic institutions
N N
Fight discrimination N N
Fight crime N IT Cost of crime
Promote social cohesion and solidarity N N
Reduce working-time N N
Minify unemployment N N
Improve local environment in deprived areas
N N
Go
al 2
Reduce geographical labour mobility N IP Cost of commuting (home-work/school-home)
Protect and invest in culture, sports and recreation
DP Public and private investment (in buildings, show scripts, literary works)
DP Net capital investment
Investment in health and education DP Public and private investment (in buildings)
DP Public expenditure on health and education

Annex III – Classification of the metrics analysed and its justification: Economic aggregated metrics
115
Table AIII.2 Comparison between degrowth policy goals and economic aggregated metrics (GDP and ISEW - continuation).
Policy goals GDP Justification ISEW Justification
Go
al 3
Identify clear resource and emission caps and establish reduction targets
N IT Costs of GHG emissions, ozone layer damage
Reduce waste emissions N IT Costs of water and air pollution, cost of soil loss, cost of wetland loss, cost of ozone layer damage
Reduce resource extraction N IT
Cost of non-renewable energy resources, cost of forest loss, cost of soil loss, cost of marine and freshwater fisheries overexploitation
Go
al 4
Decrease material use N N
Decrease energy use N N
Promote environmentally beneficial sectors
N N
Incentive the use of public transportation or soft modes of transportation
DP Public investment in infra-structures, consumption of tickets
DP Net capital investment
Investment in better selected technical innovations
N N
Investment in environmental and technological research
IP Consumption of services of scientific I&D IP Net capital investment
Reduce the 'delocalization of the economy' (transport of goods and men on the planet)
IP Imports vs. exports N
Go
al 5
Reduce non-essential consumption N N
Promote a more conscientious consumption
N N

Annex III – Classification of the metrics analysed and its justification: Economic aggregated metrics
116
Table AIII.3 Comparison between degrowth policy goals and economic aggregated metrics (GDP and ISEW - continuation).
Policy goals GDP Justification ISEW Justification
Go
al 6
Promote an environmentally friendly development
N N
Investment in protection of 'carbon sinks' and biodiversity
N N
Increase material and energy use N N
Promote benefit-sharing between north and south
N N
Go
al 7
Avoid monopolies/promote competition N N
Increase value of other types of capital N IP Services from household labour, loss of leisure time
Fight poverty N N
Increase public control over the money supply
N N
Reduce investment in inadequate infrastructures
N N
Reform corporation charters to create more horizontality
N N
Reform the regulation of national and international financial markets
N N
Revise income tax structures N N

Annex III – Classification of the metrics analysed and its justification: Economic aggregated metrics
117
Table AIII.4 Comparison between degrowth policy goals and economic aggregated metrics (ANS and EDP).
Policy goals ANS Justification EDP Justification
Go
al 1
Create and protect shared public spaces
N N
Encourage community-based sustainability initiatives and 'voluntary simplicity'
N N
Decentralize and deepen democratic institutions
N N
Fight discrimination N N
Fight crime N N
Promote social cohesion and solidarity
N N
Reduce working-time N N
Minify unemployment N N
Improve local environment in deprived areas
N N Cost of environmental restoration, protection and enhancement
Go
al 2
Reduce geographical labour mobility
N N
Protect and invest in culture, sports and recreation
N DP GDP
Investment in health and education
DP Public expenditures on education DP GDP
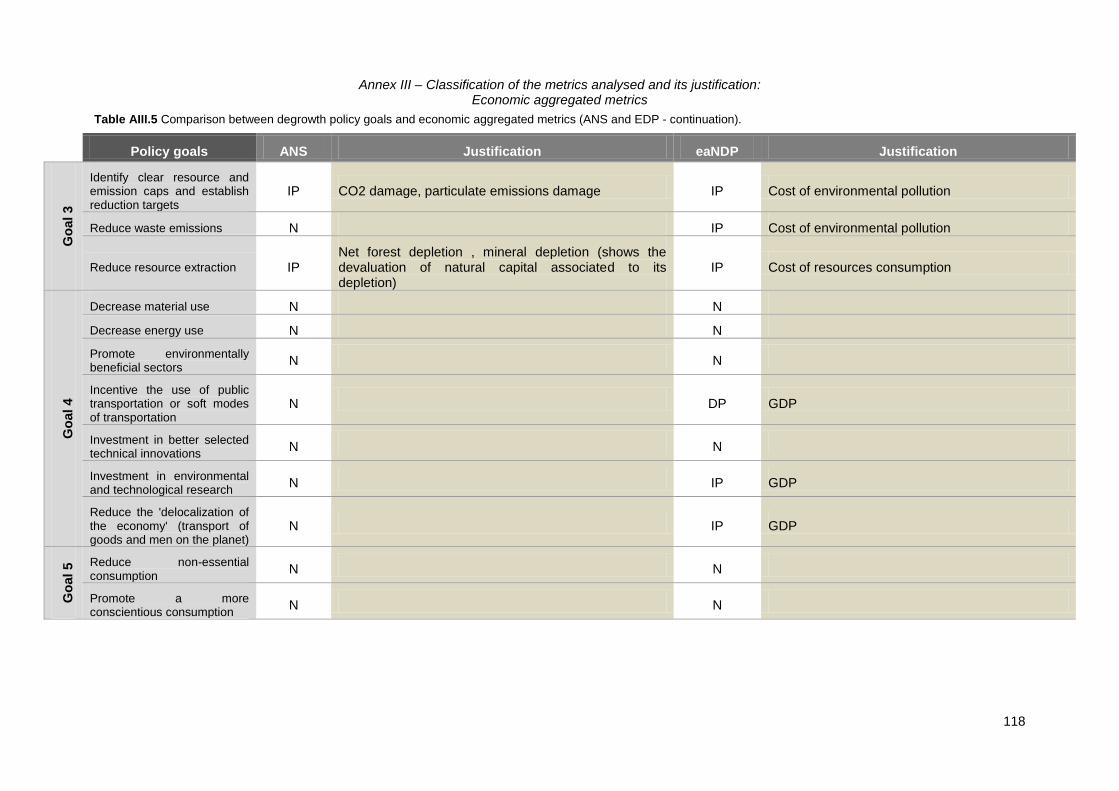
Annex III – Classification of the metrics analysed and its justification: Economic aggregated metrics
118
Table AIII.5 Comparison between degrowth policy goals and economic aggregated metrics (ANS and EDP - continuation).
Policy goals ANS Justification eaNDP Justification
Go
al 3
Identify clear resource and emission caps and establish reduction targets
IP CO2 damage, particulate emissions damage IP Cost of environmental pollution
Reduce waste emissions N IP Cost of environmental pollution
Reduce resource extraction IP Net forest depletion , mineral depletion (shows the devaluation of natural capital associated to its depletion)
IP Cost of resources consumption
Go
al 4
Decrease material use N N
Decrease energy use N N
Promote environmentally beneficial sectors
N N
Incentive the use of public transportation or soft modes of transportation
N DP GDP
Investment in better selected technical innovations
N N
Investment in environmental and technological research
N IP GDP
Reduce the 'delocalization of the economy' (transport of goods and men on the planet)
N IP GDP
Go
al 5
Reduce non-essential consumption
N N
Promote a more conscientious consumption
N N

Annex III – Classification of the metrics analysed and its justification: Economic aggregated metrics
119
Table AIII.6 Comparison between degrowth policy goals and economic aggregated metrics (ANS and EDP - continuation).
Policy goals ANS Justification EDP Justification
Go
al 6
Promote an environmentally friendly development
N N
Investment in protection of 'carbon sinks' and biodiversity
N IT Cost of environmental restoration, protection and enhancement
Increase material and energy use
N N
Promote benefit-sharing between north and south
N N
Go
al 7
Avoid monopolies/promote competition
N N
Increase value of other types of capital
N N
Fight poverty N N
Increase public control over the money supply
N N
Reduce investment in inadequate infrastructures
N N
Reform corporation charters to create more horizontality
N N
Reform the regulation of national and international financial markets
N N
Revise income tax structures N N

Annex III – Classification of the metrics analysed and its justification: Economic aggregated metrics
120
Table AIII.7 Comparison between degrowth policy goals and economic aggregated metrics (eSNI).
Policy goals eSNI Justification
Go
al 1
Create and protect shared public spaces N
Encourage community-based sustainability initiatives and 'voluntary simplicity' N
Decentralize and deepen democratic institutions N
Fight discrimination N
Fight crime N
Promote social cohesion and solidarity N
Reduce working-time N
Minify unemployment N
Improve local environment in deprived areas N
Go
al 2
Reduce geographical labour mobility N
Protect and invest in culture, sports and recreation DP GDP
Investment in health and education DP GDP
Go
al 3
Identify clear resource and emission caps and establish reduction targets DT Emissions of acidifying substances, GHG and ODS in air
Reduce waste emissions DT Emission of toxic substances and nutrients in soil and water
Reduce resource extraction DT Use of non-renewable resources, use of water, use of space.
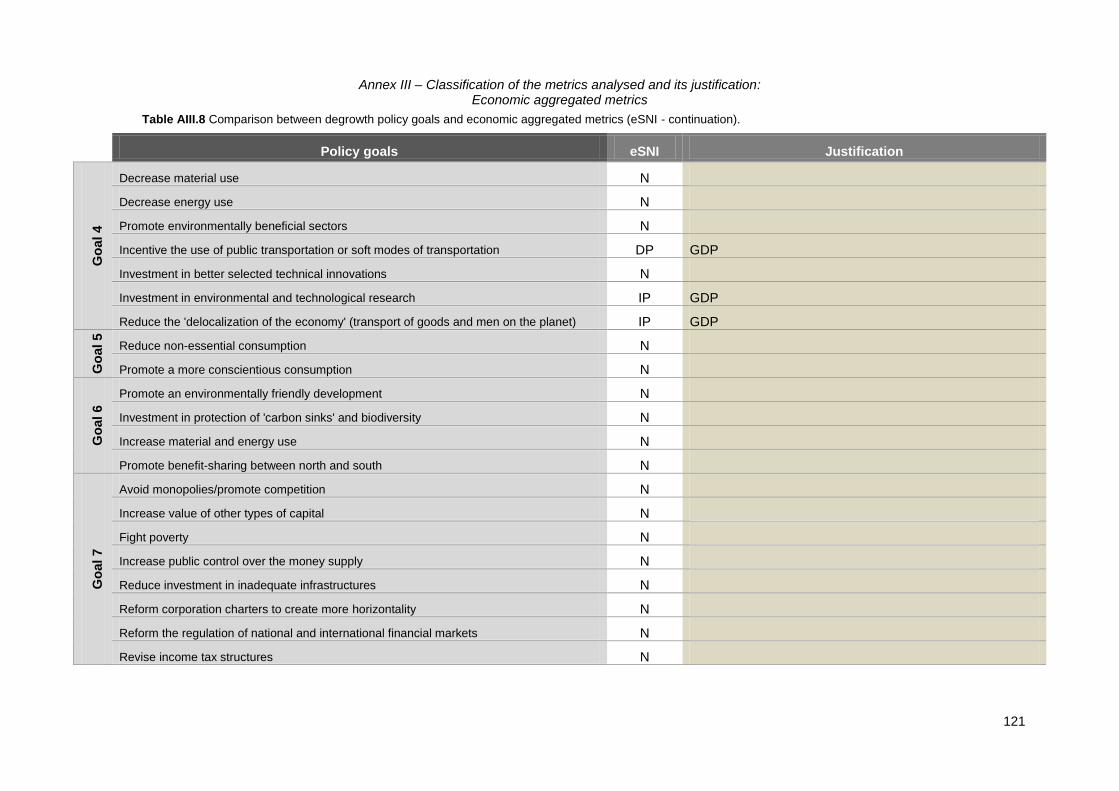
Annex III – Classification of the metrics analysed and its justification: Economic aggregated metrics
121
Table AIII.8 Comparison between degrowth policy goals and economic aggregated metrics (eSNI - continuation).
Policy goals eSNI Justification
Go
al 4
Decrease material use N
Decrease energy use N
Promote environmentally beneficial sectors N
Incentive the use of public transportation or soft modes of transportation DP GDP
Investment in better selected technical innovations N
Investment in environmental and technological research IP GDP
Reduce the 'delocalization of the economy' (transport of goods and men on the planet) IP GDP
Go
al 5
Reduce non-essential consumption N
Promote a more conscientious consumption N
Go
al 6
Promote an environmentally friendly development N
Investment in protection of 'carbon sinks' and biodiversity N
Increase material and energy use N
Promote benefit-sharing between north and south N
Go
al 7
Avoid monopolies/promote competition N
Increase value of other types of capital N
Fight poverty N
Increase public control over the money supply N
Reduce investment in inadequate infrastructures N
Reform corporation charters to create more horizontality N
Reform the regulation of national and international financial markets N
Revise income tax structures N

Annex III – Classification of the metrics analysed and its justification: Biophysical & social aggregated metrics
122
Biophysical & social aggregated metrics
Table AIII.9 Comparison between degrowth policy goals and biophysical & social aggregated metrics (EPI and LPI).
Policy goals EPI Justification LPI Justification
Go
al 1
Create and protect shared public spaces
N N
Encourage community-based sustainability initiatives and 'voluntary simplicity'
N N
Decentralize and deepen democratic institutions
N N
Fight discrimination N N
Fight crime N N
Promote social cohesion and solidarity
N N
Reduce working-time N N
Minify unemployment N N
Improve local environment in deprived areas
N N
Go
al 2
Reduce geographical labour mobility
N N
Protect and invest in culture, sports and recreation
N N
Investment in health and education
IP Access to drinking water, access to sanitation, environmental burden disease
N

Annex III – Classification of the metrics analysed and its justification: Biophysical & social aggregated metrics
123
Table AIII.10 Comparison between degrowth policy goals and biophysical & social aggregated metrics (EPI and LPI - continuation).
Policy goals EPI Justification LPI Justification
Go
al 3
Identify clear resource and emission caps and establish reduction targets
DT GHG emissions, industry carbon intensity, electricity carbon intensity, urban particulates, SO2 emissions, ozone exceedance, NOx emissions, VOC emissions
N
Reduce waste emissions IP Water quality index, pesticide regulation N
Reduce resource extraction DP Agricultural water intensity, trawling intensity N
Go
al 4
Decrease material use N N
Decrease energy use N N
Promote environmentally beneficial sectors
N N
Incentive the use of public transportation or soft modes of transportation
N N
Investment in better selected technical innovations
N N
Investment in environmental and technological research
N N
Reduce the 'delocalization of the economy' (transport of goods and men on the planet)
N N
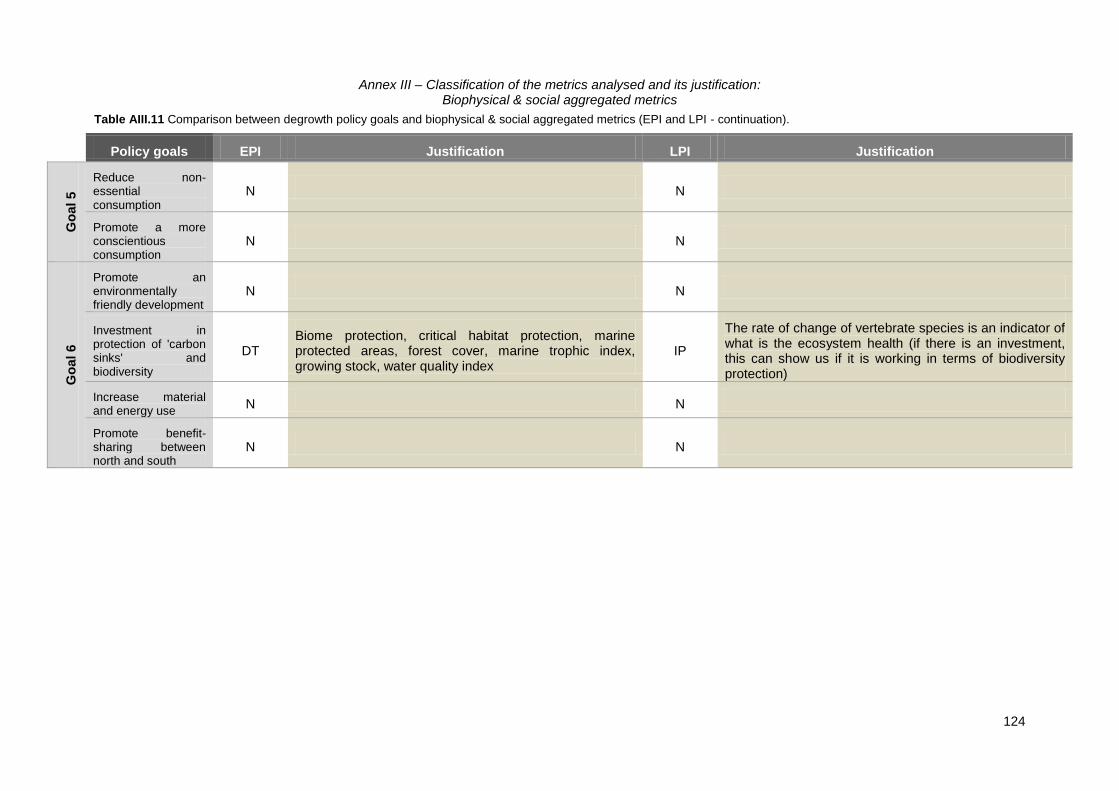
Annex III – Classification of the metrics analysed and its justification: Biophysical & social aggregated metrics
124
Table AIII.11 Comparison between degrowth policy goals and biophysical & social aggregated metrics (EPI and LPI - continuation).
Policy goals EPI Justification LPI Justification
Go
al 5
Reduce non-essential consumption
N N
Promote a more conscientious consumption
N N
Go
al 6
Promote an environmentally friendly development
N N
Investment in protection of 'carbon sinks' and biodiversity
DT Biome protection, critical habitat protection, marine protected areas, forest cover, marine trophic index, growing stock, water quality index
IP
The rate of change of vertebrate species is an indicator of what is the ecosystem health (if there is an investment, this can show us if it is working in terms of biodiversity protection)
Increase material and energy use
N N
Promote benefit-sharing between north and south
N N
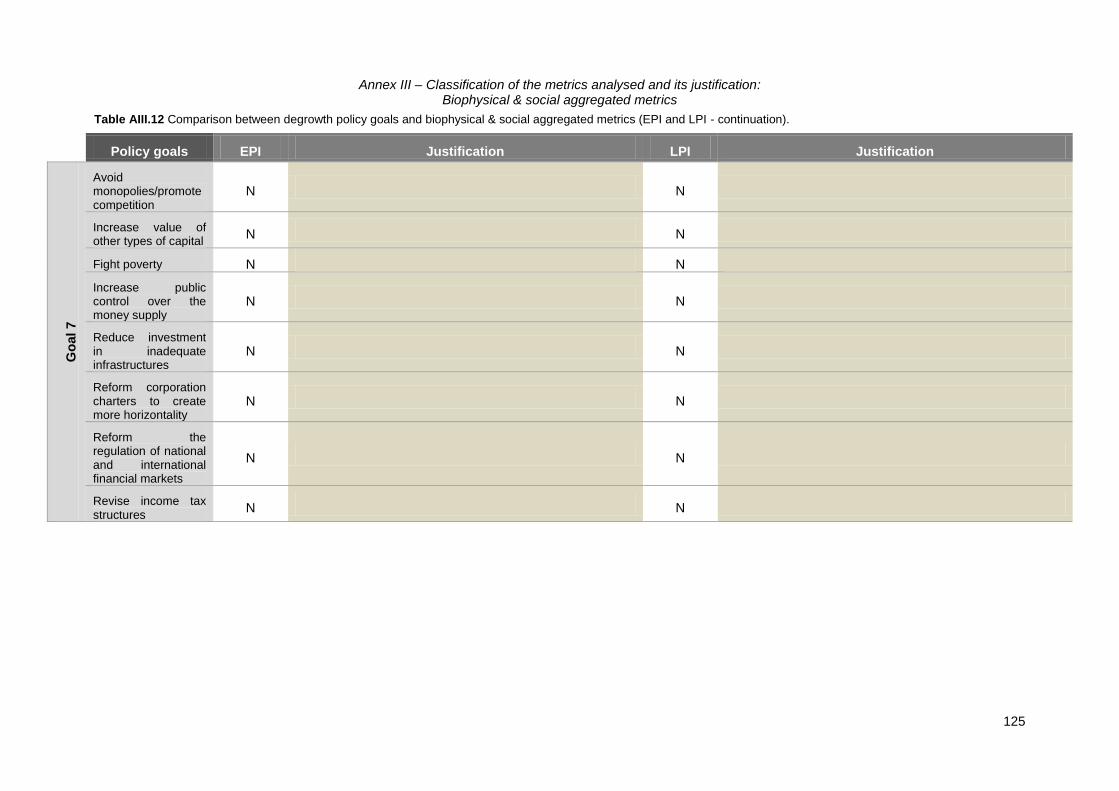
Annex III – Classification of the metrics analysed and its justification: Biophysical & social aggregated metrics
125
Table AIII.12 Comparison between degrowth policy goals and biophysical & social aggregated metrics (EPI and LPI - continuation).
Policy goals EPI Justification LPI Justification
Go
al 7
Avoid monopolies/promote competition
N N
Increase value of other types of capital
N N
Fight poverty N N
Increase public control over the money supply
N N
Reduce investment in inadequate infrastructures
N N
Reform corporation charters to create more horizontality
N N
Reform the regulation of national and international financial markets
N N
Revise income tax structures
N N

Annex III – Classification of the metrics analysed and its justification: Biophysical & social aggregated metrics
126
Table AIII.13 Comparison between degrowth policy goals and biophysical & social aggregated metrics (HANPP and EF).
Policy goals HANPP Justification EF Justification
Go
al 1
Create and protect shared public spaces
N N
Encourage community-based sustainability initiatives and 'voluntary simplicity'
N N
Decentralize and deepen democratic institutions
N N
Fight discrimination N N
Fight crime N N
Promote social cohesion and solidarity
N N
Reduce working-time N N
Minify unemployment
N N
Improve local environment in deprived areas
N N
Go
al 2
Reduce geographical labour mobility
N N
Protect and invest in culture, sports and recreation
N N
Investment in health and education
N N

Annex III – Classification of the metrics analysed and its justification: Biophysical & social aggregated metrics
127
Table AIII.14 Comparison between degrowth policy goals and biophysical & social aggregated metrics (HANPP and EF - continuation).
Policy goals HANPP Justification EF Justification
Go
al 3
Identify clear resource and emission caps and establish reduction targets
N DP Carbon footprint
Reduce waste emissions N N
Reduce resource extraction
IT (?) Effects of extraction/destruction of NPP for human uses N
Go
al 4
Decrease material use N N
Decrease energy use N N
Promote environmentally beneficial sectors
N N
Incentive the use of public transportation or soft modes of transportation
N N
Investment in better selected technical innovations
N N
Investment in environmental and technological research
N N
Reduce the 'delocalization of the economy' (transport of goods and men on the planet)
N N
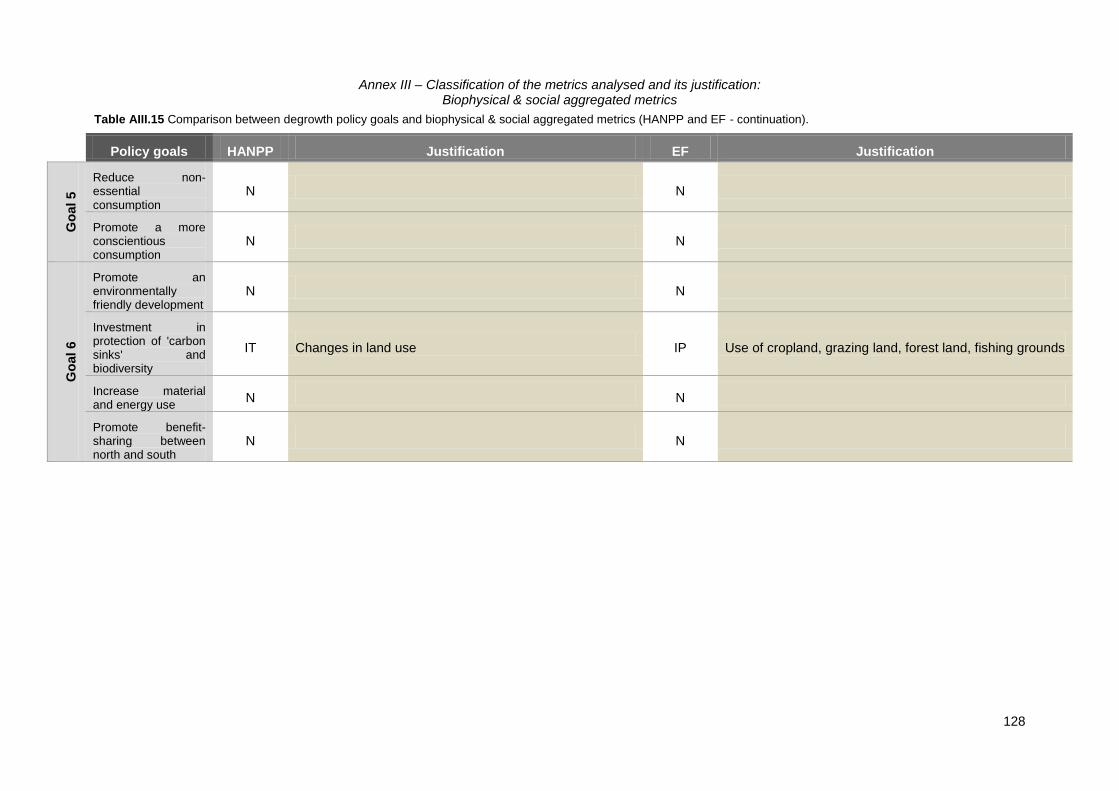
Annex III – Classification of the metrics analysed and its justification: Biophysical & social aggregated metrics
128
Table AIII.15 Comparison between degrowth policy goals and biophysical & social aggregated metrics (HANPP and EF - continuation).
Policy goals HANPP Justification EF Justification
Go
al 5
Reduce non-essential consumption
N N
Promote a more conscientious consumption
N N
Go
al 6
Promote an environmentally friendly development
N N
Investment in protection of 'carbon sinks' and biodiversity
IT Changes in land use IP Use of cropland, grazing land, forest land, fishing grounds
Increase material and energy use
N N
Promote benefit-sharing between north and south
N N
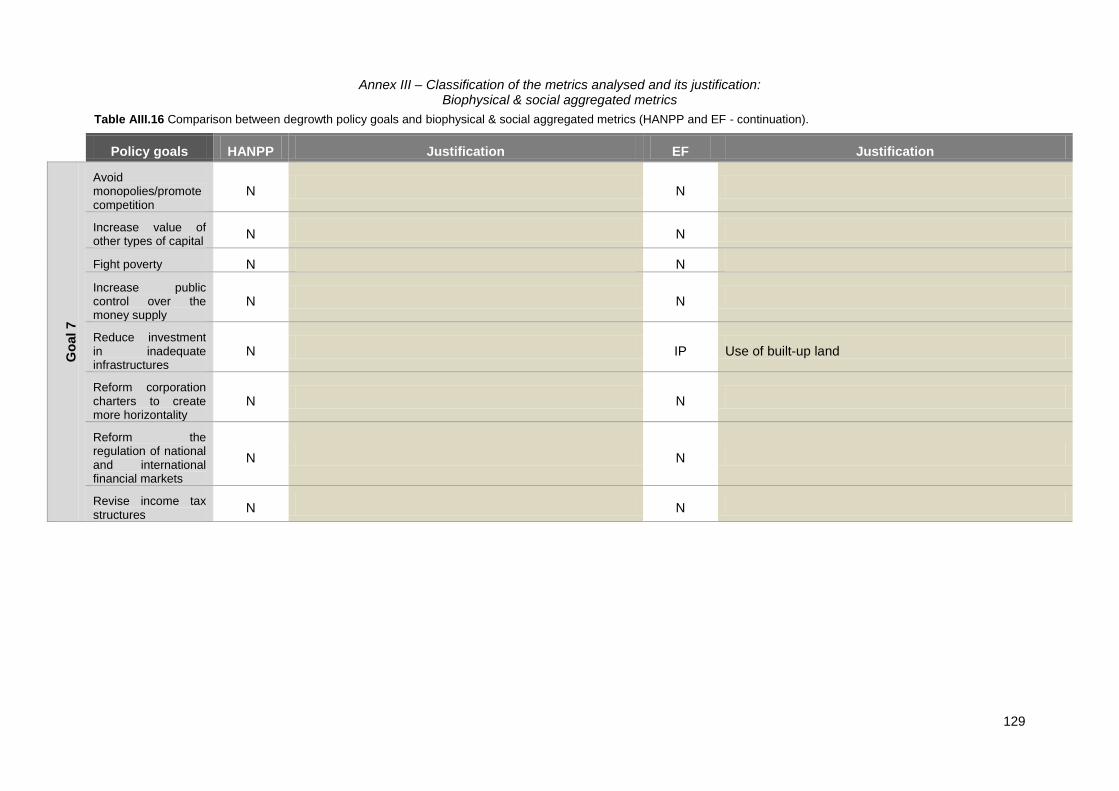
Annex III – Classification of the metrics analysed and its justification: Biophysical & social aggregated metrics
129
Table AIII.16 Comparison between degrowth policy goals and biophysical & social aggregated metrics (HANPP and EF - continuation).
Policy goals HANPP Justification EF Justification
Go
al 7
Avoid monopolies/promote competition
N N
Increase value of other types of capital
N N
Fight poverty N N
Increase public control over the money supply
N N
Reduce investment in inadequate infrastructures
N IP Use of built-up land
Reform corporation charters to create more horizontality
N N
Reform the regulation of national and international financial markets
N N
Revise income tax structures
N N
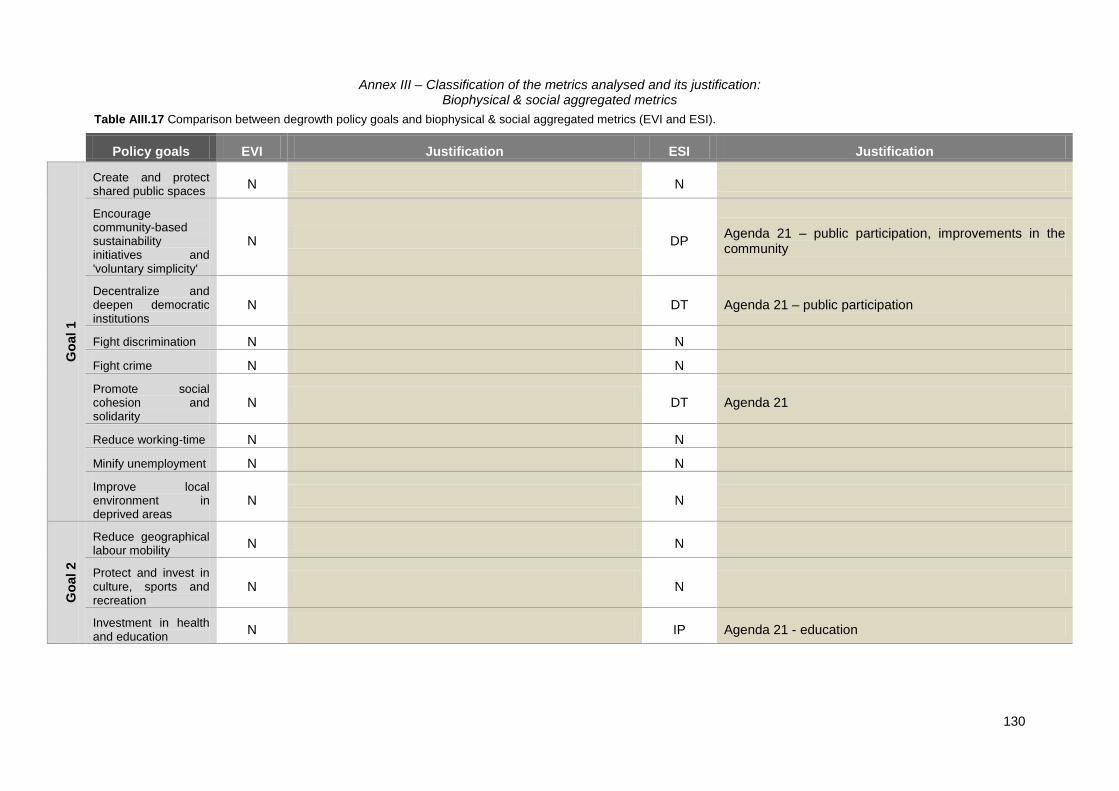
Annex III – Classification of the metrics analysed and its justification: Biophysical & social aggregated metrics
130
Table AIII.17 Comparison between degrowth policy goals and biophysical & social aggregated metrics (EVI and ESI).
Policy goals EVI Justification ESI Justification
Go
al 1
Create and protect shared public spaces
N N
Encourage community-based sustainability initiatives and 'voluntary simplicity'
N DP Agenda 21 – public participation, improvements in the community
Decentralize and deepen democratic institutions
N DT Agenda 21 – public participation
Fight discrimination N N
Fight crime N N
Promote social cohesion and solidarity
N DT Agenda 21
Reduce working-time N N
Minify unemployment N N
Improve local environment in deprived areas
N N
Go
al 2
Reduce geographical labour mobility
N N
Protect and invest in culture, sports and recreation
N N
Investment in health and education
N IP Agenda 21 - education

Annex III – Classification of the metrics analysed and its justification: Biophysical & social aggregated metrics
131
Table AIII.18 Comparison between degrowth policy goals and biophysical & social aggregated metrics (EVI and ESI - continuation).
Policy goals EVI Justification ESI Justification
Go
al 3
Identify clear resource and emission caps and establish reduction targets
DP SO2 emissions DT Anthropogenic SO2/NOx/VOC emissions, CO2 emissions per capita and per million USD (GDP)
Reduce waste emissions DT
Environmental openness (limiting/eliminating waste trading), intensive farming, fertilisers, pesticides, biotech (GMOs), waste production/treatment, industry (waste), spills, mining, sanitation
DT/IP
Vehicles in use per populated area, generation of hazardous waste, industrial organic water pollutant emissions per available freshwater, fertilizer/pesticide consumption per hectare of arable land
Reduce resource extraction
DT Borders (international agreements for sharing resources), productivity overfishing, fishing effort (risk of damage to stocks), renewable water resources
DP Freshwater and internal groundwater availability per capita
Go
al 4
Decrease material use N DP Coal consumption per populated land area
Decrease energy use N N
Promote environmentally beneficial sectors
N N
Incentive the use of public transportation or soft modes of transportation
N N
Investment in better selected technical innovations
N N
Investment in environmental and technological research
N N
Reduce the 'delocalization of the economy' (transport of goods and men on the planet)
N N
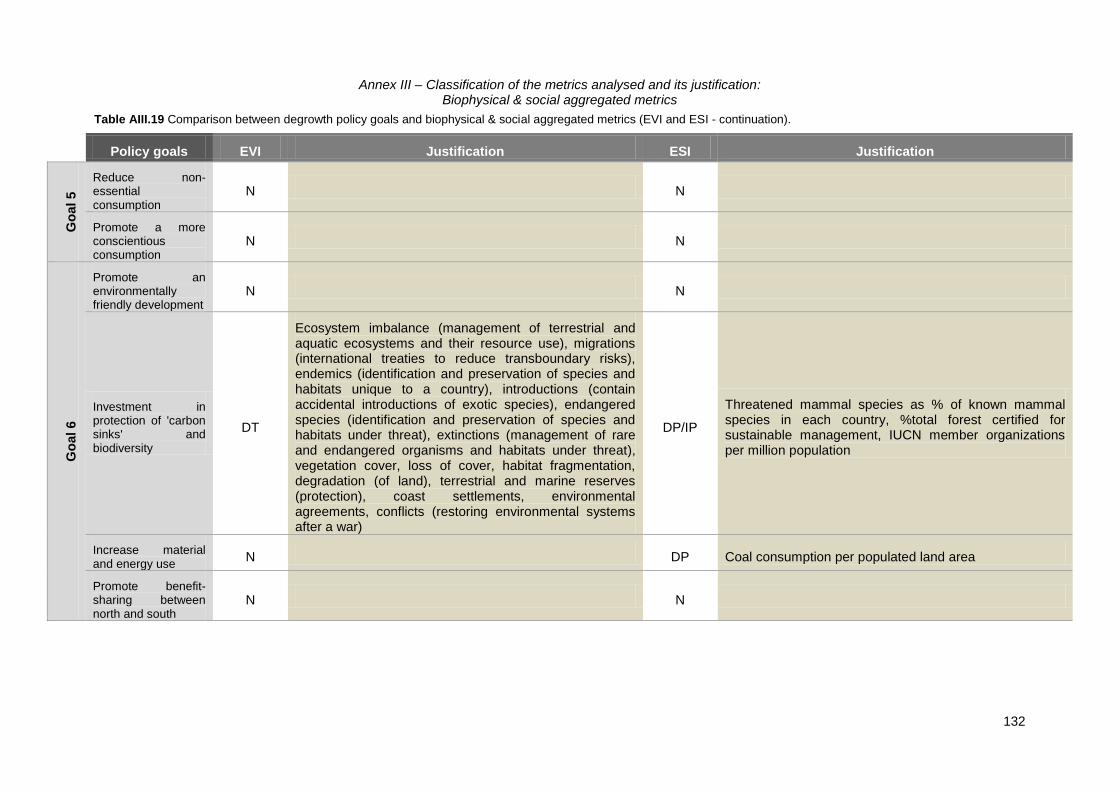
Annex III – Classification of the metrics analysed and its justification: Biophysical & social aggregated metrics
132
Table AIII.19 Comparison between degrowth policy goals and biophysical & social aggregated metrics (EVI and ESI - continuation).
Policy goals EVI Justification ESI Justification
Go
al 5
Reduce non-essential consumption
N N
Promote a more conscientious consumption
N N
Go
al 6
Promote an environmentally friendly development
N N
Investment in protection of 'carbon sinks' and biodiversity
DT
Ecosystem imbalance (management of terrestrial and aquatic ecosystems and their resource use), migrations (international treaties to reduce transboundary risks), endemics (identification and preservation of species and habitats unique to a country), introductions (contain accidental introductions of exotic species), endangered species (identification and preservation of species and habitats under threat), extinctions (management of rare and endangered organisms and habitats under threat), vegetation cover, loss of cover, habitat fragmentation, degradation (of land), terrestrial and marine reserves (protection), coast settlements, environmental agreements, conflicts (restoring environmental systems after a war)
DP/IP
Threatened mammal species as % of known mammal species in each country, %total forest certified for sustainable management, IUCN member organizations per million population
Increase material and energy use
N DP Coal consumption per populated land area
Promote benefit-sharing between north and south
N N

Annex III – Classification of the metrics analysed and its justification: Biophysical & social aggregated metrics
133
Table AIII.20 Comparison between degrowth policy goals and biophysical & social aggregated metrics (EVI and ESI - continuation).
Policy goals EVI Justification ESI Justification
Go
al 7
Avoid monopolies/promote competition
N N
Increase value of other types of capital
N N
Fight poverty N N
Increase public control over the money supply
N N
Reduce investment in inadequate infrastructures
N N
Reform corporation charters to create more horizontality
N N
Reform the regulation of national and international financial markets
N N
Revise income tax structures
N N
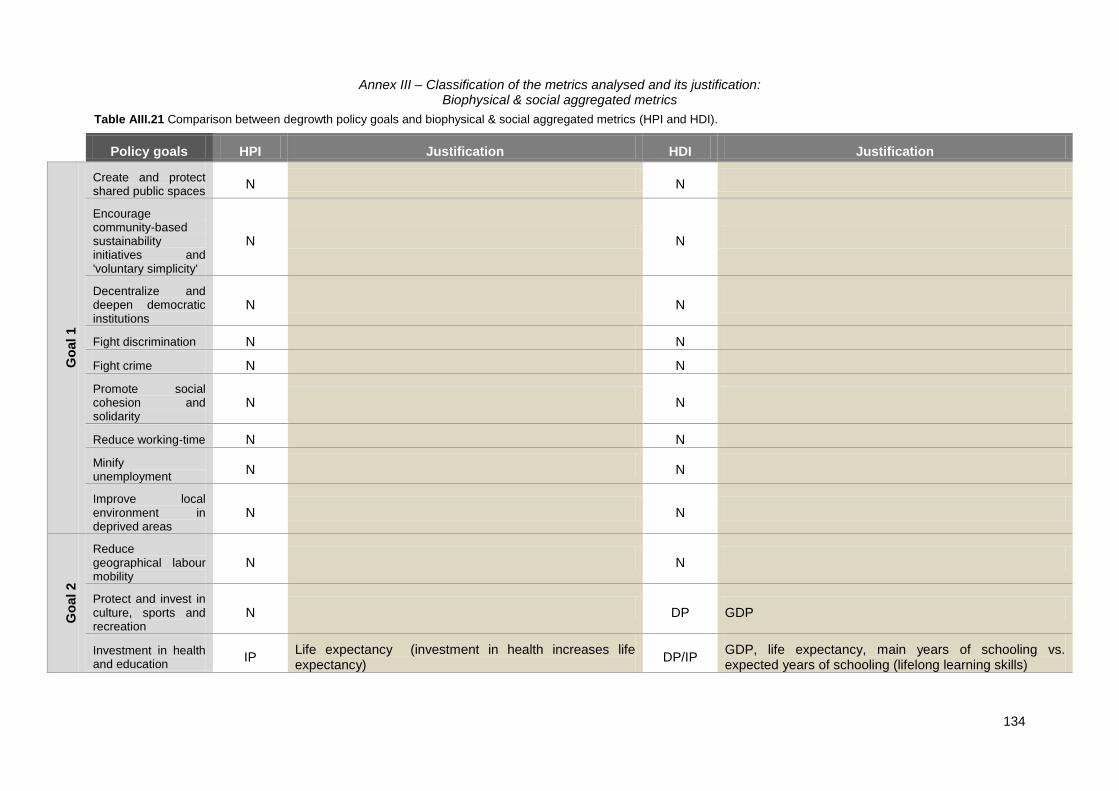
Annex III – Classification of the metrics analysed and its justification: Biophysical & social aggregated metrics
134
Table AIII.21 Comparison between degrowth policy goals and biophysical & social aggregated metrics (HPI and HDI).
Policy goals HPI Justification HDI Justification
Go
al 1
Create and protect shared public spaces
N N
Encourage community-based sustainability initiatives and 'voluntary simplicity'
N N
Decentralize and deepen democratic institutions
N N
Fight discrimination N N
Fight crime N N
Promote social cohesion and solidarity
N N
Reduce working-time N N
Minify unemployment
N N
Improve local environment in deprived areas
N N
Go
al 2
Reduce geographical labour mobility
N N
Protect and invest in culture, sports and recreation
N DP GDP
Investment in health and education
IP Life expectancy (investment in health increases life expectancy)
DP/IP GDP, life expectancy, main years of schooling vs. expected years of schooling (lifelong learning skills)
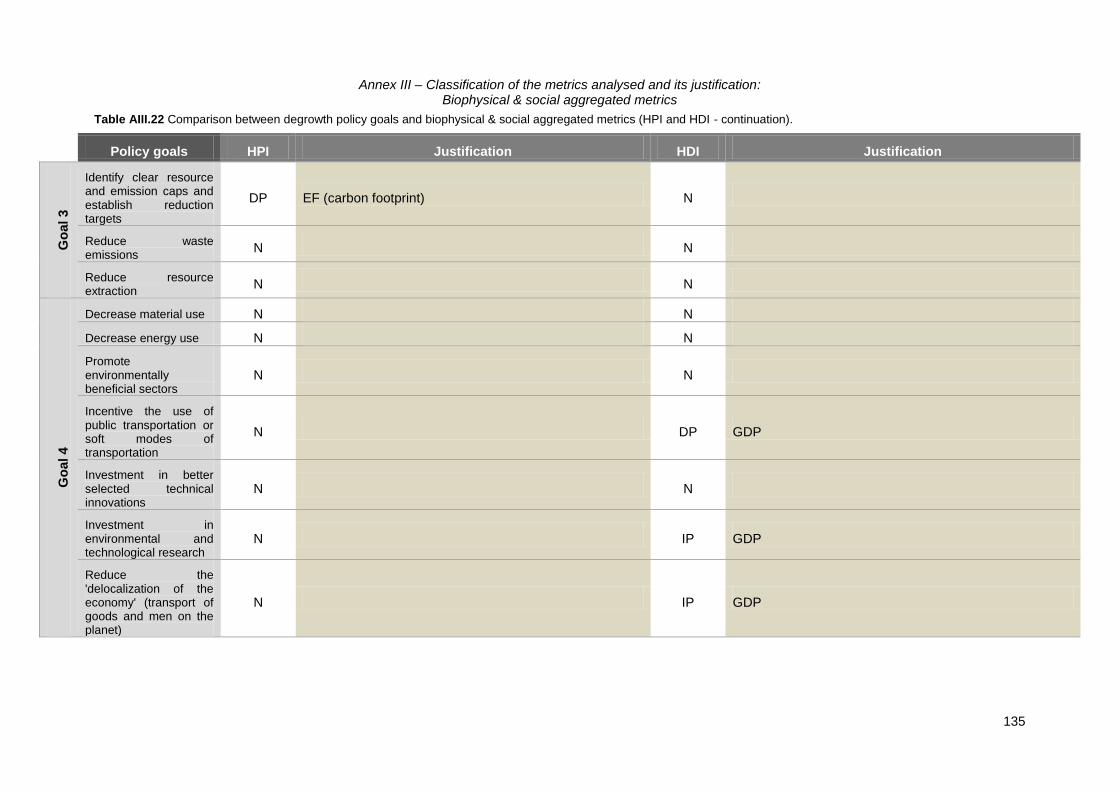
Annex III – Classification of the metrics analysed and its justification: Biophysical & social aggregated metrics
135
Table AIII.22 Comparison between degrowth policy goals and biophysical & social aggregated metrics (HPI and HDI - continuation).
Policy goals HPI Justification HDI Justification
Go
al 3
Identify clear resource and emission caps and establish reduction targets
DP EF (carbon footprint) N
Reduce waste emissions
N N
Reduce resource extraction
N N
Go
al 4
Decrease material use N N
Decrease energy use N N
Promote environmentally beneficial sectors
N N
Incentive the use of public transportation or soft modes of transportation
N DP GDP
Investment in better selected technical innovations
N N
Investment in environmental and technological research
N IP GDP
Reduce the 'delocalization of the economy' (transport of goods and men on the planet)
N IP GDP
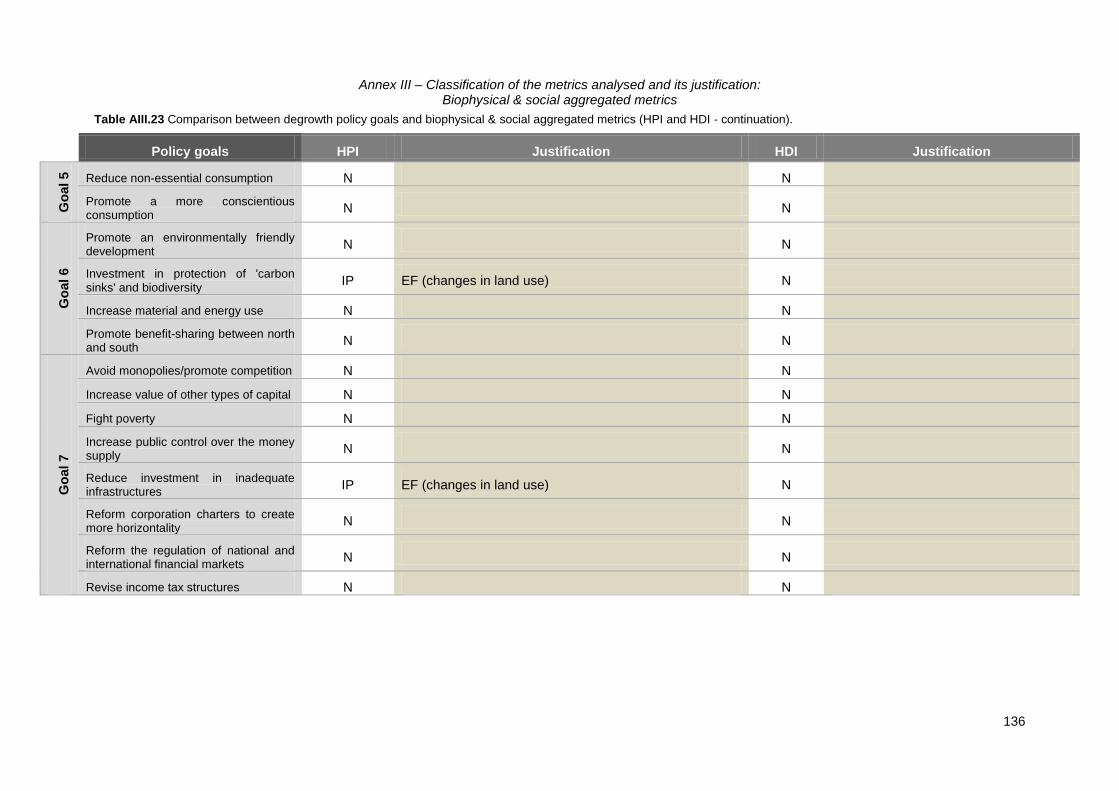
Annex III – Classification of the metrics analysed and its justification: Biophysical & social aggregated metrics
136
Table AIII.23 Comparison between degrowth policy goals and biophysical & social aggregated metrics (HPI and HDI - continuation).
Policy goals HPI Justification HDI Justification
Go
al 5
Reduce non-essential consumption N N
Promote a more conscientious consumption
N N
Go
al 6
Promote an environmentally friendly development
N N
Investment in protection of 'carbon sinks' and biodiversity
IP EF (changes in land use) N
Increase material and energy use N N
Promote benefit-sharing between north and south
N N
Go
al 7
Avoid monopolies/promote competition N N
Increase value of other types of capital N N
Fight poverty N N
Increase public control over the money supply
N N
Reduce investment in inadequate infrastructures
IP EF (changes in land use) N
Reform corporation charters to create more horizontality
N N
Reform the regulation of national and international financial markets
N N
Revise income tax structures N N

Annex III – Classification of the metrics analysed and its justification: Biophysical & social aggregated metrics
137
Table AIII.24 Comparison between degrowth policy goals and biophysical & social aggregated metrics (SSI and WI).
Policy goals SSI Justification WI Justification
Go
al 1
Create and protect shared public spaces
IP GDP N
Encourage community-based sustainability initiatives and 'voluntary simplicity'
IP Organic farming N
Decentralize and deepen democratic institutions
DT Good governance N
Fight discrimination DP Gender equality DP Gender vs. wealth/knowledge/community, political rights
Fight crime N DT Deaths from armed conflicts, homicide and other violent crimes rate
Promote social cohesion and solidarity
N N
Reduce working-time N N
Minify unemployment DT Employment rate DT National wealth index (unemployment rate)
Improve local environment in deprived areas
N N
Go
al 2
Reduce geographical labour mobility
N N
Protect and invest in culture, sports and recreation
DP GDP DP National wealth index (GDP)
Investment in health and education
DT/IP Safe sanitation, healthy life, education opportunities DP National wealth index (GDP), primary/secondary/tertiary school enrolment, healthy life expectancy at birth

Annex III – Classification of the metrics analysed and its justification: Biophysical & social aggregated metrics
138
Table AIII.25 Comparison between degrowth policy goals and biophysical & social aggregated metrics (SSI and WI - continuation).
Policy goals SSI Justification WI Justification
Go
al 3
Identify clear resource and emission caps and establish reduction targets
DP Emission of GHG IP Global atmosphere
Reduce waste emissions IP Air quality, surface water quality IP Land quality, inland water quality, local air quality
Reduce resource extraction IP Renewable water resources, forest area
DP Native forest change, water withdrawal
Go
al 4
Decrease material use DT Material consumption DP Timber use
Decrease energy use DT Energy consumption DT Energy use
Promote environmentally beneficial sectors
N N
Incentive the use of public transportation or soft modes of transportation
DP GDP DP National wealth index (GDP)
Investment in better selected technical innovations
N N
Investment in environmental and technological research
IP GDP IP National wealth index (GDP)
Reduce the 'delocalization of the economy' (transport of goods and men on the planet)
IP GDP IP National wealth index (GDP)

Annex III – Classification of the metrics analysed and its justification: Biophysical & social aggregated metrics
139
Table AIII.26 Comparison between degrowth policy goals and biophysical & social aggregated metrics (SSI and WI - continuation).
Policy goals SSI Justification WI Justification
Go
al 5
Reduce non-essential consumption
N N
Promote a more conscientious consumption
N N
Go
al 6
Promote an environmentally friendly development
N N
Investment in protection of 'carbon sinks' and biodiversity
IP Biodiversity, forest area DP/IP Land protection, wild species rank, wild plant species wild animal species, domesticated diversity, fish and seafood self-reliance, fisheries
Increase material and energy use
DT Energy/material use DP Timber use, energy use
Promote benefit-sharing between north and south
N N

Annex III – Classification of the metrics analysed and its justification: Biophysical & social aggregated metrics
140
Table AIII.27 Comparison between degrowth policy goals and biophysical & social aggregated metrics (SSI and WI - continuation).
Policy goals SSI Justification WI Justification
Go
al 7
Avoid monopolies/promote competition
N N
Increase value of other types of capital
N N
Fight poverty N N
Increase public control over the money supply
N N
Reduce investment in inadequate infrastructures
N N
Reform corporation charters to create more horizontality
DT Income distribution N
Reform the regulation of national and international financial markets
N N
Revise income tax structures
N N

Annex III – Classification of the metrics analysed and its justification: Biophysical & social aggregated metrics
141
Table AIII.28 Comparison between degrowth policy goals and biophysical & social aggregated metrics (CIW).
Policy goals CIW Justification
Go
al 1
Create and protect shared public spaces
N
Encourage community-based sustainability initiatives and 'voluntary simplicity'
IP % Reporting very or somewhat strong sense of belonging to community, % reporting participation in group activities
Decentralize and deepen democratic institutions
N
Fight discrimination IP % Women in parliament
Fight crime DT % Feel safe walking alone after dark, violent/property crime rate
Promote social cohesion and solidarity
N
Reduce working-time DT % 20-64 adults working > 50h/week, avg nights away/trip on vacation >80km of home
Minify unemployment DT %Labour force employed,
Improve local environment in deprived areas
N
Go
al 2
Reduce geographical labour mobility
N
Protect and invest in culture, sports and recreation
DT
Avg % time spent in arts and culture activities, avg hours spent in volunteering for cultural and recreation organizations, avg monthly frequency of physical activity, avg attendance per performance at all attending performing arts performances, avg visits per site to all national parks and national historic sites, expenditures on culture and recreation as % total household expend
Investment in health and education
DT
%self-rated health as excellent/very good, %rating patient health services as excellent or good, life expectancy at birth, % >65 adults getting influenza immunization, ratio of childcare spaces to children aged 0 - 5, % children doing well on 5 development domains at age 5, ratio of students to educators in public schools, avg of 5 social and emotional competence scores for 12 - 13 children, basic knowledge and skills index for 13 - 15 children, % PISA scores explained by socio-economic background, % 25-64 adults with a university degree, % 20-24 adults in population completing high school
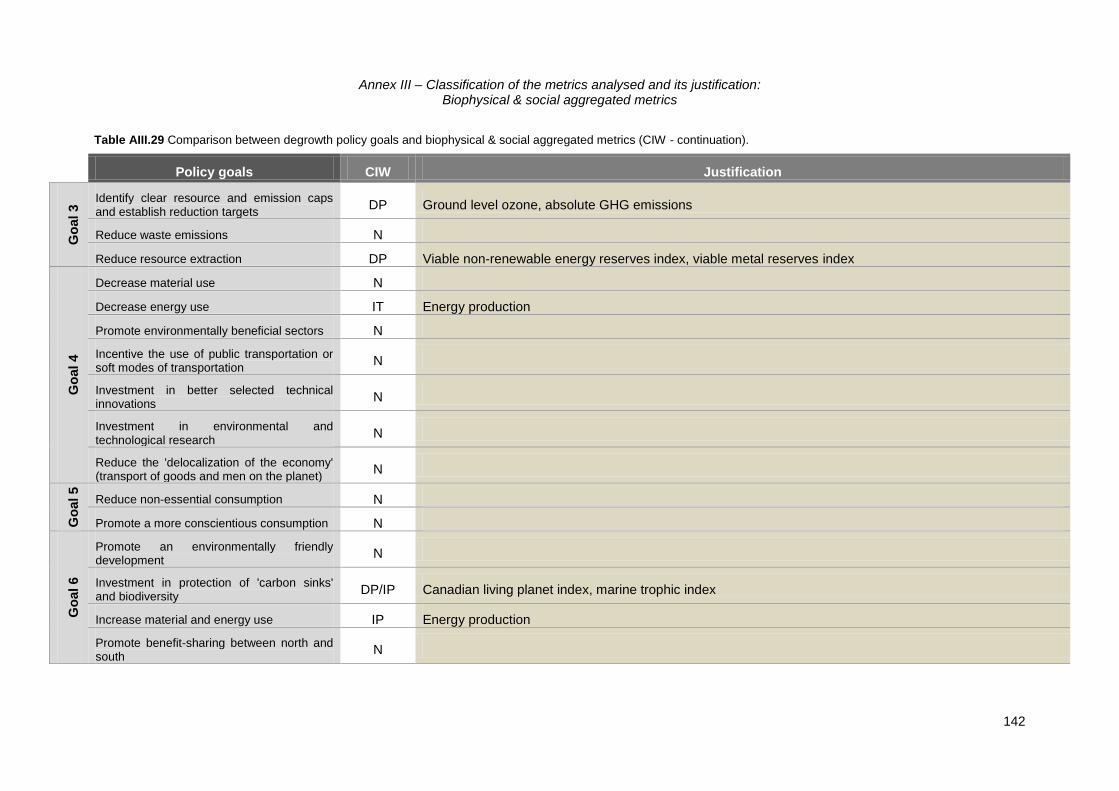
Annex III – Classification of the metrics analysed and its justification: Biophysical & social aggregated metrics
142
Table AIII.29 Comparison between degrowth policy goals and biophysical & social aggregated metrics (CIW - continuation).
Policy goals CIW Justification
Go
al 3
Identify clear resource and emission caps and establish reduction targets
DP Ground level ozone, absolute GHG emissions
Reduce waste emissions N
Reduce resource extraction DP Viable non-renewable energy reserves index, viable metal reserves index
Go
al 4
Decrease material use N
Decrease energy use IT Energy production
Promote environmentally beneficial sectors N
Incentive the use of public transportation or soft modes of transportation
N
Investment in better selected technical innovations
N
Investment in environmental and technological research
N
Reduce the 'delocalization of the economy' (transport of goods and men on the planet)
N
Go
al 5
Reduce non-essential consumption N
Promote a more conscientious consumption N
Go
al 6
Promote an environmentally friendly development
N
Investment in protection of 'carbon sinks' and biodiversity
DP/IP Canadian living planet index, marine trophic index
Increase material and energy use IP Energy production
Promote benefit-sharing between north and south
N
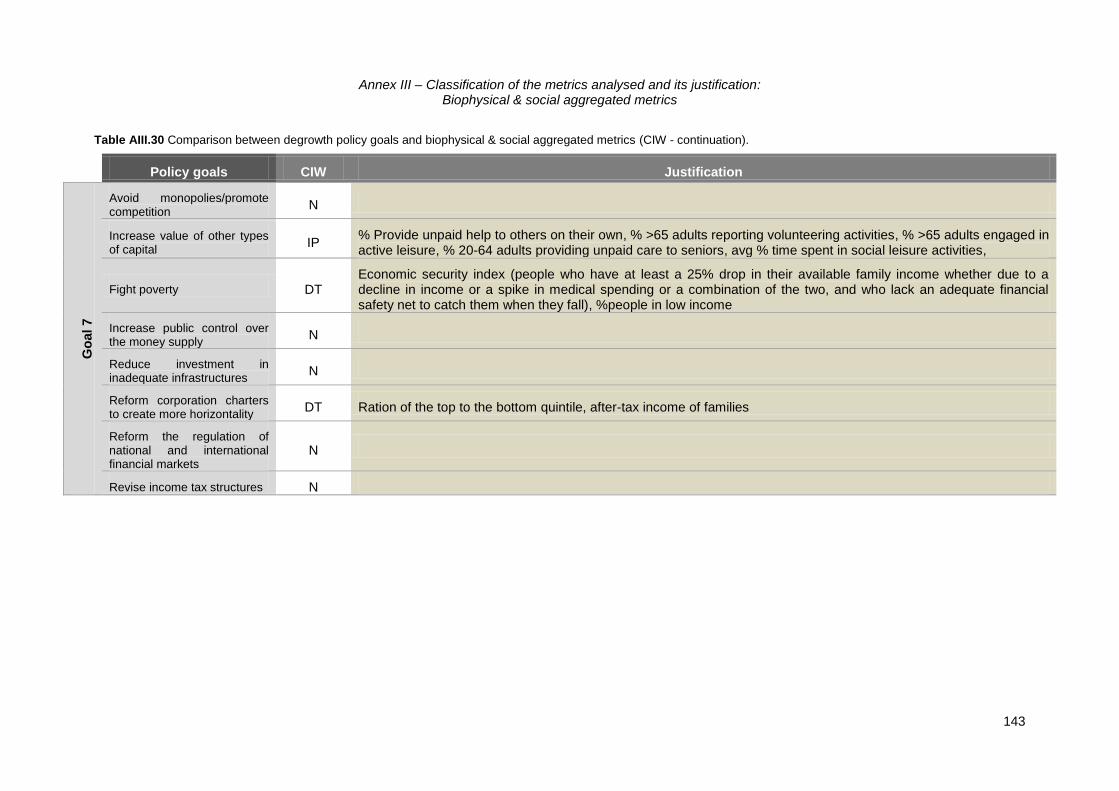
Annex III – Classification of the metrics analysed and its justification: Biophysical & social aggregated metrics
143
Table AIII.30 Comparison between degrowth policy goals and biophysical & social aggregated metrics (CIW - continuation).
Policy goals CIW Justification
Go
al 7
Avoid monopolies/promote competition
N
Increase value of other types of capital
IP % Provide unpaid help to others on their own, % >65 adults reporting volunteering activities, % >65 adults engaged in active leisure, % 20-64 adults providing unpaid care to seniors, avg % time spent in social leisure activities,
Fight poverty DT Economic security index (people who have at least a 25% drop in their available family income whether due to a decline in income or a spike in medical spending or a combination of the two, and who lack an adequate financial safety net to catch them when they fall), %people in low income
Increase public control over the money supply
N
Reduce investment in inadequate infrastructures
N
Reform corporation charters to create more horizontality
DT Ration of the top to the bottom quintile, after-tax income of families
Reform the regulation of national and international financial markets
N
Revise income tax structures N

Annex III – Classification of the metrics analysed and its justification: Sets of indicators
144
Sets of indicators
Table AIII.31 Comparison between degrowth policy goals and sets of indicators (EU-SDIs and CSI-EEA).
Policy goals EU-SDIs Justification CSI-EEA Justification
Go
al 1
Create and protect shared public spaces
N N
Encourage community-based sustainability initiatives and 'voluntary simplicity'
IP Area under agri-environmental commitment, area under organic farming
IP Area under organic farming
Decentralize and deepen democratic institutions
DP E-government on-line availability N
Fight discrimination IP Gender pay gap in unadjusted form N
Fight crime N N
Promote social cohesion and solidarity
N N
Reduce working-time N N
Minify unemployment
DT Total long-term unemployment rate, Total employment rate, Unemployment rate
N
Improve local environment in deprived areas
N N
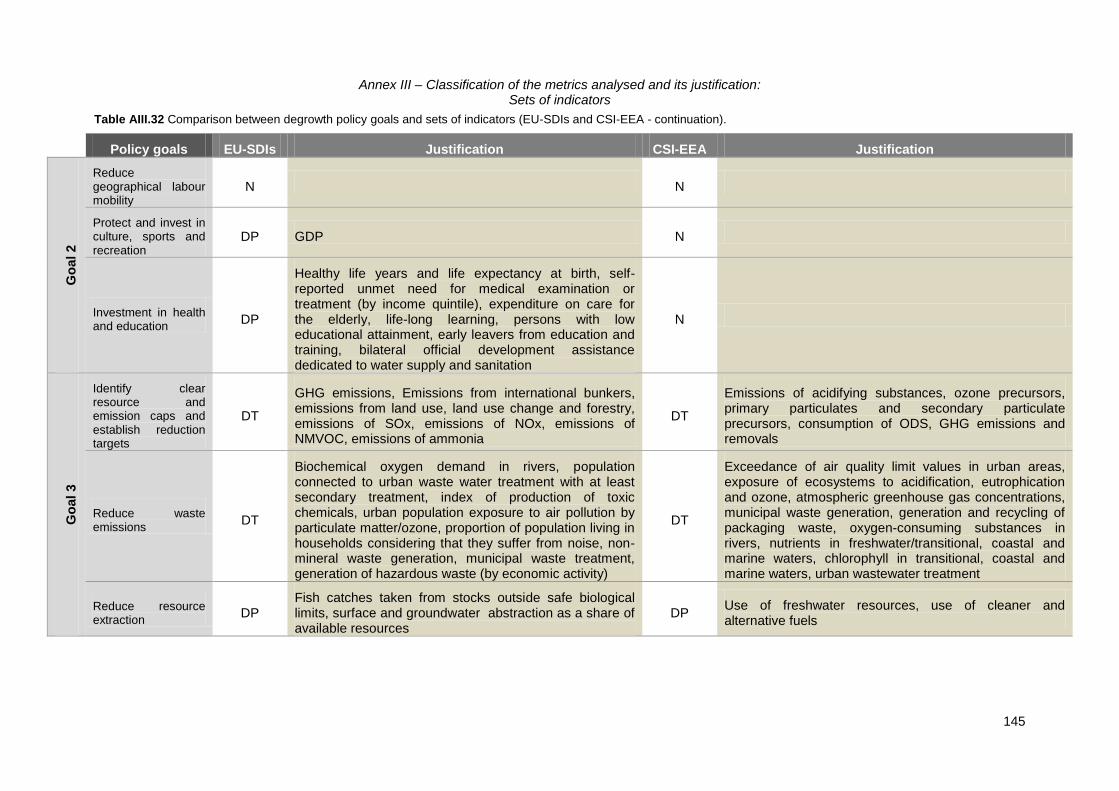
Annex III – Classification of the metrics analysed and its justification: Sets of indicators
145
Table AIII.32 Comparison between degrowth policy goals and sets of indicators (EU-SDIs and CSI-EEA - continuation).
Policy goals EU-SDIs Justification CSI-EEA Justification
Go
al 2
Reduce geographical labour mobility
N N
Protect and invest in culture, sports and recreation
DP GDP N
Investment in health and education
DP
Healthy life years and life expectancy at birth, self-reported unmet need for medical examination or treatment (by income quintile), expenditure on care for the elderly, life-long learning, persons with low educational attainment, early leavers from education and training, bilateral official development assistance dedicated to water supply and sanitation
N
Go
al 3
Identify clear resource and emission caps and establish reduction targets
DT
GHG emissions, Emissions from international bunkers, emissions from land use, land use change and forestry, emissions of SOx, emissions of NOx, emissions of NMVOC, emissions of ammonia
DT
Emissions of acidifying substances, ozone precursors, primary particulates and secondary particulate precursors, consumption of ODS, GHG emissions and removals
Reduce waste emissions
DT
Biochemical oxygen demand in rivers, population connected to urban waste water treatment with at least secondary treatment, index of production of toxic chemicals, urban population exposure to air pollution by particulate matter/ozone, proportion of population living in households considering that they suffer from noise, non-mineral waste generation, municipal waste treatment, generation of hazardous waste (by economic activity)
DT
Exceedance of air quality limit values in urban areas, exposure of ecosystems to acidification, eutrophication and ozone, atmospheric greenhouse gas concentrations, municipal waste generation, generation and recycling of packaging waste, oxygen-consuming substances in rivers, nutrients in freshwater/transitional, coastal and marine waters, chlorophyll in transitional, coastal and marine waters, urban wastewater treatment
Reduce resource extraction
DP Fish catches taken from stocks outside safe biological limits, surface and groundwater abstraction as a share of available resources
DP Use of freshwater resources, use of cleaner and alternative fuels

Annex III – Classification of the metrics analysed and its justification: Sets of indicators
146
Table AIII.33 Comparison between degrowth policy goals and sets of indicators (EU-SDIs and CSI-EEA - continuation).
Policy goals EU-SDIs Justification CSI-EEA Justification
Go
al 4
Decrease material use
DT Domestic material consumption per inhabitant, components of domestic material consumption, domestic material consumption by material
N
Decrease energy use
DT Gross inland energy consumption, electricity consumption of households, final energy consumption (by sector), energy intensity of the economy
DT Final energy consumption, total energy consumption
Promote environmentally beneficial sectors
N N
Incentive the use of public transportation or soft modes of transportation
DP
Investment in transport infrastructure by mode, annual harmonised index of consumer prices for transport, modal split of freight transport and passenger transport, Motorisation rate – it does not account for soft modes
DP Passenger transport demand, freight transport demand
Investment in better selected technical innovations
IT (?) Share of renewable energy in gross final energy consumption, electricity generated from renewable sources (not really an investment)
IT (?) Renewable energy consumption, renewable electricity (not really an investment)
Investment in environmental and technological research
IP Total R&D expenditure N
Reduce the 'delocalization of the economy' (transport of goods and men on the planet)
DP EU imports from developing countries/least-developed countries
N

Annex III – Classification of the metrics analysed and its justification: Sets of indicators
147
Table AIII.34 Comparison between degrowth policy goals and sets of indicators (EU-SDIs and CSI-EEA - continuation).
Policy goals EU-SDIs Justification CSI-EEA Justification
Go
al 5
Reduce non-essential consumption
DT Final consumption expenditure of households, by consumption purpose
N
Promote a more conscientious consumption
DP Ecolabel licences N
Go
al 6
Promote an environmentally friendly development
N N
Investment in protection of 'carbon sinks' and biodiversity
DT Common bird index, sufficiency of sites designated under the EU habitats and birds directive, increase in certain categories of land cover, forest increment and fellings
DT Threatened and protected species, designated areas, species diversity, progress in management of contaminated sites, status of marine fish stocks
Increase material and energy use
DT
Gross inland energy consumption, electricity consumption of households, final energy consumption (by sector), domestic material consumption per inhabitant, components of domestic material consumption, domestic material consumption by material
DP Final energy consumption, total energy consumption
Promote benefit-sharing between north and south
N N

Annex III – Classification of the metrics analysed and its justification: Sets of indicators
148
Table AIII.35 Comparison between degrowth policy goals and sets of indicators (EU-SDIs and CSI-EEA - continuation).
Policy goals EU-SDIs Justification CSI-EEA Justification
Go
al 7
Avoid monopolies/promote competition
N N
Increase value of other types of capital
N N
Fight poverty DT
At-risk-of-poverty rate of elderly people, at-risk-of-poverty rate, severely materially deprived persons, persons at-risk-of-poverty after social transfers, persistent-at-risk-of-poverty rate, population at risk of poverty or social exclusion, population living on less than 1USD a day, official development assistance as share of gross national income
N
Increase public control over the money supply
N N
Reduce investment in inadequate infrastructures
N IP
Land take (housing, services and recreation, industrial and commercial sites, transport networks and infrastructures, mines, quarries and waste dumpsites, construction sites)
Reform corporation charters to create more horizontality
DT Inequality of income distribution N
Reform the regulation of national and international financial markets
N N
Revise income tax structures
N N
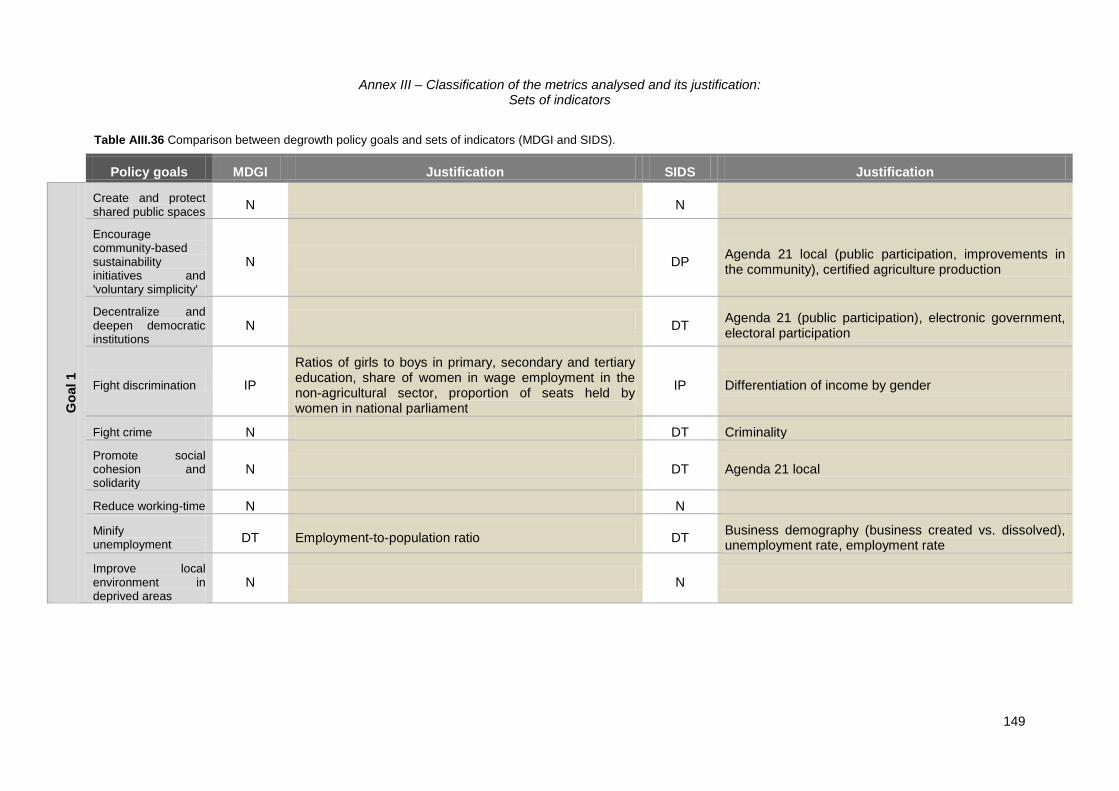
Annex III – Classification of the metrics analysed and its justification: Sets of indicators
149
Table AIII.36 Comparison between degrowth policy goals and sets of indicators (MDGI and SIDS).
Policy goals MDGI Justification SIDS Justification
Go
al 1
Create and protect shared public spaces
N N
Encourage community-based sustainability initiatives and 'voluntary simplicity'
N DP Agenda 21 local (public participation, improvements in the community), certified agriculture production
Decentralize and deepen democratic institutions
N DT Agenda 21 (public participation), electronic government, electoral participation
Fight discrimination IP
Ratios of girls to boys in primary, secondary and tertiary education, share of women in wage employment in the non-agricultural sector, proportion of seats held by women in national parliament
IP Differentiation of income by gender
Fight crime N DT Criminality
Promote social cohesion and solidarity
N DT Agenda 21 local
Reduce working-time N N
Minify unemployment
DT Employment-to-population ratio DT Business demography (business created vs. dissolved), unemployment rate, employment rate
Improve local environment in deprived areas
N N

Annex III – Classification of the metrics analysed and its justification: Sets of indicators
150
Table AIII.37 Comparison between degrowth policy goals and sets of indicators (MDGI and SIDS - continuation).
Policy goals MDGI Justification SIDS Justification
Go
al 2
Reduce geographical labour mobility
N N
Protect and invest in culture, sports and recreation
N DP Sociocultural activities, cultural resources
Investment in health and education
DT
Proportion of population using an improved sanitation facility, proportion of total bilateral sector-allocable ODA of OECD/DAC donors to basic social services (basic education, primary health care, nutrition, safe water and sanitation), proportion of population with access to affordable essential drugs on a sustainable basis, net enrolment ratio in primary education, proportion of pupils starting grade 1 who reach last grade of primary, literacy rate of 15-24 year-olds women and men, under-five mortality rate, infant mortality rate, proportion of 1 year-old children immunised against measles, antenatal care coverage
DT
Agenda 21 local, public expenditures, graduates in science and technology, life expectancy at birth, healthy life expectancy, education level obtained by young population, education level of working population, obesity, asthma prevalence in children, health professionals, net of social services and equipment, illiteracy rate, infant mortality rate
Go
al 3
Identify clear resource and emission caps and establish reduction targets
DP CO2 emissions, consumption of ODS DT Emissions of GHG, consumption of ODS, emissions of acidifying and eutrophying substances, emissions of ODS, carbon intensity of industry
Reduce waste emissions
N DT
Annual concentrations of particles and ozone, discharges of oil and other harmful substances, surface water/groundwater quality, agricultural fertilizers, waste management, waste production, plant protection products, air quality, recycling and recovery of municipal waste
Reduce resource extraction
DP Proportion of fish stocks within safe biological limits, proportion of total water resources used
DP Water consumption, discharges of fish, water availability, water use efficiency, fish stocks outside the biological safety limits

Annex III – Classification of the metrics analysed and its justification: Sets of indicators
151
Table AIII.38 Comparison between degrowth policy goals and sets of indicators (MDGI and SIDS - continuation).
Policy goals MDGI Justification SIDS Justification
Go
al 4
Decrease material use
N DT Material consumption by the economy
Decrease energy use
N DT Final energy consumption, energy intensity of industry, primary energy production and consumption
Promote environmentally beneficial sectors
N N
Incentive the use of public transportation or soft modes of transportation
N IP Modal split of transport of passengers and goods, transport volume of passengers and commodities
Investment in better selected technical innovations
N IP Electricity consumption from renewable energy sources
Investment in environmental and technological research
N IP Scientific articles in international journals, I&D expenditures
Reduce the 'delocalization of the economy' (transport of goods and men on the planet)
DP Proportion of total developed country imports (by value and excluding arms) from developing countries and least developed countries, admitted free of duty
DP Balance of trade - imports and exports, imports from less developed and developing countries
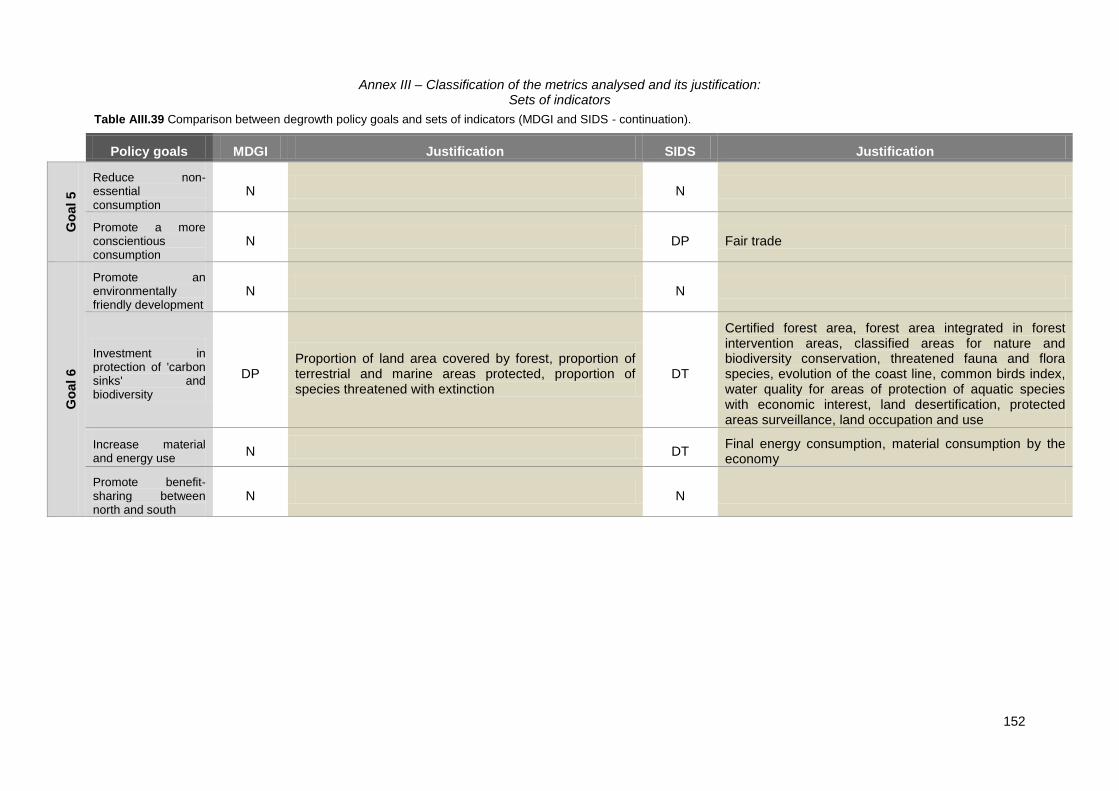
Annex III – Classification of the metrics analysed and its justification: Sets of indicators
152
Table AIII.39 Comparison between degrowth policy goals and sets of indicators (MDGI and SIDS - continuation).
Policy goals MDGI Justification SIDS Justification
Go
al 5
Reduce non-essential consumption
N N
Promote a more conscientious consumption
N DP Fair trade
Go
al 6
Promote an environmentally friendly development
N N
Investment in protection of 'carbon sinks' and biodiversity
DP Proportion of land area covered by forest, proportion of terrestrial and marine areas protected, proportion of species threatened with extinction
DT
Certified forest area, forest area integrated in forest intervention areas, classified areas for nature and biodiversity conservation, threatened fauna and flora species, evolution of the coast line, common birds index, water quality for areas of protection of aquatic species with economic interest, land desertification, protected areas surveillance, land occupation and use
Increase material and energy use
N DT Final energy consumption, material consumption by the economy
Promote benefit-sharing between north and south
N N
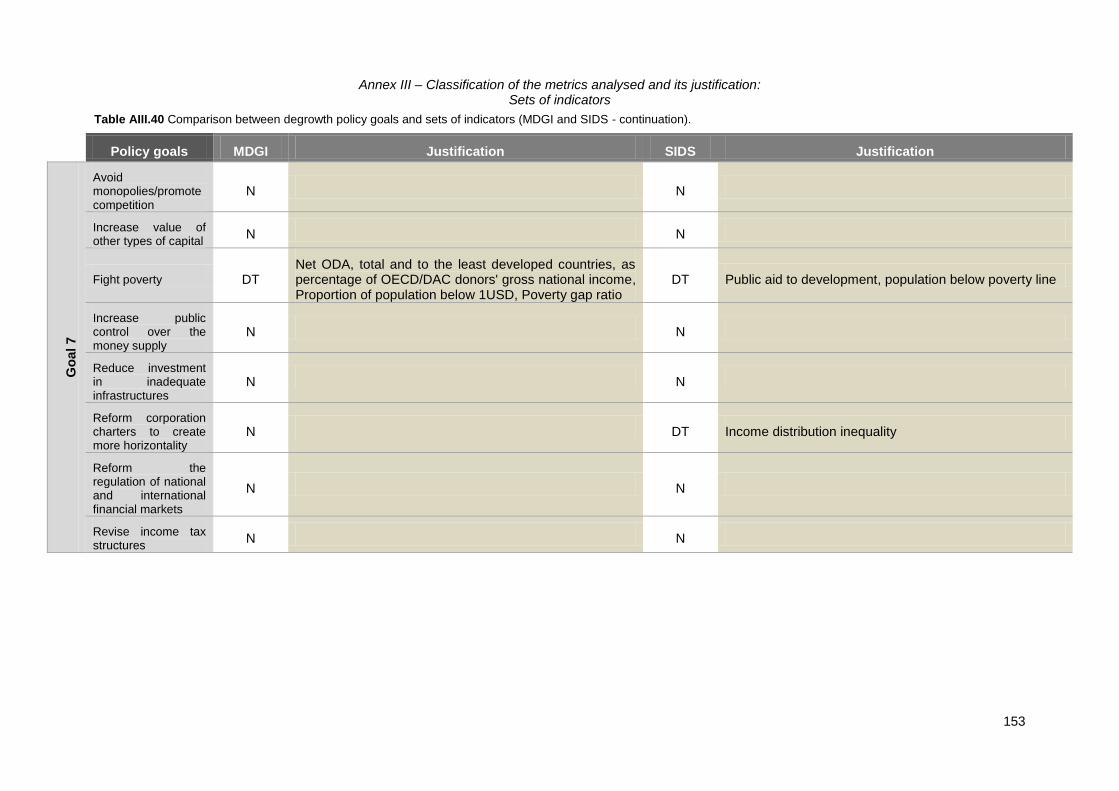
Annex III – Classification of the metrics analysed and its justification: Sets of indicators
153
Table AIII.40 Comparison between degrowth policy goals and sets of indicators (MDGI and SIDS - continuation).
Policy goals MDGI Justification SIDS Justification
Go
al 7
Avoid monopolies/promote competition
N N
Increase value of other types of capital
N N
Fight poverty DT Net ODA, total and to the least developed countries, as percentage of OECD/DAC donors' gross national income, Proportion of population below 1USD, Poverty gap ratio
DT Public aid to development, population below poverty line
Increase public control over the money supply
N N
Reduce investment in inadequate infrastructures
N N
Reform corporation charters to create more horizontality
N DT Income distribution inequality
Reform the regulation of national and international financial markets
N N
Revise income tax structures
N N
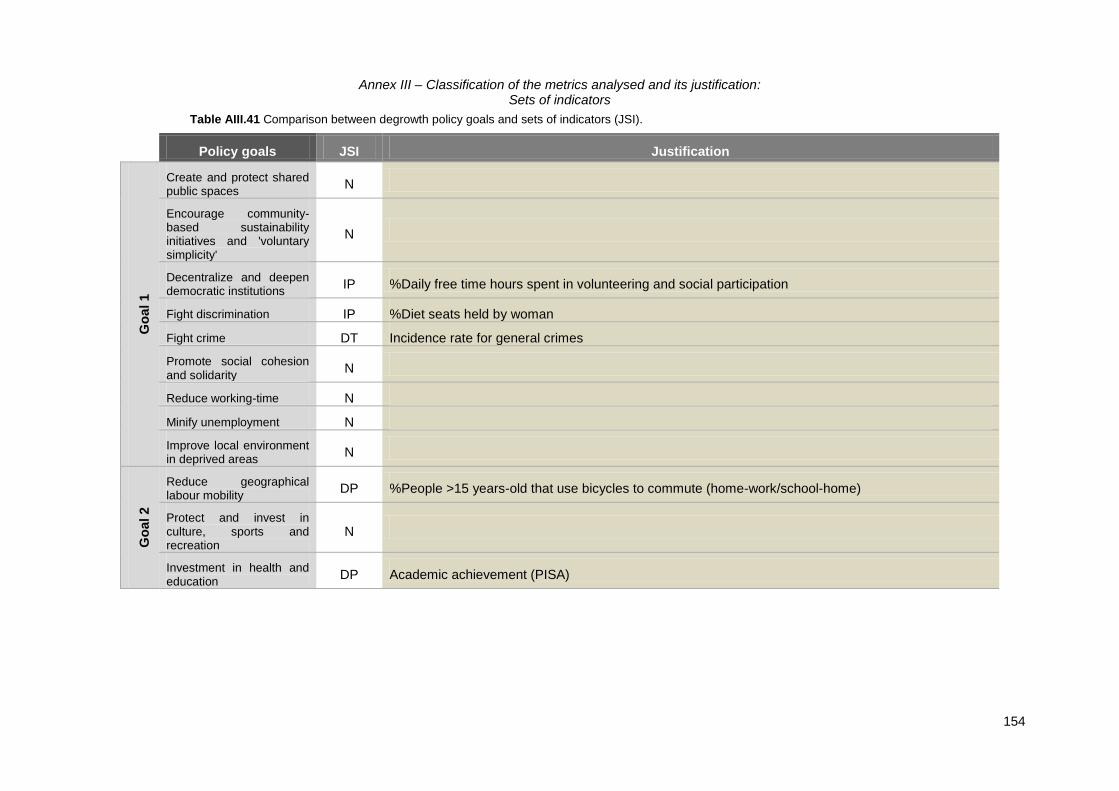
Annex III – Classification of the metrics analysed and its justification: Sets of indicators
154
Table AIII.41 Comparison between degrowth policy goals and sets of indicators (JSI).
Policy goals JSI Justification
Go
al 1
Create and protect shared public spaces
N
Encourage community-based sustainability initiatives and 'voluntary simplicity'
N
Decentralize and deepen democratic institutions
IP %Daily free time hours spent in volunteering and social participation
Fight discrimination IP %Diet seats held by woman
Fight crime DT Incidence rate for general crimes
Promote social cohesion and solidarity
N
Reduce working-time N
Minify unemployment N
Improve local environment in deprived areas
N
Go
al 2
Reduce geographical labour mobility
DP %People >15 years-old that use bicycles to commute (home-work/school-home)
Protect and invest in culture, sports and recreation
N
Investment in health and education
DP Academic achievement (PISA)
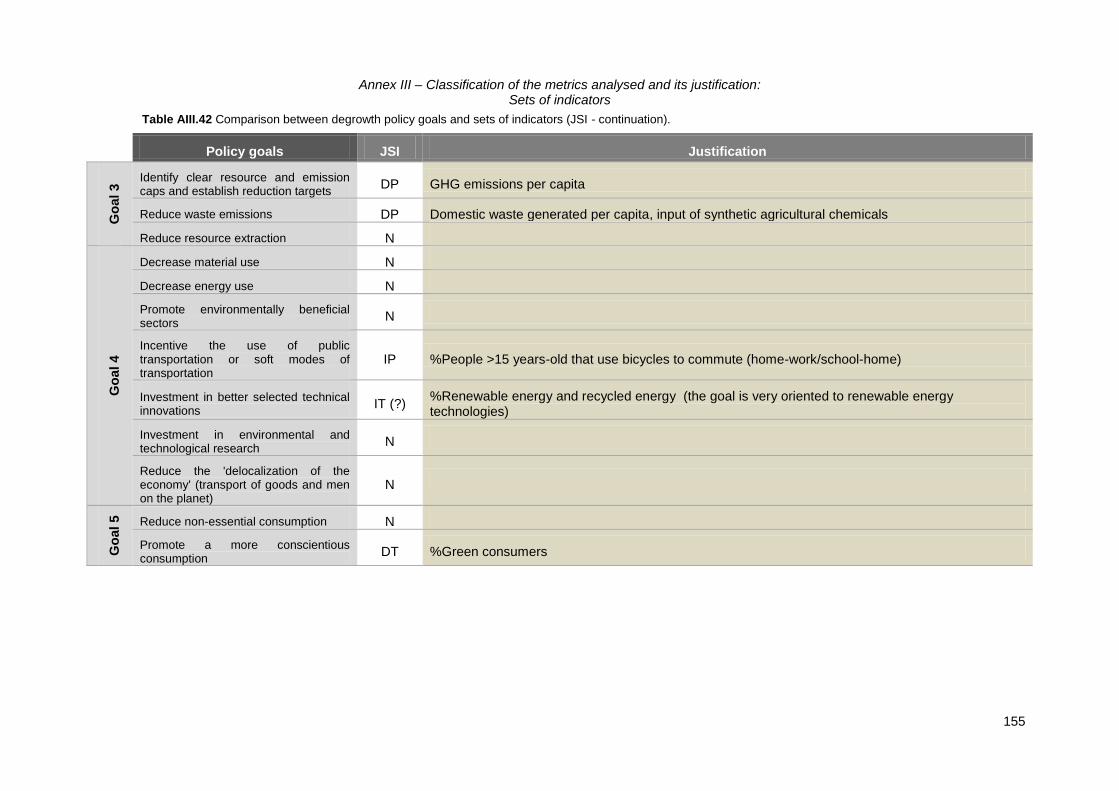
Annex III – Classification of the metrics analysed and its justification: Sets of indicators
155
Table AIII.42 Comparison between degrowth policy goals and sets of indicators (JSI - continuation).
Policy goals JSI Justification
Go
al 3
Identify clear resource and emission caps and establish reduction targets
DP GHG emissions per capita
Reduce waste emissions DP Domestic waste generated per capita, input of synthetic agricultural chemicals
Reduce resource extraction N
Go
al 4
Decrease material use N
Decrease energy use N
Promote environmentally beneficial sectors
N
Incentive the use of public transportation or soft modes of transportation
IP %People >15 years-old that use bicycles to commute (home-work/school-home)
Investment in better selected technical innovations
IT (?) %Renewable energy and recycled energy (the goal is very oriented to renewable energy technologies)
Investment in environmental and technological research
N
Reduce the 'delocalization of the economy' (transport of goods and men on the planet)
N
Go
al 5
Reduce non-essential consumption N
Promote a more conscientious consumption
DT %Green consumers

Annex III – Classification of the metrics analysed and its justification: Sets of indicators
156
Table AIII.43 Comparison between degrowth policy goals and sets of indicators (JSI - continuation).
Policy goals JSI Justification
Go
al 6
Promote an environmentally friendly development
N
Investment in protection of 'carbon sinks' and biodiversity
N
Increase material and energy use N
Promote benefit-sharing between north and south
N
Go
al 7
Avoid monopolies/promote competition N
Increase value of other types of capital DP
% Social Responsible Investment in total investment (encouraging corporate activities that are ethical and contribute to sustainability and discouraging the opposite), %daily free time hours spent in volunteering and social participation
Fight poverty DT Aid as a %GNI, public assistance
Increase public control over the money supply
N
Reduce investment in inadequate infrastructures
N
Reform corporation charters to create more horizontality
N
Reform the regulation of national and international financial markets
N
Revise income tax structures N

Annex III – Classification of the metrics analysed and its justification: D. W. O’Neill’s potential set of indicators to measure progress in the degrowth transition to a steady state economy (OSI)
157
D. W. O’Neill’s potential set of indicators to measure progress in the degrowth transition to a steady state economy (OSI)
Table AIII.44 Comparison between degrowth policy goals and O’Neill’s potential set of indicators.
Policy goals OSI Justification
Go
al 1
Create and protect shared public spaces
N
Encourage community-based sustainability initiatives and 'voluntary simplicity'
N
Decentralize and deepen democratic institutions
DP Level of trust and belonging, voice and accountability
Fight discrimination N
Fight crime N
Promote social cohesion and solidarity
N
Reduce working-time DT Working hours
Minify unemployment DT Unemployment rate
Improve local environment in deprived areas
N
Go
al 2
Reduce geographical labour mobility
N
Protect and invest in culture, sports and recreation
N
Investment in health and education
N

Annex III – Classification of the metrics analysed and its justification: D. W. O’Neill’s potential set of indicators to measure progress in the degrowth transition to a steady state economy (OSI)
158
Table AIII.45 Comparison between degrowth policy goals and O’Neill’s potential set of indicators (continuation).
Policy goals OSI Justification
Go
al 3
Identify clear resource and emission caps and establish reduction targets
DP CO2 emissions growth rate
Reduce waste emissions N
Reduce resource extraction N
Go
al 4
Decrease material use DT Direct material input growth rate (biomass, minerals, fossil fuels, water)
Decrease energy use N
Promote environmentally beneficial sectors
N
Incentive the use of public transportation or soft modes of transportation
N
Investment in better selected technical innovations
N
Investment in environmental and technological research
N
Reduce the 'delocalization of the economy' (transport of goods and men on the planet)
N
Go
al 5
Reduce non-essential consumption N
Promote a more conscientious consumption
N

Annex III – Classification of the metrics analysed and its justification: D. W. O’Neill’s potential set of indicators to measure progress in the degrowth transition to a steady state economy (OSI)
159
Table AIII.46 Comparison between degrowth policy goals and O’Neill’s potential set of indicators (continuation).
Policy goals OSI Justification
Go
al 6
Promote an environmentally friendly development
N
Investment in protection of 'carbon sinks' and biodiversity
IP Rate of EF to biocapacity
Increase material and energy use N
Promote benefit-sharing between north and south
N
Go
al 7
Avoid monopolies/promote competition N
Increase value of other types of capital N
Fight poverty DT % people living in poverty
Increase public control over the money supply
N
Reduce investment in inadequate infrastructures
IP Urban land area growth rate
Reform corporation charters to create more horizontality
IP Ratio of income of richest to poorest 10%
Reform the regulation of national and international financial markets
N
Revise income tax structures N