
Assessing Relationships Between Drug Shortages in the ...
135
C O R P O R A T I O N Research Report Assessing Relationships Between Drug Shortages in the United States and Other Countries Andrew W. Mulcahy, Preethi Rao, Vishnupriya Kareddy, Denis Agniel, Jonathan S. Levin, Daniel Schwam
Transcript of Assessing Relationships Between Drug Shortages in the ...

C O R P O R A T I O N
Research Report
Assessing Relationships Between Drug Shortages in the United States and Other Countries
Andrew W. Mulcahy, Preethi Rao, Vishnupriya Kareddy, Denis Agniel,
Jonathan S. Levin, Daniel Schwam

For more information on this publication, visit www.rand.org/t/RRA1070-1.
About RANDThe RAND Corporation is a research organization that develops solutions to public policy challenges to help make communities throughout the world safer and more secure, healthier and more prosperous. RAND is nonprofit, nonpartisan, and committed to the public interest. To learn more about RAND, visit www.rand.org.
Research IntegrityOur mission to help improve policy and decisionmaking through research and analysis is enabled through our core values of quality and objectivity and our unwavering commitment to the highest level of integrity and ethical behavior. To help ensure our research and analysis are rigorous, objective, and nonpartisan, we subject our research publications to a robust and exacting quality-assurance process; avoid both the appearance and reality of financial and other conflicts of interest through staff training, project screening, and a policy of mandatory disclosure; and pursue transparency in our research engagements through our commitment to the open publication of our research findings and recommendations, disclosure of the source of funding of published research, and policies to ensure intellectual independence. For more information, visit www.rand.org/about/principles.
RAND’s publications do not necessarily reflect the opinions of its research clients and sponsors.
Published by the RAND Corporation, Santa Monica, Calif.© 2021 RAND Corporation
is a registered trademark.
Limited Print and Electronic Distribution RightsThis document and trademark(s) contained herein are protected by law. This representation of RAND intellectual property is provided for noncommercial use only. Unauthorized posting of this publication online is prohibited. Permission is given to duplicate this document for personal use only, as long as it is unaltered and complete. Permission is required from RAND to reproduce, or reuse in another form, any of its research documents for commercial use. For information on reprint and linking permissions, please visit www.rand.org/pubs/permissions.

iii
About This Report
Drug shortages are a persistent public health problem in the United States and in other
countries. Shortages can have important implications for the health care systems and pharmacies
that purchase, store, and dispense drugs and for the patients who rely on the availability of drugs
to treat and prevent disease. Although prior analyses explore the frequency of drug shortages in
the United States, little is known about the extent to which U.S. drug shortages are associated
with shortages in other countries. This report describes the characteristics of drugs for which
there have been recent shortages in the United States. These drugs were identified using two
sources: the U.S. Food and Drug Administration’s Center for Drug Evaluation and Research and
the American Society of Health-System Pharmacists. We describe changes in U.S. volume,
price, and other metrics through the start of U.S. shortages and assess whether U.S. shortages are
associated with changes in volume, price, and other outcomes in other countries.
This research was funded by the U.S. Department of Health and Human Services, Office of
the Assistant Secretary for Planning and Evaluation, under Contract Number
HHSP233201500038I, and carried out within the Payment, Cost, and Coverage Program in
RAND Health Care.
RAND Health Care, a division of the RAND Corporation, promotes healthier societies by
improving health care systems in the United States and other countries. We do this by providing
health care decisionmakers, practitioners, and consumers with actionable, rigorous, objective
evidence to support their most complex decisions. For more information, see
www.rand.org/health-care, or contact
RAND Health Care Communications
1776 Main Street
P.O. Box 2138
Santa Monica, CA 90407-2138
(310) 393-0411, ext. 7775

iv
Acknowledgments
We thank Amber Jessup, Zeid El-Kilani, Allison Kolbe, Oluwarantimi Adetunji, and Trini
Beleche at the U.S. Department of Health and Human Services, Office of the Assistant Secretary
for Planning and Evaluation, for their contributions throughout our project and the development
of this report. We thank Erin Fox at the University of Utah for providing the American Society
of Health-System Pharmacists shortage data for our analysis. We also thank the peer reviewers
of this report, Kanaka Shetty and Marta Wosińska, for their suggestions and comments.

v
Summary
Drug shortages, which occur when the supply of drugs does not meet the demand, are a
persistent policy and public health concern in the United States and in other countries. Shortages
can adversely affect the quality and safety of care provided to patients, and they have
implications for morbidity and mortality (Butterfield et al., 2015; Mazer-Amirshahi et al., 2014;
Wiggins et al., 2014). Although there is broad international agreement about the importance of
mitigating or preventing drug shortages, approaches to defining and tracking shortages remain
fragmented, both within the United States and globally. As a result, the extent to which drug
shortages are truly global in nature (i.e., with a single shortage affecting many or all countries
simultaneously rather than narrower events affecting one or a few countries) is often unclear.
This distinction has important implications for the choice of policy and health care delivery
system strategies to respond to shortages. This report contributes to the developing literature on
the global scope of drug shortages by assessing whether U.S. drug shortages result in (1)
measurable changes in U.S. volume, price, and other metrics, and (2) measurable changes in the
same outcomes in other countries.
Overview of Drug Shortages
Prior studies describe many root causes of shortages, including shortages of inputs used to
manufacture drugs, disruptions at manufacturing facilities, cases in which demand increases
more quickly than supply, and business decisions to halt the manufacture of underperforming
products (U.S. Food and Drug Administration, Drug Shortages Task Force, 2020; Haninger,
Jessup, and Koehler, 2011; Woodcock and Wosińska, 2013). These prior studies also note
factors and conditions that might make shortages more likely, such as relatively low margins for
older, typically injected and infused generic drugs; underinvestment in manufacturing capacity;
and increasing financial pressure on suppliers to drug manufacturers.
There are two main databases of drug shortages in the United States, one of which is
maintained by the U.S. Food and Drug Administration’s (FDA’s) Center for Drug Evaluation
and Research and the other of which is maintained by the American Society of Health-System
Pharmacists (ASHP). The databases differ in their definitions of shortages, scope, and purpose.
The most fundamental difference is that FDA’s list is used to identify areas for FDA and other
policy intervention, while the ASHP database records disruptions in the activity of pharmacists
stocking drugs even when substitute products might be readily available.
Both industry and policymakers have an interest in identifying and addressing shortages
before they occur to the extent possible and, if this is not possible, certainly after shortages
begin. In the United States, FDA has primary responsibility for identifying and mitigating

vi
shortages. FDA has a variety of tools at its disposal, including regulatory discretion, the
importation of drugs into the United States when appropriate, and the coordination of
manufacturer responses to address shortages.
The prescription drug industry is increasingly global, with manufacturing and distribution
coordinated primarily by large, multinational companies and supply chains spanning the globe,
and it therefore stands to reason that at least some shortages are global in nature. We identified
the following three specific scenarios in which shortages have the potential to affect both U.S.
and other markets:
1. global disruptions in the supply of a crucial input
2. manufacturing disruption or discontinuation with global implications
3. unexpected global increase in demand.
According to prior analyses of U.S. shortages, only a small number of total shortages may fall
into one of these scenarios. In other cases, such as disruptions in manufacturing for facilities that
serve only the United States or North America, simultaneous effects in the United States and
other countries are unlikely.
The tools available to FDA (and to regulators in other countries) vary depending on the
geographic scope of the shortage and the time frame in which the shortage is playing out on a
global scale, among other factors. Despite the importance of a global perspective when assessing
drug shortages, most prior analyses of drug shortages use only U.S. data. This report assesses the
extent to which shortages in the United States are associated with changes in volume, prices, and
other outcomes in other countries.
Data and Methods
We standardized and combined the FDA and ASHP shortage databases to compile a single
database of U.S. shortages. The FDA and ASHP databases were originally at the National Drug
Code (NDC) level. We aggregated both databases to the “drug-form” level, which combines the
various strengths and pack sizes of a given molecule into a single record; each record represents
a molecule form (i.e., oral solid, oral liquid, injected or infused, or other). We created an analytic
data set describing how drug forms moved in and out of shortage in both databases individually
and combined over time from 2016 through 2019. We excluded shortages that were very short in
duration (i.e., less than 30 days) and shortages that could not be linked to a drug form.
We linked the analytic file to health information technology and clinical research company
IQVIA’s MIDAS drug market data to track changes in volume, price, manufacturer count, and
Herfindahl-Hirschman Index (HHI), a measure of market concentration, through changes in each
of the study shortages. We analyzed changes in these outcomes over a maximum of 12 different
intervals varying in terms of when measurement started (the quarter prior to the recorded start
date of the shortage, the quarter the shortage started, or the quarter after) and when measurement
ended (after one, two, three, or four quarters). For the purposes of this report, we focus on the

vii
interval from the quarter prior to the start of the shortage to the quarter after the start of the
shortage for many of our main results.
We characterized both shortage and nonshortage drug forms in terms of volume (more
specifically, preshortage volume for drugs in shortage), formulation, and market type (brand
name, single-source generic, or multisource generic) and found important differences between
shortage and nonshortage drugs on these dimensions. We reweighted nonshortage drug forms so
that they better matched shortage drug forms on observable characteristics. Weighting allowed
for more-direct comparisons of changes in outcomes between shortage and nonshortage drug
forms.
Our main results assess the extent to which other countries—specifically, the Group of Seven
(G7) countries (Canada, France, Germany, Italy, Japan, the United Kingdom, and the United
States) plus Australia—experience changes in volume, prices, manufacturer count, and HHI that
align with U.S. shortages. We estimate the average effect of U.S. shortages on other-country
volume and prices by regressing these outcomes on a U.S. shortage indicator and other
observables in random effects models.
Our main analyses cover all categories of prescription drugs. We present separate descriptive
analyses of shortages for the top 50 shortages in terms of U.S. reductions in volume and for two
groups of drugs experiencing persistent shortages in the United States: antimicrobial drugs and
immune globulin drugs. Both categories of drugs have a long history of shortages. We keep the
analysis of immune globulin at the product level because using the drug-form level would
essentially combine all immune globulin into one record.
Results
Our main analyses describe changes in volume, prices, manufacturer counts, and HHI for 261
drug-form shortages in 2016 through 2019. We found that relatively more shortages were listed
in the ASHP database than in the FDA database (175 of 261), which reflects differences in
scope, definition, and data availability. When pooling drug forms in shortage across the two
sources, we found that, compared with U.S. nonshortage drug forms, U.S. shortage drug forms
• were more likely to be infused or injected and less likely to be oral solid, oral liquid, or
other forms
• had lower quarterly sales
• had a volume that was approximately twice as high
• had more manufacturers
• had less concentrated (i.e., more competitive) markets
• were more likely to be generics.
Applying weights to nonshortage drugs resulted in the same distribution of forms and brand or
generic categories and relatively closer alignment in terms of volume between shortage and
nonshortage drug forms.

viii
We observed heterogeneous U.S. responses in terms of volume, price, number of
manufacturers, and HHI to U.S. shortages. Nearly as many drugs experienced increases in
volume through the onset of drug shortages compared with decreases. Although decreases in
volume are expected, increases might occur if the supply response to shortages is robust in the
event of intervention by FDA or other policymakers or in cases in which shortages are
attributable to increases in demand rather than disruptions to supply. On average, volume for
shortage drug forms decreased over intervals starting in the quarter prior to the shortage (with
magnitudes ranging from 4.9 to 8.7 percent, depending on the length of the time interval)
compared with small (less than 2-percent) increases for nonshortage drugs. U.S. prices increased
by up to 9.5 percent, on average, when measured from the quarter prior to the shortage or the
quarter in which the shortage started, with smaller increases when measurement starts in the
shortage quarter or the quarter after the shortage. We found few statistically significant average
changes in U.S. manufacturer count and HHI in response to shortages.
Many of the results observed in the United States for shortage drug forms relative to
nonshortage drug forms do not play out in other countries. In terms of volume, we found an
average 8.4-percent decline in volume from the quarter prior to the start of the shortage (Q – 1)
to the quarter after the start of the shortage (Q + 1) in the United States compared with a 1.0-
percent increase over the same period for nonshortage drugs (difference p < 0.001). Other
countries experienced smaller average declines for drug forms that were in shortage in the United
States (Figure S.1). In most cases, there was not a statistically significant difference between the
change in volume for shortage and nonshortage drug forms (Italy was an exception).1
Similarly, the average 7.3-percent price increase observed in the United States was much
larger than changes observed in other countries, and in no other country could we reject the null
hypothesis that the change in prices for shortage and nonshortage drug forms was zero (Figure
S.2). We found few statistically significant changes in manufacture counts or HHI in either the
United States or other countries.
1 Sample sizes are smaller and confidence intervals are wider for individual countries because we limit the analysis
to the subset of drug forms in U.S. shortage databases that also are sold in the other country. Not all drug forms are
sold in all countries.

ix
Figure S.1. Mean Percentage Change in Volume, Q − 1 to Q + 1, U.S. Shortage and Matched
Nonshortage Drugs
SOURCE: Authors’ analysis of FDA, ASHP, and IQVIA MIDAS data. NOTE: Increases are top-coded at 100 percent. Whiskers indicate 95-percent confidence intervals.
Figure S.2. Mean Percentage Change in Price, Q − 1 to Q + 1, U.S. Shortage and Matched
Nonshortage Drugs
SOURCE: Authors’ analysis of FDA, ASHP, and IQVIA MIDAS data. NOTE: Increases are top-coded at 100 percent. Whiskers indicate 95-percent confidence intervals.
We conducted additional analyses focusing on a subset of “top 50” U.S. drug-form shortages
meeting volume and sales thresholds ranked by the relative magnitude of the volume reduction
through the shortage in the United States. Although these top 50 U.S. shortage drug forms were
more likely than the average drug form to experience changes in volume and price, the
concordance between U.S. and other-country changes was generally low.
-8.4%
1.7%
-1.2% -2.3% -1.2%
-3.4%
1.4%1.9%
1.0%
5.1%
2.8%2.3% 2.2%
4.1%
1.6%2.3%
-15%
-10%
-5%
0%
5%
10%
US (n=239)Australia(n=149)
Canada(n=160)
France(n=168)
Germany(n=172) Italy (n=166)
Japan(n=151) UK (n=190)
Ave
rage
per
cen
tage
ch
ange
in
volu
me
Shortage Non-shortage
7.3%
1.2% 1.5%1.2%
-1.7%
0.2%
-0.7%
-2.9%
-0.4%
-1.7%
1.2%
-0.5%
0.1% 0.5%
-0.4%-1.6%
-8%
-6%
-4%
-2%
0%
2%
4%
6%
8%
10%
12%
US (n=239)Australia(n=149)
Canada(n=160)
France(n=168)
Germany(n=172) Italy (n=166)
Japan(n=151) UK (n=190)
Ave
rage
per
cen
t ch
ange
in p
rice
Shortage Non-shortage

x
Figure S.3 presents estimated coefficients from models regressing log quarterly volume on a
quarterly U.S. shortage flag and covariates. The magnitude of the estimated U.S. coefficient
varies because the number of matching U.S. drugs contributing to models varies depending on
the comparison country. In all cases, the estimated U.S. coefficient is negative and statistically
significant, which suggests that U.S. volume is lower, on average, for shortage quarters
compared with nonshortage quarters. For the U.S.-only model (top bar in the figure), shortage
quarters had, on average, 31.0-percent lower volume than nonshortage quarters. We found no or
muted reduction in volume during U.S. shortage quarters in other countries. Estimated
coefficients are negative and statistically significant (Australia at p = 0.001 and France at p =
0.006). The reductions in both countries are smaller than that in the United States.
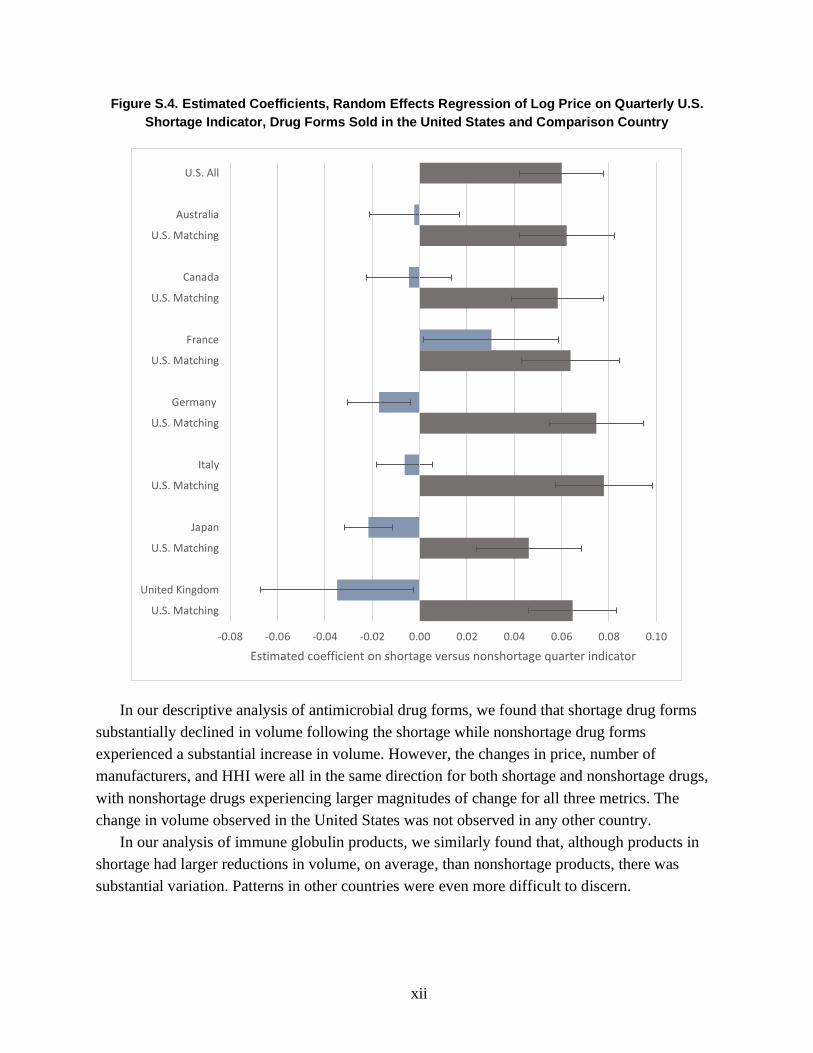
Figure S.4 presents similar estimated coefficients from models with log price as a dependent
variable. In this case, all of the estimated U.S. coefficients are positive and statistically
significant, suggesting that U.S. prices, on average, are higher during U.S. shortage quarters. In
the U.S.-only model, shortage quarters had prices that were 6.2-percent higher, on average, than
nonshortage quarters. As in the volume regressions, we found either no or smaller changes in
prices during U.S. shortage quarters in other countries compared with those in the United States.
Both Japan and Germany have statistically significant decreases in log prices over the shortage
interval (p < 0.001 and p = 0.013, respectively). France has a statistically significant increase in
log price (p = 0.037).

xi
Figure S.3. Estimated Coefficients, Random Effects Regression of Log Volume on Quarterly U.S.
Shortage Indicator, Drug Forms Sold in the United States and Comparison Country
-0.35 -0.30 -0.25 -0.20 -0.15 -0.10 -0.05 0.00 0.05 0.10
U.S. All
Australia
U.S. Matching
Canada
U.S. Matching
France
U.S. Matching
Germany
U.S. Matching
Italy
U.S. Matching
Japan
U.S. Matching
United Kingdom
U.S. Matching
Estimated coefficient on shortage versus nonshortage quarter indicator
xii
Figure S.4. Estimated Coefficients, Random Effects Regression of Log Price on Quarterly U.S.
Shortage Indicator, Drug Forms Sold in the United States and Comparison Country
In our descriptive analysis of antimicrobial drug forms, we found that shortage drug forms
substantially declined in volume following the shortage while nonshortage drug forms
experienced a substantial increase in volume. However, the changes in price, number of
manufacturers, and HHI were all in the same direction for both shortage and nonshortage drugs,
with nonshortage drugs experiencing larger magnitudes of change for all three metrics. The
change in volume observed in the United States was not observed in any other country.
In our analysis of immune globulin products, we similarly found that, although products in
shortage had larger reductions in volume, on average, than nonshortage products, there was
substantial variation. Patterns in other countries were even more difficult to discern.
-0.08 -0.06 -0.04 -0.02 0.00 0.02 0.04 0.06 0.08 0.10
U.S. All
Australia
U.S. Matching
Canada
U.S. Matching
France
U.S. Matching
Germany
U.S. Matching
Italy
U.S. Matching
Japan
U.S. Matching
United Kingdom
U.S. Matching
Estimated coefficient on shortage versus nonshortage quarter indicator

xiii
Discussion
We found broadly heterogeneous responses to drug shortages in the United States, with
increases and decreases in volume during the period surrounding the shortage about equally
likely. On average, U.S. shortages are associated with modest decreases in U.S. volume (about 8
percent) and modest increases in U.S. prices (about 7 percent). The volume reduction was
relatively larger for shortages included in both the FDA and ASHP databases.
Few of these U.S.-focused results aligned with measured changes over the same intervals in
comparison countries, even when limited to shortages with the largest impacts on U.S. markets.
Even when focusing on major U.S. shortages for drug forms with substantial U.S. preshortage
volume and the largest relative declines in U.S. volume, we rarely found corresponding changes
in other countries. These results mirror the results from our descriptive analyses of antimicrobial
and immune globulin drugs as well.
There are several implications of our findings for policy and future research on drug
shortages. First, we identified no systematic relationship between U.S. shortage events and
changes in outcomes in other countries. Although a small number of the top 50 U.S. shortages in
terms of decreases in volume did appear to play out on a global scale (e.g., in the case of
valsartan), most shortages in U.S. databases did not. Even when the same drugs were in shortage
in the United States and other countries, there was often a considerable temporal gap between
shortage events. These findings suggest that strategies leveraging supply from countries outside
the United States might be both promising and feasible to address most U.S. shortages. More
research on the geographic extent of drug shortages would be feasible if harmonized definitions
and data were available.
Second, only a small share of shortages listed in U.S. databases resulted in sizable declines in
U.S. volume, increases in U.S. prices, or both. Given the limitations of the available data and our
study, we were unable to assess whether the root cause of shortages is an important predictor of
the magnitude of changes in outcomes or whether intervention by FDA, health care delivery
systems, or others mitigated what otherwise would have been larger changes. FDA receives
more-detailed information about shortage causes when shortages are related to regulatory
warnings or enforcement actions and through voluntary manufacturer reporting. Given the
importance of understanding shortage causes to policymaking and research, FDA could perform
more analyses of shortages that focus on associations between shortage causes and outcomes,
and these analyses should be made available to the public. There could be an opportunity for
FDA and Congress to weigh the advantages and disadvantages of further public disclosure of
information about shortages. Furthermore, the federal government could consider collecting
more-detailed information about drug supply chains—for example, collecting information about
the volume of specific products manufactured at different facilities, as recent efforts driven by
executive orders set out to do.

xiv
Finally, we think that it is likely that a sizable share of shortages included in the ASHP
database are technical rather than practical shortages, although this distinction is not directly
addressed by our study. In other words, although some ASHP shortages technically record
difficulties faced by pharmacists in acquiring certain drug products or packages, they might not
result in practical changes in patient care because alternatives (e.g., a carton containing a
different number of vials than a package size in shortage) remain available. We stress that even
technical shortages might have important implications for quality of care and might involve costs
on the part of pharmacists and health care delivery systems to resolve. ASHP or other
organizations might be in a position to differentiate between technical and practical shortages.
xv
Contents
About This Report.......................................................................................................................... iii
Summary ......................................................................................................................................... v
Figures and Tables ...................................................................................................................... xvii
1. Introduction ................................................................................................................................. 1
The Uncertain Geographic Scope of Shortages ........................................................................................ 1
Defining a Drug Shortage ......................................................................................................................... 2
Prior Literature on U.S. Drug Shortages in the United States................................................................... 4 Prior Literature on Drug Shortages Outside the United States ................................................................. 5
Data Limitations as a Challenge to Assessing the Global Extent of Shortages ........................................ 6
Report Overview ....................................................................................................................................... 6
2. Drug Shortage Conceptual Framework ...................................................................................... 7
Framework to Characterize Drug Shortages ............................................................................................. 7 Implications of the Framework for Empirical Analysis .......................................................................... 12
Illustrative Examples of Specific U.S. Drug Shortages .......................................................................... 12
Examples of Broader, Ongoing Drug Shortages in the United States .................................................... 17
3. Data and Empirical Methods .................................................................................................... 19
Combining ASHP and FDA Data Sets .................................................................................................... 19
Combining the Shortage Analytic File with IQVIA MIDAS Data ......................................................... 21 Calendar Time Analytic File ................................................................................................................... 22
Event Time Analytic File ........................................................................................................................ 23
Analyses and Reporting Results .............................................................................................................. 24
4. Results ....................................................................................................................................... 26
Counts and Characteristics of Drugs on U.S. Shortage Lists .................................................................. 26 Associations Between U.S. Shortages and U.S. Outcomes .................................................................... 31
Associations Between Changes in Outcomes in the United States and in Other Countries ................... 34
Analyses of the Top 50 U.S. Shortages by Magnitude of Volume Reduction ........................................ 42
Results for Antimicrobial Drugs ............................................................................................................. 44 Results for Immune Globulin Products ................................................................................................... 45
Estimated Coefficients from Regression Models .................................................................................... 45
Summary of Results ................................................................................................................................ 47
5. Discussion and Conclusion ....................................................................................................... 49
Limitations .............................................................................................................................................. 50 Assessment of the Global Nature of Drug Shortages .............................................................................. 51
Conclusion ............................................................................................................................................... 55
Appendix A. Overview of Drug Shortage Definitions and Databases ......................................... 56
Appendix B. Illustrative Drug Shortage Examples....................................................................... 67
Appendix C. Antimicrobial and Immune Globulin Data and Methods ........................................ 76

xvi
Appendix D. Supplemental Results .............................................................................................. 78
Appendix E. Results for Antimicrobial Drugs .............................................................................. 85
Appendix F. Full Results for Immune Globulin Products ............................................................ 95
Abbreviations .............................................................................................................................. 106
References ................................................................................................................................... 107
xvii
Figures and Tables
Figures
Figure S.1. Mean Percentage Change in Volume, Q − 1 to Q + 1, U.S. Shortage and Matched
Nonshortage Drugs ................................................................................................................ ix
Figure S.2. Mean Percentage Change in Price, Q − 1 to Q + 1, U.S. Shortage and Matched
Nonshortage Drugs ................................................................................................................ ix
Figure S.3. Estimated Coefficients, Random Effects Regression of Log Volume on Quarterly
U.S. Shortage Indicator, Drug Forms Sold in the United States and Comparison
Country .................................................................................................................................. xi
Figure S.4. Estimated Coefficients, Random Effects Regression of Log Price on Quarterly
U.S. Shortage Indicator, Drug Forms Sold in the United States and Comparison
Country ................................................................................................................................. xii
Figure 2.1. Geographic Scope of Shortage Causes Versus Effects .............................................. 10
Figure 2.2. Belatacept Volume Trends, 2014–2019 ..................................................................... 13
Figure 2.3. Valsartan and Losartan Volume Trends, 2014–2019 ................................................. 14
Figure 2.4. Heparin and Heparin Sodium Volume Trends, 2014–2019 ....................................... 15
Figure 2.5. Heparin Sodium Volume Trends, 2014–2019, by Manufacturer ............................... 16
Figure 2.6. Tamsulosin Hydrochloride Volume Trends, 2014–2019, by Manufacturer .............. 17
Figure 4.1. Count of Drug Forms Entering First Recorded Shortage, by Calendar Quarter ........ 28
Figure 4.2. Distribution of Changes in Volume, Price, and HHI for Shortage and
Nonshortage Drugs, Q − 1 to Q + 1 ...................................................................................... 31
Figure 4.3. Average Changes in Volume, Price, and HHI for Shortage and Nonshortage
Drugs, Q − 1 to Q + 1 ........................................................................................................... 32
Figure 4.4. Mean Percentage Change in Volume, Q − 1 to Q + 1, Shortage and Matched
Nonshortage Drugs ............................................................................................................... 35
Figure 4.5. Mean Percentage Change in Price, Q − 1 to Q + 1, Shortage and Matched
Nonshortage Drugs ............................................................................................................... 36
Figure 4.6. Mean Change in Manufacturer Count, Q − 1 to Q + 1, Shortage and Matched
Nonshortage Drugs ............................................................................................................... 36
Figure 4.7. Mean Percentage Change in HHI, Q − 1 to Q + 1, Shortage and Matched
Nonshortage Drugs ............................................................................................................... 37
Figure 4.8. Estimated Coefficients, Random Effects Regression of Log Volume on
Quarterly Shortage Indicator, Drug Forms Sold in the United States and Comparison
Countries ............................................................................................................................... 46

xviii
Figure 4.9. Estimated Coefficients, Random Effects Regression of Log Price on Quarterly
Shortage Indicator, Drug Forms Sold in the United States and Comparison Countries ....... 47
Figure B.1. Belatacept Volume Trends, 2014–2019..................................................................... 69
Figure B.2. Belatacept Volume Trends, 2014–2019, Countries Excluding the United States ..... 69
Figure B.3. Valsartan and Losartan Volume Trends, 2014–2019, Countries Excluding the
United States ......................................................................................................................... 71
Figure B.4. Heparin and Heparin Sodium Volume Trends, 2014–2019 ...................................... 73
Figure B.5. Heparin Sodium Volume Trends, 2014–2019, by Manufacturer .............................. 73
Figure B.6. Tamsulosin Hydrochloride Volume Trends, 2014–2019, by Manufacturer .............. 75
Figure D.1. Distribution of the Percentage Change in Volume, Q − 1 to Q + 1, Shortage and
Matched Nonshortage Drugs ................................................................................................ 78
Figure D.2. Average Percentage Change in Volume over 12 Time Intervals, Shortage and
Matched Nonshortage Drugs ................................................................................................ 79
Figure D.3. Distribution of the Percentage Change in Price, Q − 1 to Q + 1, Shortage and
Matched Nonshortage Drugs ................................................................................................ 81
Figure D.4. Average Percentage Change in Price over 12 Time Intervals, Shortage and
Matched Nonshortage Drugs ................................................................................................ 81
Figure D.5. Distribution of the Change in HHI, Q − 1 to Q + 1, Shortage and
Matched Nonshortage Drugs ................................................................................................ 83
Figure D.6. Average Percentage Change in HHI over 12 Time Intervals, Shortage and
Matched Nonshortage Drugs ................................................................................................ 84
Figure E.1. Distribution of the Percentage Change in Volume, Q − 1 to Q + 1, Shortage
and Matched Nonshortage Drugs.......................................................................................... 88
Figure E.2. Distribution of the Percentage Change in Price, Q − 1 to Q + 1, Shortage
and Matched Nonshortage Drugs.......................................................................................... 89
Figure E.3. Distribution of the Change in the Count of Manufacturers, Q − 1 to Q + 1,
Shortage and Matched Nonshortage Drugs .......................................................................... 90
Figure E.4. Distribution of the Percentage Change in HHI, Q − 1 to Q + 1, Shortage and
Matched Nonshortage Drugs ................................................................................................ 91
Figure E.5. Mean Percentage Change in Volume, Q − 1 to Q + 1, Shortage and
Nonshortage Drugs ............................................................................................................... 92
Figure E.6. Mean Percentage Change in Price, Q − 1 to Q + 1, Shortage and Nonshortage
Drugs ..................................................................................................................................... 93
Figure E.7. Mean Change in Manufacturer Count, Q − 1 to Q + 1, Shortage and
Nonshortage Drugs ............................................................................................................... 93
Figure E.8. Mean Percentage Change in HHI, Q − 1 to Q + 1, Shortage and Nonshortage
Drugs ..................................................................................................................................... 94
Figure F.1. U.S. Volume of Immune Globulin Products in Shortage ........................................... 97

xix
Figure F.2. U.S. Volume of Immune Globulin Products in Shortage, 2010–2019 ....................... 98
Figure F.3. U.S. Price of Immune Globulin Products in Shortage ............................................... 99
Figure F.4. U.S. Prices of Immune Globulin Products in Shortage, 2010–2019 ........................ 100
Figure F.5. Mean Percentage Change in Volume, Q − 1 to Q + 1, Shortage and
Nonshortage Drugs ............................................................................................................. 104
Figure F.6. Mean Percentage Change in Price, Q − 1 to Q + 1, Shortage and Nonshortage
Drugs ................................................................................................................................... 105
Tables
Table 2.1. Framework to Characterize Drug Shortages .................................................................. 7
Table 3.1. Counts of Shortages and National Drug Codes Excluded by Step, by Source ............ 20
Table 4.1. Number of Shortages on FDA and ASHP Lists at Different Levels of
Aggregation........................................................................................................................... 26
Table 4.2. Drug-Form Shortage Exclusions ................................................................................. 27
Table 4.3. Formulation of Shortage Versus Nonshortage Drug Forms ........................................ 28
Table 4.4. Quarterly Market Descriptive Statistics, Shortage Versus Nonshortage
Drug Forms ........................................................................................................................... 29
Table 4.5. Preshortage Market Characteristics, Shortage Versus Matched Nonshortage Drug
Forms .................................................................................................................................... 30
Table 4.6. Average Change in Volume, Price, Manufacturers, and HHI, Q − 1 to Q + 1 ............ 34
Table 4.7. Comparison of U.S. and Other-Country Changes in Volume from Q − 1 to Q + 1,
by Shortage Drug-Form Category ........................................................................................ 39
Table 4.8. Comparison of U.S. and Other-Country Changes in Price from Q − 1 to Q + 1,
by Shortage Drug-Form Category ........................................................................................ 40
Table 4.9. Average Change in Volume for Top 50 Shortage Drug Forms, Q − 1 to Q + 1 .......... 42
Table 4.10. Number of Top 50 U.S. Shortage Drug Forms by Volume Change in Other
Countries, Q − 1 to Q + 1 ...................................................................................................... 43
Table 4.11. Volume Changes in Other Countries for U.S. Shortages, Q − 1 to Q + 1 ................. 43
Table 4.12. Average Change in Volume for Top 50 Drugs, Q − 2 to Q0, Q0 to Q + 2................ 44
Table A.1. Non-U.S. Drug Shortage Databases with Information Available in English ............. 57
Table A.2. Characteristics of Other Countries’ Shortage Databases ............................................ 63
Table D.1. Descriptive Statistics, Percentage Change in Volume for Shortage Drugs over
12 Intervals............................................................................................................................ 80
Table D.2. Descriptive Statistics, Percentage Change in Price for Shortage Drugs over
12 Intervals............................................................................................................................ 82
Table D.3. Descriptive Statistics, Change in Manufacturers for Shortage Drugs over
12 Intervals............................................................................................................................ 83

xx
Table D.4. Descriptive Statistics, Percentage Change in HHI for Shortage Drugs over
12 Intervals............................................................................................................................ 84
Table E.1. Characteristics of Shortage and Nonshortage Drug Forms ......................................... 86
Table E.2. Mean Changes in Volume, Price, Number of Manufacturers, and HHI,
Q − 1 to Q + 1 ....................................................................................................................... 87
Table E.3. Number of Shortage and Nonshortage Antimicrobials in Countries of Interest ......... 92
Table F.1. Immune Globulin Products Sold in the United States ................................................. 95
Table F.2. Percentage Change in U.S. Volume Among Immune Globulin Products in
Shortage .............................................................................................................................. 101
Table F.3. Percentage Change in U.S. Price Among Immune Globulin Products in
Shortage .............................................................................................................................. 102
Table F.4. Percentage Change in U.S. Volume Among Immune Globulin Products Not in
Shortage .............................................................................................................................. 103
Table F.5. Percentage Change in U.S. Price Among Immune Globulin Products Not in
Shortage .............................................................................................................................. 103
Table F.6. Number of Immune Globulin Products Available in Key Countries of Interest ....... 104
1
1. Introduction
Drug shortages are a persistent public health problem in the United States. The U.S. Food
and Drug Administration (FDA) listed 127 active ingredients as being in shortage during all or
part of 2019 (Hahn, 2020). Of these 127 active ingredients, 51 were new shortages emerging
during the year and the remaining 76 were unresolved shortages from previous years. Clinicians
have reported that drug shortages compromise the quality and safety of care for patients (Institute
for Safe Medication Practices, 2010), and shortages might result in greater morbidity and
mortality among patients (Butterfield et al., 2015; Mazer-Amirshahi et al., 2014; Wiggins et al.,
2014). In addition to impacts on patients, the annual labor costs resulting from U.S. drug
shortages are estimated to be $359 million as clinicians and pharmacists attempt to secure the
supply of drugs in shortage or shift patients to available alternatives (Vizient, 2019).
The Uncertain Geographic Scope of Shortages
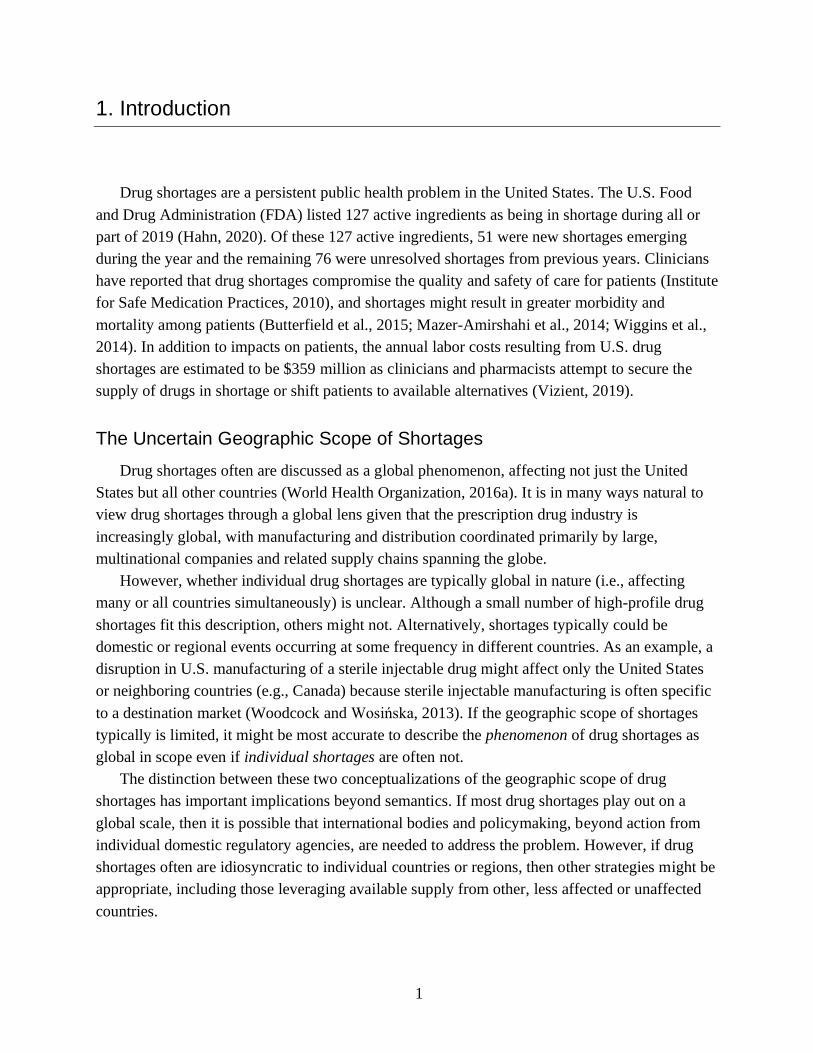
Drug shortages often are discussed as a global phenomenon, affecting not just the United
States but all other countries (World Health Organization, 2016a). It is in many ways natural to
view drug shortages through a global lens given that the prescription drug industry is
increasingly global, with manufacturing and distribution coordinated primarily by large,
multinational companies and related supply chains spanning the globe.
However, whether individual drug shortages are typically global in nature (i.e., affecting
many or all countries simultaneously) is unclear. Although a small number of high-profile drug
shortages fit this description, others might not. Alternatively, shortages typically could be
domestic or regional events occurring at some frequency in different countries. As an example, a
disruption in U.S. manufacturing of a sterile injectable drug might affect only the United States
or neighboring countries (e.g., Canada) because sterile injectable manufacturing is often specific
to a destination market (Woodcock and Wosińska, 2013). If the geographic scope of shortages
typically is limited, it might be most accurate to describe the phenomenon of drug shortages as
global in scope even if individual shortages are often not.
The distinction between these two conceptualizations of the geographic scope of drug
shortages has important implications beyond semantics. If most drug shortages play out on a
global scale, then it is possible that international bodies and policymaking, beyond action from
individual domestic regulatory agencies, are needed to address the problem. However, if drug
shortages often are idiosyncratic to individual countries or regions, then other strategies might be
appropriate, including those leveraging available supply from other, less affected or unaffected
countries.

2
The aim of this report is to explore the extent to which U.S. drug shortages result in (1)
measurable changes in U.S. volume, price, and other metrics; and (2) measurable changes in the
same outcomes in other countries. We do this by combining information from two U.S. drug
shortage databases, one of which is from FDA and the other of which is maintained by the
American Society of Health-System Pharmacists (ASHP), with international prescription drug
market data from IQVIA’s MIDAS database. Our findings describe the geographic extent of U.S.
shortages and will help policymakers better assess which tools may be most appropriate to
mitigate shortages.
Defining a Drug Shortage
Conceptually, drug shortages are instances in which the supply of a drug does not meet the
demand at a given price. In practice, there are a variety of supply-chain and market scenarios that
can lead to this outcome, including
• production disruptions stemming from quality issues, a lack of available inputs, or
diminished manufacturing capacity because of other reasons, such as natural disasters
• disruptions in shipments of drugs to distributors or from distributors to dispensing
locations
• growth in demand that cannot be met by supply in the short term
• manufacturer business decisions—for example, decisions to discontinue products.
Shortages can lead to changes in
• the number of manufacturers producing a drug
• market concentration (i.e., whether production is concentrated in a small number of
manufacturers or spread over many)
• the volume of drug produced
• prices paid by wholesalers, pharmacies, and other points of dispensing, and
potentially by patients
• demand for and prices of substitutes.
The directionality of effects on each outcome varies depending on the cause, characteristics, and
context surrounding an individual shortage and the period over which the change in outcome is
measured. In the long run, changes in the availability and prices of shortage drugs can lead to
implications for patients in terms of health outcomes. We discuss the likely effects of shortages
with different root causes on U.S. and other-country markets in Chapter 2.
Technical Versus Practical Shortages
Whether a shortage exists depends on the perspective of the stakeholder assessing supply
relative to demand. Pharmacists and health care delivery systems might perceive a shortage when
they are unable to procure and stock their desired mix and volume of products, even if
prescribers and patients are ultimately unaffected. For example, a discontinued package size

3
(e.g., a box of 20 syringes of a particular drug product) might technically result in a shortage if
buyers can no longer order the specific package size, even if alternative package sizes (e.g., a
box of 40 syringes) are available from the same manufacturer or other manufacturers. In other
cases, for example, when the only manufacturer of a drug to treat a disease or condition ceases
production for an extended period, all stakeholders, including those procuring drugs, prescribers,
and patients, likely would agree that supply does not meet demand, and practical impacts on
patients would be certain or more likely.
Throughout this report, we differentiate between technical shortages, which are mismatches
between supply and demand but do not have immediate implications on patient care, and
practical shortages, which have real-world effects on prescribers and patients, such as delayed or
unfilled prescriptions and substitutions with alternative drugs. Policymakers are more likely to be
interested in exploring approaches to address practical versus technical shortages. Technical
shortages might be more likely to be corrected by the market without policy intervention.
However, technical shortages could offer important signals regarding market trends and the
fragility of prescription drug supply chains that likely also will be of interest to policymakers.
We return to a discussion of the importance of defining drug shortages in the final section of this
report.
Approaches to Identifying Shortages in U.S. Shortage Databases
There are two primary U.S. databases with information about drug shortages, one of which is
maintained by FDA’s Center for Drug Evaluation and Research (CDER) and the other of which
is maintained by ASHP.2 The two databases vary in purpose and in the scope of shortages
included.
The FDA database (FDA, undated-b) lists drugs that have experienced “market-wide”
production disruptions, meaning that manufacturers cannot meet the current market demand for
the drug (ASHP, 2014). To make this determination, FDA considers the following factors: the
market share of the forms in disruption, inventory of the manufacturers, monthly rate of demand,
manufacturing schedules, and changes in ordering patterns of the products of interest. In most
cases, FDA defines a market-wide shortage at the ingredient-route level, to exclude disruptions
that are limited to a specific dosage or package size when other forms of the same ingredients are
still available (Wosińska, Fox, and Jensen, 2015). Together, the FDA criteria likely flag
primarily practical shortages with implications for patients and policy rather than purely
technical shortages.
2 Both CDER and the Center for Biologics Evaluation and Research (CBER) within FDA maintain shortage lists.
For the purposes of the analyses conducted in this report, we used only the FDA CDER database because the FDA
CBER database is not readily available in a format to be used by researchers. However, the ASHP database captures
both conventional and biologic drugs (ASHP, undated-b).

4
The ASHP database is assembled differently and reflects a different perspective than that of
the FDA database. Pharmacists report shortages to ASHP when they face barriers ordering
products defined at the National Drug Code (NDC) level, which is specific to a detailed finished
package size (e.g., a ten-vial carton of a specific formulation and strength of a drug from a
specific manufacturer), even if another package size from the same manufacturer (e.g., a 20-vial
carton) or a different and potentially substitutable form or strength of the drug remains available.
ASHP confirms shortages with manufacturers before they are listed in the database.
Although practical shortages likely are recorded in both the FDA and ASHP databases,
technical shortages are more likely to be listed only in the ASHP database, and, as a result, we
expect more shortages to be listed in the ASHP database than the FDA database. The surplus
technical shortages listed in the ASHP database likely reflect a broader variety of manufacturer
and distributor business decisions (such as discontinuations of specific products while others
remain available) and temporary supply-chain disruptions than those listed in the FDA database.
Importantly, applying the FDA or ASHP criteria involves some degree of subjectivity, either in
determining what constitutes a market-wide disruption in the case of FDA or in confirming
whether pharmacist-reported disruptions constitute a shortage in the case of ASHP.
Prior Literature on U.S. Drug Shortages in the United States
Drug shortages are a long-standing policy and clinical concern, and there is a substantial
prior body of work focusing on U.S. shortages. A 2011 report from the U.S. Department of
Health and Human Services, Office of the Assistant Secretary for Planning and Evaluation
(ASPE) describes the causes of drug shortages through 2008 (Haninger, Jessup, and Koehler,
2011). The ASPE report notes that many shortages are attributable to rapid increases in demand
for drugs without the industry capacity to meet this greater demand in the short term.
Woodcock and Wosińska, 2013, notes that many U.S. shortages are of sterile injectable drugs
and hypothesizes that a lack of market rewards for quality is the root cause of many sterile
injectable shortages. The authors point to several contributing factors, including increasing price
competition, aging and specialized manufacturing facilities, and contracting practices that can
lead to quality problems—which, in turn, can precipitate supply disruptions and shortages.
In its recent analysis of shortages among drugs regulated by CDER, FDA found that drugs
administered via injection were more likely to be in shortage than those with other routes of
administration and that generic drugs were more likely to be in shortage than branded drugs
(FDA, Drug Shortages Task Force, 2020). The majority of drug shortages in FDA’s CDER
database were attributable to manufacturing or product quality issues rather than other issues,
such as increases in demand and natural disasters. Using these findings, FDA concluded that
there were three root causes of drug shortages among suppliers: (1) a lack of incentive for
manufacturers to produce less profitable drugs, (2) a lack of incentive to improve supply chains

5
or detect supply-chain issues early, and (3) logistic and regulatory challenges that make it
difficult for the market to recover from a shortage.
The FDA Drug Shortages Task Force report included results from an analysis of price and
utilization of shortage and nonshortage drugs in the United States. Using January 2010 to August
2018 data from IQVIA’s National Sales Perspective database, the authors found that 53 percent
of FDA-listed shortage medications experienced declines in revenue and 47 percent experienced
increases in revenue before shortage occurrence. Among all drugs that were experiencing
decreasing revenues prior to the shortage, shortage drugs experienced greater declines in revenue
and price compared with nonshortage drugs. Among all drugs with increasing revenues, shortage
drugs experienced greater increases in revenue and volume prior to shortage occurrence
compared with nonshortage drugs (FDA, Drug Shortages Task Force, 2020). After shortage
occurrence, a majority of shortage drugs did not experience responses that would mitigate the
shortage. Specifically, 42 percent had significant production increases, and only 30 percent had
their supply restored to at least 100 percent of the preshortage level. Of all drugs in shortage, 18
percent experienced sustained price increases.
Other studies have found that drugs in shortage in the United States, on average, had lower
prices prior to shortage occurrence than nonshortage medications (Alevizakos et al., 2016; Dave
et al., 2018; Hernandez et al., 2019; Yurukoglu, Liebman, and Ridley, 2017), that drugs flagged
as in shortage in the ASHP database were more likely to experience price increases compared
with drugs that were not in shortage (Alevizakos et al., 2016; Dave et al., 2018), and that
shortages leading to price increases were shorter in duration than those without price increases
(Yurukoglu, Liebman, and Ridley, 2017). Taken together, these findings suggest that, in some
cases, manufacturers have leverage to increase prices for drugs in shortage and that these price
increases could subsequently incentivize entry into the market.
Prior Literature on Drug Shortages Outside the United States
Several studies compare the characteristics of drugs in shortage in the United States with
those of drugs in shortage in other countries. For example, in their scoping review, Acosta and
colleagues found that drugs treating the nervous system were the most frequent therapeutic class
in shortage in the United States, Belgium, Israel, Canada, and China, whereas anti-infectives
were the most frequent shortage class for South America and Australia (Acosta et al., 2019).
Similar to the United States, such countries as Australia, Canada, China, and Israel also have
experienced a high proportion of their shortage drugs as injectables (Gray and Manasse, 2012;
Kaposy, 2014; Schwartzberg et al., 2017). In contrast, Pauwels and colleagues found that drug
shortages in the European Union were more likely to be for drugs that are administered orally
than for drugs administered via injection and were more likely to be for brand-name rather than
generic drugs (Pauwels et al., 2014). A notable limitation of all of these studies is the variation in
how countries define and report shortages.

6
Data Limitations as a Challenge to Assessing the Global Extent of
Shortages
We did not identify any studies comparing the specific drugs in shortage in the United States
with those in other countries or, for common drugs in shortage, the timing of shortages across
countries. Relatedly, we did not find any studies assessing changes in such outcomes as volume
and price in other countries in response to U.S. shortages.
The lack of studies in this area is likely a result of fragmented and incomplete data on drug
shortages across countries. As part of our study, we reviewed approaches used to identify and
document drug shortages in countries other than the United States. Although many countries
track shortages domestically, each uses a different approach to identify and document shortages,
complicating systematic analysis across countries. In general, we found inconsistent definitions
and fragmented data, with no other shortage database easily accessible for analyses comparing
the specific drugs in shortage in the United States and in other countries or the timing of
shortages in the United States with that of other countries. See Appendix A for a more detailed
comparison of the FDA and ASHP databases and a summary and assessment of shortage listings
and databases available from other countries. Using our findings, we decided to focus our
empirical results on a set of U.S. shortages assembled by combining the FDA and ASHP data
sets despite the differences in scope and definitions between the two databases as described
earlier.
Report Overview
The remainder of this report describes our efforts to assess the geographic scope of drug
shortages recorded in U.S. shortage databases. Chapter 2 introduces a framework describing how
and when effects from U.S. shortages might be observed in other countries. Chapter 3 describes
data sources and methods for empirical analyses. Chapter 4 reports results on the implications of
shortages (based on U.S. shortage lists and the timing of shortages in the United States) in terms
of volume and prices in the United States and explores associations between U.S.-listed
shortages and outcomes in terms of volume and price changes in other countries. Our analyses
rely on an extract of IQVIA’s MIDAS database that includes data on prescription drug sales in
the United States and in other countries. Our discussion in Chapter 5 highlights key findings and
potential next steps for policy and research. Appendixes A through F provide more definitions
and examples from the data, along with full results from our analysis.
7
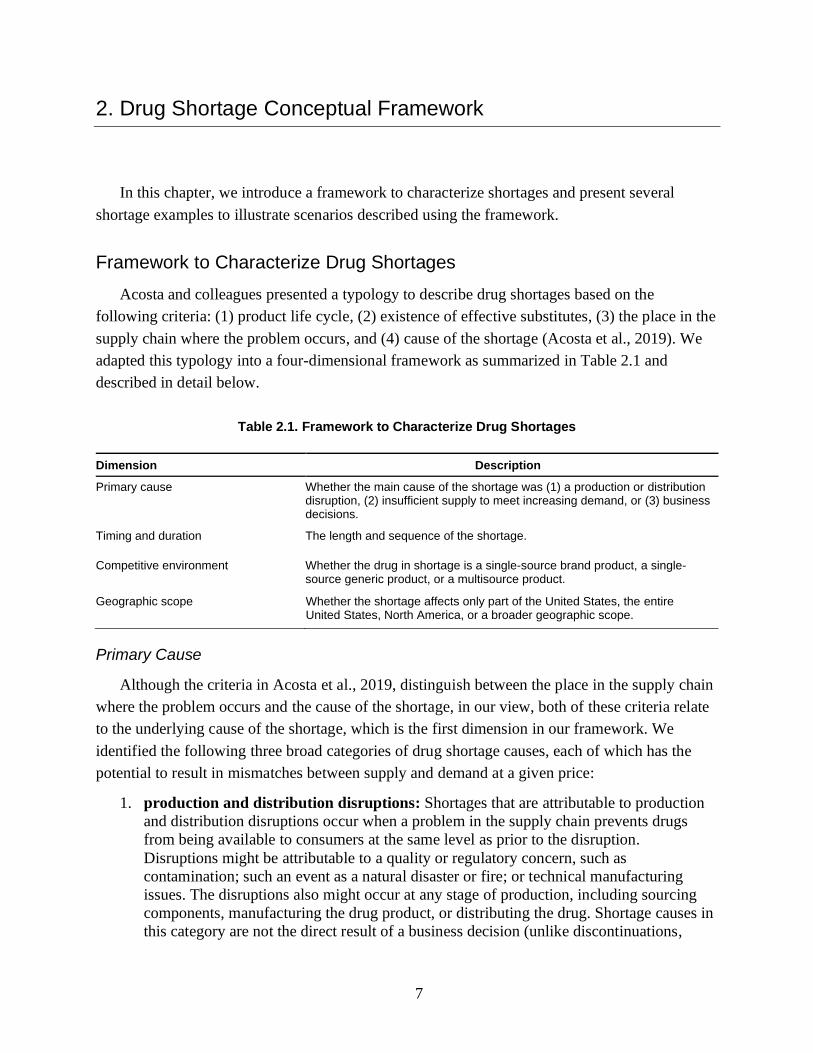
2. Drug Shortage Conceptual Framework
In this chapter, we introduce a framework to characterize shortages and present several
shortage examples to illustrate scenarios described using the framework.
Framework to Characterize Drug Shortages
Acosta and colleagues presented a typology to describe drug shortages based on the
following criteria: (1) product life cycle, (2) existence of effective substitutes, (3) the place in the
supply chain where the problem occurs, and (4) cause of the shortage (Acosta et al., 2019). We
adapted this typology into a four-dimensional framework as summarized in Table 2.1 and
described in detail below.
Table 2.1. Framework to Characterize Drug Shortages
Dimension Description
Primary cause Whether the main cause of the shortage was (1) a production or distribution disruption, (2) insufficient supply to meet increasing demand, or (3) business decisions.
Timing and duration The length and sequence of the shortage.
Competitive environment Whether the drug in shortage is a single-source brand product, a single-source generic product, or a multisource product.
Geographic scope Whether the shortage affects only part of the United States, the entire United States, North America, or a broader geographic scope.
Primary Cause
Although the criteria in Acosta et al., 2019, distinguish between the place in the supply chain
where the problem occurs and the cause of the shortage, in our view, both of these criteria relate
to the underlying cause of the shortage, which is the first dimension in our framework. We
identified the following three broad categories of drug shortage causes, each of which has the
potential to result in mismatches between supply and demand at a given price:
1. production and distribution disruptions: Shortages that are attributable to production
and distribution disruptions occur when a problem in the supply chain prevents drugs
from being available to consumers at the same level as prior to the disruption.
Disruptions might be attributable to a quality or regulatory concern, such as
contamination; such an event as a natural disaster or fire; or technical manufacturing
issues. The disruptions also might occur at any stage of production, including sourcing
components, manufacturing the drug product, or distributing the drug. Shortage causes in
this category are not the direct result of a business decision (unlike discontinuations,

8
which are introduced below). However, business decisions, such as strategies to source
inputs, investments in manufacturing equipment and infrastructure, and quality control,
can contribute to the likelihood of production and distribution disruptions.
2. insufficient supply to meet increasing demand: Shortages in this category could occur
because of such factors as an increase in incidence or a change in therapeutic indications
for a certain disease that induces increases in demand for a drug to treat the condition, but
manufacturers are unable to scale up supply at a rate that would meet the excess demand.
3. business decisions: Companies often adjust their portfolio of products in response to
market signals and other factors. Companies might decrease manufacturing volume or
discontinue individual package sizes or entire product lines, in some cases shifting
manufacturing capacity to more-profitable products.
There might be other factors beyond the primary cause that contribute to individual drug
shortages. For example, some drug manufacturers might not have enough resiliency in their
supply chains or manufacturing operations to cope with disruptions. The lack of excess capacity
or risk-mitigation strategies could therefore contribute to a shortage even if it is not the primary
cause. Woodcock and Wosińska, 2013, discusses a variety of additional contributing factors that
are specific to shortages of sterile injectable drugs.
The typical changes in volume, price, and other outcomes through a shortage likely will vary
by cause and over time. For example, a shortage because of manufacturing disruption might lead
to
• an initial reduction in volume for the affected manufacturer(s) followed by a recovery at
the end of the shortage
• price increases reflecting the mismatch between supply and demand
• potentially fewer manufacturers observed in the MIDAS data (if manufacturing ceases
entirely) in the short term
• a change in market concentration in either direction3
• increases in utilization of substitute products.
Shortages because of product discontinuations have more-predictable effects on some measured
outcomes (e.g., fewer manufacturers), while changes in other outcomes, such as volume and
price, depend on the strategic responses by remaining manufacturers or new entrants. In the case
of shortages that are attributable to insufficient supply to meet increasing demand, volume likely
increases over time prior to—and even during—the shortage, while prices likely increase.
Timing and Duration
The duration of a shortage and whether a drug experiences recurring shortages can help
determine the magnitude of the public health problem the shortage has caused and can be
3 Changes in market concentration are ambiguous and depend on both preshortage conditions and the context of
each individual shortage. For example, if there are multiple manufacturers of a shortage drug and the dominant
manufacturer lowers but does not cease production, then market concentration would decrease. However, if the
dominant manufacturer stops production entirely, then measured market concentration might increase.

9
indicative of the misaligned incentives that cause longer shortages. Importantly, for longer or
recurring shortages, the directionality and magnitude of changes in volume, prices, and other
outcomes might vary over time because of industry, clinical, or policy responses. For example,
the entry of new manufacturers to address an ongoing shortage, either as a response to market
conditions or via policy intervention, could result in higher volume, more manufacturers, less
concentrated markets, and lower prices in the longer term.4 In general, both industry and policy
responses to shortages are more likely to occur the longer a shortage persists.
Competitive Environment
Two criteria in Acosta et al., 2019, product life cycle and the existence of effective
substitutes, both relate to the competitive environment. The following are three main categories
of competitive markets in prescription drugs:
1. single-source originator markets are cases in which there is only one company
manufacturing a drug in cases in which patents and/or regulatory exclusivity prohibit
competition.
2. single-source generic markets are cases in which there is only one company
manufacturing a drug but without legal and regulatory barriers to competition. This
scenario might evolve in a previously competitive market in which all but one
manufacturer exits because of financial or other pressures.
3. multisource markets are cases in which there are multiple competing manufacturers of a
drug, including cases in which the originator company is one of the competitors.
These categories apply at the level of a drug product, which we define as a combination of active
ingredient, formulation, and dosage strength. An individual drug product often has at least some
potential substitutes that can be different presentations of the same active ingredient (e.g., a
different formulation or dosage strength of the same active ingredient) or different active
ingredients entirely that might have similar pharmacological action (e.g., different antibiotics).
Geographic Scope
The framework in Acosta et al., 2019, does not explicitly address the geographic scope of
shortages. Conceptually, both the causes and potential effects of shortages can vary in
geographic scope (Figure 2.1). Although some shortage causes, such as natural disasters or a
plant closure, affect only a small geographic area, the effects from resulting shortages can be
global, particularly when the affected area or firm plays an integral role in the global supply
chain for a drug. For example, if there is only one global supplier of a specific active
pharmaceutical ingredient (API), the geographic scope of that supplier ceasing production is
global, even though the supplier itself might operate facilities in only one country (or just a
single manufacturing facility).
4 The “bullwhip effect” in supply-chain economics describes how industry and policymakers might overcompensate
for shortages, leading to oversupply.

10
Figure 2.1. Geographic Scope of Shortage Causes Versus Effects
For the purposes of our shortage framework, we consider the geographic scope of both the
causes and the potential effects of the shortage. The relationship between the geographic scope
of shortage causes and potential effects depends on the context of supply chains, regulation, and
the competitive environment surrounding a specific drug. Some shortages might have both
domestic causes and effects. For these shortages, we would not expect to see simultaneous
responses because of shortages across countries. Other shortages might have a narrow, domestic
cause but play out globally—for example, in cases in which raw material, manufacturing, or
other supply-chain steps are concentrated in one narrow geographic area. Still other shortages
might have both causes and effects that play out on a global scale—for example, a broad raw
material shortage (such as a shortage of glass vials).
Scenarios with Potential Global Effects
We propose the following scenarios in which shortage effects have the potential to be global
in scope:
• global disruption in the supply of a crucial input: In this scenario, drug manufacturers
worldwide are unable to obtain sufficient quantities of a crucial input, such as the API,

11
glass vials, or sterile water. The causes of shortages in this category include competing
demand from other industries, quality concerns affecting all manufacturers of a key input,
or natural disasters affecting a region that is the primary global supplier of an input. As a
result, the volume of drug manufactured worldwide declines while prices increase
worldwide (to the extent feasible, given price controls in countries outside the United
States). In the short term, the number of manufacturers might decrease (depending on
whether some manufacturers cease production entirely) while the change in market
concentration is ambiguous (depending on the market shares of remaining
manufacturers).
• manufacturing disruption or discontinuation with global implications: In this
scenario, global manufacturing capacity for finished drug products is diminished, leading
to less drug product being available globally. The affected manufacturing capacity could
be broad (e.g., if facilities in many countries are similarly affected by a quality concern).
Or the affected manufacturing capacity could be narrow (e.g., the entirety of the global
supply of a given finished drug product is manufactured in a single facility and exported
to countries worldwide). The implications of this scenario are similar to those in the input
disruption scenario described above.
• unexpected global increase in demand: In this scenario, demand increases worldwide
more quickly than manufacturers can respond by increasing supply. On average, we
expect increases in the number of manufacturers and decreases in Herfindahl-Hirschman
Index (HHI) as new entrants move in to meet demand. Volume increases over time might
be relatively greater in the United States compared with other countries because
companies work to meet U.S. demand first, to the extent possible, because of higher
prices on average.
Of the scenarios in which global effects are possible, we expect to see changes in market
conditions (e.g., volume, prices, and number of manufacturers) that are correlated in terms of
timing and magnitude. However, there could be some differences in the timing and magnitude of
effects because of differences between countries in acquisition approaches, stocking and
inventory approaches, etc. All of the effects described above are potential effects because
industry and governments likely will use different approaches to respond to shortages across
countries. For some shortages, and in some countries, private- or public-sector intervention, such
as compulsory licensing, expanding manufacturing capacity through other means, or relaxing
safety or quality regulations, might completely ameliorate the effects of shortage.
Scenarios with Likely Domestic Effects Only
Other scenarios likely will have domestic or regional—but not global—effects, and shortages
might fall into these scenarios with narrower geographic scope more often than into the three
global scenarios listed earlier. Disruption of inputs or manufacturing for sterile injectable drugs
likely will have only domestic or regional implications because sterile injectable manufacturing
sites typically serve a narrow domestic or regional market. For example, if there are quality
concerns at a North American sterile injectable plant, we expect only U.S. volume to decline.
Other markets are not directly affected because they are served by different manufacturers or
manufacturing facilities. Similarly, provided there is manufacturing capacity worldwide, a

12
natural disaster, such as a hurricane, that affects just one country or region is unlikely to result in
worldwide effects.
Even in cases in which the effects of a shortage are primarily domestic, there might be
spillover effects in other countries if regulators allow the importation of available supply from
other countries. For example, manufacturers could shift volume from unaffected to affected
countries, leading to ambiguous volume changes in unaffected countries depending on whether
the manufacturer increased manufacturing capacity to cover the exported volume. In the United
States, FDA can allow for the temporary importation of products that are not otherwise approved
for sale in the United States in response to shortages. This strategy might be more feasible for
extended shortages and in cases in which available foreign products are close substitutes for the
U.S. product in shortage.
Implications of the Framework for Empirical Analysis
Our analysis uses shortage database and IQVIA MIDAS market data to assess whether U.S.
shortages have implications that are primarily for the U.S. market or are on a more global scale.
Unfortunately, as we describe next, we found incomplete and inconsistent information about
shortage causes in shortage databases. As a result, we could not directly test whether shortages
with different causes, or with causes that have the potential for global effects versus those that do
not, experienced different responses in a systematic way. We discuss differences in outcomes by
shortage proximate cause in illustrative examples in the following sections.
Illustrative Examples of Specific U.S. Drug Shortages
In this section, we introduce four illustrative examples through the lens of the shortage
framework. Appendix B contains detailed background information about each example. The
charts in this section are based on our analysis of IQVIA MIDAS data, which we describe in
detail in the next chapter and use in later analyses.
Belatacept (Brand Name: Nulojix)
Belatacept is a brand-name biologic immunosuppressant used to prevent rejection in patients
receiving kidney transplants. It is sold as a dry (lyophilized) powder that is reconstituted and
administered via intravenous infusion. Belatacept is currently marketed only by pharmaceutical
company Bristol-Myers Squibb and is protected from direct competition by regulatory
exclusivity granted by FDA through 2023. Both FDA and ASHP recorded a belatacept shortage
starting in early 2017, even though Bristol-Myers Squibb had been working to increase U.S.
volume to meet growing demand for the drug up to that point (Figure 2.2). Although increasing
demand was the primary cause of the shortage, a failed transition to a new manufacturing process
in early 2017 marked the formal start of the shortage period in both databases. Supply in other
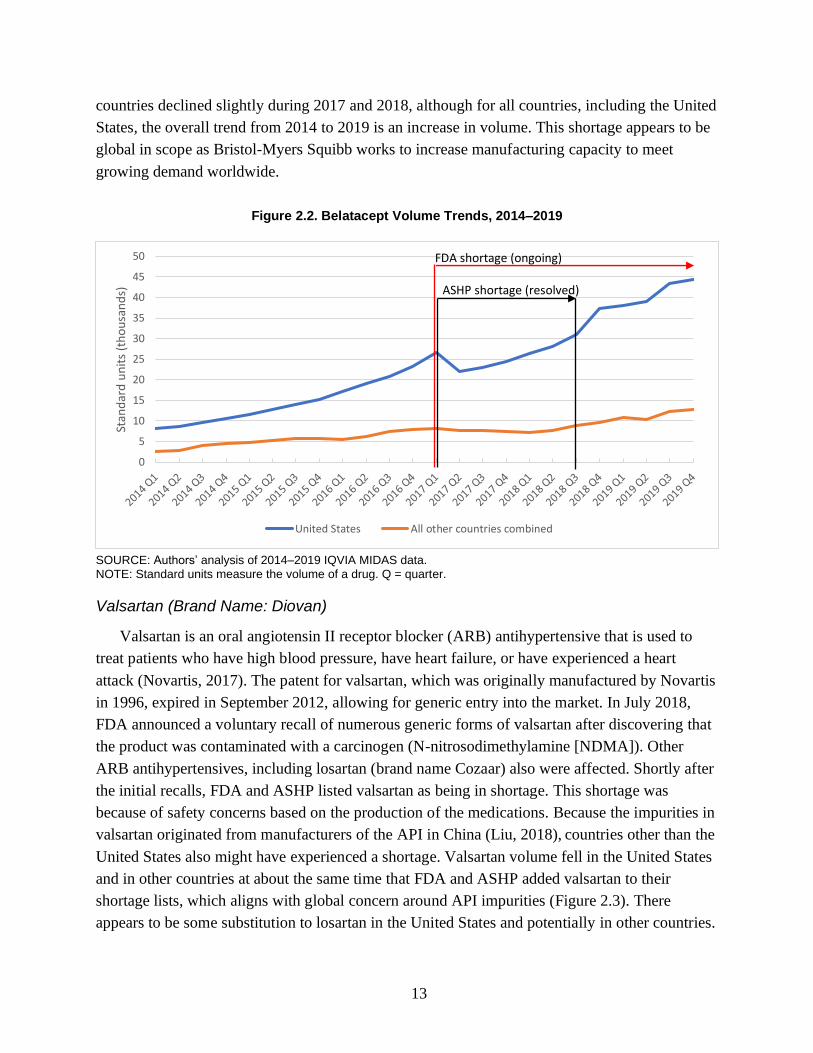
13
countries declined slightly during 2017 and 2018, although for all countries, including the United
States, the overall trend from 2014 to 2019 is an increase in volume. This shortage appears to be
global in scope as Bristol-Myers Squibb works to increase manufacturing capacity to meet
growing demand worldwide.
Figure 2.2. Belatacept Volume Trends, 2014–2019
SOURCE: Authors’ analysis of 2014–2019 IQVIA MIDAS data. NOTE: Standard units measure the volume of a drug. Q = quarter.
Valsartan (Brand Name: Diovan)
Valsartan is an oral angiotensin II receptor blocker (ARB) antihypertensive that is used to
treat patients who have high blood pressure, have heart failure, or have experienced a heart
attack (Novartis, 2017). The patent for valsartan, which was originally manufactured by Novartis
in 1996, expired in September 2012, allowing for generic entry into the market. In July 2018,
FDA announced a voluntary recall of numerous generic forms of valsartan after discovering that
the product was contaminated with a carcinogen (N-nitrosodimethylamine [NDMA]). Other
ARB antihypertensives, including losartan (brand name Cozaar) also were affected. Shortly after
the initial recalls, FDA and ASHP listed valsartan as being in shortage. This shortage was
because of safety concerns based on the production of the medications. Because the impurities in
valsartan originated from manufacturers of the API in China (Liu, 2018), countries other than the
United States also might have experienced a shortage. Valsartan volume fell in the United States
and in other countries at about the same time that FDA and ASHP added valsartan to their
shortage lists, which aligns with global concern around API impurities (Figure 2.3). There
appears to be some substitution to losartan in the United States and potentially in other countries.
0
5
10
15
20
25
30
35
40
45
50
Stan
dar
d u
nit
s (t
ho
usa
nd
s)
United States All other countries combined
FDA shortage (ongoing)
ASHP shortage (resolved)

14
Figure 2.3. Valsartan and Losartan Volume Trends, 2014–2019
SOURCE: RAND analysis of 2014–2019 IQVIA MIDAS data.
Heparin
Heparin is an anticoagulant administered by intravenous or subcutaneous injection and is
sold by several manufacturers in the United States. One type of heparin, unfractionated heparin,
is the primary anticoagulant used for open-heart surgery and in dialysis. In September 2017,
Hurricane Maria damaged the facilities of Baxter, a heparin manufacturer.5 Several Baxter
heparin products manufactured at its Puerto Rico plant remain in shortage, and FDA granted
Baxter authorization to temporarily import premixed heparin bags from the United Kingdom
starting in 2019 (Baxter Healthcare Corporation, 2019). Other heparin products are in shortage,
and several of the more recent shortages appear to be attributable to anticipated or actual
shortages of API. Much of the pharmaceutical-grade heparin manufactured globally is derived
from porcine intestine mucosa in China (Vilanova, Tovar, and Mourão, 2018). By 2019, there
was mounting concern that the outbreak of African Swine Fever in China starting in mid-2018
could disrupt the supply of heparin API to drug manufacturers (Pallone et al., 2019). At least one
manufacturer—Fresenius Kabi—began strategically allocating (i.e., rationing) its supply of
heparin in anticipation of supply disruptions (Preusker, 2019). The initial shortage caused by the
closure of Baxter’s North American plant is an example of a shortage that is not expected to have
5 Baxter faced disruptions of other intravenous drugs manufactured in Puerto Rico. See, for example, Baxter
Healthcare Corporation, 2017. Other drug manufacturers in Puerto Rico also were affected (Thomas, 2017).
0
100
200
300
400
500
600
700
800
900
1000
Stan
dar
d u
nit
s (m
illio
ns)
Losartan - U.S. Losartan - Other countries Valsartan - U.S. Valsartan - Other countries
FDA and ASHP valsartan shortage (ongoing)

15
global effects because the affected factory served only North American markets (Figure 2.4).6
After an initial decline in total U.S. volume, other manufacturers increased production to address
the shortage (Figure 2.5). However, the ongoing concern regarding API supply does have the
potential for global effects.
Figure 2.4. Heparin and Heparin Sodium Volume Trends, 2014–2019
SOURCE: RAND analysis of 2014–2019 IQVIA MIDAS data.
6 Although the reason for cyclical utilization trends in other countries is not clear, one possibility is that some
countries purchase long-term supplies of heparin in specific quarters during the year (in this case, quarter 2 and
quarter 3).
0
50
100
150
200
250
Stan
dar
d u
nit
s (m
illio
ns)
United States All other countries combined
FDA heparin shortage (ongoing)
ASHP heparin shortages (ongoing)

16
Figure 2.5. Heparin Sodium Volume Trends, 2014–2019, by Manufacturer
SOURCE: RAND analysis of 2014–2019 IQVIA MIDAS data. NOTE: Manuf = manufacturer.
Tamsulosin Hydrochloride (Brand Name: Flomax)
Tamsulosin hydrochloride is a small-molecule drug used to treat benign prostatic hyperplasia
(enlarged prostate). Generic versions of tamsulosin hydrochloride were first marketed in the
United States in 2010, and the drug is now sold in the United States by many competing generic
drug manufacturers. The ASHP shortage database notes that Mylan, one of many generic
manufacturers selling tamsulosin hydrochloride, discontinued 25-count capsule bottles of the
drug in mid-2016. Other generic manufacturers, including Sandoz, Par, Aurobindo, and Teva, are
listed as having discontinued all or some package sizes for reasons including production delays
and increased demand. Despite these listed shortages, the ASHP database notes that Mylan
continued to sell 90-, 100-, and 300-count bottles. Other manufacturers, including some of those
that also are listed as discontinuing specific package sizes, continue to sell significant volumes of
tamsulosin hydrochloride. The tamsulosin hydrochloride shortage is the result of a business
decision by Mylan to stop selling the drug in a certain package size while still selling the drug in
other package sizes. Despite this business decision, there are still many manufacturers offering
tamsulosin hydrochloride in the United States, and volume has increased over time in the United
States and in other countries (Figure 2.6). We view the tamsulosin hydrochloride shortage listed
in the ASHP database as a technical and not a practical shortage.
0
500
1000
1500
2000
2500
3000
Stan
dar
d u
nit
s (t
ho
usa
nd
s)
U.S. - Baxter U.S. - Other manuf. U.S. - Total
FDA heparin shortage (ongoing)
ASHP heparin shortages (ongoing)

17
Figure 2.6. Tamsulosin Hydrochloride Volume Trends, 2014–2019, by Manufacturer
SOURCE: RAND analysis of 2014–2019 IQVIA MIDAS data.
Examples of Broader, Ongoing Drug Shortages in the United States
Shortages of Antimicrobial Drugs
Numerous antimicrobial drugs experienced intermittent shortages over the past few decades,
constituting 16 percent of ASHP-listed critical drug shortages from 2011 to 2013 (U.S.
Government Accountability Office, 2014) and roughly 14 percent of the combined FDA and
ASHP shortage list that we compiled for this report. Antimicrobials encompass numerous
therapeutic agents, such as antibiotics, antivirals, and antifungals, with the commonality that
these agents either prevent or treat infections. Some reasons for shortages include a small
number of manufacturers, raw material shortages, noncompliance with good manufacturing
practices, product contamination, changes in product formulation, changes in therapeutic
indications that increase demand, and long and complex supply chains (Civica, 2019; Griffith et
al., 2012). Generally, the antimicrobials in shortage are injectable and are examples from our
framework of sterile injectables that go into shortage, often because of manufacturing
disruptions. Among antimicrobial shortages that were resolved in less than a year, the median
shortage duration was 40 days. As is the case for overall drug shortages in the United States, the
majority of antimicrobial drugs in shortage are generics and are administered via injection
(McLaughlin et al., 2014); we found the same thing to be true in our combined list of shortages.
For the antimicrobials that lack an effective alternative agent, patients have experienced delays
0
100
200
300
400
500
600
700
800
900
Stan
dar
d u
nit
s (m
illio
ns)
United States All Other Countries Combined
ASHP shortage (ongoing; discontinuation)
18
that have been associated with increases in mortality for certain conditions, including bacterial
sepsis, bloodstream infections, and pneumonia (Griffith et al., 2012).
Shortages of Immune Globulins
Administered via injection, immune globulins (IGs) treat a variety of conditions, including
autoimmune diseases, epilepsy, bone marrow transplants, HIV, and leukemia (Perez et al., 2017).
IGs have been in shortage for several years and are an example from our framework of a class of
products for which growing demand has outpaced supply (ASPE, 2007; ASPE, 2019). Many IG
products go on and off shortage intermittently, according to the ASHP and FDA shortage
databases. The primary reason for IG shortages is that the supply has not met the increasing
demand because of delays with manufacturing and distribution (FDA, 2019c). Because this
product is plasma-derived, and is therefore obtained through blood donations, it takes more time
than other medications for manufacturers to adjust their supply based on demand volatility
(Rosenkrantz, 2019; ASPE, 2007; ASPE, 2019). In response to these shortages, clinicians have
reduced doses, prolonged the time between injections, prioritized IG products according to a
patient’s medical need, and prescribed alternative therapies should they exist for a given
condition (FDA, 2019c).

19
3. Data and Empirical Methods
In this chapter, we describe data sources and methods for our empirical analyses comparing
changes in outcomes in the United States with those in other countries in response to drug
shortages recorded in U.S. shortage databases.
Combining ASHP and FDA Data Sets
We used an extract of the ASHP database prepared in April 2020 and an extract of the FDA
shortage database downloaded in April 2020. Although the ASHP extract includes historical
resolved shortages, we found that the earliest shortages in the extract started in 2015. The FDA
extract included only current shortages, shortages resolved in the prior six months, and
discontinuations within the prior 12 months relative to the date of download.
We combined the ASHP and FDA databases to construct a single database of U.S. drug
shortages. As described in Chapter 1, both the ASHP and FDA CDER databases record drug
shortages in the United States.7 Despite differences in scope and purpose, there is considerable
overlap in the information stored in the FDA and ASHP databases for each shortage, including
the shortage drug in question defined using NDCs and the start and stop date for the shortage.
Neither database includes complete information about the underlying cause or reason for a
shortage.
The two databases required preprocessing before they could be combined. Although the
ASHP data are at the NDC level, the FDA data often list many NDCs in an individual shortage
record. We expanded the FDA data so that they contained NDC-level shortage records. We
adjusted most FDA-reported NDCs so that they were in a standardized, 11-digit format as in the
ASHP data.8 Only five ASHP NDCs required adjustment to reach the standard 11-digit length.
Table 3.1 describes the starting number of records and corresponding counts of unique NDCs
in both data sets and lists stepwise exclusions from these starting counts to the final count of
observations and unique NDCs contributing to our analyses. We excluded observations from
ASHP and FDA databases that
7 Both CDER and CBER within FDA maintain shortage lists. For the purposes of the analyses conducted in this
report, we used only the FDA CDER database because the FDA CBER database is not readily available in a format
to be used by researchers. As described in Chapter 1, the scope and purpose of the FDA CDER and ASHP databases
differ on several dimensions. On one hand, the ASHP database might include drugs regulated by FDA as biologics
that would not be included in the CDER database. On the other hand, the ASHP database likely includes technical
shortages that are not included in the FDA CDER database. 8 For example, many FDA-listed NDCs required additional leading zeros to fit the “5-4-2” NDC format used by
ASHP.

20
1. lacked a shortage start date: A total of 55 FDA shortages and NDCs lacked a recorded
start date and were excluded.
2. began prior to quarter 1 (Q1) 2015: Although shortages in the FDA database have start
dates beginning in 2008, our drug market data begin in 2014. We excluded a small
number (8.4 percent) of shortages that began in 2014 FDA data. An additional 2.3
percent of NDC-level shortage records were excluded because of a missing start date.
The ASHP data began in early 2015.
3. were defined using an indicator other than NDC: There were 18 ASHP shortages
listed with a string indicator of “UPC” (Universal Product Code) or “Product” rather than
“NDC.” A total of 22 FDA shortages included a sequence of numbers that appeared to be
an NDC but that could not be standardized into an 11-digit format.
4. were less than 30 days in duration: The drug market data described below are at the
calendar quarter level. Very short shortages would be difficult to analyze using quarterly
drug market data. For FDA shortages, we defined duration as the difference between last
update date and start date for ongoing shortages and between end date and start date for
resolved shortages. The 30-day duration exclusion removed 11.6 percent of ASHP NDC-
level shortage records and 30.6 percent of FDA NDC-level shortage records. Most of the
removed FDA shortage records were for discontinuations, which had the same start and
end dates in the database.
5. could not be merged to Medi-Span data: We appended additional information to the
combined FDA and ASHP NDC-shortage-level data to facilitate later merges with drug
market data. We added the generic product identifier (GPI) level 14 field from Wolter
Kluwer’s Medi-Span data for each NDC. GPI is a hierarchical classification scheme for
drugs. GPI level 14 distinguishes among different drug products in terms of active
ingredient, formulation, and dosage strength. A total of 188 shortages did not merge to
the Medi-Span data and were excluded from our analysis.
Our data covered a total of 4,786 NDCs after we applied these five exclusion criteria.
Table 3.1. Counts of Shortages and National Drug Codes Excluded by Step, by Source
ASHP
FDA
ASHP and FDA
Step Observations NDCs
Observations NDCs
Observations NDCs
Starting counts 8,620 4,652 2,353 2,330 10,973 5,854
Exclude records with missing start dates
0 0 55 55 55 9
Exclude records starting prior to Q1 2015
0 0 198 198 198 59
Exclude non-NDC records 18 11 22 21 40 32
Exclude records with less than 30-day duration
1,000 150 716 703 1,716 780
Exclude NDCs that could not be merged to Medi-Span
170 133 60 58 230 188
Observations prior to MIDAS merge 7,432 4,358 1,302 1,295 8,734 4,786
Exclude NDCs that could not be merged to MIDAS
790 455 147 146 937 503
Final observations and NDCs 6,642 3,903 1,155 1,149 7,797 4,283

21
Combining the Shortage Analytic File with IQVIA MIDAS Data
As a next step, we merged the combined FDA and ASHP shortage analytic file with
international prescription drug market data from IQVIA’s MIDAS database. The MIDAS data
contain estimates of quarterly prescription drug sales and volume that are based on audits of
prescription drug transactions in each source country. The audit methodology varies from
country to country, but the MIDAS data are generally an estimate of all prescription drug sales
regardless of distribution channel.
The MIDAS data used for this analysis were provided via an extract from ASPE. Our extract
of MIDAS data included the United States and other high-income Organisation for Economic
Co-Operation and Development (OECD) countries. The extract included separate sales and
volume data records for each combination of country, quarter, active ingredient, formulation,
strength, and several other variables. We aggregated the sales and volume data to the “country-
quarter-presentation” level, where presentation is a unique combination of active ingredient
(defined using MIDAS’s “moleculelist” field), formulation (defined using MIDAS’s “NFC123”
field), and dosage strength (defined using MIDAS’s “intstrength” field).
We manually matched each GPI level 14 value from the combined shortage database to the
corresponding MIDAS record. In most cases, the active ingredient from the GPI matched to an
active ingredient in MIDAS. We resolved discrepancies in active ingredient names and spellings
through web searches. It was not always clear which related but distinct form codes in the
MIDAS data mapped to a specific GPI. For example, a GPI might indicate injection while
MIDAS differentiates among several types of injections (e.g., intramuscular, intravenous) in the
NFC123 field. In these cases, we combined the MIDAS data for related values of NFC123 (in
this example, we combined several separately recorded injection forms in MIDAS into a single
observation).
We mapped MIDAS presentations to a more aggregated level, a MIDAS “drug form,” for our
main analyses. MIDAS presentations (which are combinations of active ingredient, detailed
NFC123 form codes, and dosage strength) are nested within MIDAS drug forms, which we
define as combinations of active ingredient and a higher-level form category. We used the
following four form categories corresponding to the first digit of the NFC123 variable:
• A/B: oral solids
• D/E: oral liquids
• F/G: parenteral (i.e., infused or injected)
• OT: other, excluding “V” veterinary forms.
As an example, all of the oral solid formulations and dosage strengths for a given active
ingredient would be combined into a single oral solid drug-form record for that active ingredient.
We could not match every GPI to a MIDAS record. We excluded 173 NDCs (61 GPIs) that
were not for prescription drugs. Some NDCs (n = 503) could not be matched to MIDAS despite
our best efforts. Although MIDAS includes nearly all prescription drugs sold in the United

22
States, a small number of manufacturers and products do not contribute data to MIDAS and
could explain some of these cases. In addition, some products listed in shortage databases might
not be considered by MIDAS to be prescription drugs, beyond the 173 NDCs and 61 GPIs that
we excluded for this reason.
After merging to MIDAS, our combined ASHP and FDA file included 7,797 observations
from 4,283 unique NDCs. In a separate step applied at the MIDAS active ingredient level, we
excluded 133 of 2,709 active ingredients (4.9 percent) because they had less than $10,000 in total
U.S. sales in MIDAS across all six years of data in our study. These active ingredients tended to
have volatile quarter-to-quarter changes in sales, including many quarters with zero sales.
Calendar Time Analytic File
We consolidated the information in the combined FDA and ASHP data so that it is at the
MIDAS drug-form level rather than the NDC level. To do this, we arrayed the shortages for an
individual NDC from both data sets over time and mapped the start and stop dates to calendar
quarters to match our quarterly drug market data, described in more detail below. Our study
period included quarters from Q1 2014 through Q4 2019 to match the dates of shortages
available in the FDA and ASHP data and with the available drug market data. We assumed that
shortages without an end date remained in shortage through the end of our study time frame in
Q4 2019.
We created a calendar time analytic file including the following for each MIDAS drug form,
country, and calendar quarter:
• a (U.S.) shortage indicator equal to one if the drug form was in shortage according to
either the FDA or ASHP data. We required calendar quarters to cover at least 30
consecutive days of an active shortage for the drug form. In other words, a shortage
extending 29 days into a calendar month would not result in the quarter being flagged as
in shortage, while a shortage extending 30 days into a quarter would be. We used this
threshold to avoid assigning entire quarters as being in shortage in cases in which a
shortage covered only a small percentage of the quarter.9
• a quarterly shortage source variable equal to “FDA,” “ASHP,” or “both.” This
variable equaled “FDA” if only the FDA database indicated a shortage for the given
NDC, “ASHP” if the NDC was in shortage only in the ASHP database, and “both” if the
NDC was in at least one shortage in both data sets.
• quarterly sales measured in U.S. dollars.
• quarterly volume measured in standard units. Standard units are a volume metric in
the MIDAS data that count in different units depending on the form of the drug (e.g., pills
and capsules for oral solid drugs, 5-milliliter increments for oral liquid drugs, and counts
of vials or syringes for infused or injected drugs).
• the number of unique manufacturers defined using the MIDAS “manufacturer” field.
9 We would have flagged approximately 11 percent more quarters as shortage quarters without this exclusion.

23
• a drug-form HHI: HHI is equal to the sum of the squared market shares across
manufacturers within a given drug form, quarter, and country. We measured market
shares using MIDAS volumes. HHI describes the degree of concentration in markets,
with an HHI of 1 indicating a market with just one manufacturer and an HHI close to 0
indicating a highly competitive market.
The resulting analytic file contains 24 quarterly observations for each of the remaining NDCs
in the data. The data recorded a total of 8,528 NDC-level shortages (i.e., cases in which the
shortage indicator transitioned from 0 to 1). We excluded shortages other than the first recorded
shortage in our data for several of our analyses. Of the total 8,528 shortages, 7,211 were initial
shortages and 1,317 were subsequent shortages. Our main analyses use information from initial
shortages only.
Event Time Analytic File
We created a separate version of the calendar time analytic file described above in which the
time dimension was redefined relative to the start of a shortage.
Matching and Weighting
For each shortage, we identified the full set of matching nonshortage drugs in MIDAS,
which we define as drugs that were never in shortage during the study period and that match to
the shortage drug in terms of the following, for the calendar quarters aligning with the shortage
in question:
• form (aggregated level), which is time-invariant
• market category based on information in the two quarters prior to the start of the
shortage. We defined the following three categories using a combination of the MIDAS
“innovationinsights” and manufacturer fields:
− single-source generic (i.e., a single manufacturer and a product categorized in
MIDAS as anything other than “innovative branded products” in the
“innovationinsights” field)
− multisource generic (i.e., products categorized as anything other than “innovative
branded products” in the “innovationinsights” field with more than one manufacturer)
− brand (i.e., products flagged as “innovative branded products” in the
“innovationinsights” field).
• the decile of volume measured over the two quarters prior to the start of the shortage.
Only shortage and nonshortage drugs with MIDAS sales and volume in one or both
preshortage quarters were eligible for matching.
As we describe in the next chapter, shortage and nonshortage drug forms varied on several of
the dimensions listed. To achieve better balance on observable factors, we weighted the
nonshortage drugs in every bin defined by a unique combination of the factors listed so that the
sum of the weights equaled the count of shortage drugs in the same bin. For example, if there

24
were ten shortage drugs in a bin (e.g., shortages starting Q1 2015, oral solid, multisource, based
on Q3–Q4 2014 data, and the first volume quartile based on Q3–Q4 2014 data) and 100
nonshortage drugs in the same bin, we assigned a weight of 0.1 to each of the nonshortage drugs.
We combined bins for the top five volume deciles for oral liquid drugs and the top two volume
deciles for infused or injected drugs to ensure that there were some shortage and nonshortage
drugs available for matching in all cases.
File Construction
We arrayed quarterly data for shortage and matched nonshortage presentations such that the
starting quarter for the shortage was t = 0. We retained quarters from t = −2 through t = 5 to
calculate descriptive statistics around changes in volume, prices, and other outcomes over
intervals anchored to the shortage starting quarter.
Antimicrobial and Immune Globulin Files
We used slightly different approaches to construct analytic files for our separate analyses of
antimicrobial drugs and IGs. Appendix D describes our approach in detail.
Analyses and Reporting Results
Descriptive Statistics
For the overall analysis and antimicrobial analyses, we compared the shortage drugs with the
weighted matched cohorts of nonshortage drugs in the United States and in other OECD
countries, to report outcomes across each of at most 12 periods, where Q0 represents the quarter
containing the shortage start date, Q − 1 the quarter before the shortage start date quarter, Q + 1
the quarter after the shortage start date quarter, and so on: Q − 1 to Q0, Q − 1 to Q + 1, Q − 1 to
Q + 2, Q − 1 to Q + 3, Q0 to Q + 1, Q0 to Q + 2, Q0 to Q + 3, Q0 to Q + 4, Q + 1 to Q + 2, Q + 1
to Q + 3, Q + 1 to Q + 4, and Q + 1 to Q + 5. For many analyses, we report over only three
intervals, Q − 1 to Q0, Q0 to Q + 1, and Q − 1 to Q + 1, for brevity and because we observed the
most consistent and largest signals in terms of changes in outcomes over these intervals.
We report the following descriptive outcomes:
• count of drug forms with sales in both quarters
• summary of changes in volume: percentage of presentations with decreases greater than
20 percent, percentage of presentations with decreases less than or equal to 20 percent,
and percentage of presentations with non-negative changes
• distribution of changes in volume: 5th, 25th, 50th, 75th, and 95th percentiles of
percentage change in volume
• summary of changes in price: percentage of presentations with increases greater than 20
percent, percentage of presentations with increases less than or equal to 20 percent, and
percentage of presentations with nonpositive changes

25
• distribution of changes in price: 5th, 25th, 50th, 75th, and 95th percentiles of percentage
change in price
• summary of change in number of manufacturers: mean and median number of unique
manufacturers across presentations (per quarter), mean and median percentage change in
the number of unique manufacturers across presentations
• summary of change in HHI: mean and median HHI across presentations (per quarter),
mean and median percentage change in HHI across presentations.
We report results for the Group of Seven (G7) countries (Canada, France, Germany, Italy, Japan,
the United Kingdom, and the United States) plus Australia. We chose this set of countries for
comparisons because the overlap between the drug forms sold in the United States and the drug
forms sold in these countries is typically high and because the policy implications of associations
between U.S. and other-country responses to shortages are likely larger when the other-country
market is larger.
Because there is a relatively small number of IG products, we report the percentage change in
volume and percentage change in price for each product, for each of the 12 periods of interest,
for each country.
Regression Analyses
We estimated random effects models regressing log-transformed volume or prices on a
quarterly indicator for U.S. shortage status, preshortage volume, form, and brand or generic
market categories described earlier. First, we estimated volume and price models separately for
the United States using data from all U.S. shortages. We then estimated models for comparison
countries using data for all shortages for drug forms sold in individual countries. As a result, the
number of drug-form shortages contributing to the regression for one comparison country differs
from the number contributing to the regression for another country. Finally, we estimated models
again using U.S. data, but this time, we limited our estimates to the overlapping drug forms sold
in the United States and individual comparison countries. As an example, for Australia, we first
estimated models using all available Australia data, and we then estimated models using U.S.
data for drug forms that are also sold in Australia.

26
4. Results
In this chapter, we present our main results, first across all shortages and categories of drugs,
and then for antimicrobial and IG shortages specifically.
Counts and Characteristics of Drugs on U.S. Shortage Lists
We identified 819 total shortages at the presentation level (i.e., active ingredient–form-
strength), compared with 415 at the drug-form level (i.e., active ingredient–form, where form is
defined as oral solid, oral liquid, parenteral, or other) and 381 at the drug level (i.e., active
ingredient) after making all of the previously described exclusions (Table 4.1). The substantial
difference in shortage counts between presentation and drug-form levels suggests that there are
often multiple presentations per drug form in shortage. On average, we observed about two
presentations in shortage for every drug form in shortage. The more modest difference between
counts of drug forms and drugs (i.e., active ingredients) in shortage suggests that there are
relatively few forms per drug, that shortages can be limited to a single form in cases in which
there are multiple forms per drug, or both. In general, we think that it is more likely that different
presentations (e.g., dosage strengths) of the same drug form could substitute for one another than
different forms of the same drug. The rest of the results in this chapter use drug-form–level data
combined across substitutable versions of a drug while maintaining potentially important
differences.
Table 4.1. Number of Shortages on FDA and ASHP Lists at Different Levels of Aggregation
Level Total N (%)
ASHP Only n (%)
ASHP and FDA n (%)
FDA only n (%)
Presentation 819 (100.00%) 558 (68.13%) 217 (26.50%) 44 (5.37%)
Drug form 415 (100.00%) 288 (69.40%) 106 (25.54%) 21 (5.06%)
Drug 381 (100.00%) 259 (67.98%) 105 (27.56%) 17 (4.46%)
SOURCE: Authors’ analysis of FDA and ASHP data linked to IQVIA MIDAS data. NOTE: Percentages may not sum to 100 percent because of rounding.
We found that more than two-thirds of shortages were from the ASHP database only, about
one-quarter of shortages appeared in both the ASHP and FDA databases, and about 5 percent of
shortages were from the FDA database only. These shares were consistent when considering
shortages at the presentation, drug-form, and drug levels.
Table 4.2 reports counts of drug-form shortages reported in Table 4.1 that we excluded from
our analysis. We excluded five ASHP-only shortages and one FDA-only shortage with no
reported sales or volume in the IQVIA MIDAS data in the two quarters preceding the shortage

27
start date. Although we cannot be certain, it is possible that these shortages began prior to the
start dates in the ASHP and FDA data, and volume had already decreased to zero by the start of
our study period. We excluded two ASHP-only shortages with less than $10,000 in U.S. sales
across the entire six-year period for our IQVIA MIDAS data extract.
Finally, we excluded 146 shortages with start dates in 2015; of these, 106 were only in the
ASHP database and 40 were in both the ASHP and FDA databases. We excluded these records
out of concern that shortage start dates in the initial year of data in our ASHP database reflected
the dates that shortages were entered into the database rather than the dates at which shortages
actually began. The ASHP database (in the form we used for this analysis with NDC-level data)
began in the second quarter of 2015, and we observed a spike in shortages starting in Q2 and Q3
2015. Given our interest in the relationships between shortage start dates and changes in volume,
price, and other outcomes, we felt that it was important to exclude 2015 shortages for which the
start dates are potentially suspect. Drug forms with a shortage starting in 2015 in the ASHP
database but after 2015 in the FDA database are still flagged as being in both the ASHP and
FDA databases.
Table 4.2. Drug-Form Shortage Exclusions
Level Total N (%)
ASHP only n (%)
ASHP and FDA n (%)
FDA only n (%)
Drug forms before exclusions 415 (100.00%) 288 (69.40%) 106 (25.54%) 21 (5.06%)
Lacks preshortage volume data 6 (100.00%) 5 (83.33%) 0 (0.00%) 1 (16.67%)
Low total sales 2 (100.00%) 2 (100.00%) 0 (0.00%) 0 (0.00%)
Shortages starting in 2015 146 (100.00%) 106 (72.60%) 40 (37.73%) 0 (0.00%)
Drug forms contributing to analysis 261 (100.00%) 175 (67.05%) 66 (25.29%) 20 (7.66%)
SOURCE: RAND analysis of FDA and ASHP data linked to IQVIA MIDAS data. NOTE: Percentages may not sum to 100 percent because of rounding.
Our final analytic file included 261 shortages, with 175 (67.1 percent) from the ASHP
database only, 66 (25.3 percent) from both the ASHP and FDA databases, and 20 (7.7 percent)
from the FDA database only. The number of shortages varied over time, with the peak of new
shortages in Q1 2019 and relatively more shortages in the FDA database only in more-recent
quarters (Figure 4.1).10
Shortage drug forms were more likely to be infused or injected forms and less likely to be
oral solid, oral liquid, or other forms compared with nonshortage drug forms (Table 4.3). The
breakdown of drug forms across form categories was similar for ASHP-only drug forms and
drug forms in both the ASHP and FDA databases. Although there were just 20 FDA-only
10 This is expected because the FDA database includes current shortages, shortages resolved within the past six
months, and discontinuations within the past 12 months.

28
shortage drug forms, a relatively large share were oral solid drug forms compared with shortages
in the other categories.
Figure 4.1. Count of Drug Forms Entering First Recorded Shortage, by Calendar Quarter
SOURCE: Authors’ analysis of FDA and ASHP data.
Table 4.3. Formulation of Shortage Versus Nonshortage Drug Forms
Shortage Drug Forms, by Source
All Shortage Drug Forms Combined
ASHP Only
Both ASHP and FDA FDA Only
Nonshortage Drug Forms
Number of drug forms 261 175 66 20 2,592
Formulationa
Oral solid (NFC1 A/B %) 31.42 26.86 34.85 60.00 47.80
Oral liquid (NFC1 D/E %) 3.83 4.00 3.03 5.00 11.27
Parenteral (NFC1 F/G %) 52.87 57.14 50.00 25.00 21.91
Other 11.88 12.00 12.12 10.00 19.02
SOURCE: Authors’ analysis of FDA and ASHP data linked to IQVIA MIDAS data. NOTE: Percentages may not sum to 100 percent because of rounding. a We used chi-square tests to assess whether proportions differed between categories. Proportions for all shortage versus all nonshortage drug forms were significantly different (p < 0.001). ASHP-only drug-form versus FDA-only drug-form percentages also differed (p = 0.018). Other differences in proportions were not statistically significant.
Our results throughout the rest of this chapter combine shortages from both sources. We
compared the characteristics of drug-form quarters for shortage drugs with those of nonshortage

29
drugs (Table 4.4). Drug forms in shortage had more quarters with nonzero sales and volume
recorded in the MIDAS data (23.4 quarters, on average, of 24 possible quarters) compared with
those that were not in shortage (an average of 19.9 of 24 quarters). We also found that shortage
drug forms had average quarterly volumes (measured in IQVIA MIDAS standard units) that
were twice as high as those of nonshortage drug forms.
Table 4.4. Quarterly Market Descriptive Statistics, Shortage Versus Nonshortage Drug Forms
Shortage Drug
Forms, All Quarters
Nonshortage Drug Forms, All Quarters
Shortage Drug Forms,
Quarters with
Nonzero Sales
Nonshortage Drug Forms,
Quarters with Nonzero
Sales
Number of drug forms 261 2,592 261 2,592
Quarters of data contributing to analyses
Count 6,264 62,208 6,106 51,659
Mean per-drug form 24.00 24.00 23.39a 19.93
Standard deviation — — 2.52 6.81
Quarterly sales, $U.S. (millions)
Mean 33.27 36.04 34.13a 43.40
Standard deviation 122.80 154.95 124.26 169.10
Median 4.85 1.28 5.19 2.96
Quarterly volume, standard units (millions)
Mean 45.98a 16.50 47.17a 19.87
Standard deviation 222.24 92.91 224.98 101.63
Median 0.51 0.15 0.62 0.37
Quarterly HHI
Mean N/A N/A 0.81a 0.87
Standard deviation N/A N/A 0.27 0.24
Median N/A N/A 1.00 1.00
Quarterly count of manufacturers
Mean N/A N/A 4.25a 2.92
Standard deviation N/A N/A 4.45 3.69
Median N/A N/A 2.00 1.00
Quarterly market status categorya
Innovator brand only (%) N/A N/A 13.92 27.63
Multisource (%) N/A N/A 66.13 38.32
Single-source generic (%) N/A N/A 19.95 34.05
SOURCE: RAND analysis of FDA and ASHP data linked to IQVIA MIDAS data. NOTES: Percentages may not sum to 100 percent because of rounding. N/A = not applicable. a For categorical variables, p-values from chi-square tests of shortage versus nonshortage quarters are significant at p < 0.001. For continuous variables, differences in means between shortage and nonshortage quarters are significant at p < 0.001. All other p values are > 0.05.
Nonshortage drug forms had higher average sales despite average volume being twice as
high for shortage versus nonshortage drug forms. When comparing quarters with sales and
volume data in MIDAS, we found that shortage drug forms had less concentrated (i.e., more-

30
competitive) markets; had more manufacturers, on average; and were more likely to be
multisource generics as opposed to innovator brands or single-source generics than nonshortage
drug forms. These differences in the extent of market competition for shortage versus
nonshortage drug forms likely are driven by the different mix of form and market size described
earlier.
Table 4.5. Preshortage Market Characteristics, Shortage Versus Matched Nonshortage Drug
Forms
Shortage
Drug Forms
Matched Nonshortage Drug Forms (unweighted)
Matched Nonshortage Drug Forms (weighted)
Number 261 7,535 261
Formulationa
Oral solid (NFC1 A/B %) 31.42 56.89 31.42
Oral liquid (NFC1 D/E %) 3.83 4.34 3.83
Parenteral (NFC1 F/G %) 52.87 29.71 52.87
Other 11.88 9.05 11.88
Two-quarter preshortage volume, standard units (millions)
Mean 96.76 122.65 76.78
Standard error 27.78 4.29 3.62
Median 0.92 5.65 1.04
Two-quarter preshortage sales, $U.S. (millions)
Mean 61.34 69.33 83.77
Standard error 13.82 2.55 8.19
Median 10.39 15.12 15.11
Two-quarter preshortage market status category
Innovator brand only (%) 14.18 13.43 14.18
Multisource (%) 64.75 69.26 64.75
Single-source generic (%) 21.07 17.31 21.07
SOURCE: RAND analysis of FDA and ASHP data linked to IQVIA MIDAS data. NOTES: Percentages may not sum to 100 percent because of rounding. a For categorical variables, p-values from chi-square tests of shortage versus unweighted nonshortage quarters are significant at p < 0.001. None of the differences in means for continuous variables were statistically significant at p < 0.05.
The descriptive statistics in Table 4.4 for drug forms experiencing a shortage reflect all
quarters with available data, including quarters before, during, and after a shortage. Table 4.5
presents descriptive statistics that are limited to those quarters that are right before the start of a
recorded shortage. For comparison, Table 4.5 also reports descriptive statistics from a matched
set of nonshortage drugs, both unweighted and weighted to match the characteristics of shortage
drugs in terms of form, preshortage volume, and preshortage market status category. After
weighting, shortage and nonshortage drug forms match exactly in terms of the proportions in
different form and market status categories (by design). Although the mean two-quarter
preshortage volume remained somewhat different for nonshortage and shortage drug forms even
after weighting, the difference was not statistically significant, and weighting did better align
median preshortage volume.

31
Associations Between U.S. Shortages and U.S. Outcomes
As described in Chapter 2, prior research suggests heterogeneous changes in volume and
prices through the onset of U.S. drug shortages, including
• returns to preshortage volume for some drugs and sustained shortages for others
• price increases more often than price decreases.
Our findings align with those from prior studies, with heterogeneous responses in terms of
volume, price, number of manufacturers, and HHI to the onset of U.S. shortages. Figure 4.2 is a
box plot illustrating the wide range of changes in volume, price, and HHI for shortage and
nonshortage drug forms from the quarter prior to the start of the shortage (Q − 1) to the quarter
after the start of the shortage (Q + 1) (results for manufacturers and additional descriptive
statistics for U.S. outcomes are in Appendix E). The distributions of changes for both shortage
and nonshortage drug forms were centered around zero, with about as many drug forms
experiencing increases compared with decreases.
Figure 4.2. Distribution of Changes in Volume, Price, and HHI for Shortage and Nonshortage
Drugs, Q − 1 to Q + 1
SOURCE: Authors’ analysis of FDA, ASHP, and IQVIA MIDAS data. NOTE: Increases are top-coded at 100 percent. Lines through the middle of the solid boxes indicate median values. The top and the bottom of solid boxes mark 25th and 75th percentiles. Whiskers indicate the upper and lower adjacent values (1.5 times the interquartile range), while markers are outside values.

32
In terms of average changes, we found a slight decline in volume (−8.4 percent) and a slight
increase in price (7.3 percent) for shortage drug forms compared with changes that were not
statistically distinguishable from zero for nonshortage drug forms (Figure 4.3). HHI increased
slightly, on average, but with p < 0.05, while the average change in the number of manufacturers
was close to zero and not statistically significant (not reported).
Figure 4.3. Average Changes in Volume, Price, and HHI for Shortage and Nonshortage Drugs,
Q − 1 to Q + 1
SOURCE: RAND analysis of FDA, ASHP, and IQVIA MIDAS data. NOTE: Increases are top-coded at 100 percent. Whiskers present the standard deviations. Nonshortage drug forms are weighted to match shortage drug forms on observables.
Changes in Outcomes by Shortage Categories
The average changes in volume, price, manufacturers, and HHI through the start of shortages
differed depending on whether the shortage was included in the ASHP database only, in the FDA
database only, or both (Table 4.6). In terms of volume, shortages included in both the FDA and
ASHP databases had larger declines compared with those that were included only in the ASHP
database, although the difference was not statistically significant (p = 0.08). Drug forms listed
only in the FDA database had, on average, a very slight decline, although the confidence interval
is very wide because of a sample size of only 16.
Average price increases were similar for drug forms in both databases and in the ASHP
database alone. Drug forms in both the ASHP and FDA databases had, on average, a slight
decline in the number of manufacturers compared with a slight increase for those in the ASHP
database only, although neither difference was statistically distinguishable from zero. HHI
-8.4%
7.3%
2.7%
1.0%
-0.4% -0.3%
-15%
-10%
-5%
0%
5%
10%
15%
Volume Price HHI
Ave
rage
per
cen
tage
ch
ange
in o
utc
om
es, Q
−1
to Q
+ 1
Shortage drug forms Nonshortage drug forms
33
increased, on average, for drugs regardless of source, although none of the results were
statistically significant.
Table 4.6 also compares changes in outcomes for shortages in different forms and market
categories. Reductions in volume were similar for oral solid and parenteral drug forms, while
increases in price were larger for oral solid compared with parenteral drug forms. Innovator
brand and single-source generic drug forms had larger increases in volume than multisource
generics, of which other existing manufacturers might be able to increase production to address a
shortage affecting other manufacturers. Price increases were largest for multisource generic drug
forms. Changes in manufacturers and HHI were modest and only occasionally statistically
significant across all categories.
We report results separately for the 50 drug forms that had the largest relative reduction in
volume, were outside the bottom quartile of U.S. preshortage volume, and had more than
$1,000,000 in sales during the two quarters preceding the shortage. By design, these “top 50”
U.S. shortages had much larger declines in volume, on average, than the remaining 214 for
which outcomes could be measured from the quarter prior to the shortage to the quarter after the
shortage (197 of 214). The top 50 U.S. shortages had a much larger average increase in price
over the same interval (22.2 percent) compared with shortages outside the top 50 and, like
shortages outside the top 50, nonsignificant changes in manufacturer count and HHI. In addition
to comparisons with the total sample, we use this set of top 50 U.S. shortages for comparisons
with other countries in the next section.
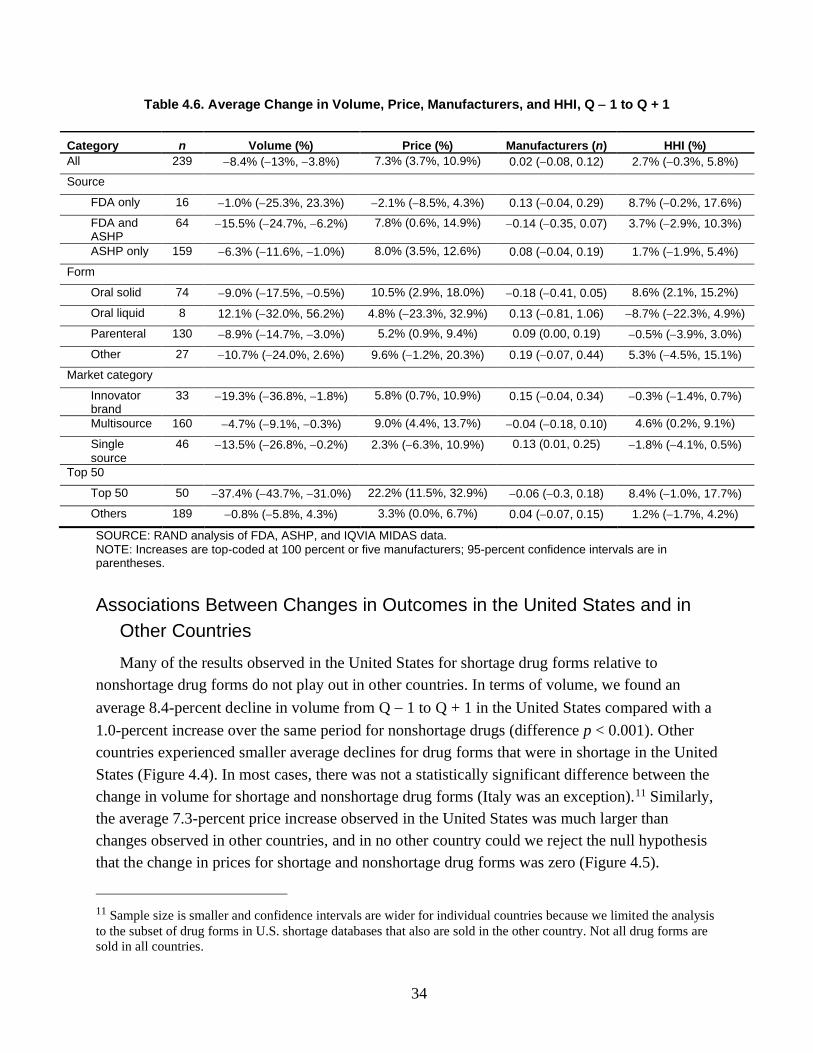
34
Table 4.6. Average Change in Volume, Price, Manufacturers, and HHI, Q − 1 to Q + 1
Category n Volume (%) Price (%) Manufacturers (n) HHI (%)
All 239 −8.4% (−13%, −3.8%) 7.3% (3.7%, 10.9%) 0.02 (−0.08, 0.12) 2.7% (−0.3%, 5.8%)
Source
FDA only 16 −1.0% (−25.3%, 23.3%) −2.1% (−8.5%, 4.3%) 0.13 (−0.04, 0.29) 8.7% (−0.2%, 17.6%)
FDA and ASHP
64 −15.5% (−24.7%, −6.2%) 7.8% (0.6%, 14.9%) −0.14 (−0.35, 0.07) 3.7% (−2.9%, 10.3%)
ASHP only 159 −6.3% (−11.6%, −1.0%) 8.0% (3.5%, 12.6%) 0.08 (−0.04, 0.19) 1.7% (−1.9%, 5.4%)
Form
Oral solid 74 −9.0% (−17.5%, −0.5%) 10.5% (2.9%, 18.0%) −0.18 (−0.41, 0.05) 8.6% (2.1%, 15.2%)
Oral liquid 8 12.1% (−32.0%, 56.2%) 4.8% (−23.3%, 32.9%) 0.13 (−0.81, 1.06) −8.7% (−22.3%, 4.9%)
Parenteral 130 −8.9% (−14.7%, −3.0%) 5.2% (0.9%, 9.4%) 0.09 (0.00, 0.19) −0.5% (−3.9%, 3.0%)
Other 27 −10.7% (−24.0%, 2.6%) 9.6% (−1.2%, 20.3%) 0.19 (−0.07, 0.44) 5.3% (−4.5%, 15.1%)
Market category
Innovator brand
33 −19.3% (−36.8%, −1.8%) 5.8% (0.7%, 10.9%) 0.15 (−0.04, 0.34) −0.3% (−1.4%, 0.7%)
Multisource 160 −4.7% (−9.1%, −0.3%) 9.0% (4.4%, 13.7%) −0.04 (−0.18, 0.10) 4.6% (0.2%, 9.1%)
Single source
46 −13.5% (−26.8%, −0.2%) 2.3% (−6.3%, 10.9%) 0.13 (0.01, 0.25) −1.8% (−4.1%, 0.5%)
Top 50
Top 50 50 −37.4% (−43.7%, −31.0%) 22.2% (11.5%, 32.9%) −0.06 (−0.3, 0.18) 8.4% (−1.0%, 17.7%)
Others 189 −0.8% (−5.8%, 4.3%) 3.3% (0.0%, 6.7%) 0.04 (−0.07, 0.15) 1.2% (−1.7%, 4.2%)
SOURCE: RAND analysis of FDA, ASHP, and IQVIA MIDAS data. NOTE: Increases are top-coded at 100 percent or five manufacturers; 95-percent confidence intervals are in parentheses.
Associations Between Changes in Outcomes in the United States and in
Other Countries
Many of the results observed in the United States for shortage drug forms relative to
nonshortage drug forms do not play out in other countries. In terms of volume, we found an
average 8.4-percent decline in volume from Q − 1 to Q + 1 in the United States compared with a
1.0-percent increase over the same period for nonshortage drugs (difference p < 0.001). Other
countries experienced smaller average declines for drug forms that were in shortage in the United
States (Figure 4.4). In most cases, there was not a statistically significant difference between the
change in volume for shortage and nonshortage drug forms (Italy was an exception).11 Similarly,
the average 7.3-percent price increase observed in the United States was much larger than
changes observed in other countries, and in no other country could we reject the null hypothesis
that the change in prices for shortage and nonshortage drug forms was zero (Figure 4.5).
11 Sample size is smaller and confidence intervals are wider for individual countries because we limited the analysis
to the subset of drug forms in U.S. shortage databases that also are sold in the other country. Not all drug forms are
sold in all countries.

35
The average number of manufacturers per shortage drug form declined slightly in countries
other than the United States compared with a slight (but not statistically significant) increase in
the United States (Figure 4.6). Relatedly, we found slight increases in HHI for drugs in shortage
in several non-U.S. countries (Figure 4.7).
Figure 4.4. Mean Percentage Change in Volume, Q − 1 to Q + 1, Shortage and Matched
Nonshortage Drugs
SOURCE: Authors’ analysis of FDA, ASHP, and IQVIA MIDAS data. NOTE: Increases are top-coded at 100 percent. Whiskers indicate 95-percent confidence intervals.
-8.4%
1.7%
-1.2% -2.3%-1.2%
-3.4%
1.4%1.9%
1.0%
5.1%
2.8%2.3% 2.2%
4.1%
1.6%2.3%
-15%
-10%
-5%
0%
5%
10%
US(n = 239)
Australia(n = 149)
Canada(n = 160)
France(n = 168)
Germany(n = 172)
Italy(n = 166)
Japan(n = 151)
UK(n = 190)
Ave
rage
per
cen
tage
ch
ange
in v
olu
me
Shortage Non-shortage

36
Figure 4.5. Mean Percentage Change in Price, Q − 1 to Q + 1, Shortage and Matched Nonshortage
Drugs
SOURCE: Authors’ analysis of FDA, ASHP, and IQVIA MIDAS data. NOTE: Increases are top-coded at 100 percent. Whiskers indicate 95-percent confidence intervals.
Figure 4.6. Mean Change in Manufacturer Count, Q − 1 to Q + 1, Shortage and Matched
Nonshortage Drugs
SOURCE: Authors’ analysis of FDA, ASHP, and IQVIA MIDAS data. NOTE: Increases are top-coded at 100 percent. Whiskers indicate 95-percent confidence intervals.
7.3%
1.2% 1.5%1.2%
-1.7%
0.2%
-0.7%
-2.9%
-0.4%
-1.7%
1.2%
-0.5%
0.1% 0.5%
-0.4%
-1.6%
-8%
-6%
-4%
-2%
0%
2%
4%
6%
8%
10%
12%
US(n = 239)
Australia(n = 149)
Canada(n = 160)
France(n = 168)
Germany(n = 172)
Italy(n = 166)
Japan(n = 151)
UK(n = 190)
Ave
rage
per
cen
tage
ch
ange
in p
rice
Shortage Nonshortage
0.02
-0.03
-0.09-0.07
-0.11
-0.08
-0.05
0.040.10
-0.020.00
0.01
-0.01
0.04
0.00
0.07
-0.25
-0.20
-0.15
-0.10
-0.05
0.00
0.05
0.10
0.15
US(n = 239)
Australia(n = 149)
Canada(n = 160)
France(n = 168)
Germany(n = 172)
Italy(n = 166)
Japan(n = 151)
UK(n = 190)
Shortage Nonshortage

37
Figure 4.7. Mean Percentage Change in HHI, Q − 1 to Q + 1, Shortage and Matched Nonshortage
Drugs
SOURCE: Authors’ analysis of FDA, ASHP, and IQVIA MIDAS data. NOTE: Increases are top-coded at 100 percent. Whiskers indicate 95-percent confidence intervals.
Average changes in other-country volume for drug forms in shortage in the United States
remained muted and inconsistent when we looked at changes by category. Shortage drug forms
on both the FDA and ASHP lists, which had relatively larger declines in volume in the United
States, did not have substantively different average changes in utilization compared with drug
forms that were only in the ASHP shortage database (Table 4.7). Although smaller subgroup
sample sizes led to wider confidence intervals, none of the volume changes in countries outside
the United States were significantly different from zero. Similarly, other-country average
changes in volume across subsets of shortages defined by form and market category were only
rarely statistically significant. The single exception was oral solid drug forms in France (with a
5-percent average decline in volume, about half the magnitude of the decline in the United
States).
Average changes in other-country prices also were smaller in magnitude and rarely
statistically significant across all drug forms and by drug-form category (Table 4.8). Exceptions
were most often decreases in other countries compared with increases in the United States,
including
• average declines for all, innovator brand, and infused or injected drug forms in the United
Kingdom
• average declines for FDA shortage drug forms and oral solid drug forms in Japan
• an average decline for oral solid drugs in Italy.
2.7%
1.9%
3.0%
0.6%
2.4%
0.7%
-1.3% -0.2%
-0.3%
0.4%
1.1%
0.1%0.6%
0.1%
-0.3%
0.4%
-3.0%
-2.0%
-1.0%
0.0%
1.0%
2.0%
3.0%
4.0%
5.0%
6.0%
7.0%
US(n = 239)
Australia(n = 149)
Canada(n = 160)
France(n = 168)
Germany(n = 172)
Italy(n = 166)
Japan(n = 151)
UK(n = 190)
Ave
rage
per
cen
tage
ch
ange
in H
HI
Shortage Nonshortage

38
The only case of a price increase in another country was a 3.4-percent increase for ASHP-only
drug forms in Canada compared with an 8.0-percent increase in the United States. Other-country
changes in manufacturer counts and HHI were small in magnitude and never statistically
significant, and we do not report detailed results for these outcomes.

39
Table 4.7. Comparison of U.S. and Other-Country Changes in Volume from Q − 1 to Q + 1, by Shortage Drug-Form Category
United States Australia Canada France Germany Italy Japan United
Kingdom
All
N 239 149 160 168 172 166 151 190
Mean −8.4% 1.7% −1.2% −2.3% −1.2% −3.4% 1.4% 1.9%
95% CI (−13.0%, −3.8%) (−3.6%, 6.9%) (−6.6%, 4.1%) (−6.5%, 1.9%) (−5.4%, 3.0%) (−7.8%, 0.9%) (−2.3%, 5.0%) (−2.3%, 6.2%)
FDA/both
n 80 46 59 55 56 52 52 65
Mean −12.6% −2.3% −2.0% 0.0% −0.1% −2.7% 2.6% 1.5%
95% CI (−21.5%, −3.7%) (−10.5%, 5.8%) (−10.3%, 6.2%) (−5.0%, 4.9%) (−7.3%, 7%) (−9.2%, 3.7%) (−2.1%, 7.2%) (−4.5%, 7.6%)
ASHP only
n 159 103 101 113 116 114 99 125
Mean −6.3% 3.5% −0.8% −3.4% −1.7% −3.8% 0.7% 2.1%
95% CI (−11.6%, −1.0%) (−3.2%, 10.1%) (−7.7%, 6.1%) (−9.1%, 2.3%) (−7.0%, 3.5%) (−9.4%, 1.8%) (−4.3%, 5.7%) (−3.6%, 7.8%)
Oral solid
n 74 51 58 54 56 53 53 70
Mean −9.0% 6.9% −3.2% −5.0% 0.5% −1.6% 1.6% 4.0%
95% CI (−17.5%, −0.5%) (−0.8%, 14.6%) (−9.2%, 2.7%) (−8.8%, −1.2%) (−4.9%, 6.0%) (−6.6%, 3.5%) (−3.1%, 6.2%) (−1.6%, 9.6%)
Parenteral
n 130 79 81 90 92 92 80 90
Mean −8.9% −1.1% 1.4% 1.1% −0.9% −3.8% 1.2% 0.6%
95% CI (−14.7%, −3.0%) (−9.2%, 7.1%) (−8%, 10.7%) (−5.7%, 7.8%) (−7.8%, 6.0%) (−10.6%, 3.0%) (−3.4%, 5.8%) (−7.0%, 8.2%)
Other
n 35 19 21 24 24 21 18 30
Mean −5.5% −1.1% −5.9% −9.1% −6.4% −6.6% 1.6% 1.0%
95% CI (−19.8%, 8.8%) (−11.2%, 9.0%) (−14.1%, 2.3%) (−20.6%, 2.5%) (−13.5%, 0.6%) (−17.7%, 4.5%) (−16.9%, 20.1%) (−5.5%, 7.5%)
Innovator brand
n 33 17 16 26 27 23 18 25
Mean −19.3% −10.8% −5.0% −10.6% −2.6% −0.3% −2.4% 6.2%
95% CI (−36.8%, −1.8%) (−31.1%, 9.5%) (−32%, 22.1%) (−25.8%, 4.6%) (−17.0%, 11.8%) (−14.7%, 14.0%) (−20%, 15.2%) (−9.8%, 22.2%)
Multisource
n 160 112 123 121 122 118 112 136
Mean −4.7% 3.7% 0.4% −1.8% −1.9% −3.3% 1.8% 0.8%
95% CI (−9.1%, −0.3%) (−1.7%, 9.1%) (−4.9%, 5.8%) (−5.4%, 1.9%) (−5.4%, 1.7%) (−7.6%, 0.9%) (−1.6%, 5.2%) (−3.0%, 4.5%)
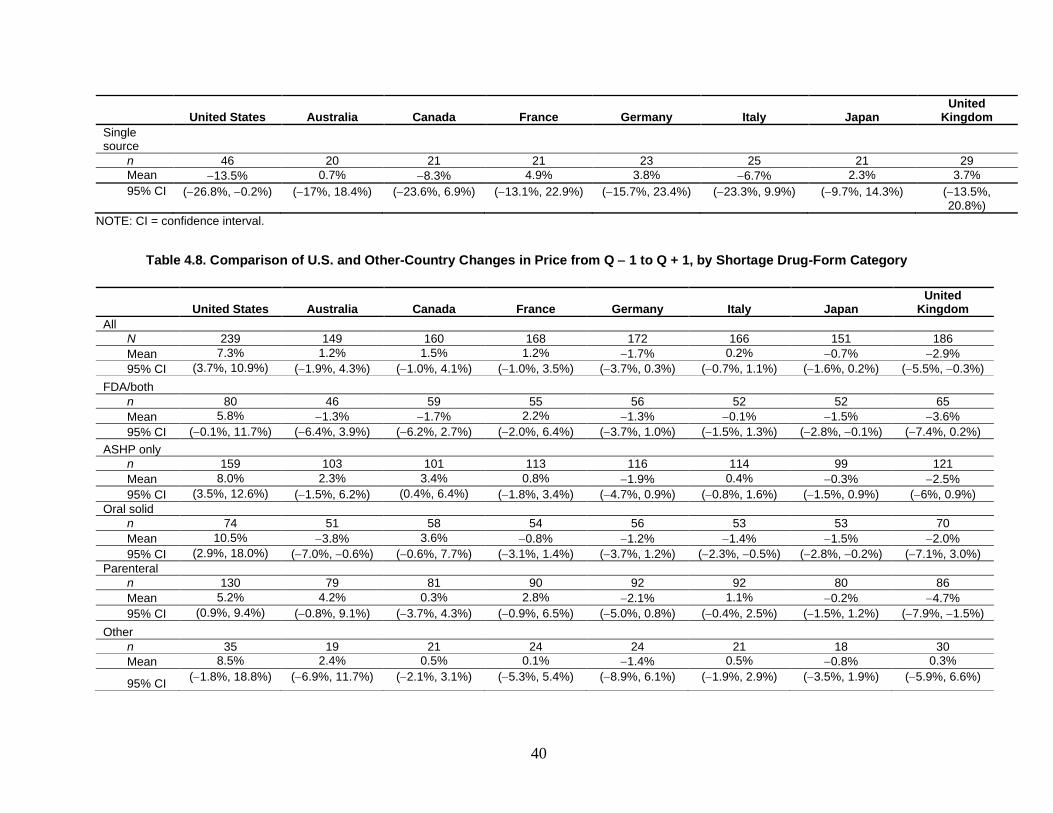
40
United States Australia Canada France Germany Italy Japan United
Kingdom
Single source
n 46 20 21 21 23 25 21 29
Mean −13.5% 0.7% −8.3% 4.9% 3.8% −6.7% 2.3% 3.7%
95% CI (−26.8%, −0.2%) (−17%, 18.4%) (−23.6%, 6.9%) (−13.1%, 22.9%) (−15.7%, 23.4%) (−23.3%, 9.9%) (−9.7%, 14.3%) (−13.5%, 20.8%)
NOTE: CI = confidence interval.
Table 4.8. Comparison of U.S. and Other-Country Changes in Price from Q − 1 to Q + 1, by Shortage Drug-Form Category
United States Australia Canada France Germany Italy Japan United
Kingdom
All
N 239 149 160 168 172 166 151 186
Mean 7.3% 1.2% 1.5% 1.2% −1.7% 0.2% −0.7% −2.9%
95% CI (3.7%, 10.9%) (−1.9%, 4.3%) (−1.0%, 4.1%) (−1.0%, 3.5%) (−3.7%, 0.3%) (−0.7%, 1.1%) (−1.6%, 0.2%) (−5.5%, −0.3%)
FDA/both
n 80 46 59 55 56 52 52 65
Mean 5.8% −1.3% −1.7% 2.2% −1.3% −0.1% −1.5% −3.6%
95% CI (−0.1%, 11.7%) (−6.4%, 3.9%) (−6.2%, 2.7%) (−2.0%, 6.4%) (−3.7%, 1.0%) (−1.5%, 1.3%) (−2.8%, −0.1%) (−7.4%, 0.2%)
ASHP only
n 159 103 101 113 116 114 99 121
Mean 8.0% 2.3% 3.4% 0.8% −1.9% 0.4% −0.3% −2.5%
95% CI (3.5%, 12.6%) (−1.5%, 6.2%) (0.4%, 6.4%) (−1.8%, 3.4%) (−4.7%, 0.9%) (−0.8%, 1.6%) (−1.5%, 0.9%) (−6%, 0.9%)
Oral solid
n 74 51 58 54 56 53 53 70
Mean 10.5% −3.8% 3.6% −0.8% −1.2% −1.4% −1.5% −2.0%
95% CI (2.9%, 18.0%) (−7.0%, −0.6%) (−0.6%, 7.7%) (−3.1%, 1.4%) (−3.7%, 1.2%) (−2.3%, −0.5%) (−2.8%, −0.2%) (−7.1%, 3.0%)
Parenteral
n 130 79 81 90 92 92 80 86
Mean 5.2% 4.2% 0.3% 2.8% −2.1% 1.1% −0.2% −4.7%
95% CI (0.9%, 9.4%) (−0.8%, 9.1%) (−3.7%, 4.3%) (−0.9%, 6.5%) (−5.0%, 0.8%) (−0.4%, 2.5%) (−1.5%, 1.2%) (−7.9%, −1.5%)
Other
n 35 19 21 24 24 21 18 30
Mean 8.5% 2.4% 0.5% 0.1% −1.4% 0.5% −0.8% 0.3%
95% CI (−1.8%, 18.8%) (−6.9%, 11.7%) (−2.1%, 3.1%) (−5.3%, 5.4%) (−8.9%, 6.1%) (−1.9%, 2.9%) (−3.5%, 1.9%) (−5.9%, 6.6%)

41
United States Australia Canada France Germany Italy Japan United
Kingdom
Innovator brand
n 33 17 16 26 27 23 18 25
Mean 5.8% −3.6% −2.2% 0.5% −4.6% −0.3% 0.0% −3.7%
95% CI (0.7%, 10.9%) (−8.6%, 1.4%) (−9.8%, 5.5%) (−4.6%, 5.5%) (−11.6%, 2.5%) (−3.4%, 2.8%) (−3.4%, 3.4%) (−6.3%, −1.2%)
Multisource
n 160 112 123 121 122 118 112 135
Mean 9.0% 0.3% 2.4% 0.0% −0.5% −0.1% −0.9% −2.1%
95% CI (4.4%, 13.7%) (−3.0%, 3.5%) (−0.6%, 5.4%) (−1.7%, 1.7%) (−2.4%, 1.4%) (−1.1%, 0.9%) (−1.9%, 0.1%) (−5.3%, 1.2%)
Single source
n 46 20 21 21 23 25 21 26
Mean 2.3% 10.7% −0.9% 9.4% −4.9% 2.2% −0.2% −6.5%
95% CI (−6.3%, 10.9%) (−2.8%, 24.2%) (−6.4%, 4.5%) (−3.9%, 22.8%) (−12.4%, 2.6%) (−0.4%, 4.8%) (−3.0%, 2.6%) (−14.4%, 1.5%)

42
Analyses of the Top 50 U.S. Shortages by Magnitude of Volume Reduction
To better understand the lack of a consistent relationship between shortages in the United
States and patterns of changes in volume in other countries, we measured changes in other
countries from Q − 1 to Q + 1 for the top 50 U.S. shortage drug forms based on the percentage
reduction in U.S. volume, as defined earlier.12 Average changes in volume included both
increases and decreases. Canada, France, and Japan had average reductions that were relatively
large in magnitude (15.1, 19.1, and 14.5 percent, respectively), and, in all three cases, these
reductions were statistically significant despite wide confidence intervals (Table 4.9).13
Table 4.9. Average Change in Volume for Top 50 Shortage Drug Forms, Q − 1 to Q + 1
N Mean 95% Confidence Interval
Australia 23 1.8% −15.6%, 19.2%
Canada 31 −15.1% −29.9%, −0.4%
France 25 −19.1% −33.2%, −4.9%
Germany 30 −9.9% −22.1%, 2.2%
Italy 30 −2.9% −16.2%, 10.3%
Japan 25 −14.5% −24.7%, −4.3%
United Kingdom 34 1.1% −10.8%, 13.0%
United States 50 −52.3% −59.5%, −45.0%
SOURCE: Authors’ analysis of FDA, ASHP, and IQVIA MIDAS data.
NOTE: N indicates the number of shortages in the top 50 for which the Q − 1 to Q + 1 delta could be calculated.
To assess whether there are clearer relationships between changes in volume and price
between the United States and other countries for shortages with larger effects in the United
States, we also summarize volume changes in other countries for the top 50 U.S. shortages
ranked by the relative magnitude of the U.S. volume reduction (Table 4.10). For every country,
there were more drugs for which there was a decrease in volume of more than 20 percent
compared with drugs for which there was an increase in volume of 20 percent. However, it also
was true that, for every country (other than the United States, by design), the number of drugs for
which there was a change in volume of −20 percent to 20 percent far exceeded the number of
drugs with larger decreases or increases in volume. The latter pattern was consistent even when
we looked at neighboring time frames (both Q − 2 to Q0 and Q0 to Q + 2) to address potential
mismatches in the timing of shortage effects across countries with MIDAS data.
12 As we did earlier, we excluded drugs that were in the bottom quartile of volume in the quarter prior to the
shortage in the United States and drugs that did not have at least $1,000,000 in combined sales in the two quarters
prior to the shortage in the United States.
13 Increases in volume were top-coded at 100 percent.

43
Table 4.10. Number of Top 50 U.S. Shortage Drug Forms by Volume Change in Other Countries,
Q − 1 to Q + 1
Decrease in Volume of
More Than 20% Increase in Volume of
More Than 20% Change in Volume of −20%
to 20%
Australia 5 2 16
Canada 8 3 20
France 9 1 15
Germany 8 3 19
Italy 8 4 18
Japan 6 0 19
United Kingdom 6 4 24
United States 50 0 0
NOTE: This table includes only drugs for which the Q − 1 to Q + 1 delta could be calculated.
We also took a closer look at the drugs for which there were more-consistent patterns in other
countries. There were no drugs for which Australia, Canada, France, Germany, Italy, Japan, and
the United Kingdom all had a decrease in volume over Q − 1 to Q + 1 of more than 20 percent.
In fact, there were no drugs for which six or more of the other seven countries had decreases (or
increases) of 20 percent or more in volume. There was one drug (abciximab) for which five of
the seven countries had decreases in volume of such magnitude, and two others (oseltamivir
phosphate and valsartan) for which four of the seven countries had large decreases (Table 4.11).
Interestingly, the three drugs each have a different form and belong to different classes of drugs.
Canada, France, and Japan all consistently had the same responses to shortages as the United
States for these three drugs; these also were the same three countries that had average reductions
in volume for the top 50 drugs that were negative and statistically significant.
Table 4.11. Volume Changes in Other Countries for U.S. Shortages, Q − 1 to Q + 1
Molecule NFC Class of
Drug
Country
Australia Canada France Germany Italy Japan United
Kingdom United States
Abciximaba F/G Platelet aggregation inhibitor
−92.0% −97.7% −63.0% −79.7% −29.7% — −7.5% −99.8%
Oseltamivir phosphateb
D/E Antiviral 12.5% −59.1% −91.3% 37.0% 14.0% −98.9% −20.5% −91.0%
Valsartanc A/B ARB anti-hypertensive
4.6% −76.2% −22.0% −22.2% −23.2% −3.2% 2.5% −61.8%
a Japan’s delta could not be calculated; the United Kingdom had a change in volume between −20 percent and 20 percent. b Australia and Italy had a change in volume between −20 percent and 20 percent; Germany had an increase in volume of more
than 20 percent. c Australia, Japan, and the United Kingdom had a change in volume between −20 percent and 20 percent.

44
Finally, we examined average changes in volume from two quarters prior to the shortage to
the quarter of the shortage (Q − 2 to Q0) and the quarter of the shortage to two quarters after (Q0
to Q + 2) for the same top 50 U.S. shortages (i.e., the top 50 was still determined based on Q − 1
to Q + 1) to determine whether it might be the case that the timing of shortages in other countries
is slightly different from that of the United States (Table 4.12).14 For both intervals, the average
changes in volume included both increases and decreases in the non-U.S. countries, although the
changes were more often negative. However, none of the changes in any non-U.S. country in
either time interval reached statistical significance.
Table 4.12. Average Change in Volume for Top 50 Drugs, Q − 2 to Q0, Q0 to Q + 2
Q − 2 to Q0 Q0 to Q + 2
Na Mean 95% Confidence
Interval Na Mean 95% Confidence
Interval
Australia 23 2.6% (−11.8%, 17.0%) 21 4.0% (−15.7%, 23.6%)
Canada 31 −10.7% (−25.4%, 3.9%) 31 0.4% (−17.4%, 18.2%)
France 25 −10.5% (−26.3%, 5.2%) 24 −12.9% (−32.2%, 6.4%)
Germany 30 −2.2% (−15.5%, 11.1%) 28 −4.0% (−20.0%, 12.0%)
Italy 31 −4.0% (−14.6%, 6.5%) 29 −7.4% (−17.6%, 2.8%)
Japan 25 −6.0% (−22.2%, 10.2%) 24 −7.5% (−23.5%, 8.5%)
United Kingdom 34 12.7% (−0.3%, 25.7%) 35 2.8% (−13.4%, 19.0%)
United States 50 −22.1% (−36.4%, −7.8%) 47 −18.4% (−35.3%, −1.4%)
a Number for which the Q − 1 to Q + 1 delta could be calculated.
Results for Antimicrobial Drugs
Antimicrobial drugs in shortage most often tend to be injectable generics, and we would
therefore expect shortages to be related to manufacturing disruptions and to be regional in nature.
In turn, we would not expect shortages that occur in the United States to have notable spillover
effects in other countries. To confirm our hypothesis of a null response internationally, we
conducted descriptive analyses among antimicrobial drugs. Compared with the overall analyses
of shortage drug forms, antimicrobial shortage drug forms experienced reductions in volume, and
increases in price, more consistently following a shortage. Although there was a clear difference
in the change in volume between shortage and nonshortage antimicrobial drug forms, there was
less of a difference in prices, number of manufacturers, and HHI, with those effects going in the
same direction for both shortage and nonshortage drug forms. Consistent with the overall
analysis, and as we hypothesized, these U.S.-based results for antimicrobial drug forms did not
align with measured changes over the same intervals in comparison countries, which suggests
14 Increases in volume were top-coded at 100 percent.

45
that shortages of antimicrobials in the United States might not happen in other countries at the
same time. For the full results from this analysis, see Appendix E.
Results for Immune Globulin Products
IG products have a long history of shortages, and they are a prime example of a drug for
which demand has increased and supply has not been able to increase as rapidly because of
challenges in manufacturing (specifically, shortages of human plasma, which is typically sourced
domestically, that is needed to manufacture IG products). Given this background, it is unlikely
that shortages in the United States would affect other countries. However, the same issue (i.e.,
difficulty in rapidly increasing the supply of human plasma) is likely to be a worldwide
phenomenon. The results from the descriptive analyses of IG products suggest that although IG
products in shortage in the United States were more likely to have larger average reductions in
volume compared with nonshortage products over the same period, there is substantial variation
in the volume of IG products over time. Patterns were even more difficult to discern in other
countries; Germany and the United Kingdom followed a similar pattern to that of the United
States (i.e., larger reductions in volume among U.S. shortage drugs compared with nonshortage
drugs), while France and Italy experienced the opposite pattern. In general, these analyses
suggest that, as expected, shortages of IG products in the United States do not play out
consistently in other countries. For the full results from this analysis, see Appendix F.
Estimated Coefficients from Regression Models
As a final step, we estimated random effects models where we regressed log-transformed
quarterly volumes and prices measured separately in the United States and comparison countries
on a quarterly flag for U.S. shortage status, controlling for differences in preshortage volume,
form, and brand or generic market category. We used all U.S. data for the initial U.S. model. For
each comparison country, we first estimated a model using all data from the comparison country
(e.g., Australia) and then estimated a model using all U.S. data for drugs that were also sold in
the comparison country (e.g., all U.S. data for drugs also sold in Australia).
Figure 4.8 presents estimated coefficients on the quarterly U.S. shortage flag from models
with log volume as a dependent variable. The magnitude of the estimated U.S. coefficient varies
because the number of matching U.S. drugs contributing to models varies depending on the
comparison country. In all cases, though, the estimated U.S. coefficient is negative and
statistically significant. This result matches our descriptive statistics presented earlier. For the
U.S.-only model (top bar), quarters with a shortage flag had, on average, 31.0 percent lower
volume. In all cases, the estimated U.S. coefficient is larger in magnitude than the estimated
other-country coefficient. Two of the individual other-country coefficients are significant
(Australia at p = 0.001 and France at p = 0.006).
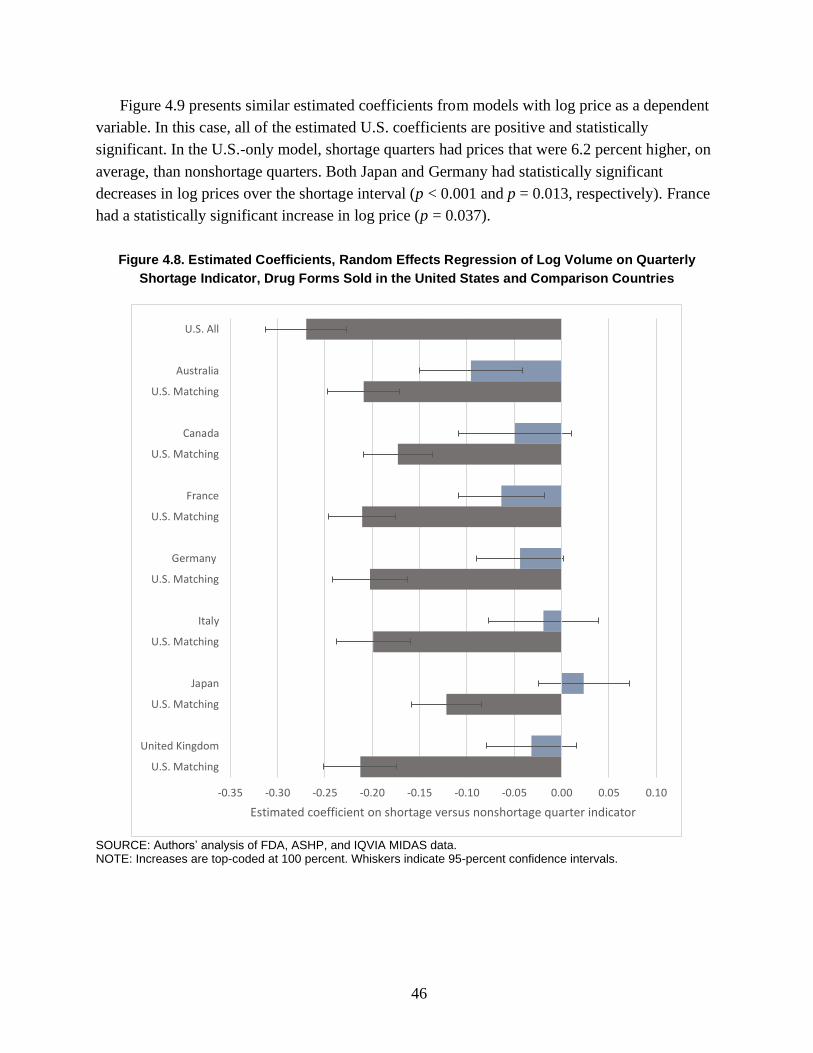
46
Figure 4.9 presents similar estimated coefficients from models with log price as a dependent
variable. In this case, all of the estimated U.S. coefficients are positive and statistically
significant. In the U.S.-only model, shortage quarters had prices that were 6.2 percent higher, on
average, than nonshortage quarters. Both Japan and Germany had statistically significant
decreases in log prices over the shortage interval (p < 0.001 and p = 0.013, respectively). France
had a statistically significant increase in log price (p = 0.037).
Figure 4.8. Estimated Coefficients, Random Effects Regression of Log Volume on Quarterly
Shortage Indicator, Drug Forms Sold in the United States and Comparison Countries
SOURCE: Authors’ analysis of FDA, ASHP, and IQVIA MIDAS data. NOTE: Increases are top-coded at 100 percent. Whiskers indicate 95-percent confidence intervals.
-0.35 -0.30 -0.25 -0.20 -0.15 -0.10 -0.05 0.00 0.05 0.10
U.S. All
Australia
U.S. Matching
Canada
U.S. Matching
France
U.S. Matching
Germany
U.S. Matching
Italy
U.S. Matching
Japan
U.S. Matching
United Kingdom
U.S. Matching
Estimated coefficient on shortage versus nonshortage quarter indicator

47
Figure 4.9. Estimated Coefficients, Random Effects Regression of Log Price on Quarterly
Shortage Indicator, Drug Forms Sold in the United States and Comparison Countries
SOURCE: Authors’ analysis of FDA, ASHP, and IQVIA MIDAS data. NOTE: Increases are top-coded at 100 percent. Whiskers indicate 95-percent confidence intervals.
Summary of Results
We found broadly heterogeneous responses to drug shortages in the United States, with
increases and decreases in volume during the period surrounding the shortage about equally
likely. On average, U.S. shortages are associated with modest decreases in U.S. volume (about 8
percent) and modest increases in U.S. prices (about 7 percent). The volume reduction was
relatively larger for shortages included in both the FDA and ASHP databases. Few of these U.S.-
focused results aligned with measured changes over the same intervals in comparison countries,
even when we limited the analysis to shortages with the largest impacts on U.S. markets. We
found some evidence that volume in other countries declines in line with U.S. shortages in
-0.08 -0.06 -0.04 -0.02 0.00 0.02 0.04 0.06 0.08 0.10
U.S. All
Australia
U.S. Matching
Canada
U.S. Matching
France
U.S. Matching
Germany
U.S. Matching
Italy
U.S. Matching
Japan
U.S. Matching
United Kingdom
U.S. Matching
Estimated coefficient on shortage versus nonshortage quarter indicator

48
certain countries, such as France and Australia, but not for other countries. Overall, the
geographic scope of most U.S. shortages appears to be domestic, even if there is a small number
of shortages that play out on a broader global scale.
49
5. Discussion and Conclusion
We found limited evidence that U.S. shortages are associated with volume and price changes
in other countries. Even when focusing on “major” U.S. shortages for drug forms with
substantial U.S. preshortage volume and the largest relative declines in U.S. volume, we rarely
found corresponding changes in other countries. Interpreted broadly, our results suggest that few
U.S. drug shortages play out on a global scale or on a similar timeline across multiple countries.
Instead, it appears that many U.S. shortages are either domestic or perhaps regional in
geographic scope.
Even within the United States, we observed heterogeneous responses in terms of volume,
price, number of manufacturers, and HHI to U.S. drug shortages compiled from both the FDA
and ASHP databases. Nearly as many drugs experienced increases in volume and decreases in
prices after shortage as changes in the other direction. Although decreases in volume are
expected, increases might occur if the supply response to shortages is robust, in the event of
intervention by FDA or other policymakers, or in cases in which shortages are attributable to
increases in demand rather than disruptions to supply. On average, volume for shortage drug
forms decreased by 8.4 percent from the quarter prior to the quarter after the shortage started,
and average price increased by 7.3 percent over the same interval. The small magnitudes of these
changes could reflect a preponderance of technical shortages in our data. Shortages in the FDA
database, which are more likely to be practical shortages with implications for prescribers and
patients, were associated with a reduction in volume that was more than twice as large as that of
shortages that were listed only in the ASHP database.
We also studied antimicrobial and IG drugs more closely. We found that for these two types
of drugs, which are known to have long-standing issues with shortages, shortage drugs more
frequently experienced reductions in volume through the onset of shortages than nonshortage
drugs.
Our findings related to U.S. outcomes for U.S. shortages are largely consistent with prior
research. For example, the FDA Drug Shortages Task Force report indicates that roughly half of
CDER shortages led to increases in revenue, while roughly half led to decreases in revenue
(FDA, Drug Shortages Task Force, 2020), which corresponds to the very broad distributions of
changes in volume and prices described in this report. The same report also noted that 18 percent
of drugs in shortage had a sustained price increase, 42 percent had significant product increases,
and 30 percent had their supply restored to at least 100 percent of preshortage levels, all of which
are consistent with our findings of varied U.S. changes in volume and price through recorded
shortages.

50
Limitations
There are several important data and methods factors that might have driven our results
toward a null finding. First, although the ASHP database records shortages at a granular NDC
level, we assembled a shortage database at a more aggregated drug-form level for the purpose of
matching to the IQVIA MIDAS data. This step might have masked much larger changes in
volume, price, and other outcomes for the specific drug products in shortage. Our more-
aggregated data might reflect the implications of policy and industry responses to shortage, such
as efforts to increase product by manufacturers or in regions that were unaffected by the
shortage. Future analyses could attempt a more specific match between NDC-level shortage data
and international sales data measured at a similar level of aggregation.
Second, although we explored the possibility that the timing of shortage impacts plays out on
a different time frame in the United States and other countries in some of our analyses, we
generally focused on the timing of shortages in the United States to frame our comparison to
other countries. According to our in-depth review of changes in volume and prices in countries
other than the United States for the top 50 U.S. shortages, it does not appear that there are
systematic leading or lagged implications of U.S. shortages in other countries. In our informal
analysis of available drug shortage lists in other countries, we did find some overlap in the drugs
listed in the United States and on other-country lists, although the timing of the reported
shortages was often off by several years when we excluded some well-known global shortages
(such as the valsartan shortage related to a global API purity issue). More generally, given the
challenges in defining shortages discussed throughout this report, it is likely difficult to
determine a specific date when a U.S. shortage starts. It is not always clear whether the start
dates reported in U.S. FDA and ASHP databases reflect a “best guess” of the start of a shortage,
the date a shortage was reported by manufacturers or pharmacists, or the date that FDA or ASHP
added the shortage to their databases. Mismatches between how dates are determined and how
they are included in databases introduce measurement error in our analyses.
Third, our IQVIA MIDAS data include sales and volume information at the quarterly level,
which is less precise than the specific shortage start and stop dates in the source shortage
databases. We used a set of date overlap thresholds to avoid assigning an entire quarter to the
shortage category when the shortage event overlapped with the quarter for a short time.
Relatedly, the IQVIA MIDAS data are based on transactions between manufacturers,
wholesalers, and points of dispensing (pharmacies and hospitals) rather than when drugs are
actually administered or dispensed to patients. Although estimates are not readily available, our
impression is that the time from the transactions contributing to MIDAS data (i.e., transactions
among manufacturers, distributors, and pharmacies and other points of dispensing) to the use of
drugs by patients is typically short, although it might be longer for some distribution channels
and classes of drugs. The relatively coarse time-series data and the gap between transaction and

51
dispensing might wash out some effects of shortages that could be detectable in drug market data
with more-frequent measurements.
Fourth, we were unable to assess several hypotheses of interest because of inconsistent and
incomplete data on the cause of each shortage in the FDA and ASHP databases. Although both
databases included variables purporting to report this information, these variables were only
sometimes populated and most often included a very general description that we decided could
not be included in our analysis. With more-complete and -reliable data on shortage causes, future
analyses might be able to explore the implications of shortages with specific causes (e.g.,
disruptions in the supply of APIs, which might be more likely to play out on a global scale) more
narrowly. As another example, although our shortage data do not cover recent supply-chain
disruptions related to the coronavirus disease 2019 (COVID-19) pandemic, even with more-
recent data, the absence of complete information on shortage causes complicates analysis of
these shortages.
Fifth, some shortages likely result in substitution to similar products—for example, other
presentations of a drug in shortage or other drugs in the same therapeutic class. We did not have
therapeutic class data on hand for this analysis. Future analyses could measure the extent of
substitution within class as an effect of shortages, with important implications for other
manufacturers, prescribers, and patients.
Sixth, drug companies, health care delivery systems, and governments in the United States
and in other countries can and do intervene to prevent shortages and mitigate their effects. These
interventions—for example, regulatory exceptions to import products from other countries or to
allow the sale of products that do not meet safety or quality requirements—might mask
important effects of shortages in our MIDAS data, pulling our observed results toward zero. Our
comparisons of U.S. and other-country outcomes could reflect interventions in only the United
States, only other countries, or both the United States and other countries. Relatedly, the
feasibility of different strategies to address shortages in the United States depends on the way in
which drugs are acquired, distributed, and paid for in specific countries.
Finally, although both the FDA and ASHP databases were generally internally consistent, we
identified some issues with the source FDA and ASHP data that might affect our results,
including some shortages with missing start dates, shortages that might not have been updated
recently, and inconsistencies between the indicated status and dates.
Assessment of the Global Nature of Drug Shortages
Although drug shortages are a global problem, past research on shortages applies a primarily
domestic perspective. This is, to some extent, expected given differences in institutions and
policies between countries. However, in the context of an increasingly globalized pharmaceutical
industry and efforts for regulatory harmonization across countries, a global perspective has the
potential to both increase our understanding of how shortages play out and help develop and

52
target interventions to prevent and address shortages. In this research, we aimed to assess
whether drug shortages are typically global in scope (i.e., affecting all countries simultaneously)
or whether drug shortages are typically narrower in geographic scope despite occurring
worldwide.
Our results suggest that the latter characterization is more often correct. We identified
occasional and tenuous relationships between U.S. shortage events and changes in outcomes in
other countries. Although a small number of “major” U.S. shortages and case studies did appear
to play out on a global scale, most shortages in U.S. databases did not. Even when the same
drugs were in shortage in the United States and in other countries, there was often a considerable
temporal gap between shortage events.
U.S. policymakers have a variety of tools at their disposal to combat drug shortages both
before and after they occur, including exercising regulatory discretion, working with existing
and/or new manufacturers to increase supply, and, when appropriate and feasible, importing
unapproved versions of drugs from foreign manufacturers. Delivery systems, including
prescribers, pharmacists, and hospitals, also play an important role in combating shortages—for
example, by identifying substitute products, adjusting clinical care, and more efficiently
allocating available supply. Our findings suggest that strategies leveraging supply from countries
outside the United States might be a promising approach to address at least some U.S. shortages
given expected shortage timelines and overlap between available foreign products and U.S.
products in shortage. As a practical example of this strategy, we described how the U.S. FDA
allowed for the emergency importation of heparin that was manufactured abroad in response to
production disruptions at one of Baxter’s North American production facilities.
The Need for a Clearer Definition and Characterization of Shortages
The lack of standardized definitions and the lack of data are major challenges to future
research in this area, and more research on the geographic extent of drug shortages would be
feasible if harmonized definitions and data were available. Even the definition of what
constitutes a drug shortage is ambiguous, with FDA and ASHP taking different approaches in the
United States and global regulatory bodies and the World Health Organization (WHO) each
applying separate definitions. There is broad consensus that shortages are the result of
mismatches between supply and demand, but specific definitions rely on different perspectives
and subjective assessments to flag a drug as in shortage.
One possibility is for WHO or another organization to step in and make these determinations.
However, there are significant challenges in applying subjective definitions across all countries,
given differences in disease prevalence, delivery systems, the willingness and ability to pay for
drugs, and other factors. Another possibility is to consider some “gray areas” or a continuum
acknowledging that the degree to which a drug is essential in the context of available alternatives
and the extent of mismatch between supply and demand could vary from shortage to shortage.
53
The discussion around drug shortages benefits from a comprehensive, shared typology that
can be used to characterize shortages. Such a typology is difficult to develop because of the
variety of proximal causes and contributing factors to shortages. The framework from Acosta et
al., 2019, is a helpful first step. We suggest two main additions to this framework that focus on
the global nature of the pharmaceutical industry and drug shortages. First, considering the
geographic scope of a shortage seems important to help regulators in individual countries and
those with a broader perspective understand which policy tools and strategies have the greatest
likelihood of success at mitigating the shortage. Although our analysis focused primarily on
estimating average changes in volume and prices in other countries that correspond with U.S.
shortages, through our case studies, we identified a very small number of shortages that did
appear to play out on a global scale (e.g., valsartan and losartan). A different set of policy tools
may be necessary to address these cases. Second, we recommend considering the evolution of
shortages over time as it relates to geography, with a focus on how initial signals and effects in
some markets might have downstream implications elsewhere.
The Need for Better Data on Shortage Causes
Related to our recommendation for clearer characterization of shortages, we think that it is
important that policymakers and researchers have access to better information about the root or
proximal causes of shortages. We recognize that collecting such information is a challenging
exercise. In some cases, information is often voluntarily reported to FDA by manufacturers, and
there might be some hesitation to release the information publicly. In other cases, FDA might not
have complete information about the context around drug supply chains or shortages. As a sign
of the incomplete information available to the federal government, two recent Executive orders
require the U.S. Department of Health and Human Services to collect and report new information
related to prescription drug supply chains, both general and specific to the response to the
COVID-19 pandemic (Biden, 2021a; Biden, 2021b).
Unfortunately, both of the existing U.S. shortage databases have incomplete information
about the reasons for individual shortages, and, even when information is provided, it is usually
not sufficient to gain a complete understanding of the likely cause. Given the limitations of the
available data and our study, we were unable to assess whether the root cause of a shortage is an
important predictor of the magnitude of changes in outcomes or whether intervention by FDA,
health care delivery systems, or others mitigated what otherwise would have been larger
changes.
Both researchers and policymakers will benefit from more-complete and more-detailed
information about drug shortage causes. As an example, FDA might respond very differently to a
shortage caused by a global issue with API supply versus another shortage caused by a U.S.
manufacturing site closure, even if both shortages are related to “manufacturing disruptions.”
FDA could conduct additional analyses using more-detailed information that is reported
voluntarily by manufacturers. The analyses could focus on associations between shortage causes

54
and outcomes and should be available publicly. Furthermore, the U.S. Congress and/or FDA
could weigh the advantages and disadvantages of further public reporting requirements related to
shortages, including more-detailed information on shortage causes. Currently, the specific
categories of shortage causes reported publicly in FDA’s shortage database are specifically
defined in the Food and Drug Administration Safety and Innovation Act (Pub. L. 112–144,
2012).
Relatedly, Congress also could consider providing FDA with the authority to require
manufacturers to report more-detailed information about where drugs ultimately sold in the
United States are manufactured (e.g., the volume of specific products manufactured at different
facilities). FDA requires license holders to register manufacturing facilities but not the volume of
U.S.-bound products manufactured in each facility. As a result, FDA, as a regulator, has an
incomplete picture of the risk posed by shortages of different types in terms of likely impacts on
the United States.
Finally, researchers and policymakers could benefit from more–readily available information
about historical shortages. Currently, only FDA shortage data for current and recently resolved
shortages are available for download.
Differentiating Between Technical and Practical Shortages
We think that it is likely that a sizable share of shortages included in the ASHP database are
technical rather than practical, although we do not directly address this in our study. In other
words, although some ASHP shortages technically record difficulties faced by pharmacists in
acquiring certain drug products, they might not result in practical changes in patient care. We
stress that even technical shortages might have important implications for quality of care and
could involve costs on the part of pharmacists and health care delivery systems to resolve.
However, we think that practical shortages might be of more relevance to policymakers. ASHP
could expand its database to differentiate between technical and practical shortages. For
example, in addition to confirming shortages with manufacturers, ASHP could confirm with
reporting pharmacists or others in health care delivery systems whether shortages are having
practical implications on prescribing patterns and patient care.
Understanding Price Responses to Shortages
We found highly variable changes in U.S. prices through U.S. drug shortages, with an
average 7.3-percent increase from the quarter prior to the shortage to the quarter after the start of
the shortage, but with roughly as many drug forms with decreasing and increasing prices.
Whether prices are expected to increase or decrease depends on context. In some cases, new
entry into a drug-form market to address a shortage could drive new competition, leading to
lower prices. In other cases, shortages could drive up prices as buyers compete for diminished
supply. Furthermore, contracts between manufacturers and distributors might lock in pricing
over a longer period than the duration of many shortages, diminishing the potential to observe

55
price increases in the MIDAS data. The United States is unique among other countries in
allowing unconstrained pricing on the part of manufacturers. We found muted price changes in
other countries (or consistent price decreases), which might reflect price regulation elsewhere.
Conclusion
Although prescription drug supply chains are global, we found that most U.S. shortages
appear to be domestic in scope. The most-severe U.S. shortages, measured by decreases in
volume, only occasionally affected other countries in the same way. Although it is important to
keep the global perspective in mind when addressing drug shortages, regulators, other
policymakers, and the entire health care system should explore ways to leverage supply of drugs
in other countries in response to U.S. shortages.

56
Appendix A. Overview of Drug Shortage Definitions and
Databases
In this appendix, we describe our approach and findings from a review and comparison of
drug shortage databases in the United States and other countries.
Approach
To better understand how the United States and other OECD countries track drug shortages,
we conducted targeted searches of peer-reviewed literature and websites of regulatory agencies.
We searched PubMed and conducted an advanced Google search for articles related to tracking
drug shortages in the United States and other countries using the following search terms:
(drug*[title] OR medicine*[title]) AND shortage*[title] AND (database* OR track* OR list*).
This search identified roughly 35 articles in PubMed and eight additional websites or reports on
Google. Although most were not directly relevant to this work, one article, a 2019 scoping
review by Acosta and colleagues, described medicine shortages across various countries. We
used that article to identify shortage databases in addition to drug shortage databases that we
directly targeted based on input from ASPE (e.g., European Medicines Agency [EMA], ASHP,
FDA’s CDER, FDA’s CBER, and Health Canada). In addition, the EMA lists the shortage
websites for several European countries (EMA, undated-c). We also used Google to search for
shortage databases in OECD countries that had not been identified by our prior searches.
In total, we examined reports of 52 online drug shortage reporting systems in different
countries (including the United States). We were able to locate a drug shortages database or a
description of the drug shortage reporting system in English for 34 of the 52 cases; most of the
remaining cases were not available in English or were not actually shortage databases (for
example, we did not include databases that listed only discontinued medications). Of these 34
databases, 32 were from countries other than the United States. We reviewed the websites of
each of these databases and any associated documentation and described each database,
including the country and/or geographic scope and medicines covered (Table A.1).15 We also
identified and summarized a set of WHO criteria for drug shortages.
15 Table A.1 describes each of the non-U.S. drug shortage databases that we identified in our search with
information available in English. We included countries for which databases could be located and navigated with the
assistance of Google Translate. The shortage definitions in the table are from shortage websites and are only slightly
edited if additional context was needed.

57
Table A.1. Non-U.S. Drug Shortage Databases with Information Available in English
Geographic Scope
Database Name and/or Organization
Availability of Information
Online Covered Medicines Drug Shortage Definition
Argentina Argentina National Administration of Medicines, Food and Medical Technology (Government of Argentina, Ministry of Health, undated)
Database only Not available Not available
Australia Australian Medicine Shortages Information Initiative (Australian Government, Department of Health, undated)
Both database and description
Prescription drugs and nonprescription medicines that are critical to public health are included.
There is a shortage of a medicine in Australia at a particular time if, at any time in the six months after that particular time, the supply of that medicine in Australia will not—or will not be likely to—meet the demand for the medicine for all of the patients in Australia who take, or who may need to take, the medicine.
Austria Austrian Medicines Agency’s Shortages Catalogue (Austrian Federal Office for Safety in Health Care, 2021)
Both database and description
Prescription medicines Not available
Belgium PharmaStatus (Federal Agency for Medicines and Health Products, undated-b)
Both database and description
Not available Interruption of commercialization means that commercialization is stopped for a longer period (usually longer than one year), but with the intention of commercializing the medicine again. Temporary unavailability means that a medicine will be unavailable for a short period (a maximum of one year). There is a commercialization stop if commercialization is stopped permanently.
Canada Canadian Drug Shortage Databank (Drug Shortages Canada, undated)
Both database and description
Prescription drugs and nonprescription drugs that require provider supervision for administration
A shortage means a situation in which the manufacturer is unable to meet the Canadian demand for the drug.
Colombia (May 2018 to present)
Colombia National Institute of Food and Medicines Surveillance (National Institute of Food and Medicines Surveillance, undated)
Description only Not available Not available
Colombia (2012–April 2018)
Colombia Ministry of Health (Government of Colombia, Ministry of Health, undated)
Both database and description
Not available A situation in which there is not enough supply to satisfy the demand of a medicine approved and marketed in the country
Czech Republic
Czech State Institute for Drug Control (State Institute for Drug Control, undated)
Both database and description
Not available Not available
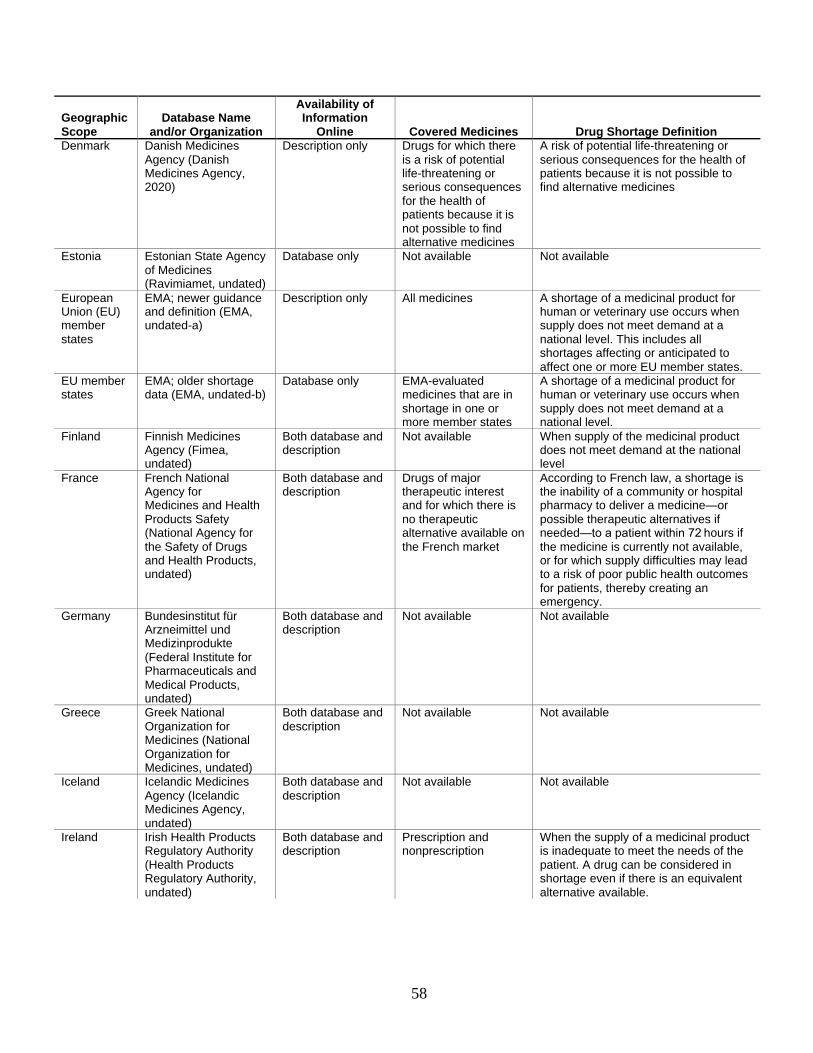
58
Geographic Scope
Database Name and/or Organization
Availability of Information
Online Covered Medicines Drug Shortage Definition
Denmark Danish Medicines Agency (Danish Medicines Agency, 2020)
Description only Drugs for which there is a risk of potential life-threatening or serious consequences for the health of patients because it is not possible to find alternative medicines
A risk of potential life-threatening or serious consequences for the health of patients because it is not possible to find alternative medicines
Estonia Estonian State Agency of Medicines (Ravimiamet, undated)
Database only Not available Not available
European Union (EU) member states
EMA; newer guidance and definition (EMA, undated-a)
Description only All medicines A shortage of a medicinal product for human or veterinary use occurs when supply does not meet demand at a national level. This includes all shortages affecting or anticipated to affect one or more EU member states.
EU member states
EMA; older shortage data (EMA, undated-b)
Database only EMA-evaluated medicines that are in shortage in one or more member states
A shortage of a medicinal product for human or veterinary use occurs when supply does not meet demand at a national level.
Finland Finnish Medicines Agency (Fimea, undated)
Both database and description
Not available When supply of the medicinal product does not meet demand at the national level
France French National Agency for Medicines and Health Products Safety (National Agency for the Safety of Drugs and Health Products, undated)
Both database and description
Drugs of major therapeutic interest and for which there is no therapeutic alternative available on the French market
According to French law, a shortage is the inability of a community or hospital pharmacy to deliver a medicine—or possible therapeutic alternatives if needed—to a patient within 72 hours if the medicine is currently not available, or for which supply difficulties may lead to a risk of poor public health outcomes for patients, thereby creating an emergency.
Germany Bundesinstitut für Arzneimittel und Medizinprodukte (Federal Institute for Pharmaceuticals and Medical Products, undated)
Both database and description
Not available Not available
Greece Greek National Organization for Medicines (National Organization for Medicines, undated)
Both database and description
Not available Not available
Iceland Icelandic Medicines Agency (Icelandic Medicines Agency, undated)
Both database and description
Not available Not available
Ireland Irish Health Products Regulatory Authority (Health Products Regulatory Authority, undated)
Both database and description
Prescription and nonprescription
When the supply of a medicinal product is inadequate to meet the needs of the patient. A drug can be considered in shortage even if there is an equivalent alternative available.

59
Geographic Scope
Database Name and/or Organization
Availability of Information
Online Covered Medicines Drug Shortage Definition
Italy Italian Medicines Agency (Italian Medicines Agency, undated)
Both database and description
Medicines that are essential for the treatment of certain conditions
Medicines that are not available or not to be found on the whole Italian market because the marketing authorization holder is unable to guarantee the correct and regular supply to meet patients’ needs
Latvia Latvian State Agency of Medicines List of Medicine Shortages (Republic of Latvia, State Agency of Medicines, undated)
Both database and description
Not available Not available
Netherlands Royal Dutch Society for the Promotion of Pharmacy Pharmaco Database (KNMP Farmanco, undated)
Both database and description
Not available Not available
Norway Norwegian Medicines Agency (Norwegian Medicines Agency, 2020)
Description only Not available Not available
Slovakia Slovakia State Institute for Drug Control’s “List of Medicinal Products for Which They Were Issued Decisions Not to Allow the Export from Slovak Republic” (State Institute for Drug Control, undated)
Database only Not available Not available
Slovenia Slovenia’s Agency for Medicinal Products and Medical Devices and Health Insurance Institute (Agency for Medicinal Products and Medical Devices of the Republic of Slovenia, undated)
Both database and description
Not available Disruption in the supply of a medicinal product is defined as a state of the market in which business entities responsible for market supply in the Republic of Slovenia fail to provide the required amounts of medicinal products at the appropriate time.
Spain Spanish Agency for Medicines and Medical Devices (Government of Spain, Department of Health, Agency for Medicines and Health Products, undated)
Database only Not available A problem of supply is a situation in which the available units of a drug in the pharmaceutical channel are inferior to the needs of national or local consumption. Problems of supply are usually caused by problems in the manufacture or distribution of the medicine.
Sweden Swedish Medical Products Agency (Swedish Medical Products Agency, 2021)
Both database and description
Not available Not available
Switzerland Swiss Federal Office for National Economic Supply (Federal Office for National Economic Supply, 2020b)
Both database and description
Vital human medicines Not available
Switzerland Swissmedic (Swissmedic, undated)
Database only Not available Not available

60
Geographic Scope
Database Name and/or Organization
Availability of Information
Online Covered Medicines Drug Shortage Definition
Switzerland Switzerland Martinelli Consulting (DrugShortage.ch, undated)
Both database and description
Not available Not available
United Kingdom
UK Specialist Pharmacy Service (Jenkins, 2019)
Database only Not available Not available
Uruguay Uruguay Ministry of Public Health (Government of Uruguay, Ministry of Public Health, 2020)
Description only Not available Not available
The FDA and ASHP Databases
In earlier chapters of this report, we introduced the two primary national sources of
information about drug shortages in the United States that we identified in our search: the FDA
and ASHP databases (ASHP, undated-b; FDA, undated-a; FDA, undated-b). Within FDA, both
CDER and CBER maintain lists of drugs in shortage under the purview of their respective
centers.16 The FDA CBER database is not readily available in a format to be used by researchers.
For the purposes of the analyses conducted in this report, we therefore used a combination of the
ASHP database and the FDA CDER database, and we refer to the FDA CDER database as the
FDA database throughout. Separately, ASHP maintains a database of drug shortages reported
primarily by pharmacists (ASHP, 2014; FDA, undated-b; FDA, Drug Shortages Task Force,
2020). FDA’s drug shortage lists are targeted at informing the public about shortages, whereas
the ASHP database is meant to aid pharmacists and health care practitioners with managing
supply (Wosińska, Fox, and Jensen, 2015).
Definitions and Conventions
As noted earlier, FDA and ASHP use different definitions of drug shortages. ASHP states
that a shortage is a supply problem that affects “how the pharmacy prepares or dispenses a drug
product or influences patient care when prescribers must use an alternative agent” (ASHP,
undated-a), while FDA defines a drug shortage as a situation in which overall supply does not
meet market demand (FDA, undated-b).17 Furthermore, FDA focuses on shortages of medically
necessary products that have a significant effect on public health. FDA requires notifications for
drugs and biologics that are “life supporting, life sustaining . . . [or] intended for use in the
16 CDER regulates small-molecule drugs and therapeutic biologics, while CBER regulates blood products and other
biologics.
17 The Drug Shortages Staff Drug Shortages List definition further specifies that it is a situation in which “current or
projected demand at the user level” is unmet, whereas the CBER Current Shortages List definition does not include
these specifications (FDA, undated-c).
61
prevention or treatment of a debilitating disease or condition” (21 CFR § 600.82) and that do not
have substitutes, while the ASHP database includes all drugs that it confirms as being in shortage
(FDA, 2020; ASHP, 2014).18 FDA marks shortages as resolved when market demand for a
product is covered by at least one manufacturer, while ASHP requires that “all manufacturers of
the drug restore all formulations and dosage sizes to full availability” to mark the shortage as
resolved (ASHP, 2014). In general, FDA includes market-wide shortages and does not include
information about shortages that are expected to resolve quickly or for which only a particular
strength, package size, or manufacturer is unavailable in cases in which substitutes remain
available, while ASHP does include such shortages. A more detailed description of the
differences in shortage definitions and identification of shortages can be found in a 2015 Health
Affairs Blog post by Wosińska, Fox, and Jensen.
FDA and ASHP also use different methodologies for collecting information on drug
shortages. ASHP receives voluntary reports from pharmacists, other health care practitioners,
and patients on difficulties accessing specific products (i.e., by presentation and manufacturer).
ASHP then confirms the shortage by contacting the manufacturer. For the FDA lists, federal
rulemaking requires that manufacturers notify FDA about a “permanent discontinuance” or
“interruption” in the manufacture of covered drugs and biologics (FDA, 2020). FDA then
confirms these reports using information from manufacturers, distributors, and market share data
before publicly listing the shortage (FDA, undated-b).
Availability
FDA’s CDER drug shortage database is publicly available for download on the FDA website,
and it contains information about the generic name, form, strength, package size, NDC,
manufacturer, and therapeutic class of each included drug in shortage. It also includes the
following information about the shortage: status (current, resolved, to be discontinued), the
initial posting date of the shortage, status updates (new, reverified, revised), and the update date.
The data also include a field with the reason for the shortage (e.g., manufacturing delay,
regulatory delay, shortage of active ingredient or inactive ingredient component, discontinuation,
delay in shipping, increase in demand), but the field is missing for about 60 percent of the
records. The FDA database lists drugs that are currently in shortage and drugs that were in
shortage but were resolved within the past six months or discontinued within the past 12 months.
18 Section 506C of the Federal Food, Drug, and Cosmetic Act (Pub. L. 117–11, 2021) and the final rule
implementing Section 506C (FDA, 2015, p. 38915) state that the notification requirement covers “life supporting,
life sustaining” drugs and biologics and those “intended for use in the prevention or treatment of a debilitating
disease or condition” except for radiopharmaceuticals. Specifically, “life supporting and life sustaining” means
being “essential to, or [yielding] information that is essential to, the restoration or continuation of a bodily function
important to the continuation of human life” (FDA, 2015, p. 38917). However, the CBER and CDER databases both
use the term medically necessary in relation to the drugs and biologics deemed as being in shortage. Although both
centers have similar definitions for medical necessity, even these differ slightly. Ultimately, the definitions of
medically necessary and the definitions stated in section 506C and the final rule seem to be very similar.

62
The ASHP database is available on the ASHP website, but the Microsoft Excel file must be
requested. The file includes the generic name of the drug, the NDC (which indicates the form,
strength, and manufacturer), the start and end date of the shortage, and the status (active,
resolved, no longer available, no commercially available preparations). A prior version of the
database file that was sent to us by ASHP also had a field for the shortage reason. However, that
version did not include the NDC, which we needed to match the ASHP database to the FDA
database and to more cleanly match the joined shortage database with the MIDAS data.
Therefore, we were not able to make use of the reason-for-shortage field.
The ASHP database file includes shortages with start dates in 2015 or later. A
disproportionately large share of shortages in the ASHP database have 2015 start dates.
According to responses to our inquiries of ASHP, this is likely because of ongoing shortages
being assigned a 2015 start date as ASHP transitioned to a new NDC-based database in 2015.
For example, a shortage that began in 2014 might be assigned a mid-2015 start date if that
shortage was entered in the database at the NDC level in mid-2015. As a result, our analyses
focus on ASHP data from 2016 onward because we are more confident that the start dates reflect
the actual shortage start date rather than a database entry event.
Shortage Databases in Other Countries
We located descriptions of 31 distinct drug shortage reporting systems that were in English
for countries other than the United States.19 In some instances, a single country might have had
more than one database or reporting system. Of those 31 systems, 26 included databases in
addition to descriptions, 22 of which were from European countries, two of which were from
South America, one of which was from Canada, and one of which was from the Australian
Medicine Shortages Agency.20 Of the 31 total databases or descriptions we located, 14 included a
description of how shortages were defined (Table A.2).
19 This included a few instances in which the databases and/or descriptions were located and navigable using Google
Translate. 20 Almost all of the reporting systems and databases use the term shortage. Only the Belgian Federal Agency for
Medicines and Health Products PhamaStatus database, which reports drugs for which commercialization is
temporarily interrupted or permanently stopped and drugs that are otherwise unavailable, uses terms similar to but
distinct from shortage. For simplicity, we refer to this database as a shortage database (Federal Agency for
Medicines and Health Products, undated-a).

63
Table A.2. Characteristics of Other Countries’ Shortage Databases
Characteristic Number
Total number of databases identified 31
Number of databases for which only descriptions could be located 5
Number of databases that could be directly located or accessed 26
Number of databases that included information about which drugs were covered 11
Number of databases that included a definition of shortages 14
Criteria for Inclusion in Shortage Databases
The 31 reporting systems or databases that we reviewed apply several criteria for
determining drug and biologics shortages. Ten of these databases specified these criteria (see
Table A.1). The criteria mostly fall into two categories: objective criteria about the type of drug
and subjective criteria about the importance of the drug. The objective criteria mostly related to
whether only prescription drugs are included or whether both prescription and nonprescription
drugs are included. For example, like the U.S. FDA, Australia includes drugs that are “critical to
public health” (Australian Government, Department of Health, undated), Denmark includes
drugs for which shortages would pose “a risk of potential life-threatening or serious
consequences for the health of patients” (Danish Medicines Agency, 2020), and Switzerland
includes “vital” medicines (Federal Office for National Economic Supply, 2020a). Other criteria
were related to the geographic scope of shortages. For example, the EMA databases included all
medicines in shortage in one or more member states.21 Some of the reporting systems also make
a distinction between drugs that have alternatives and those that do not; the Irish and Australian
reporting systems might not include shortages if alternatives are available in at least some
cases.22 The other databases do not indicate whether they include drugs that have alternatives
available.
Only a minority of reporting systems provide information about how they define shortages,
with varying levels of specificity. For example, Health Canada states that a shortage is a situation
in which a manufacturer is unable to fill orders from Canadian clients at all or on time (Drug
Shortages Canada, undated). In more-abstract language, the Irish Health Products Regulatory
Authority states that a shortage is “when the supply of a medicinal product is inadequate to meet
the needs of the patient” (Health Products Regulatory Authority, undated).
Most of the non-U.S. databases do not indicate a criterion for how long a shortage must last
to be reported as one. Of the databases that do, the Spanish Agency for Medicines and Medical
21 The new guidance is unclear as to whether all medicines are included now as opposed to only EMA-evaluated
ones. 22 The Irish and Australian databases report products based on the potential impact they have on the patient
population, and impact is determined, in part, by the availability of an appropriate alternative.

64
Devices describes shortages as those that are not quickly resolved (Government of Spain,
Department of Health, Agency for Medicines and Health Products, undated). The Australian
Medicines Shortages Information Initiative requires a predicted shortage of at least six months
(Australian Government, Department of Health, undated), and the Belgian PharmaStatus requires
a shortage of at least 14 days for reporting (Federal Agency for Medicines and Health Products,
undated-b). The French National Agency for Medicines and Health Products Safety defines
shortages as those for which a community or hospital pharmacy is not able to deliver a medicine
to a patient within 72 hours (National Agency for the Safety of Drugs and Health Products,
undated).
None of the reporting systems expressly exclude permanent discontinuations. However, four
databases (the Canadian, Australian, UK Specialty Pharmacy Service, and Belgian databases)
expressly contain information about them.
Other Database Parameters
The databases we examined at a minimum contain information about the product name
(brand and/or generic), formulation, strength, and details about the shortage time frame (usually
through a combination of the notification publication date, shortage start date, expected shortage
end date, and/or the current status of the shortage).23 Often, databases include additional
information. For example, the older EMA database, along with the Canadian, Australian, Irish
Health Products Regulatory Authority, Austrian, and Belgian databases, includes data on the
reason for the shortage. Eight databases (the Canadian, Australian, Belgian, Austrian, Slovakian,
Finnish, Spanish, and UK databases) name the manufacturer or marketing authorization holder or
sponsor.
Nine reporting systems or databases indicate that shortage notifications are mandatory.24 Of
the seven databases that indicate the parties responsible for notifications, all of them name
manufacturers and/or marketing authorization holders as responsible.25
Information on update frequency for these databases could not be located on the official
database websites. However, Acosta et al., 2019, reports the update frequency for nine of the
databases: Four databases are updated daily, and another five are updated weekly or as required.
The time frame covered by databases varies widely: Some databases include initial shortages or
updates that began in the past few months or years, whereas others include shortages that began
approximately a decade ago.
23 Therefore, medical product shortages often are understood at a detailed level among these reporting systems—at
the level of a medicine’s form and strength, if not also package size. 24 The only systems that do not indicate this are the Irish and older EMA systems. The new EMA and Heads of
Medicines Agencies guidance states that notifications are mandatory (EMA, 2019). 25 The old EMA reporting system did not indicate this information, but the new guidance also identifies marketing
authorization holders as responsible.

65
Ultimately, the shortage databases from other countries vary across multiple parameters that
do not lend themselves to straightforward comparisons of shortages across countries. This
provides further motivation for our work, which uses the MIDAS data to identify changes in
volume and shortage of drugs known to have been in shortage in the United States rather than
relying on other countries’ databases.
The World Health Organization’s Definition
In response to the inconsistent definitions of drug shortages both within and between
countries, WHO published its own definitions of drug shortages, in which WHO distinguishes
between shortages “on the supply side” (i.e., caused by factors related to production and
distribution) versus “on the demand side” (i.e., caused by patient or prescriber demand) (WHO,
2016b). Several years later, WHO announced its intent to establish a global reporting system that
lists shortages of drugs that are on the WHO Model List of Essential Medicines with the goal of
facilitating collaboration between regulators in different countries (WHO, 2018).
WHO Drug Shortage Definition
On the supply side: A “shortage” occurs when the supply of medicines, health products
and vaccines identified as essential by the health system is considered to be insufficient to
meet public health and patient needs. This definition refers only to products that have already
been approved and marketed, in order to avoid conflicts with research and development
agendas.
On the demand side: A “shortage” will occur when demand exceeds supply at any point
in the supply chain and may ultimately create a “stockout” at the point of appropriate service
delivery to the patient if the cause of the shortage cannot be resolved in a timely manner
relative to the clinical needs of the patient (WHO, 2016b, p. 10).
The proposed WHO definition focuses on practical shortages by requiring in the supply-side
definition that supply is “considered to be insufficient to meet public health and patient needs”
and noting in the demand-side definition that shortages result when there are disruptions
“relative to the clinical needs of the patient.”
In practice, whether a drug meets the WHO supply-side definition, the demand-side
definition, or both definitions in a particular country at a specific point in time could be
ambiguous. In the supply-side definition, whether a drug is “essential” and whether the supply of
a drug is “insufficient to meet public health and patient needs” are subjective determinations.
Likewise, whether “demand exceeds supply” in a way that “cannot be resolved in a timely
manner” in the demand-side definition also is subjective. Although the WHO definition is broad
enough to accommodate shortages with very different causes and symptoms, the need for

66
subjective judgment might complicate the consistent implementation of the definition across
countries.

67
Appendix B. Illustrative Drug Shortage Examples
This appendix includes additional background on the four illustrative examples introduced in
Chapter 2, with summaries of background information on the shortage, a description of how the
shortage appeared in the FDA and ASHP databases, our assessment of how the shortage relates
to the framework described in the main report, and a summary of changes in volume over time
through the shortage, according to our analysis of IQVIA MIDAS data.
Belatacept (Brand Name: Nulojix)
Belatacept is a biologic immunosuppressant that is used to prevent rejection in patients
receiving kidney transplants. It is sold as a dry (lyophilized) powder that is reconstituted and
administered via intravenous infusion. Belatacept is marketed only by Bristol-Myers Squibb and
is protected from direct competition by regulatory exclusivity granted by FDA through 2023.
Shortage Background
Demand for belatacept grew relatively quickly after its approval by FDA in 2011 because
evidence suggested that the drug is an effective alternative or complement to traditional
immunosuppressants (Gabardi and van Gelder, 2017). Although Bristol-Myers Squibb developed
a new, higher-yield manufacturing process for belatacept to meet this increasing demand, the
transition to the new manufacturing process was delayed for unknown reasons (Gabardi and van
Gelder, 2017). It is relatively common for manufacturers of biologic drugs to change their
manufacturing processes or facilities. In contrast to small-molecule drugs, which are synthesized
chemically, the manufacturing process of biologics can have important implications for the final
product. As a result, FDA and other regulatory agencies require validation that the product that is
produced after the manufacturing change is sufficiently similar to the originally approved
biologic. It is possible that the new manufacturing process for belatacept resulted in a product
that did not initially meet these validation requirements.
As a result of the shortage, Bristol-Myers Squibb partnered with one of the major distributors
of drugs in the United States, McKesson, to run a distribution program to ensure that patients
who already had been treated with belatacept could continue to receive the medication. New
patients could not be started on belatacept from February 2017 through August 2018 (FDA,
undated-b). Some new patients could start on belatacept after August 2018, albeit still through
the distribution program.

68
Shortage Listings
FDA’s shortage database has listed belatacept as “currently in shortage” from March 2017
through the time of this writing (September 2020) because of “increased demand for the drug
exacerbated by a delay in transition to a more efficient manufacturing process” (FDA, undated-
b). The ASHP database listed belatacept as being in shortage in March 2017 because of
“manufacturing delays” (ASHP, undated-b). Unlike the FDA listing, the ASHP listing includes
an end date for the shortage in November 2018, when new patients could again start on
belatacept through the distribution program.
Relationship to Shortage Framework
Although belatacept was not listed as being in shortage in either the FDA or ASHP database
until early 2017, the drug might have been on the cusp of a shortage because of insufficient
supply to meet increasing demand prior to that time. The most direct cause of the ongoing
shortage is the production disruptions catalyzed by Bristol-Myers Squibb’s transition to a new
manufacturing process.
Observed Volume Patterns
The MIDAS data illustrate a one-quarter drop in U.S. volume in early 2017 aligning with the
reported start of the shortage in both the FDA and ASHP databases, followed by sustained
volume increases (Figure B.1). The U.S. volume for belatacept is much higher than the volume
for other countries combined. The volume in all countries other than the United States declined
slightly in early 2017, was relatively flat through mid-2018, and trended upward in mid-2018
through 2019. Much of the belatacept sales volume outside the United States was in France and
Germany, both of which experienced declines in belatacept volume over time (Figure B.2). The
decline in Germany coincided with the reported start of the U.S. shortage, and the decline in
France occurred a year later.

69
Figure B.1. Belatacept Volume Trends, 2014–2019
SOURCE: Authors’ analysis of 2014–2019 IQVIA MIDAS data.
Figure B.2. Belatacept Volume Trends, 2014–2019, Countries Excluding the United States
SOURCE: Authors’ analysis of 2014–2019 IQVIA MIDAS data.
Valsartan (Brand Name: Diovan)
Valsartan is an oral ARB antihypertensive that is used to treat patients who have high blood
pressure, have heart failure, or have experienced a heart attack (Novartis, 2017). The patent for
0
5
10
15
20
25
30
35
40
45
50
Stan
dar
d u
nit
s (t
ho
usa
nd
s)
United States All other countries combined
FDA shortage (ongoing)
ASHP shortage (resolved)
0
1
2
3
4
5
6
7
Stan
dar
d u
nit
s (t
ho
usa
nd
s)
Germany France All other countries combined
FDA shortage (ongoing)
ASHP shortage (resolved)

70
valsartan, which was originally manufactured by Novartis in 1996, expired in September 2012,
allowing for generic entry into the market.
Shortage Background
In July 2018, FDA announced a voluntary recall of numerous generic forms of valsartan after
discovering an impurity called NDMA, which is a carcinogen. Subsequently, FDA discovered
another carcinogenic impurity in some forms of valsartan called N-nitrosodiethylamine (NDEA)
(FDA, 2019b). As of September 2019, 625 forms of valsartan had been recalled (FDA, 2019d).
Shortly after the initial recalls, FDA and ASHP listed valsartan as a shortage. In its response to
the shortage, FDA prioritized a review of applications for valsartan, and, by March 2019, FDA
approved a new form of valsartan manufactured by Alkem Laboratories Limited in India (FDA,
2019a). Other ARB antihypertensives, including losartan (Cozaar) also are affected.
Shortage Listings
FDA lists valsartan as a “resolved” shortage, with its duration from August 2018 to March
2020. It also lists the following manufacturers as experiencing the shortage: Alembic
Pharmaceuticals, Amneal Pharmaceuticals, Aurobindo Pharma, Camber Pharmaceuticals,
Jubilant Cadista Pharmaceuticals, Macleods Pharmaceuticals, Mylan Pharmaceuticals, Novartis,
Ohm Laboratories, and Solco Healthcare US (FDA, undated-b). By contrast, the ASHP database
has valsartan listed as a current shortage since July 2018 (ASHP, undated-b).
Relationship to Shortage Framework
These shortages were because of safety concerns based on the production of the medications.
Because the impurities in valsartan originated from manufacturers of the API in China (Liu,
2018), countries other than the United States also might have experienced a shortage.
Observed Volume Patterns
Valsartan volume fell in the United States and in other countries at about the same time that
FDA and ASHP added valsartan to their shortage lists, which aligns with global concern around
API impurities (Figure B.3). There appears to be some substitution to losartan in the United
States and potentially other countries.

71
Figure B.3. Valsartan and Losartan Volume Trends, 2014–2019, Countries Excluding the United
States
SOURCE: Authors’ analysis of 2014–2019 IQVIA MIDAS data.
Heparin
Heparin is an anticoagulant administered by intravenous or subcutaneous injection. Heparin
is sold by several manufacturers in the United States. The original version of heparin—called
unfractionated heparin—is usually derived from pig intestines and has been sold for more than a
century. Several newer, brand-name “low molecular weight” heparins use raw material from pigs
that is refined through chemical processes; these heparins can, in some cases, substitute for
unfractionated heparin. Unfractionated heparin is the primary anticoagulant used for open-heart
surgery and in dialysis.
Shortage Background
Hurricane Maria damaged facilities of one heparin manufacturer, Baxter, in September
2017.26 Several Baxter heparin products manufactured at its Puerto Rico plant remain in
shortage, and FDA granted Baxter authorization to temporarily import premixed heparin bags
from the United Kingdom starting in 2019 (Baxter Healthcare Corporation, 2019). Other heparin
products are in shortage, and several of the more recent shortages appear to have been caused by
anticipated or actual shortages of API. Much of the pharmaceutical-grade heparin manufactured
26 Baxter faced disruptions of other intravenous drugs manufactured in Puerto Rico. See, for example, Baxter
Healthcare Corporation, 2017. Other drug manufactures in Puerto Rico also were affected (Thomas, 2017).
0
100
200
300
400
500
600
700
800
900
1000
Stan
dar
d U
nit
s (m
illio
ns)
Losartan - U.S. Losartan - Other countries Valsartan - U.S. Valsartan - Other countries
FDA and ASHP valsartan shortage (ongoing)

72
globally is derived from porcine intestine mucosa in China (Vilanova, Tovar, and Mourão,
2018). By 2019, there was mounting concern that the outbreak of African Swine Fever in China
starting in mid-2018 could disrupt the supply of heparin API to drug manufacturers (Pallone et
al., 2019). At least one manufacturer—Fresenius Kabi—began allocating (i.e., rationing) its
supply of heparin in anticipation of supply disruptions (Preusker, 2019).
Shortage Listings
FDA placed heparin on its drug shortage list in November 2017 (FDA, undated-b). ASHP
added Baxter’s heparin products to its shortage list in September 2018. Several other heparin
manufacturers, including Fresenius Kabi, Hospira (a subsidiary of Pfizer), and Sagent, also are
listed in the FDA and ASHP shortage databases.
Relationship to Shortage Framework
Recent heparin shortages are attributable to disruptions in manufacturing caused by
Hurricane Maria in Puerto Rico and the African Swine Fever outbreak in China. At least in some
cases, manufacturers and regulators have relied on supply from outside the United States (e.g.,
from the United Kingdom) to alleviate regional shortages caused by Hurricane Maria. The more-
recent supply chain concerns related to heparin API are more global in nature and might result in
widespread shortages.
Observed Volume Patterns
U.S. volume for heparin decreased slightly in Q3 2017, coinciding with Hurricane Maria and
FDA’s addition of heparin to its shortage database (Figure B.4). Subsequent declines in mid-
2018 align with the start of ASHP’s heparin shortage, and potentially with disruptions in API
caused by African Swine Fever in China. U.S. volume increased somewhat in early 2019 before
declining again by the end of the year. Volume outside the United States has been consistent,
but, unlike in the United States, it has been periodic, with predictable quarterly increases and
decreases. The quarter-to-quarter changes are more pronounced in some Eastern European
countries (including Poland and Hungary) than in other countries (such as Germany and Japan).
One possibility is that hospitals in countries outside the United States are more likely to purchase
heparin on a quarterly or annual rather than continuous basis. The effect of Hurricane Maria on
the U.S. supply of heparin is more apparent when tracking volume for infused heparin sodium
only (Figure B.5).

73
Figure B.4. Heparin and Heparin Sodium Volume Trends, 2014–2019
SOURCE: Authors’ analysis of 2014–2019 IQVIA MIDAS data.
Figure B.5. Heparin Sodium Volume Trends, 2014–2019, by Manufacturer
SOURCE: Authors’ analysis of 2014–2019 IQVIA MIDAS data.
0
50
100
150
200
250
Stan
dar
d u
nit
s (m
illio
ns)
United States All other countries combined
FDA heparin shortage (ongoing)
ASHP heparin shortages (ongoing)
0
500
1000
1500
2000
2500
3000
Stan
dar
d u
nit
s (t
ho
usa
nd
s)
U.S. - Baxter U.S. - Other manuf. U.S. - Total
FDA heparin shortage (ongoing)
ASHP heparin shortages (ongoing)
74
Tamsulosin Hydrochloride (Brand Name: Flomax)
Tamsulosin hydrochloride is a small-molecule drug used to treat benign prostatic hyperplasia
(enlarged prostate). It is sold in 400-microgram immediate and extended-release capsules.
Generic versions of tamsulosin hydrochloride were first marketed in the United States in 2010.
The drug is now sold in the United States by many competing generic drug manufacturers.
Shortage Background and Listings
The ASHP shortage database notes that Mylan, one of many generic manufacturers selling
tamsulosin hydrochloride, discontinued 25-count capsule bottles of the drug in mid-2016. Other
generic manufacturers, including Sandoz, Par, Aurobindo, and Teva, also are listed as having
discontinued all or some package sizes for reasons including “production delays” and “increased
demand.” Despite these listed shortages, the ASHP database notes that Mylan continued to sell
90-, 100-, and 300-count bottles. Other manufacturers, including some of those also listed as
discontinuing specific package sizes, continue to sell significant volumes of tamsulosin
hydrochloride. Tamsulosin is not currently listed in the FDA shortage database, although the
FDA database excludes shortages that were resolved more than six months ago.
Relationship to Shortage Framework
The tamsulosin hydrochloride shortage is the result of a business decision by Mylan to stop
selling the drug in a certain package size while still selling the drug in other package sizes. Other
generic manufacturers recently decided to stop selling tamsulosin hydrochloride entirely. Despite
these business decisions, there are still many manufacturers offering tamsulosin hydrochloride in
the United States. We view the tamsulosin hydrochloride listed in the ASHP database as a
technical and not a practical shortage.
Observed Volume Patterns
Neither U.S. nor other-country volume trends appear to have been substantively affected by
the reported shortage, which is consistent with the reported shortage applying to a limited set of
packages and manufacturers (Figure B.6).

75
Figure B.6. Tamsulosin Hydrochloride Volume Trends, 2014–2019, by Manufacturer
SOURCE: Authors’ analysis of 2014–2019 IQVIA MIDAS data.
0
100
200
300
400
500
600
700
800
900St
and
ard
un
its
(mill
ion
s)
United States All Other Countries Combined
ASHP shortage (ongoing; discontinuation)
76
Appendix C. Antimicrobial and Immune Globulin Data and
Methods
We conducted separate but closely related analyses of antimicrobial and IG drugs. The
analyses of antimicrobial drugs used a very similar file structure to the overall analysis. We used
drug type categorizations from the following three sources to identify antimicrobial drugs:
• ASHP shortage database drug category: The ASHP drug shortage database has a field
for the American Hospital Formulary Service (AHFS) therapeutic classification for each
drug. We initially examined all drugs in AHFS category 8 (anti-infective agents). We
used Google search to determine the subtherapeutic class of each drug identified by this
category and found that it included antibiotics, antifungals, antivirals, and antiparasitic
drugs. After our discussions with ASPE, we removed antiviral and antiparasitic drugs
from the list because ASPE was primarily interested in antibiotics and antifungals.
• FDA shortage database drug category: The FDA database similarly included a field for
therapeutic category. Again, we examined the subtherapeutic category via Google search
for all drugs that FDA identified as anti-infectives and, based on discussions with ASPE,
kept antibiotic and antifungal drugs on the list.
• WHO Collaborating Centre (WHOCC) for Drug Statistics Methodology drug
category: To identify antimicrobial drugs that were not on the FDA or ASHP shortage
lists, we examined all drugs under WHOCC Category J (anti-infectives). After
discussions with ASPE, we excluded antivirals, IG products, and vaccines from our list
because ASPE was primarily interested in antibiotics and antifungals for this analysis,
and IG products were studied separately.
We recreated the calendar time analytic file created for the overall analysis using the list of
antimicrobial products compiled via the ASHP database, FDA database, and WHOCC drug
categorizations. The resulting file included 33 antimicrobial drug forms that experienced a
shortage during our study period and 215 antimicrobial drug forms that did not. Because of the
small number of antimicrobial drug forms, we did not conduct formal matching or regression
analyses. Instead, we present a series of descriptive statistics for all shortage drug forms
compared with all nonshortage drug forms. Because we did not use the matching approach, we
randomly assigned a start date for each nonshortage drug form so that we could calculate
changes in volume, price, number of manufacturers, and HHI relative to some point in time.
The analytic file for the analysis of IG products was again slightly different from that of the
main analysis. Because this analysis focused on a single MIDAS active ingredient
(“immunoglobulin”) rather than rolling up to the drug-form level as we did in the main analysis
and in the antimicrobial analysis, we examined drugs at the product-strength level. We created
only a calendar time analytic file because the small number of IG products does not lend itself to
77
detailed regression analyses. The process was similar to the process described above for the
overall analysis, but it differed in the following key ways:
• The file was kept at the product-strength level rather than the drug-form level.
• The file was limited to drugs for which the “moleculelist” variable contained the term
“immunoglobulin base.”
• All shortage indicators came from the ASHP shortage database because biologics are not
included in the FDA CDER shortage database.
• Because analyses were at the product level, we did not calculate HHI or number of
manufacturers.
The resulting analytic file contained 24 quarterly observations for each of the 18 total
product-strength combinations of IGs sold in the United States in the data. The data recorded a
total of 11 products in shortage (i.e., cases in which the shortage indicator transitioned from 0 to
1). Because of the small number of IG products, we again did not use the matching approach we
used for the overall analysis. Instead, in this case, because there were only two shortage start
dates across all of the products in shortage (Q1 2019 and Q2 2019), we took a weighted average
of the deltas in volume and price across those two shortage start quarters for each nonshortage
drug.
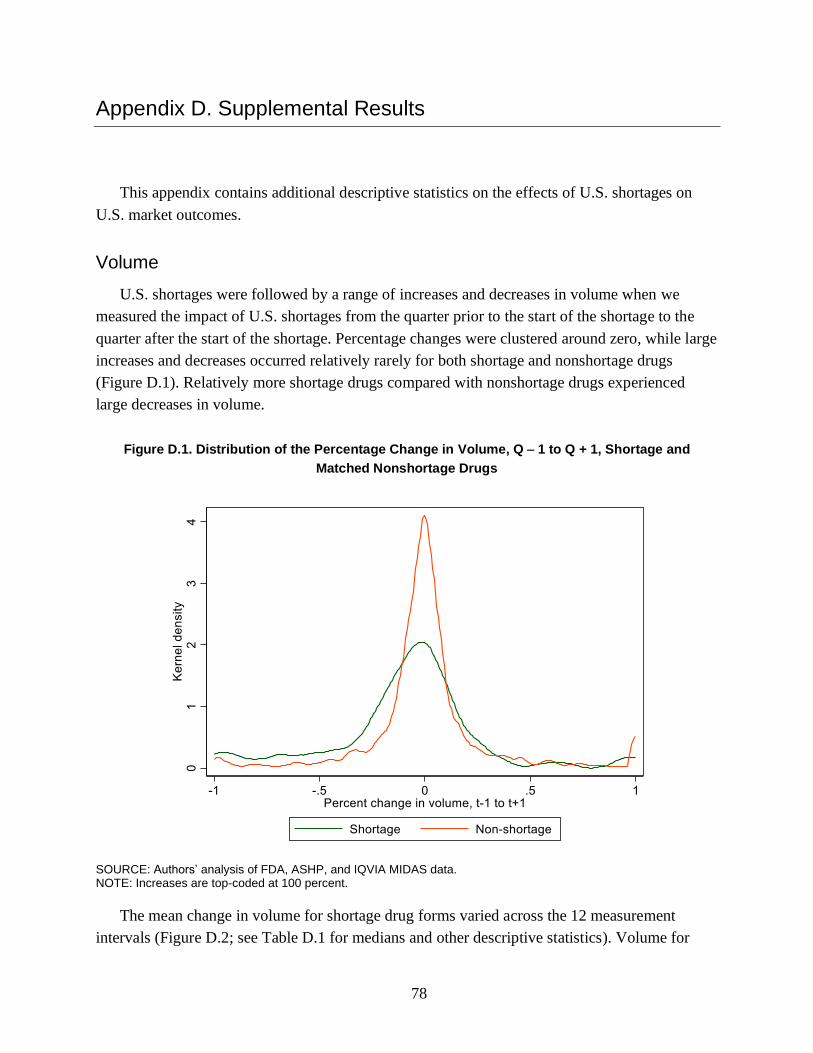
78
Appendix D. Supplemental Results
This appendix contains additional descriptive statistics on the effects of U.S. shortages on
U.S. market outcomes.
Volume
U.S. shortages were followed by a range of increases and decreases in volume when we
measured the impact of U.S. shortages from the quarter prior to the start of the shortage to the
quarter after the start of the shortage. Percentage changes were clustered around zero, while large
increases and decreases occurred relatively rarely for both shortage and nonshortage drugs
(Figure D.1). Relatively more shortage drugs compared with nonshortage drugs experienced
large decreases in volume.
Figure D.1. Distribution of the Percentage Change in Volume, Q − 1 to Q + 1, Shortage and
Matched Nonshortage Drugs
SOURCE: Authors’ analysis of FDA, ASHP, and IQVIA MIDAS data. NOTE: Increases are top-coded at 100 percent.
The mean change in volume for shortage drug forms varied across the 12 measurement
intervals (Figure D.2; see Table D.1 for medians and other descriptive statistics). Volume for

79
shortage drug forms decreased, on average, when measured over intervals that started the quarter
prior to the shortage occurrence (with magnitudes ranging from 4.9 to 8.7 percent, depending on
the length of the interval), whereas nonshortage drugs experienced small (< 2-percent) increases
over the same intervals. Average declines for shortage drug forms were not statistically
distinguishable from zero when measured starting in the quarter containing the shortage start
date or the quarter after the shortage. Together, these results suggest that measuring changes in
volume relative to preshortage volume yields the largest declines, while measuring changes over
later periods could capture initial recoveries following some shortages.
Figure D.2. Average Percentage Change in Volume over 12 Time Intervals, Shortage and Matched
Nonshortage Drugs
SOURCE: Authors’ analysis of FDA, ASHP, and IQVIA MIDAS data. NOTE: Increases are top-coded at 100 percent. Whiskers indicate 95-percent confidence intervals.
-4.9%
-8.4%-7.1%
-8.7%
-2.3% -1.5%-2.7%
-1.4%
1.3%1.6%
3.6%
1.2%
1.4% 1.0%1.7% 1.1%
-0.3%
0.6%1.0% 1.5%
0.4%0.8%
1.0% 1.4%
-15%
-10%
-5%
0%
5%
10%
15%
Q -1to Q0
Q -1to Q +1
Q -1to Q +2
Q -1to Q +3
Q0to Q +1
Q0to Q +2
Q0to Q +3
Q0to Q +4
Q +1to Q +2
Q +1to Q +3
Q +1to Q +4
Q +1to Q +5
Ave
rage
pe
rce
nta
ge c
han
ge in
vo
lum
e
Shortage Nonshortage

80
Table D.1. Descriptive Statistics, Percentage Change in Volume for Shortage Drugs over 12
Intervals
Mean Standard Deviation
1st Percentile
5th Percentile
25th Percentile Median
75th Percentile
95th Percentile
99th Percentile
Q − 1 to Q = 0
−5.0% 36.6% −94.8% −81.1% −16.7% −0.9% 13.3% 42.3% 100.0%
Q − 1 to Q + 1
−8.6% 36.1% −99.3% −86.9% −21.2% −4.9% 6.1% 60.3% 100.0%
Q − 1 to Q + 2
−7.5% 33.3% −99.6% −69.0% −21.1% −6.1% 6.3% 47.3% 100.0%
Q − 1 to Q + 3
−8.8% 32.9% −99.9% −61.8% −26.0% −5.6% 8.2% 41.2% 100.0%
Q = 0 to Q + 1
−2.7% 38.5% −97.2% −69.7% −17.9% −4.8% 5.9% 100.0% 100.0%
Q = 0 to Q + 2
−1.8% 39.6% −98.8% −68.0% −21.1% −5.4% 9.7% 100.0% 100.0%
Q = 0 to Q + 3
−2.9% 40.0% −99.8% −65.8% −22.3% −8.1% 7.4% 100.0% 100.0%
Q = 0 to Q + 4
−1.3% 39.1% −99.4% −58.4% −21.6% −5.3% 10.5% 100.0% 100.0%
Q + 1 to Q + 2
1.2% 30.8% −82.2% −42.7% −11.1% −0.5% 10.3% 63.9% 100.0%
Q + 1 to Q + 3
1.6% 34.7% −95.3% −46.2% −12.9% 0.4% 12.1% 88.6% 100.0%
Q + 1 to Q + 4
3.7% 35.1% −95.8% −52.5% −12.0% 0.1% 17.4% 100.0% 100.0%
Q + 1 to Q + 5
1.2% 36.6% −99.9% −69.2% −12.2% −0.1% 17.9% 68.7% 100.0%
Price
Price changes for both shortage and nonshortage drug forms were centered around zero,
although price increases were relatively more common for shortage compared with nonshortage
drug forms (Figure D.3). Prices increased by up to 9.5 percent, on average, when measured from
the quarter prior to the shortage or the quarter in which the shortage started (Figure D.4; see
Table D.2 for medians and other descriptive statistics). Percentage changes in prices for
nonshortage drugs were either slightly negative or not statistically distinguishable from zero.

81
Figure D.3. Distribution of the Percentage Change in Price, Q − 1 to Q + 1, Shortage and Matched
Nonshortage Drugs
SOURCE: Authors’ analysis of FDA, ASHP, and IQVIA MIDAS data. NOTE: Increases are top-coded at 100 percent.
Figure D.4. Average Percentage Change in Price over 12 Time Intervals, Shortage and Matched
Nonshortage Drugs
SOURCE: Authors’ analysis of FDA, ASHP, and IQVIA MIDAS data. NOTE: Increases are top-coded at 100 percent. Whiskers indicate 95-percent confidence intervals.
3.9%
7.3% 7.1%
9.5%
4.4%4.6%
6.1%
6.9%
-0.3%
1.0%
1.2%
2.1%
0.1%
-0.4% -0.9%-1.8%
-0.1%-0.9%
-1.9% -1.9%-0.6%
-1.6% -1.7%
-2.5%
-6%
-4%
-2%
0%
2%
4%
6%
8%
10%
12%
14%
16%
Q -1to Q0
Q -1to Q +1
Q -1to Q +2
Q -1to Q +3
Q0to Q +1
Q0to Q +2
Q0to Q +3
Q0to Q +4
Q +1to Q +2
Q +1to Q +3
Q +1to Q +4
Q +1to Q +5
Ave
rage
per
cen
tage
ch
ange
in p
rice
Shortage Nonshortage
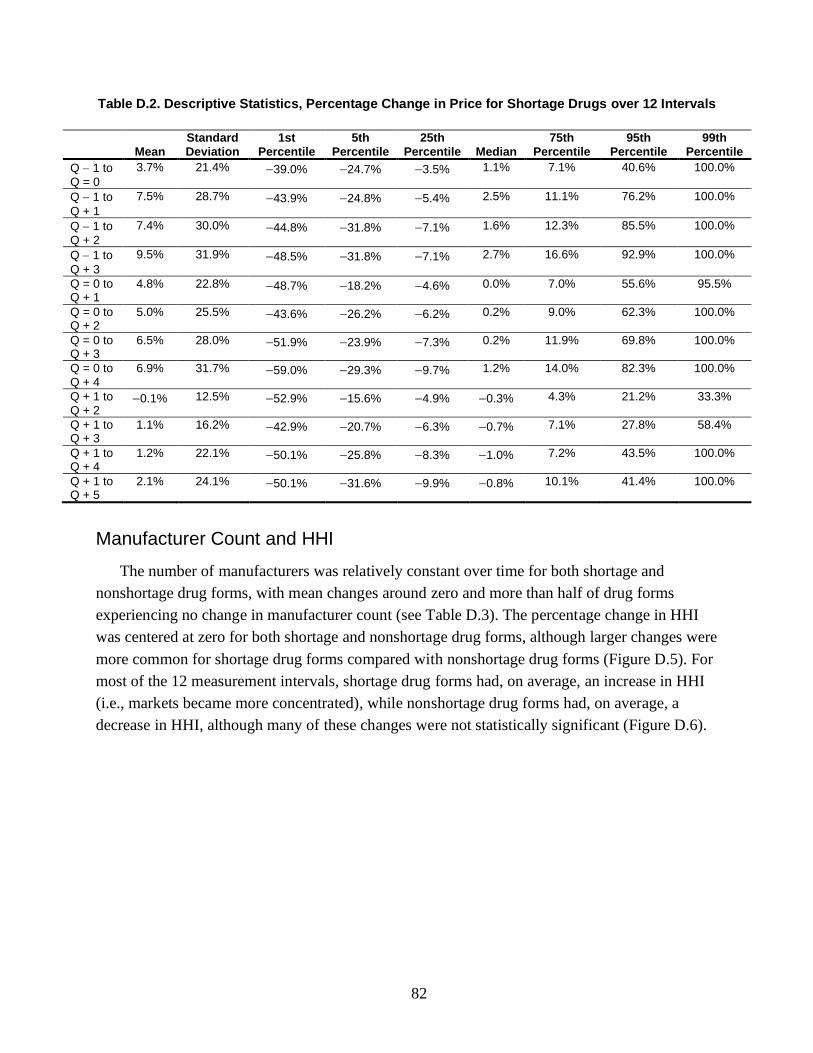
82
Table D.2. Descriptive Statistics, Percentage Change in Price for Shortage Drugs over 12 Intervals
Mean Standard Deviation
1st Percentile
5th Percentile
25th Percentile Median
75th Percentile
95th Percentile
99th Percentile
Q − 1 to Q = 0
3.7% 21.4% −39.0% −24.7% −3.5% 1.1% 7.1% 40.6% 100.0%
Q − 1 to
Q + 1
7.5% 28.7% −43.9% −24.8% −5.4% 2.5% 11.1% 76.2% 100.0%
Q − 1 to Q + 2
7.4% 30.0% −44.8% −31.8% −7.1% 1.6% 12.3% 85.5% 100.0%
Q − 1 to
Q + 3
9.5% 31.9% −48.5% −31.8% −7.1% 2.7% 16.6% 92.9% 100.0%
Q = 0 to Q + 1
4.8% 22.8% −48.7% −18.2% −4.6% 0.0% 7.0% 55.6% 95.5%
Q = 0 to Q + 2
5.0% 25.5% −43.6% −26.2% −6.2% 0.2% 9.0% 62.3% 100.0%
Q = 0 to Q + 3
6.5% 28.0% −51.9% −23.9% −7.3% 0.2% 11.9% 69.8% 100.0%
Q = 0 to Q + 4
6.9% 31.7% −59.0% −29.3% −9.7% 1.2% 14.0% 82.3% 100.0%
Q + 1 to Q + 2
−0.1% 12.5% −52.9% −15.6% −4.9% −0.3% 4.3% 21.2% 33.3%
Q + 1 to Q + 3
1.1% 16.2% −42.9% −20.7% −6.3% −0.7% 7.1% 27.8% 58.4%
Q + 1 to Q + 4
1.2% 22.1% −50.1% −25.8% −8.3% −1.0% 7.2% 43.5% 100.0%
Q + 1 to Q + 5
2.1% 24.1% −50.1% −31.6% −9.9% −0.8% 10.1% 41.4% 100.0%
Manufacturer Count and HHI
The number of manufacturers was relatively constant over time for both shortage and
nonshortage drug forms, with mean changes around zero and more than half of drug forms
experiencing no change in manufacturer count (see Table D.3). The percentage change in HHI
was centered at zero for both shortage and nonshortage drug forms, although larger changes were
more common for shortage drug forms compared with nonshortage drug forms (Figure D.5). For
most of the 12 measurement intervals, shortage drug forms had, on average, an increase in HHI
(i.e., markets became more concentrated), while nonshortage drug forms had, on average, a
decrease in HHI, although many of these changes were not statistically significant (Figure D.6).
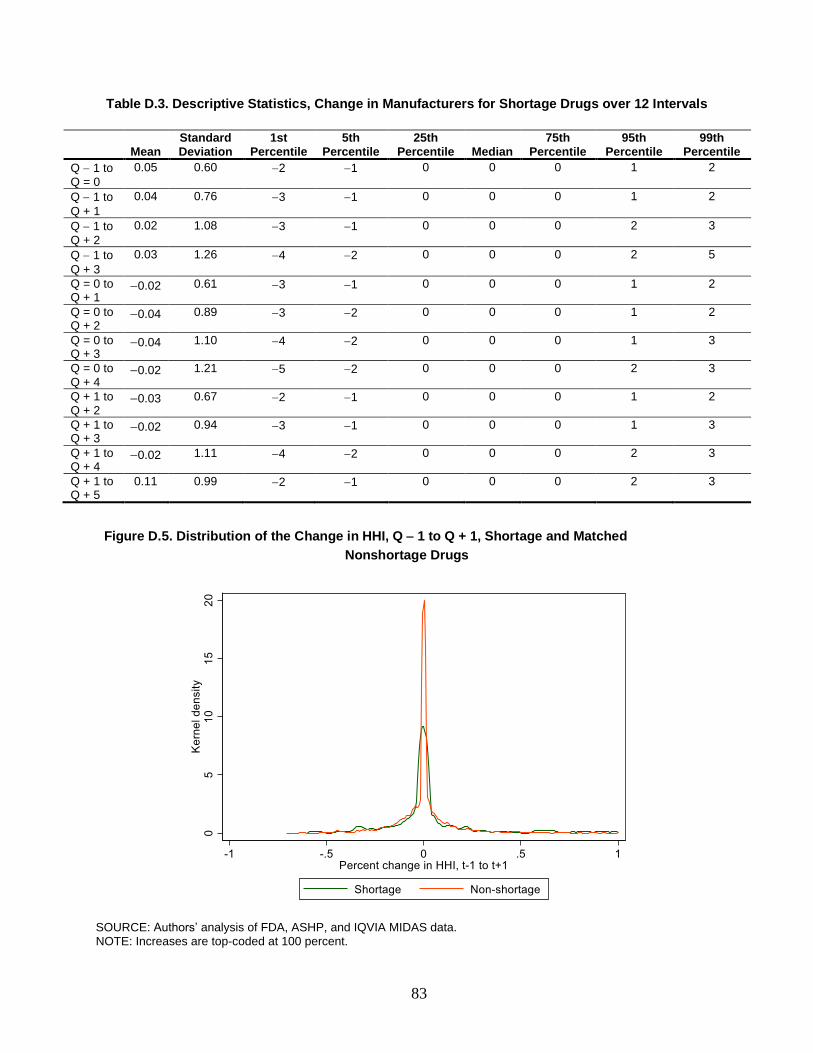
83
Table D.3. Descriptive Statistics, Change in Manufacturers for Shortage Drugs over 12 Intervals
Mean Standard Deviation
1st Percentile
5th Percentile
25th Percentile Median
75th Percentile
95th Percentile
99th Percentile
Q − 1 to Q = 0
0.05 0.60 −2 −1 0 0 0 1 2
Q − 1 to
Q + 1
0.04 0.76 −3 −1 0 0 0 1 2
Q − 1 to Q + 2
0.02 1.08 −3 −1 0 0 0 2 3
Q − 1 to
Q + 3
0.03 1.26 −4 −2 0 0 0 2 5
Q = 0 to Q + 1
−0.02 0.61 −3 −1 0 0 0 1 2
Q = 0 to Q + 2
−0.04 0.89 −3 −2 0 0 0 1 2
Q = 0 to Q + 3
−0.04 1.10 −4 −2 0 0 0 1 3
Q = 0 to Q + 4
−0.02 1.21 −5 −2 0 0 0 2 3
Q + 1 to Q + 2
−0.03 0.67 −2 −1 0 0 0 1 2
Q + 1 to Q + 3
−0.02 0.94 −3 −1 0 0 0 1 3
Q + 1 to Q + 4
−0.02 1.11 −4 −2 0 0 0 2 3
Q + 1 to Q + 5
0.11 0.99 −2 −1 0 0 0 2 3
Figure D.5. Distribution of the Change in HHI, Q − 1 to Q + 1, Shortage and Matched
Nonshortage Drugs
SOURCE: Authors’ analysis of FDA, ASHP, and IQVIA MIDAS data. NOTE: Increases are top-coded at 100 percent.

84
Figure D.6. Average Percentage Change in HHI over 12 Time Intervals, Shortage and Matched
Nonshortage Drugs
SOURCE: Authors’ analysis of FDA, ASHP, and IQVIA MIDAS data. NOTE: Increases are top-coded at 100 percent. Whiskers indicate 95-percent confidence intervals.
Table D.4. Descriptive Statistics, Percentage Change in HHI for Shortage Drugs over 12 Intervals
Mean Standard Deviation
1st Percentile
5th Percentile
25th Percentile Median
75th Percentile
95th Percentile
99th Percentile
Q − 1 to Q = 0
0.8% 17.0% −47.2% −24.2% −3.6% 0.0% 3.8% 34.0% 65.8%
Q − 1 to Q + 1
3.0% 24.5% −54.1% −33.1% −3.7% 0.0% 3.5% 62.9% 92.2%
Q − 1 to Q + 2
4.1% 28.2% −52.0% −39.0% −4.5% 0.0% 5.6% 82.9% 100.0%
Q − 1 to Q + 3
2.1% 28.9% −54.1% −40.0% −8.7% 0.0% 5.2% 67.0% 100.0%
Q = 0 to Q + 1
3.1% 20.9% −41.4% −26.2% −1.3% 0.0% 3.0% 45.4% 86.3%
Q = 0 to Q + 2
4.0% 23.9% −43.7% −31.1% −4.1% 0.0% 5.0% 63.6% 100.0%
Q = 0 to Q + 3
2.5% 26.0% −48.8% −30.3% −7.7% 0.0% 4.1% 61.2% 100.0%
Q = 0 to Q + 4
2.0% 25.6% −53.9% −32.4% −9.3% 0.0% 4.5% 53.3% 90.1%
Q + 1 to Q + 2
1.6% 14.9% −40.3% −20.7% −1.9% 0.0% 3.3% 29.1% 53.6%
Q + 1 to Q + 3
0.3% 20.5% −49.8% −34.7% −6.2% 0.0% 3.2% 39.0% 72.5%
Q + 1 to Q + 4
−1.2% 22.0% −49.3% −36.5% −11.3% 0.0% 2.3% 36.2% 76.3%
Q + 1 to Q + 5
−2.1% 23.2% −55.5% −42.0% −13.3% 0.0% 1.4% 46.8% 76.7%
0.9%
2.7%
3.9%
2.0%2.8%
3.8%2.5% 2.2%
1.7%0.5%
-1.1%
-2.1%
-0.1% -0.3%-0.3%
-0.8%
-0.2% -0.2%-0.6%
-0.9%
0.1%
-0.2% -0.5%-0.8%
-8%
-6%
-4%
-2%
0%
2%
4%
6%
8%
10%
Q -1to Q0
Q -1to Q +1
Q -1to Q +2
Q -1to Q +3
Q0to Q +1
Q0to Q +2
Q0to Q +3
Q0to Q +4
Q +1to Q +2
Q +1to Q +3
Q +1to Q +4
Q +1to Q +5
Ave
rage
per
cen
tage
ch
ange
in H
HI
Shortage Nonshortage
85
Appendix E. Results for Antimicrobial Drugs
Antimicrobial drugs, which include antibiotic and antifungal agents, are typically used to
prevent or treat infections. Many antimicrobial drugs have experienced recurring shortages for
decades, and they make up 14 percent of the combined FDA and ASHP shortage database we
compiled for this study. Similar to other shortage drugs, antimicrobials in shortage are
disproportionately generic drugs and administered parenterally. In this chapter, we explore
antimicrobial shortages in the United States and the extent to which they might play out in other
countries in more detail.
Counts and Characteristics of Drugs on U.S. Shortage Lists
We identified 59 total shortages of antimicrobial products at the drug-form level, compared
with 224 antimicrobial drug forms that did not experience a shortage during this period. We
excluded some antimicrobial drug forms from our analyses using the criteria described in the
main body of the report. We excluded shortages with no reported sales or volume in the IQVIA
MIDAS data in the two quarters preceding the shortage start date and shortages with less than
$10,000 in U.S. sales across the entire six-year time span for our IQVIA MIDAS data extract.
Finally, we excluded shortages with start dates in 2015. This led to a total of 33 antimicrobial
drug forms in shortage that we examined for this appendix and 215 antimicrobial drug forms not
in shortage.
The descriptive statistics in Table E.1 for shortage and nonshortage drug forms reflect all
quarters with available data, including quarters before, during, and after a shortage. Shortage
drug forms were more frequently administered parenterally than orally. They had higher mean
sales, although average quarterly volume was similar between shortage and nonshortage drug
forms. Somewhat surprisingly, shortage drugs were more frequently multisource generics (rather
than single-source branded drugs or single-source generics) than nonshortage drugs.
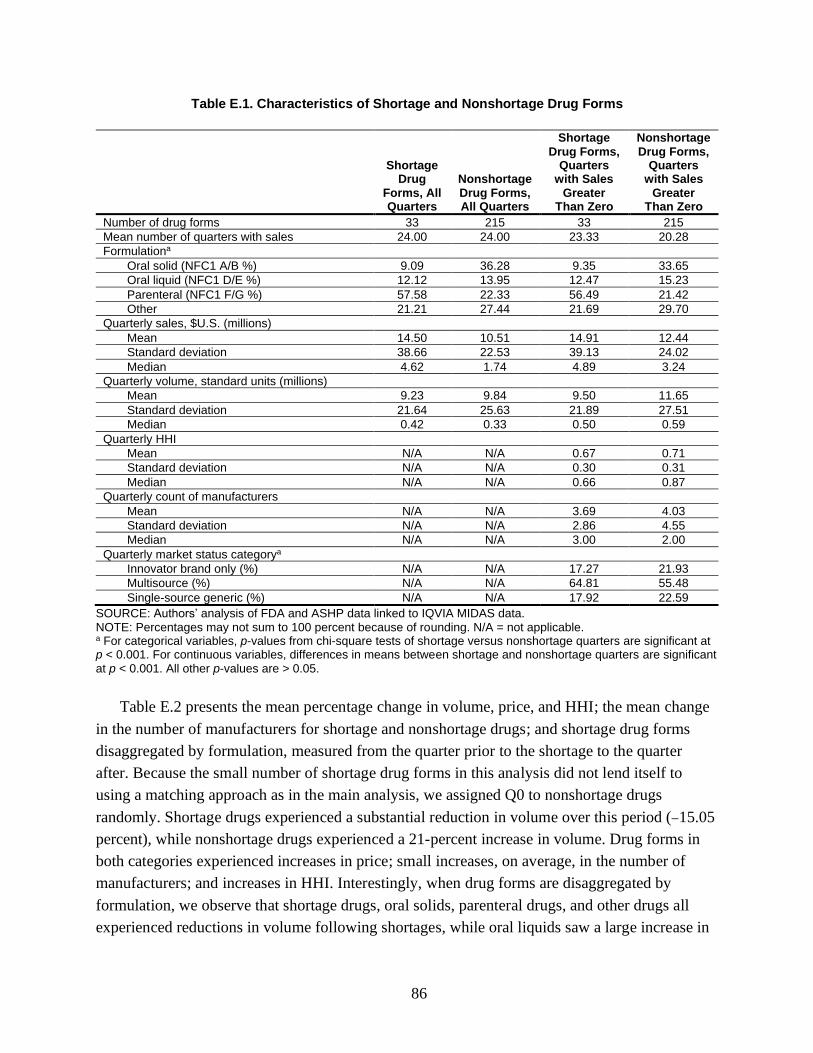
86
Table E.1. Characteristics of Shortage and Nonshortage Drug Forms
Shortage Drug
Forms, All Quarters
Nonshortage Drug Forms, All Quarters
Shortage Drug Forms,
Quarters with Sales
Greater Than Zero
Nonshortage Drug Forms,
Quarters with Sales
Greater Than Zero
Number of drug forms 33 215 33 215
Mean number of quarters with sales 24.00 24.00 23.33 20.28
Formulationa
Oral solid (NFC1 A/B %) 9.09 36.28 9.35 33.65
Oral liquid (NFC1 D/E %) 12.12 13.95 12.47 15.23
Parenteral (NFC1 F/G %) 57.58 22.33 56.49 21.42
Other 21.21 27.44 21.69 29.70
Quarterly sales, $U.S. (millions)
Mean 14.50 10.51 14.91 12.44
Standard deviation 38.66 22.53 39.13 24.02
Median 4.62 1.74 4.89 3.24
Quarterly volume, standard units (millions)
Mean 9.23 9.84 9.50 11.65
Standard deviation 21.64 25.63 21.89 27.51
Median 0.42 0.33 0.50 0.59
Quarterly HHI
Mean N/A N/A 0.67 0.71
Standard deviation N/A N/A 0.30 0.31
Median N/A N/A 0.66 0.87
Quarterly count of manufacturers
Mean N/A N/A 3.69 4.03
Standard deviation N/A N/A 2.86 4.55
Median N/A N/A 3.00 2.00
Quarterly market status categorya
Innovator brand only (%) N/A N/A 17.27 21.93
Multisource (%) N/A N/A 64.81 55.48
Single-source generic (%) N/A N/A 17.92 22.59
SOURCE: Authors’ analysis of FDA and ASHP data linked to IQVIA MIDAS data. NOTE: Percentages may not sum to 100 percent because of rounding. N/A = not applicable. a For categorical variables, p-values from chi-square tests of shortage versus nonshortage quarters are significant at p < 0.001. For continuous variables, differences in means between shortage and nonshortage quarters are significant at p < 0.001. All other p-values are > 0.05.
Table E.2 presents the mean percentage change in volume, price, and HHI; the mean change
in the number of manufacturers for shortage and nonshortage drugs; and shortage drug forms
disaggregated by formulation, measured from the quarter prior to the shortage to the quarter
after. Because the small number of shortage drug forms in this analysis did not lend itself to
using a matching approach as in the main analysis, we assigned Q0 to nonshortage drugs
randomly. Shortage drugs experienced a substantial reduction in volume over this period (−15.05
percent), while nonshortage drugs experienced a 21-percent increase in volume. Drug forms in
both categories experienced increases in price; small increases, on average, in the number of
manufacturers; and increases in HHI. Interestingly, when drug forms are disaggregated by
formulation, we observe that shortage drugs, oral solids, parenteral drugs, and other drugs all
experienced reductions in volume following shortages, while oral liquids saw a large increase in

87
volume. However, the small sample sizes preclude us from generalizing based on these data
alone.
Table E.2. Mean Changes in Volume, Price, Number of Manufacturers, and HHI, Q − 1 to Q + 1
Mean Percentage Change in
Volume
Mean Percentage Change in
Price
Mean Change in Number of
Manufacturers
Mean Percentage Change in
HHI
Overall
Shortage drug forms (n = 33) −15.05 14.08 0.06 7.26
Nonshortage drug forms (n = 215) 21.18 26.49 0.53 22.27
By formulation
Shortage drug forms
Oral solid (NFC1 A/B) (n = 3) −25.11 20.09 0.00 22.27
Oral liquid (NFC1 D/E) (n = 4) 49.03 50.19 0.75 34.77
Parenteral (NFC1 F/G) (n = 19) −20.55 7.82 −0.11 0.95
Other (n = 7) −32.45 7.83 0.14 2.24
Nonshortage drug forms
Oral solid (NFC1 A/B) (n = 78) 28.42 30.79 0.32 26.78
Oral liquid (NFC1 D/E) (n = 30) −4.43 20.78 0.43 2.77
Parenteral (NFC1 F/G) (n = 47) 31.07 33.35 0.77 29.53
Other (n = 60) 16.80 18.38 0.67 20.49
Associations Between Shortages and U.S. Outcomes
In the following subsections, we report on changes in volume, price, number of
manufacturers, and HHI for antimicrobial drug forms that were in shortage compared with those
that were not in shortage. As we did for the results from the main report, we measure these
changes from the quarter prior to the shortage (Q − 1) to the quarter following the shortage
(Q + 1). Unlike the results from the main analysis, responses to U.S. shortages in terms of
volume were fairly homogenous, while responses in terms of price, number of manufacturers,
and HHI were slightly more heterogenous.
Volume
Antimicrobial drug forms that were flagged as having shortages largely experienced
reductions in volume following the shortage start date, as noted by ASHP or FDA (Figure E.1).
Percentage changes were most frequently between −50 percent and 0 percent (this accounted for
55 percent of shortages), but larger reductions occurred in 18 percent of shortages, and increases
in volume occurred in the remaining 27 percent of shortages. Nonshortage drug forms had a peak
in the distribution of changes in volume around zero but had slightly more increases than
decreases in volume.
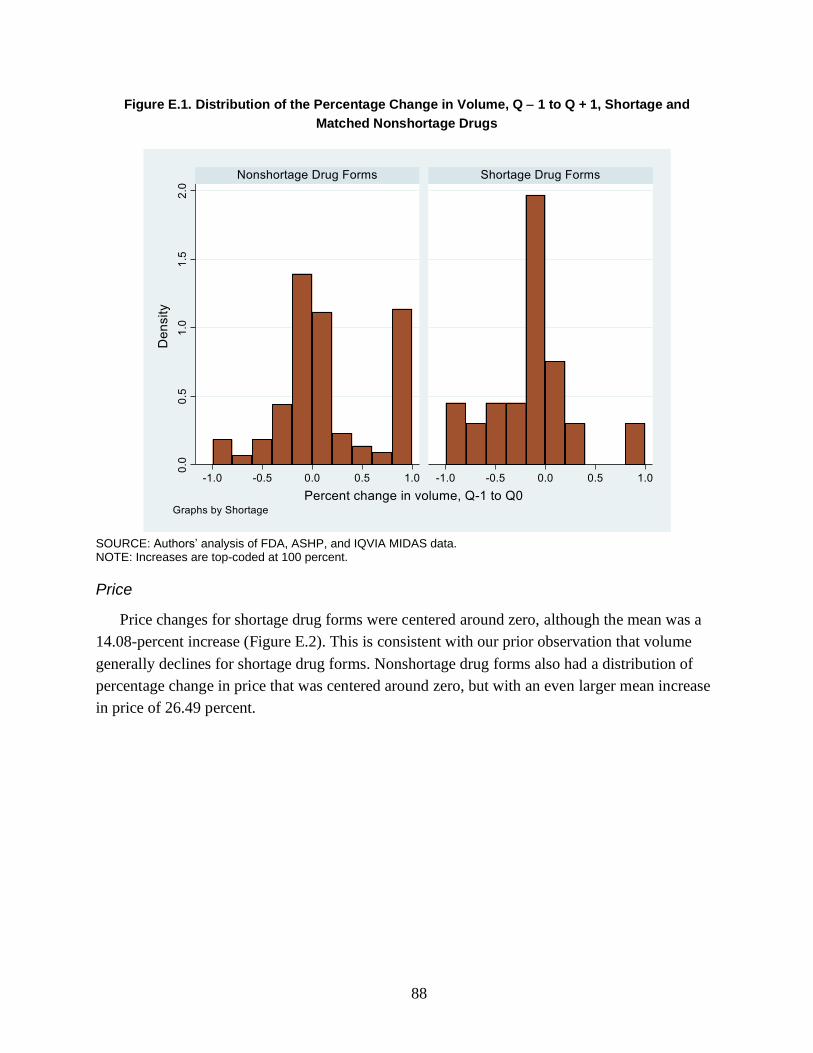
88
Figure E.1. Distribution of the Percentage Change in Volume, Q − 1 to Q + 1, Shortage and
Matched Nonshortage Drugs
SOURCE: Authors’ analysis of FDA, ASHP, and IQVIA MIDAS data. NOTE: Increases are top-coded at 100 percent.
Price
Price changes for shortage drug forms were centered around zero, although the mean was a
14.08-percent increase (Figure E.2). This is consistent with our prior observation that volume
generally declines for shortage drug forms. Nonshortage drug forms also had a distribution of
percentage change in price that was centered around zero, but with an even larger mean increase
in price of 26.49 percent.
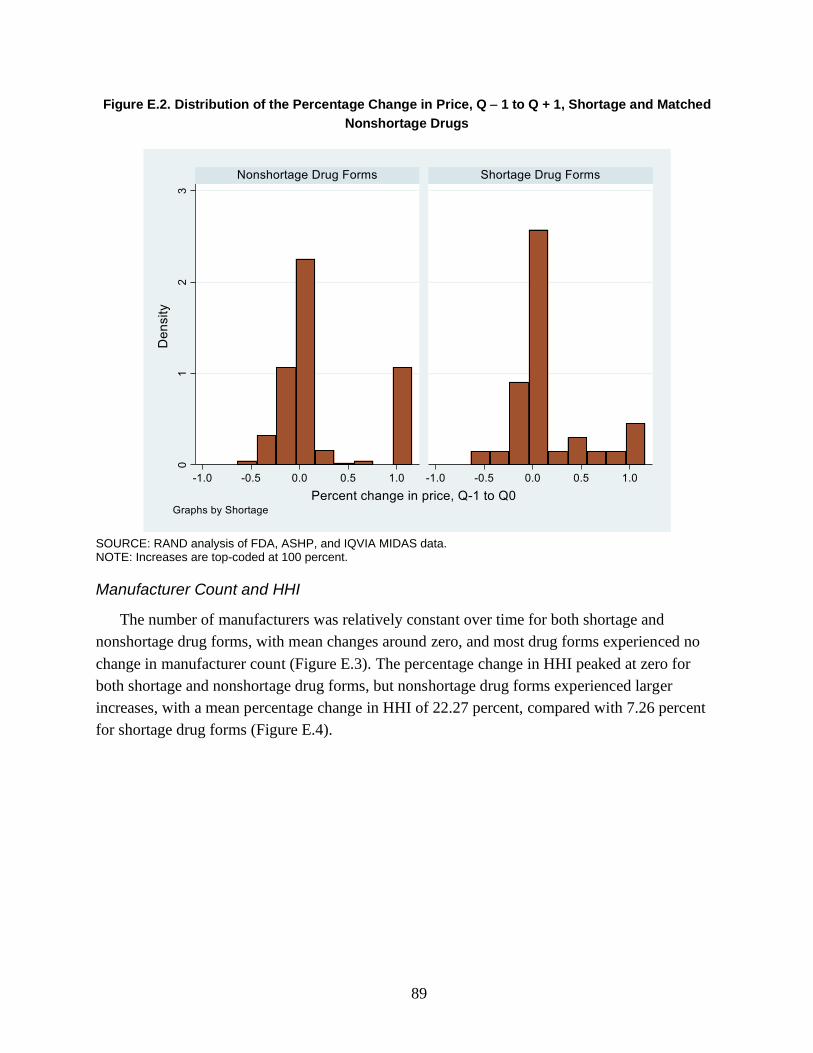
89
Figure E.2. Distribution of the Percentage Change in Price, Q − 1 to Q + 1, Shortage and Matched
Nonshortage Drugs
SOURCE: RAND analysis of FDA, ASHP, and IQVIA MIDAS data. NOTE: Increases are top-coded at 100 percent.
Manufacturer Count and HHI
The number of manufacturers was relatively constant over time for both shortage and
nonshortage drug forms, with mean changes around zero, and most drug forms experienced no
change in manufacturer count (Figure E.3). The percentage change in HHI peaked at zero for
both shortage and nonshortage drug forms, but nonshortage drug forms experienced larger
increases, with a mean percentage change in HHI of 22.27 percent, compared with 7.26 percent
for shortage drug forms (Figure E.4).

90
Figure E.3. Distribution of the Change in the Count of Manufacturers, Q − 1 to Q + 1, Shortage and
Matched Nonshortage Drugs
SOURCE: Authors’ analysis of FDA, ASHP, and IQVIA MIDAS data. NOTE: Increases are top-coded at 100 percent.

91
Figure E.4. Distribution of the Percentage Change in HHI, Q − 1 to Q + 1, Shortage and Matched
Nonshortage Drugs
SOURCE: Authors’ analysis of FDA, ASHP, and IQVIA MIDAS data. NOTE: Increases are top-coded at 100 percent.
Associations Between Changes in U.S. and Other-Country Outcomes
Many of the results observed in the United States for shortage drug forms relative to
nonshortage drug forms do not play out in other countries. Table E.3 notes the number of
antimicrobial drug forms in each country that were in shortage and were not in shortage during
our study period. In terms of volume, we found an average 15.1-percent decline in volume from
Q − 1 to Q + 1 in the United States compared with a 21.2-percent increase over the same period
for nonshortage drugs. In every other country we studied, both shortage and nonshortage drugs
experienced increases in volume, on average (Figure E.5). Changes in price for both shortage
and nonshortage drug forms in the United States were large and positive. The same pattern was
consistent in all other countries (Figure E.6).
The average number of manufacturers per shortage drug form increased slightly in the United
States compared with slight decreases in other countries (Figure E.7). For example, in the United
States, the mean number of manufacturers per shortage drug form prior to the shortage was 3.5;
this increased to 3.6 after the shortage. This corresponded to an increase in HHI in the United
States and increases in HHI in all other countries (Figure E.8). In general, the number of
manufacturers is fairly stable over time.
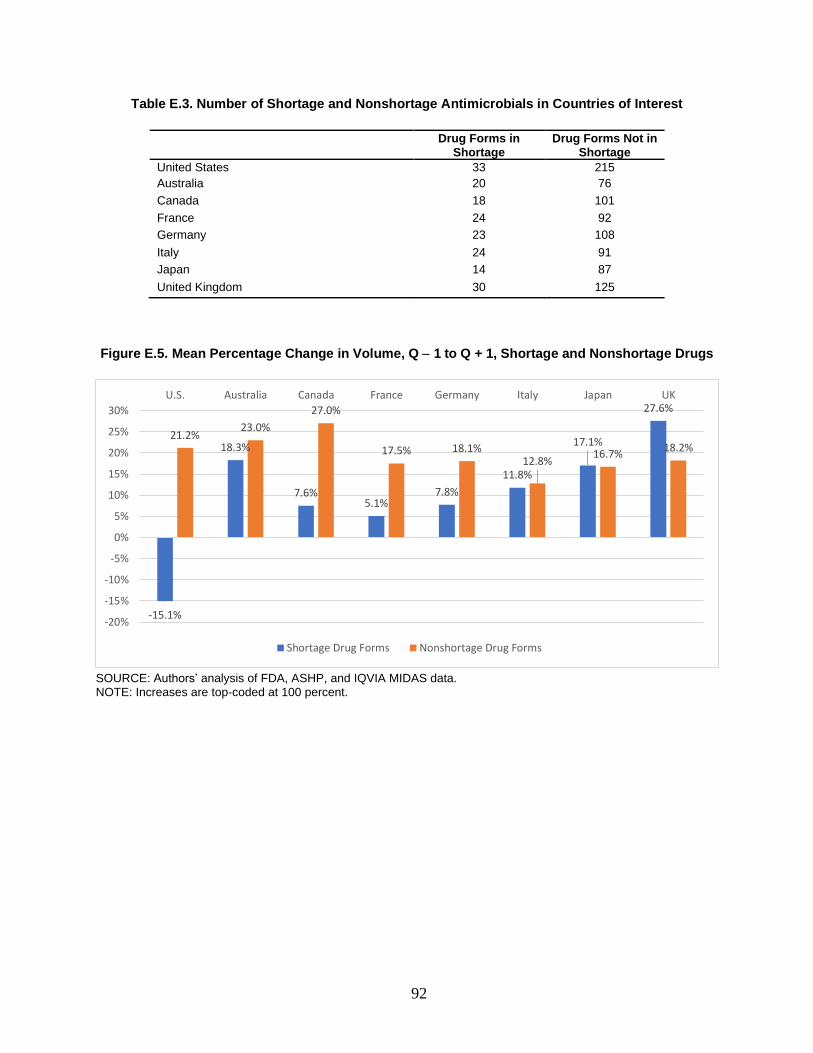
92
Table E.3. Number of Shortage and Nonshortage Antimicrobials in Countries of Interest
Drug Forms in
Shortage Drug Forms Not in
Shortage
United States 33 215
Australia 20 76
Canada 18 101
France 24 92
Germany 23 108
Italy 24 91
Japan 14 87
United Kingdom 30 125
Figure E.5. Mean Percentage Change in Volume, Q − 1 to Q + 1, Shortage and Nonshortage Drugs
SOURCE: Authors’ analysis of FDA, ASHP, and IQVIA MIDAS data. NOTE: Increases are top-coded at 100 percent.
-15.1%
18.3%
7.6%5.1%
7.8%
11.8%
17.1%
27.6%
21.2%23.0%
27.0%
17.5% 18.1%12.8%
16.7%18.2%
-20%
-15%
-10%
-5%
0%
5%
10%
15%
20%
25%
30%
U.S. Australia Canada France Germany Italy Japan UK
Shortage Drug Forms Nonshortage Drug Forms
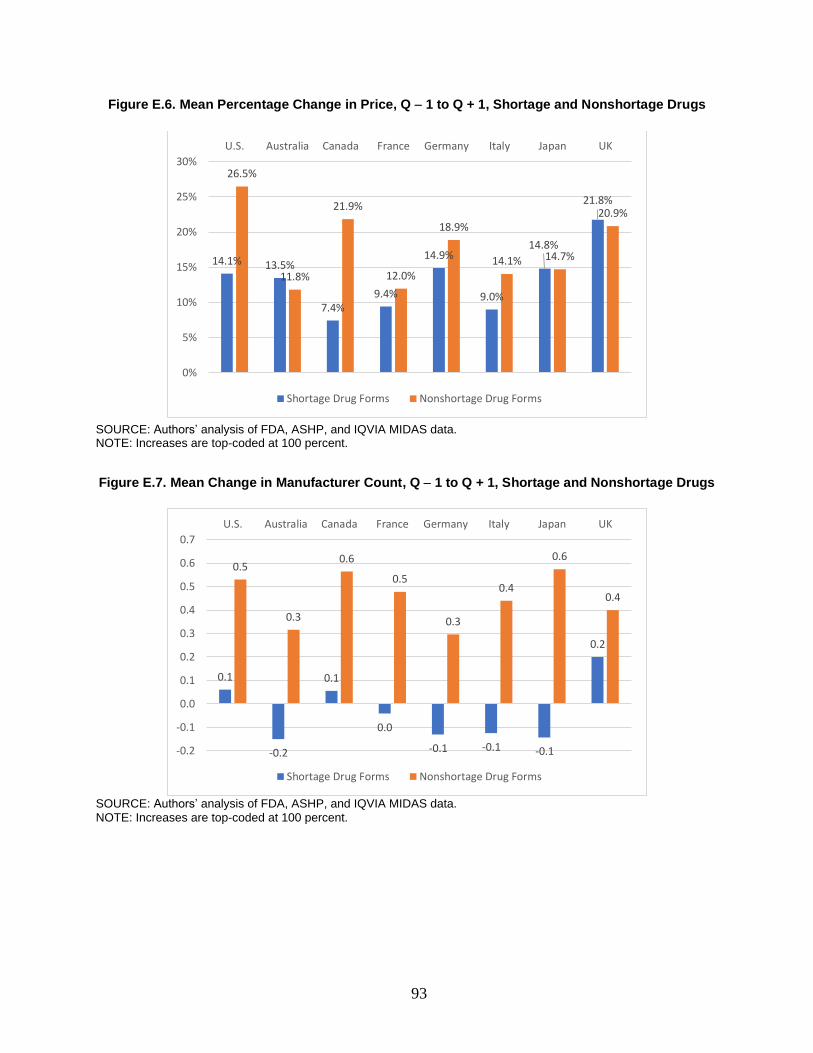
93
Figure E.6. Mean Percentage Change in Price, Q − 1 to Q + 1, Shortage and Nonshortage Drugs
SOURCE: Authors’ analysis of FDA, ASHP, and IQVIA MIDAS data. NOTE: Increases are top-coded at 100 percent.
Figure E.7. Mean Change in Manufacturer Count, Q − 1 to Q + 1, Shortage and Nonshortage Drugs
SOURCE: Authors’ analysis of FDA, ASHP, and IQVIA MIDAS data. NOTE: Increases are top-coded at 100 percent.
14.1% 13.5%
7.4%9.4%
14.9%
9.0%
14.8%
21.8%
26.5%
11.8%
21.9%
12.0%
18.9%
14.1% 14.7%
20.9%
0%
5%
10%
15%
20%
25%
30%
U.S. Australia Canada France Germany Italy Japan UK
Shortage Drug Forms Nonshortage Drug Forms
0.1
-0.2
0.1
0.0
-0.1 -0.1 -0.1
0.2
0.5
0.3
0.6
0.5
0.3
0.4
0.6
0.4
-0.2
-0.1
0.0
0.1
0.2
0.3
0.4
0.5
0.6
0.7
U.S. Australia Canada France Germany Italy Japan UK
Shortage Drug Forms Nonshortage Drug Forms

94
Figure E.8. Mean Percentage Change in HHI, Q − 1 to Q + 1, Shortage and Nonshortage Drugs
SOURCE: Authors’ analysis of FDA, ASHP, and IQVIA MIDAS data. NOTE: Increases are top-coded at 100 percent.
Conclusion
Compared with the overall analyses of shortage drug forms in Chapter 4, antimicrobial
shortage drug forms experienced reductions in volume more consistently following a shortage.
Although there was a clear difference in the change in volume between shortage and nonshortage
antimicrobial drug forms, there was less of a difference in prices, number of manufacturers, and
HHI, with those effects going in the same direction for both shortage and nonshortage drug
forms. Consistent with the overall analysis, however, these U.S.-based results for antimicrobial
drug forms did not align with measured changes over the same intervals in comparison countries,
which suggested that shortages of antimicrobials in the United States might not occur in other
countries at the same time.
7.3%
13.3%
10.2%
3.4%
17.1%
9.5%
13.7%
20.9%22.3%
16.4%
24.1%
12.6%
19.0%
12.9%
15.3%
21.8%
0%
5%
10%
15%
20%
25%
30%
U.S. Australia Canada France Germany Italy Japan UK
Shortage Drug Forms Nonshortage Drug Forms
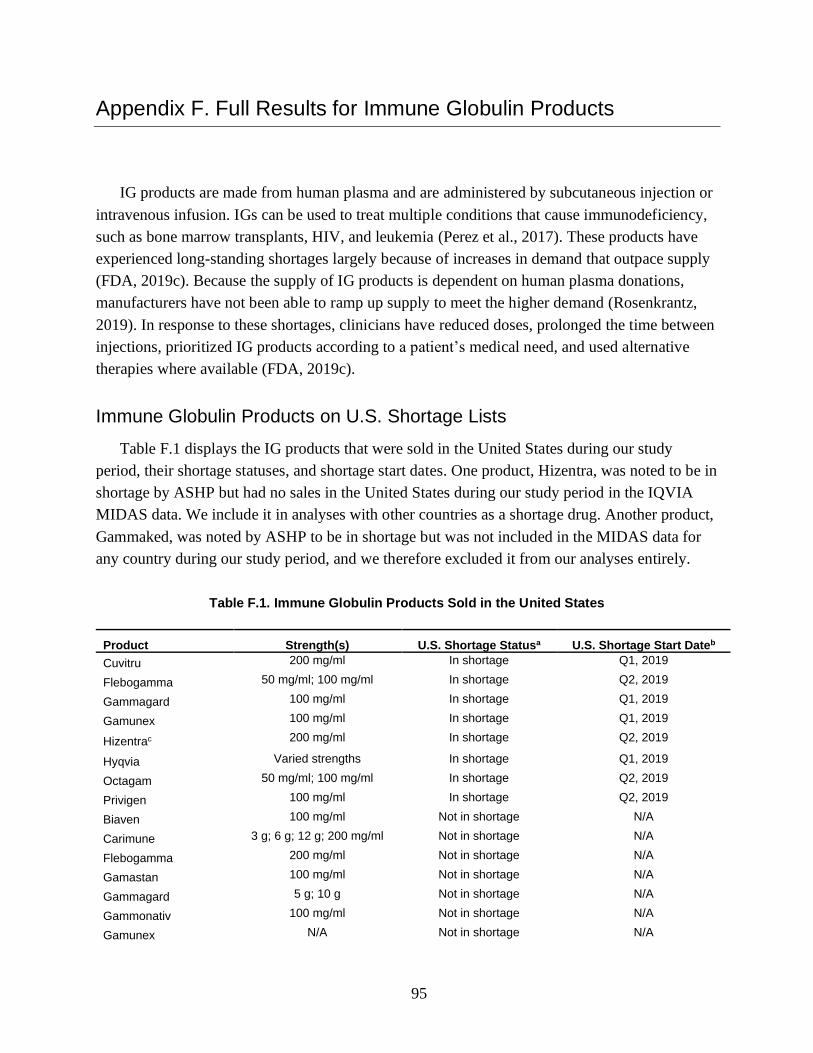
95
Appendix F. Full Results for Immune Globulin Products
IG products are made from human plasma and are administered by subcutaneous injection or
intravenous infusion. IGs can be used to treat multiple conditions that cause immunodeficiency,
such as bone marrow transplants, HIV, and leukemia (Perez et al., 2017). These products have
experienced long-standing shortages largely because of increases in demand that outpace supply
(FDA, 2019c). Because the supply of IG products is dependent on human plasma donations,
manufacturers have not been able to ramp up supply to meet the higher demand (Rosenkrantz,
2019). In response to these shortages, clinicians have reduced doses, prolonged the time between
injections, prioritized IG products according to a patient’s medical need, and used alternative
therapies where available (FDA, 2019c).
Immune Globulin Products on U.S. Shortage Lists
Table F.1 displays the IG products that were sold in the United States during our study
period, their shortage statuses, and shortage start dates. One product, Hizentra, was noted to be in
shortage by ASHP but had no sales in the United States during our study period in the IQVIA
MIDAS data. We include it in analyses with other countries as a shortage drug. Another product,
Gammaked, was noted by ASHP to be in shortage but was not included in the MIDAS data for
any country during our study period, and we therefore excluded it from our analyses entirely.
Table F.1. Immune Globulin Products Sold in the United States
Product Strength(s) U.S. Shortage Statusa U.S. Shortage Start Dateb
Cuvitru 200 mg/ml In shortage Q1, 2019
Flebogamma 50 mg/ml; 100 mg/ml In shortage Q2, 2019
Gammagard 100 mg/ml In shortage Q1, 2019
Gamunex 100 mg/ml In shortage Q1, 2019
Hizentrac 200 mg/ml In shortage Q2, 2019
Hyqvia Varied strengths In shortage Q1, 2019
Octagam 50 mg/ml; 100 mg/ml In shortage Q2, 2019
Privigen 100 mg/ml In shortage Q2, 2019
Biaven 100 mg/ml Not in shortage N/A
Carimune 3 g; 6 g; 12 g; 200 mg/ml Not in shortage N/A
Flebogamma 200 mg/ml Not in shortage N/A
Gamastan 100 mg/ml Not in shortage N/A
Gammagard 5 g; 10 g Not in shortage N/A
Gammonativ 100 mg/ml Not in shortage N/A
Gamunex N/A Not in shortage N/A

96
Product Strength(s) U.S. Shortage Statusa U.S. Shortage Start Dateb
Intraglobin 100 mg/ml Not in shortage N/A
Lederglobina 165 mg/ml Not in shortage N/A
Octagam 165 mg/ml Not in shortage N/A
Vigam 50 mg/ml; 100 mg/ml Not in shortage N/A
NOTE: This table includes IG products sold in the United States if they appeared in the MIDAS data during our study period. N/A = not applicable. a We list IG products as “In shortage” if the product was ever in shortage during the study period, according to FDA or ASHP. b Shortage start date is the earliest shortage start date noted in either the FDA or ASHP database during our study period. c Product had zero volume in the United States during our study period.
Figure F.1 plots the volume of each IG product in shortage in the United States, with the
vertical line representing the shortage start date for that product. The trends in volume relative to
the shortage start quarter vary. For example, volume had been declining for both of the strengths
of Flebogamma that were in shortage since the start of our study period, began increasing just
prior to the shortage start date, and then declined at the shortage start quarter. Cuvitru,
Gammagard, Gamunex, Hyqvia, Octagam 100 mg/ml, and Privigen all followed relatively
similar trends, with an increasing trend in volume over time and small to moderate declines
around the shortage start quarter. Finally, Octagam 50 mg/ml had a decreasing trend in volume
over time, with a slightly more substantial decline in volume at the shortage start quarter.
Overall, this suggests that there might not be consistent patterns in changes in volume for IG
products relative to shortage start dates. Furthermore, for a subset of IG products, we had
additional data on volume dating back to 2010 (Figure F.2). The additional years of data show
that for these products, volume has long had substantial quarter-to-quarter variation.

97
Figure F.1. U.S. Volume of Immune Globulin Products in Shortage
NOTE: Axes differ across panels. Vari Str = varied strengths.

98
Figure F.2. U.S. Volume of Immune Globulin Products in Shortage, 2010–2019
NOTES: Axes differ across panels.
Figure F.3 similarly plots the price of each IG product in shortage in the United States, with
the vertical line again representing the shortage start date for that product. Most products
experience a minor to moderate decrease in prices during or just after the shortage start quarter,
but most prices rebound within one to two quarters. It is worth noting that this is the opposite of
the expected response; typically, a situation in which demand outpaces supply is associated with
increased prices. Again, for a subset of these products, we had additional data on prices dating
back to 2010 (Figure F.4). Similar to volume, prices for IG products show substantial variation
over time.

99
Figure F.3. U.S. Price of Immune Globulin Products in Shortage
NOTE: Axes differ across panels. Vari Str = varied strengths.
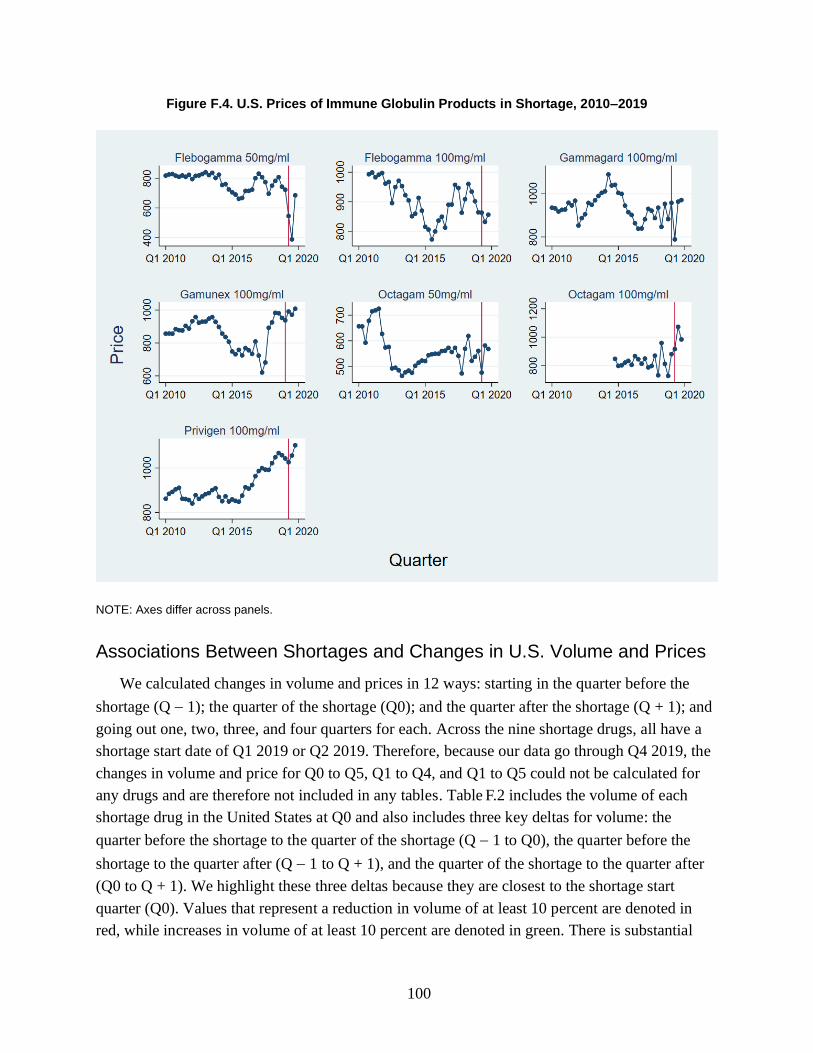
100
Figure F.4. U.S. Prices of Immune Globulin Products in Shortage, 2010–2019
NOTE: Axes differ across panels.
Associations Between Shortages and Changes in U.S. Volume and Prices
We calculated changes in volume and prices in 12 ways: starting in the quarter before the
shortage (Q − 1); the quarter of the shortage (Q0); and the quarter after the shortage (Q + 1); and
going out one, two, three, and four quarters for each. Across the nine shortage drugs, all have a
shortage start date of Q1 2019 or Q2 2019. Therefore, because our data go through Q4 2019, the
changes in volume and price for Q0 to Q5, Q1 to Q4, and Q1 to Q5 could not be calculated for
any drugs and are therefore not included in any tables. Table .2 includes the volume of each
shortage drug in the United States at Q0 and also includes three key deltas for volume: the
quarter before the shortage to the quarter of the shortage (Q − 1 to Q0), the quarter before the
shortage to the quarter after (Q − 1 to Q + 1), and the quarter of the shortage to the quarter after
(Q0 to Q + 1). We highlight these three deltas because they are closest to the shortage start
quarter (Q0). Values that represent a reduction in volume of at least 10 percent are denoted in
red, while increases in volume of at least 10 percent are denoted in green. There is substantial
F
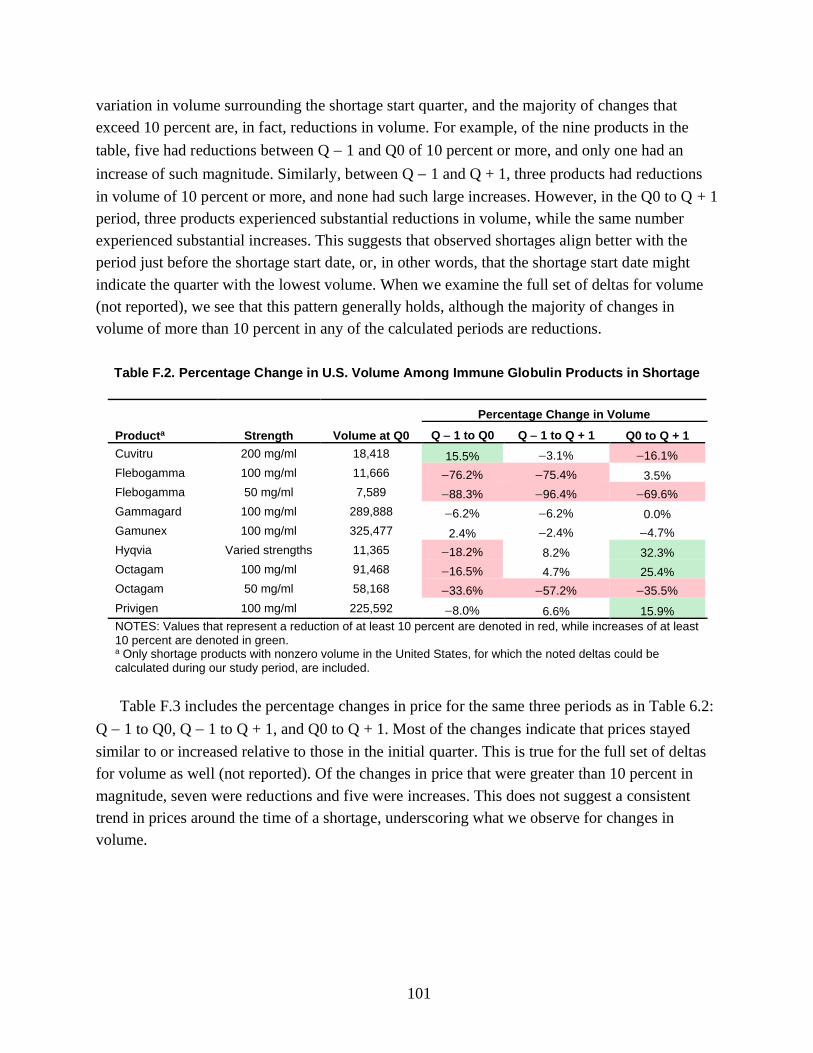
101
variation in volume surrounding the shortage start quarter, and the majority of changes that
exceed 10 percent are, in fact, reductions in volume. For example, of the nine products in the
table, five had reductions between Q − 1 and Q0 of 10 percent or more, and only one had an
increase of such magnitude. Similarly, between Q − 1 and Q + 1, three products had reductions
in volume of 10 percent or more, and none had such large increases. However, in the Q0 to Q + 1
period, three products experienced substantial reductions in volume, while the same number
experienced substantial increases. This suggests that observed shortages align better with the
period just before the shortage start date, or, in other words, that the shortage start date might
indicate the quarter with the lowest volume. When we examine the full set of deltas for volume
(not reported), we see that this pattern generally holds, although the majority of changes in
volume of more than 10 percent in any of the calculated periods are reductions.
Table F.2. Percentage Change in U.S. Volume Among Immune Globulin Products in Shortage
Producta Strength Volume at Q0
Percentage Change in Volume
Q − 1 to Q0 Q − 1 to Q + 1 Q0 to Q + 1
Cuvitru 200 mg/ml 18,418 15.5% −3.1% −16.1%
Flebogamma 100 mg/ml 11,666 −76.2% −75.4% 3.5%
Flebogamma 50 mg/ml 7,589 −88.3% −96.4% −69.6%
Gammagard 100 mg/ml 289,888 −6.2% −6.2% 0.0%
Gamunex 100 mg/ml 325,477 2.4% −2.4% −4.7%
Hyqvia Varied strengths 11,365 −18.2% 8.2% 32.3%
Octagam 100 mg/ml 91,468 −16.5% 4.7% 25.4%
Octagam 50 mg/ml 58,168 −33.6% −57.2% −35.5%
Privigen 100 mg/ml 225,592 −8.0% 6.6% 15.9%
NOTES: Values that represent a reduction of at least 10 percent are denoted in red, while increases of at least 10 percent are denoted in green. a Only shortage products with nonzero volume in the United States, for which the noted deltas could be calculated during our study period, are included.
Table F.3 includes the percentage changes in price for the same three periods as in Table 6.2:
Q − 1 to Q0, Q − 1 to Q + 1, and Q0 to Q + 1. Most of the changes indicate that prices stayed
similar to or increased relative to those in the initial quarter. This is true for the full set of deltas
for volume as well (not reported). Of the changes in price that were greater than 10 percent in
magnitude, seven were reductions and five were increases. This does not suggest a consistent
trend in prices around the time of a shortage, underscoring what we observe for changes in
volume.
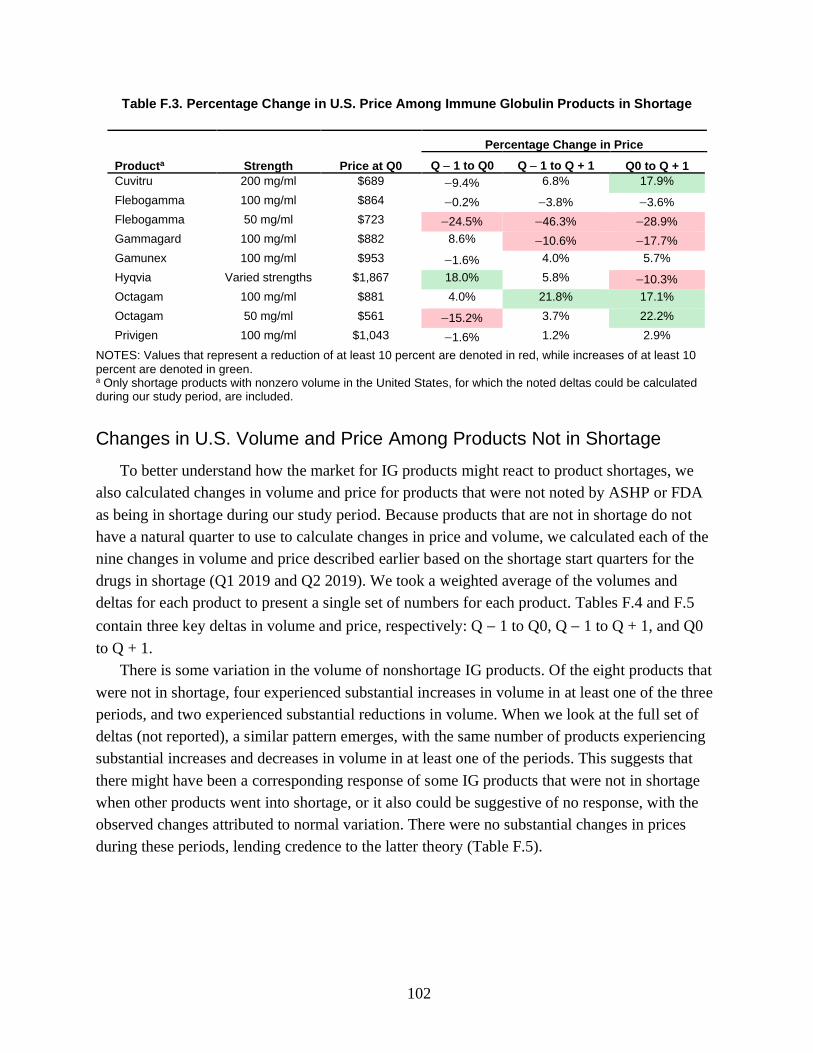
102
Table F.3. Percentage Change in U.S. Price Among Immune Globulin Products in Shortage
Producta Strength Price at Q0
Percentage Change in Price
Q − 1 to Q0 Q − 1 to Q + 1 Q0 to Q + 1
Cuvitru 200 mg/ml $689 −9.4% 6.8% 17.9%
Flebogamma 100 mg/ml $864 −0.2% −3.8% −3.6%
Flebogamma 50 mg/ml $723 −24.5% −46.3% −28.9%
Gammagard 100 mg/ml $882 8.6% −10.6% −17.7%
Gamunex 100 mg/ml $953 −1.6% 4.0% 5.7%
Hyqvia Varied strengths $1,867 18.0% 5.8% −10.3%
Octagam 100 mg/ml $881 4.0% 21.8% 17.1%
Octagam 50 mg/ml $561 −15.2% 3.7% 22.2%
Privigen 100 mg/ml $1,043 −1.6% 1.2% 2.9%
NOTES: Values that represent a reduction of at least 10 percent are denoted in red, while increases of at least 10 percent are denoted in green. a Only shortage products with nonzero volume in the United States, for which the noted deltas could be calculated during our study period, are included.
Changes in U.S. Volume and Price Among Products Not in Shortage
To better understand how the market for IG products might react to product shortages, we
also calculated changes in volume and price for products that were not noted by ASHP or FDA
as being in shortage during our study period. Because products that are not in shortage do not
have a natural quarter to use to calculate changes in price and volume, we calculated each of the
nine changes in volume and price described earlier based on the shortage start quarters for the
drugs in shortage (Q1 2019 and Q2 2019). We took a weighted average of the volumes and
deltas for each product to present a single set of numbers for each product. Tables F.4 and F.5
contain three key deltas in volume and price, respectively: Q − 1 to Q0, Q − 1 to Q + 1, and Q0
to Q + 1.
There is some variation in the volume of nonshortage IG products. Of the eight products that
were not in shortage, four experienced substantial increases in volume in at least one of the three
periods, and two experienced substantial reductions in volume. When we look at the full set of
deltas (not reported), a similar pattern emerges, with the same number of products experiencing
substantial increases and decreases in volume in at least one of the periods. This suggests that
there might have been a corresponding response of some IG products that were not in shortage
when other products went into shortage, or it also could be suggestive of no response, with the
observed changes attributed to normal variation. There were no substantial changes in prices
during these periods, lending credence to the latter theory (Table F.5).
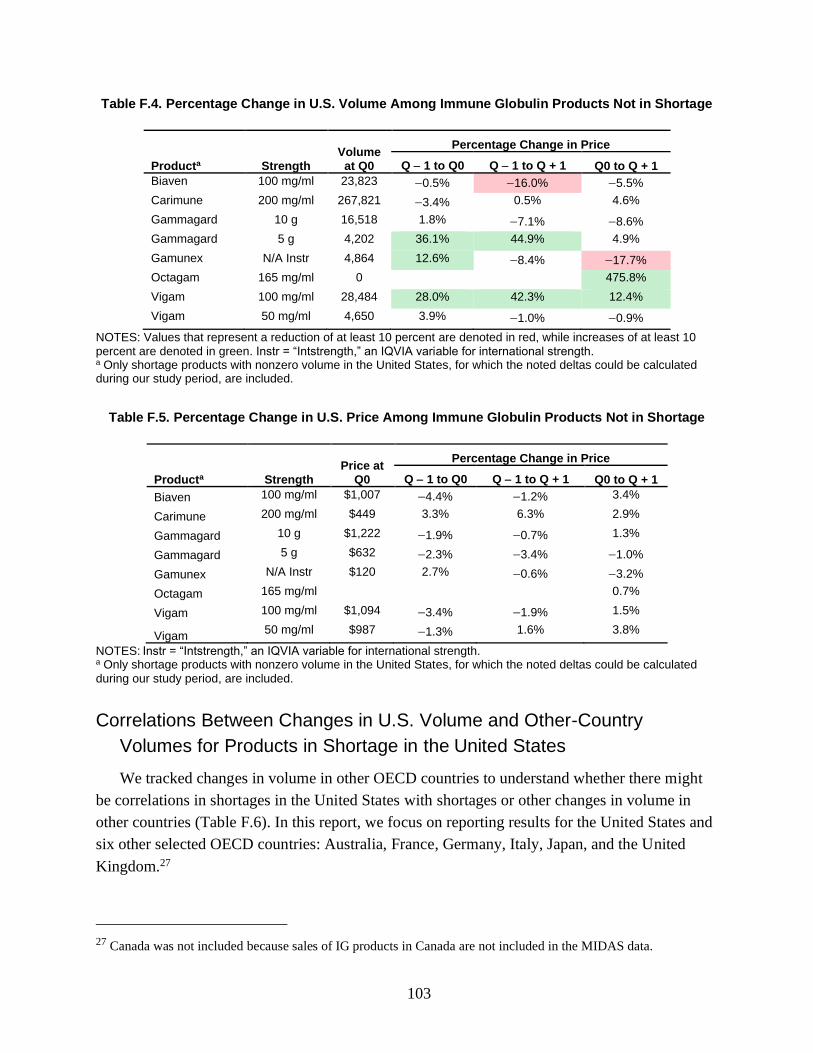
103
Table F.4. Percentage Change in U.S. Volume Among Immune Globulin Products Not in Shortage
Producta Strength Volume at Q0
Percentage Change in Price
Q − 1 to Q0 Q − 1 to Q + 1 Q0 to Q + 1
Biaven 100 mg/ml 23,823 −0.5% −16.0% −5.5%
Carimune 200 mg/ml 267,821 −3.4% 0.5% 4.6%
Gammagard 10 g 16,518 1.8% −7.1% −8.6%
Gammagard 5 g 4,202 36.1% 44.9% 4.9%
Gamunex N/A Instr 4,864 12.6% −8.4% −17.7%
Octagam 165 mg/ml 0
475.8%
Vigam 100 mg/ml 28,484 28.0% 42.3% 12.4%
Vigam 50 mg/ml 4,650 3.9% −1.0% −0.9%
NOTES: Values that represent a reduction of at least 10 percent are denoted in red, while increases of at least 10 percent are denoted in green. Instr = “Intstrength,” an IQVIA variable for international strength. a Only shortage products with nonzero volume in the United States, for which the noted deltas could be calculated during our study period, are included.
Table F.5. Percentage Change in U.S. Price Among Immune Globulin Products Not in Shortage
Producta Strength Price at
Q0
Percentage Change in Price
Q − 1 to Q0 Q − 1 to Q + 1 Q0 to Q + 1
Biaven 100 mg/ml $1,007 −4.4% −1.2% 3.4%
Carimune 200 mg/ml $449 3.3% 6.3% 2.9%
Gammagard 10 g $1,222 −1.9% −0.7% 1.3%
Gammagard 5 g $632 −2.3% −3.4% −1.0%
Gamunex N/A Instr $120 2.7% −0.6% −3.2%
Octagam 165 mg/ml
0.7%
Vigam 100 mg/ml $1,094 −3.4% −1.9% 1.5%
Vigam 50 mg/ml $987 −1.3% 1.6% 3.8%
NOTES: Instr = “Intstrength,” an IQVIA variable for international strength. a Only shortage products with nonzero volume in the United States, for which the noted deltas could be calculated during our study period, are included.
Correlations Between Changes in U.S. Volume and Other-Country
Volumes for Products in Shortage in the United States
We tracked changes in volume in other OECD countries to understand whether there might
be correlations in shortages in the United States with shortages or other changes in volume in
other countries (Table F.6). In this report, we focus on reporting results for the United States and
six other selected OECD countries: Australia, France, Germany, Italy, Japan, and the United
Kingdom.27
27 Canada was not included because sales of IG products in Canada are not included in the MIDAS data.
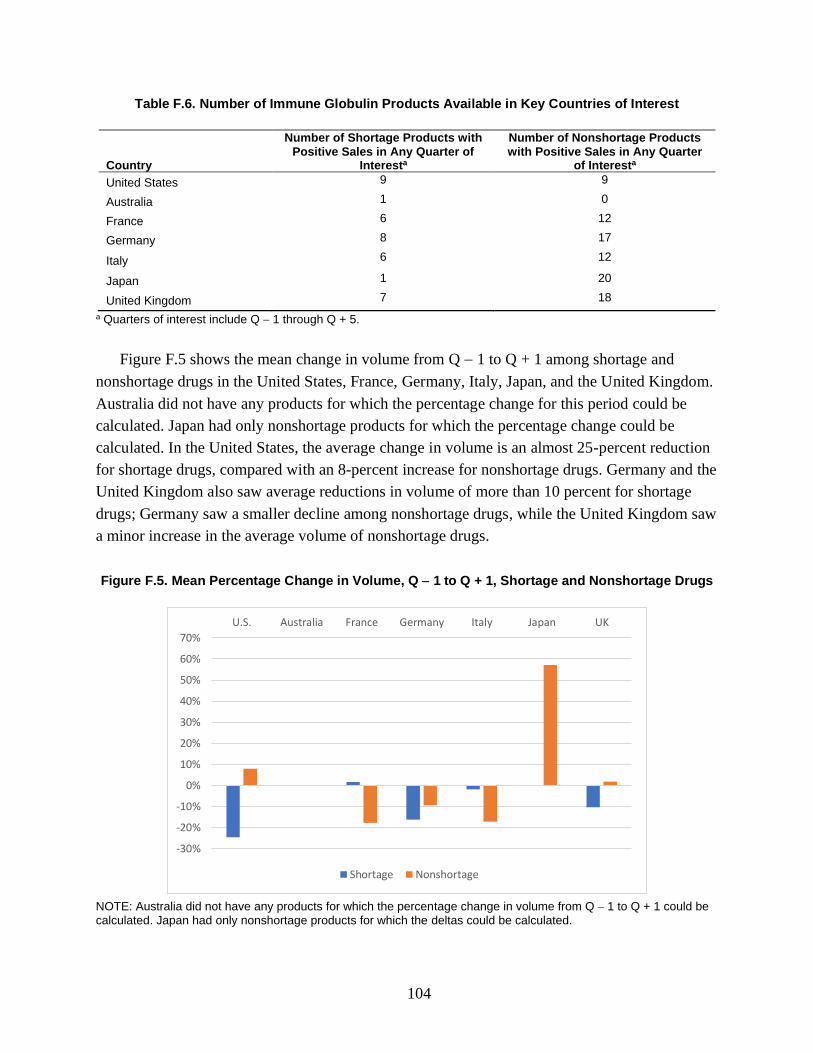
104
Table F.6. Number of Immune Globulin Products Available in Key Countries of Interest
Country
Number of Shortage Products with Positive Sales in Any Quarter of
Interesta
Number of Nonshortage Products with Positive Sales in Any Quarter
of Interesta
United States 9 9
Australia 1 0
France 6 12
Germany 8 17
Italy 6 12
Japan 1 20
United Kingdom 7 18
a Quarters of interest include Q − 1 through Q + 5.
Figure F.5 shows the mean change in volume from Q − 1 to Q + 1 among shortage and
nonshortage drugs in the United States, France, Germany, Italy, Japan, and the United Kingdom.
Australia did not have any products for which the percentage change for this period could be
calculated. Japan had only nonshortage products for which the percentage change could be
calculated. In the United States, the average change in volume is an almost 25-percent reduction
for shortage drugs, compared with an 8-percent increase for nonshortage drugs. Germany and the
United Kingdom also saw average reductions in volume of more than 10 percent for shortage
drugs; Germany saw a smaller decline among nonshortage drugs, while the United Kingdom saw
a minor increase in the average volume of nonshortage drugs.
Figure F.5. Mean Percentage Change in Volume, Q − 1 to Q + 1, Shortage and Nonshortage Drugs
NOTE: Australia did not have any products for which the percentage change in volume from Q − 1 to Q + 1 could be calculated. Japan had only nonshortage products for which the deltas could be calculated.
-30%
-20%
-10%
0%
10%
20%
30%
40%
50%
60%
70%
U.S. Australia France Germany Italy Japan UK
Shortage Nonshortage

105
Figure F.6 similarly shows the mean change in price from Q − 1 to Q + 1 among shortage
and nonshortage drugs in the United States, France, Germany, Italy, Japan, and the United
Kingdom. In the United States, the average change in price is about a 2-percent reduction for
shortage drugs, while there is no change in average prices for nonshortage drugs. Most other
countries saw only small changes in price for both shortage and nonshortage drugs (less than 3
percent), with the exception of shortage drugs in the United Kingdom. These products saw a
reduction in prices of close to 8 percent; this is counter to the expected result, in which we would
expect an increase in prices in response to a shortage.
Figure F.6. Mean Percentage Change in Price, Q − 1 to Q + 1, Shortage and Nonshortage Drugs
NOTE: Australia did not have any products for which the percentage change in price from Q − 1 to Q + 1 could be calculated. Japan had only nonshortage products for which the deltas could be calculated.
Conclusion
The results from the descriptive analyses of IG products suggest that although IG products in
shortage in the United States were more likely to have larger average reductions in volume
compared with nonshortage drugs over the same time frame, there is substantial variation in the
volume of IG products over time. Interestingly, prices typically fell slightly following a shortage,
which is the opposite of the expected response; this suggests that prices might be sluggish in this
market. Patterns were even more difficult to discern in other countries. Germany and the United
Kingdom followed a similar pattern to that of the United States (i.e., larger reductions in volume
among shortage drugs compared with nonshortage drugs), while France and Italy experienced
the opposite pattern. In general, these analyses suggest that shortages of IG products in the
United States do not have consistent impacts on volume and prices in other countries.
-10%
-8%
-6%
-4%
-2%
0%
2%
4%
U.S. Australia France Germany Italy Japan UK
Shortage Nonshortage

106
Abbreviations
API active pharmaceutical ingredient
ARB angiotensin II receptor blocker
ASHP American Society of Health-System Pharmacists
ASPE Office of the Assistant Secretary for Planning and Evaluation
CBER Center for Biologics Evaluation and Research
CDER Center for Drug Evaluation and Research
COVID-19 coronavirus disease 2019
EMA European Medicines Agency
FDA U.S. Food and Drug Administration
GPI generic product identifier
HHI Herfindahl-Hirschman Index
IG immune globulin
NDC National Drug Code
NDMA N-nitrosodimethylamine
OECD Organisation for Economic Co-Operation and Development
Q quarter
WHO World Health Organization

107
References
Acosta, Angela, Egdda Patricia Vanegas, Joan Rovira, Brian Godman, and Tomasz Bochenek,
“Medicine Shortages: Gaps Between Countries and Global Perspectives,” Frontiers in
Pharmacology, Vol. 10, No. 763, July 2019.
Agency for Medicinal Products and Medical Devices of the Republic of Slovenia, “Marketed
Medicinal Products,” webpage, undated. As of July 12, 2021:
https://www.jazmp.si/en/human-medicines/data-on-medicinal-products/marketed-medicinal-
products/
Alevizakos, Michail, Marios Detsis, Christos A. Grigoras, Jason T. Machan, and Eleftherios
Mylonakis, “The Impact of Shortages on Medication Prices: Implications for Shortage
Prevention,” Drugs, Vol. 76, No. 16, 2016, pp. 1551–1558.
American Society of Health-System Pharmacists, “Drug Shortages FAQs,” webpage, undated-a.
As of July 31, 2021:
https://www.ashp.org/Drug-Shortages/Current-Shortages/Drug-Shortages-
FAQs?loginreturnUrl=SSOCheckOnly
American Society of Health-System Pharmacists, “Drug Shortages List: All Drug Shortage
Bulletins,” webpage, undated-b. As of July 31, 2021:
https://www.ashp.org/Drug-Shortages/Current-Shortages/Drug-Shortages-List?page=All
American Society of Health-System Pharmacists, “FDA and ASHP Shortage Parameters,”
webpage, August 2014. As of July 31, 2021:
https://www.ashp.org/Drug-Shortages/Current-Shortages/FDA-and-ASHP-Shortage-
Parameters?loginreturnUrl=SSOCheckOnly
ASHP—See American Society of Health-System Pharmacists.
ASPE—See Office of the Assistant Secretary for Planning and Evaluation.
Australian Government, Department of Health, “Medicine Shortage Reports Database,”
webpage, undated. As of July 12, 2021:
https://apps.tga.gov.au/prod/MSI/search
Austrian Federal Office for Safety in Health Care, “Medicine Shortages,” webpage, updated
January 3, 2021. As of July 12, 2021:
https://www.basg.gv.at/en/market-surveillance/reporting/medicine-shortages

108
Baxter Healthcare Corporation, “Hurricane Maria Supply Update,” letter to Baxter customers,
September 29, 2017. As of July 12, 2021:
https://www.ashp.org/-/media/assets/drug-shortages/docs/drug-shortages-baxter-supply-
update-09292017.ashx
Baxter Healthcare Corporation, “Temporary Importation of Intravenous Drug Products to
Address Drug Shortages,” letter to health care professionals, May 2, 2019. As of July 31,
2021:
https://www.fda.gov/media/124939/download
Biden, Joseph R., Jr., “Executive Order on a Sustainable Public Health Supply Chain,”
Washington, D.C.: The White House, Executive Order 14001, January 21, 2021a. As of July
12, 2021:
https://www.whitehouse.gov/briefing-room/presidential-actions/2021/01/21/executive-order-
a-sustainable-public-health-supply-chain/
Biden, Joseph R., Jr., “Executive Order on America’s Supply Chains,” Washington, D.C.: The
White House, Executive Order 14017, February 24, 2021b. As of July 12, 2021:
https://www.whitehouse.gov/briefing-room/presidential-actions/2021/02/24/executive-order-
on-americas-supply-chains/
Butterfield, Lindsay, Jared Cash, Kathy Pham, and Advocacy Committee for the Pediatric
Pharmacy Advocacy Group, “Drug Shortages and Implications for Pediatric Patients,”
Journal of Pediatric Pharmacology and Therapeutics, Vol. 20, No. 2, March–April 2015, pp.
149–152.
Civica, “Quality. Supply. Price: How Civica Rx Aims to Solve the US Hospital Drug Shortage
Crisis,” October 1, 2019. As of July 12, 2019:
https://civicarx.org/wp-content/uploads/2019/10/Civica-Rx-White-Paper-FINAL-10.01.19-
1.pdf
Code of Federal Regulations, Title 21, Section 600.82, Notification of a Permanent
Discontinuance or an Interruption in Manufacturing.
Danish Medicines Agency, “Reporting on Supply Difficulties for Medicines,” webpage, updated
May 1, 2020. As of July 12, 2021:
https://laegemiddelstyrelsen.dk/en/licensing/supervision-and-inspection/notification-of-
medicine-supply-problems
Dave, Chintan V., Ajinkya Pawar, Erin R. Fox, Gregory Brill, and Aaron S. Kesselheim,
“Predictors of Drug Shortages and Association with Generic Drug Prices: A Retrospective
Cohort Study,” Value in Health, Vol. 21, No. 11, November 2018, pp. 1286–1290.
DrugShortage.ch, “Delivery Bottlenecks for Medicines,” webpage, undated. As of July 12, 2021:
https://www.drugshortage.ch/

109
Drug Shortages Canada, “Drug Shortages Homepage,” webpage, undated. As of July 12, 2021:
https://www.drugshortagescanada.ca
EMA—See European Medicines Agency.
European Medicines Agency, “Availability of Medicines: Guidance for Regulators on Public
Communication,” webpage, undated-a. As of July 12, 2021:
https://www.ema.europa.eu/en/human-regulatory/post-authorisation/availability-
medicines#guidance-for-marketing-authorisation-holders-section
European Medicines Agency, “Download Medicine Data: Shortages,” webpage, undated-b. As
of July 12, 2021:
https://www.ema.europa.eu/en/medicines/download-medicine-data#shortages-section
European Medicines Agency, “Human Regulatory: Shortages Catalogue,” webpage, undated-c.
As of July 12, 2021:
https://www.ema.europa.eu/en/human-regulatory/post-authorisation/availability-
medicines/shortages-catalogue#ema-shortages-catalogue-section
European Medicines Agency, “Guidance on Detection and Notification of Shortages of
Medicinal Products for Marketing Authorisation Holders (MAHs) in the Union (EEA),” July
1, 2019. As of July 12, 2021:
https://www.ema.europa.eu/en/documents/regulatory-procedural-guideline/guidance-
detection-notification-shortages-medicinal-products-marketing-authorisation-holders-
mahs_en.pdf
FDA—See U.S. Food and Drug Administration.
Federal Agency for Medicines and Health Products, “About PharmaStatus,” webpage, undated-a.
As of July 12, 2021:
https://pharmastatus.be/about
Federal Agency for Medicines and Health Products, “Availability of Medicines,” PharmaStatus
webpage, undated-b. As of July 12, 2021:
https://pharmastatus.be
Federal Institute for Pharmaceuticals and Medical Products, “Delivery Bottleneck Online
Portal,” webpage, undated. As of July 12, 2021:
https://lieferengpass.bfarm.de/
Federal Office for National Economic Supply, Guidelines for MAHs: Drug Platform, Berne,
Switzerland, January 2020a.
Federal Office for National Economic Supply, “Reporting Office,” webpage, updated December
18, 2020b. As of July 12, 2021:
https://www.bwl.admin.ch/bwl/en/home/themen/heilmittel/meldestelle.html

110
Fimea (Finnish Medicines Agency), “Shortages,” webpage, undated. As of July 31, 2021:
https://www.fimea.fi/web/en/databases_and_registers/shortages
Gabardi, Steven, and Teun van Gelder, “Causes and Consequences of the Worldwide Belatacept
Shortage,” Transplantation, Vol. 101, No. 7, 2017, pp. 1520–1521.
Government of Argentina, Ministry of Health, “Missing Medications,” webpage, undated. As of
July 12, 2021:
https://www.argentina.gob.ar/anmat/regulados/medicamentos/faltante
Government of Colombia, Ministry of Health, “Shortages,” webpage, undated. As of May 11,
2021:
https://www.minsalud.gov.co/salud/MT/Paginas/desabastecimiento.aspx
Government of Spain, Department of Health, Agency for Medicines and Health Products, “What
Is a Supply Problem?” webpage, undated. As of July 12, 2021:
https://cima.aemps.es/cima/publico/listadesabastecimiento.html?activos=1
Government of Uruguay, Ministry of Public Health, “Lack of Supply of Medicines,” webpage,
November 19, 2020. As of July 12, 2021:
https://www.gub.uy/tramites/comunicacion-falta-suministro-medicamentos
Gray, Andy, and Henri R. Manasse, Jr., “Shortages of Medicines: A Complex Global
Challenge,” Bulletin of the World Health Organization, Vol. 90, No. 3, March 2012, pp.
158–158.
Griffith, Milena M., Alan E. Gross, Sarah H. Sutton, Maureen K. Bolon, John S. Esterly, Jean A.
Patel, Michael J. Postelnick, Teresa R. Zembower, and Marc H. Scheetz, “The Impact of
Anti-Infective Drug Shortages on Hospitals in the United States: Trends and Causes,”
Clinical Infectious Diseases, Vol. 54, No. 5, 2012, pp. 684–691.
Hahn, Stephen M., Report on Drug Shortages for Calendar Year 2019, Washington, D.C.: U.S.
Food and Drug Administration, April 23, 2020.
Haninger, Kevin, Amber Jessup, and Kathleen Koehler, “Economic Analysis of the Causes of
Drug Shortages,” Washington, D.C.: Office of the Assistant Secretary for Planning and
Evaluation, issue brief, October 2011.
Health Products Regulatory Authority, “Medicinal Product Shortages,” webpage, undated. As of
July 12, 2021:
https://www.hpra.ie/homepage/medicines/medicines-information/medicines-shortages
Hernandez, Inmaculada, Shivani Sampathkumar, Chester B. Good, Aaron S. Kesselheim, and
William H. Shrank, “Changes in Drug Pricing After Drug Shortages in the United States,”
Annals of Internal Medicine, Vol. 170, No. 1, 2019, pp. 74–76.

111
Icelandic Medicines Agency, “Reported Drug Shortage—Summary,” webpage, undated. As of
July 12, 2021:
https://www.lyfjastofnun.is/lyf/lyfjaskortur/tilkynntur-
lyfjaskortur/#&cat=%C3%8D%20skorti
Institute for Safe Medication Practices, “Special Issue: Drug Shortages—National Survey
Reveals High Level of Frustration, Low Level of Safety,” September 3, 2010. As of July 6,
2021:
https://www.ismp.org/resources/special-issue-drug-shortages-national-survey-reveals-high-
level-frustration-low-level
Italian Medicines Agency, “Medicine Shortages and Unavailability,” webpage, undated. As of
July 12, 2021:
https://www.aifa.gov.it/en/farmaci-carenti
Jenkins, Jo, “Medicines Shortages and Patient Group Directions,” Specialist Pharmacy Service
webpage, December 2019. As of July 12, 2021:
https://www.sps.nhs.uk/articles/medicines-shortages-and-patient-group-directions/
Kaposy, Chris, “Drugs, Money, and Power: The Canadian Drug Shortage,” Journal of Bioethical
Inquiry, Vol. 11, No. 1, March 2014, pp. 85–89.
KNMP Farmanco, “Shortage Overview,” webpage, undated. As of July 12, 2021:
https://farmanco.knmp.nl
Liu, Angus, “EMA Recalls Heart Medicine Valsartan Made by Chinese Firm over Potential
Cancer-Causing Residue,” Fierce Pharma, July 9, 2018. As of July 31, 2021:
https://www.fiercepharma.com/manufacturing/ema-recalls-heart-medicine-varsaltan-made-
by-chinese-firm-over-potential-cancer
Mazer-Amirshahi, Maryann, Ali Pourmand, Steven Singer, Jesse M. Pines, and John van den
Anker, “Critical Drug Shortages: Implications for Emergency Medicine,” Academic
Emergency Medicine, Vol. 21, No. 6, 2014, pp. 704–711.
McLaughlin, Milena M., Zachary Pentoney, Erik Skoglund, and Marc H. Scheetz, “Projections
for Antiinfective Drug Shortages and Time to Actual Resolution,” American Journal of
Health-System Pharmacy, Vol. 71, No. 23, 2014, pp. 2074–2078.
National Agency for the Safety of Drugs and Health Products, “Availability of Health Products,”
webpage, undated. As of July 12, 2021:
https://ansm.sante.fr/disponibilites-des-produits-de-sante/medicaments
National Institute of Food and Medicines Surveillance, “Stockouts,” webpage, undated. As of
July 12, 2021;
https://www.invima.gov.co/es/web/guest/desabastecimientos

112
National Organization for Medicines, “Information on the Adequacy of Medicines for Human
Use,” webpage, undated. As of July 12, 2021:
https://www.eof.gr/web/guest/eparkeia
Norwegian Medicines Agency, “Notification of Shortages or Withdrawal of Medicinal Product
in Norway,” webpage, updated June 23, 2020. As of July 12, 2021:
https://legemiddelverket.no/english/regulatory-affairs/notification-of-marketing-interruption-
of-a-medicinal-product-in-norway-including-withdrawal
Novartis, “Highlights of Prescribing Information,” prescribing information, 2017. As of July 31,
2021:
https://www.accessdata.fda.gov/drugsatfda_docs/label/2017/021283s50lbl.pdf
Office of the Assistant Secretary for Planning and Evaluation, Analysis of Supply, Distribution,
Demand, and Access Issues Associated with Immune Globulin Intravenous (IGV): Final
Report, Washington, D.C., February 2007.
Office of the Assistant Secretary for Planning and Evaluation, Data Point: Update on Supply of
Immune Globulin Intravenous (IGV) Products, Washington, D.C., May 2019.
Pallone, Frank, Jr., Greg Walden, Anna G. Eshoo, Michael C. Burgess, Diana DeGette, and Brett
Guthrie, letter to Acting Commissioner of the Food and Drug Administration Norman E.
Sharpless, U.S. House of Representatives, Committee on Energy and Commerce, July 30,
2019.
Pauwels, Kim, Isabelle Huys, Minne Casteels, and Steven Simoens, “Drug Shortages in
European Countries: A Trade-Off Between Market Attractiveness and Cost Containment?”
BMC Health Services Research, Vol. 14, No. 438, 2014.
Perez, Elena E., Jordan S. Orange, Francisco Bonilla, Javier Chinen, Ivan K. Chinn, Morna
Dorsey, Yehia El-Gamal, Terry O’Harville, Elham Hossny, Bruce Mazer, Robert Nelson,
Elizabeth Secord, Stanley C. Jordan, E. Richard Stiehm, Ashley A. Vo, and Mark Ballow,
“Update on the Use of Immunoglobulin in Human Disease: A Review of Evidence,” Journal
of Allergy and Clinical Immunology, Vol. 139, No. 3S, March 2017, pp. S1–S46.
Preusker, Dennis, “Fresenius Kabi Responds to a Potential Shortage of Heparin Sodium,” news
release, July 9, 2019. As of July 31, 2021:
https://www.fresenius-kabi.com/us/news/fresenius-kabi-responds-to-a-potential-shortage-of-
heparin
Public Law 112–144, Food and Drug Administration Safety and Innovation Act, Washington,
D.C., July 9, 2012.
Public Law 117–11, Federal Food, Drug, and Cosmetic Act, Washington, D.C., April 23, 2021.

113
Ravimiamet (Estonian State Agency of Medicines), “Ravimiregister (Register of Medicinal
Products),” webpage, undated. As of July 31, 2021:
https://www.ravimiregister.ee/
Republic of Latvia, State Agency of Medicines, “Medicines Shortages Management in Latvia,”
webpage, undated. As of July 12, 2021:
https://www.zva.gov.lv/en/medicines-shortages-management-latvia
Rosenkrantz, Holly, “A Severe Shortage Hits a Drug Used for Cancer, Immune Disorders,
Epilepsy, Causing Canceled Treatments and Rationing,” Washington Post, November 4,
2019.
Schwartzberg, Eyal, Denize Ainbinder, Alla Vishkauzan, and Ronni Gamzu, “Drug Shortages in
Israel: Regulatory Perspectives, Challenges and Solutions,” Israel Journal of Health Policy
Research, Vol. 6, No. 17, 2017.
State Institute for Drug Control (Czech Republic), “List of Drugs,” webpage, undated. As of July
12, 2021:
https://prehledy.sukl.cz/mr.html
State Institute for Drug Control (Slovakia), “List of Medicinal Products for Which They Were
Issued Decisions Not to Allow the Export from Slovak Republic,” webpage, undated. As of
July 12, 2021:
https://www.sukl.sk/en/inspection/post-authorisation-quality-control/export-of-medicinal-
products/list-of-medicinal-products-for-which-they-were-issued-decisions-not-to-allow-the-
export-from-slovak-republic?page_id=4006
Swedish Medical Products Agency, “Residual Situations,” webpage, updated June 18, 2021. As
of July 12, 2021:
https://www.lakemedelsverket.se/sv/behandling-och-forskrivning/forskrivning/restsituationer
Swissmedic, “Out-of-Stock,” webpage, undated. As of July 12, 2021:
https://www.swissmedic.ch/swissmedic/en/home/humanarzneimittel/market-surveillance/out-
of-stock.html
Thomas, Katie, “U.S. Hospitals Wrestle with Shortages of Drug Supplies Made in Puerto Rico,”
New York Times, October 23, 2017.
U.S. Food and Drug Administration, “CBER-Regulated Products: Current Shortages,” webpage,
undated-a. As of July 31, 2021:
https://www.fda.gov/vaccines-blood-biologics/safety-availability-biologics/cber-regulated-
products-current-shortages
https://www.swissmedic.ch/swissmedic/en/home/humanarzneimittel/market-surveillance/out-of-stock.html
114
U.S. Food and Drug Administration, “FDA Drug Shortages: Current and Resolved Drug
Shortages and Discontinuations Reported to FDA,” webpage, undated-b. As of July 31, 2021:
https://www.accessdata.fda.gov/scripts/drugshortages/default.cfm
U.S. Food and Drug Administration, “FDA Drug Shortages Frequently Asked Questions,”
webpage, undated-c. As of July 31, 2021:
https://www.accessdata.fda.gov/scripts/drugshortages/dsp_faq.cfm
U.S. Food and Drug Administration, “Permanent Discontinuance or Interruption in
Manufacturing of Certain Drug or Biologic Products,” Federal Register, Vol. 80, No. 130,
July 8, 2015, pp. 38915–38940.
U.S. Food and Drug Administration, “FDA Approves a New Generic Valsartan,” news release,
March 12, 2019a. As of July 31, 2021:
https://www.fda.gov/news-events/press-announcements/fda-approves-new-generic-valsartan
U.S. Food and Drug Administration, “Laboratory Analysis of Valsartan Products,” webpage,
May 2, 2019b. As of July 31, 2021:
https://www.fda.gov/drugs/drug-safety-and-availability/laboratory-analysis-valsartan-
products
U.S. Food and Drug Administration, “Information About Immune Globulin (Human) Product
Shortage,” webpage, August 16, 2019c. As of July 6, 2021:
https://www.fda.gov/vaccines-blood-biologics/safety-availability-biologics/information-
about-immune-globulin-human-product-shortage
U.S. Food and Drug Administration, “FDA Updates and Press Announcements on Angiotensin II
Receptor Blocker (ARB) Recalls (Valsartan, Losartan, and Irbesartan),” webpage, November
7, 2019d. As of July 31, 2021:
https://www.fda.gov/drugs/drug-safety-and-availability/fda-updates-and-press-
announcements-angiotensin-ii-receptor-blocker-arb-recalls-valsartan-losartan
U.S. Food and Drug Administration, “Notifying FDA of a Permanent Discontinuance or
Interruption in Manufacturing Under Section 506C of the FD&C Act Guidance for Industry,”
webpage, March 27, 2020. As of July 31, 2021:
https://www.fda.gov/regulatory-information/search-fda-guidance-documents/notifying-fda-
permanent-discontinuance-or-interruption-manufacturing-under-section-506c-fdc-act
U.S. Food and Drug Administration, Drug Shortages Task Force, Drug Shortages: Root Causes
and Potential Solutions, Washington, D.C., updated February 21, 2020.
U.S. Government Accountability Office, Drug Shortages: Public Health Threat Continues,
Despite Efforts to Help Ensure Product Availability, Washington, D.C., GAO-14-194,
February 2014.

115
Vilanova, Eduardo, Ana M. F. Tovar, and Paulo A. S. Mourão, “Imminent Risk of a Global
Shortage of Heparin Caused by the African Swine Fever Afflicting the Chinese Pig Herd,”
Journal of Thrombosis and Haemostasis, Vol. 17, No. 2, 2018, pp. 254–256.
Vizient, “Drug Shortages and Labor Costs: Measuring the Hidden Costs of Drug Shortages on
U.S. Hospitals,” briefing slides, June 2019. As of July 6, 2021:
https://newsroom.vizientinc.com/sites/vha.newshq.businesswire.com/files/doc_library/file/Dr
ug_Shortages_Labor_Cost_Report_Vizient.pdf
WHO—See World Health Organization.
Wiggins, Barbara S., Jean Nappi, Christopher R. Fortier, and David J. Taber, “Cardiovascular
Drug Shortages: Predominant Etiologies, Clinical Implications, and Management Strategies,”
Annals of Pharmacotherapy, Vol. 48, No. 9, 2014, pp. 1177–1186.
Woodcock, J., and M. Wosińska, “Economic and Technological Drivers of Generic Sterile
Injectable Drug Shortages,” Clinical Pharmacology and Therapeutics, Vol. 93, No. 2,
February 2013, pp. 170–176.
World Health Organization, “Medicines Shortages: Global Approaches to Addressing Shortages
of Essential Medicines in Health Systems,” WHO Drug Information, Vol. 30, No. 2, 2016a.
World Health Organization, Meeting Report: Technical Definitions of Shortages and Stockouts
of Medicines and Vaccines, Geneva, October 5, 2016b.
World Health Organization, Addressing the Global Shortage of, and Access to, Medicines and
Vaccines, Geneva, January 2018.
Wosińska, Marta, Erin Fox, and Valerie Jensen, “Are Shortages Going Down or Not?
Interpreting Data from the FDA and the University of Utah Drug Information Service,”
Health Affairs Blog, April 8, 2015.
Yurukoglu, Ali, Eli Liebman, and David B. Ridley, “The Role of Government Reimbursement in
Drug Shortages,” American Economic Journal: Economic Policy, Vol. 9, No. 2, May 2017,
pp. 348–382.