Assessing Preparedness of Physical Transport ...sanemnet.org/conference_2017/Presentation/SEMAB...
24
Assessing Preparedness of Physical Transport Infrastructure for Regional Economic Cooperation in South Asia SANEM ANNUAL ECONOMISTS’ CONFERENCE 2017 Theme: Trade and Regional Integration SEMAB RAHMAN UNIVERSITY OF DHAKA BANGLADESH
Transcript of Assessing Preparedness of Physical Transport ...sanemnet.org/conference_2017/Presentation/SEMAB...
Assessing Preparedness of Physical Transport
Infrastructure for Regional Economic
Cooperation in South Asia
SANEM ANNUALECONOMISTS’CONFERENCE 2017
Theme: Trade and Regional Integration
SEMAB RAHMAN
UNIVERSITY OF DHAKA
BANGLADESH
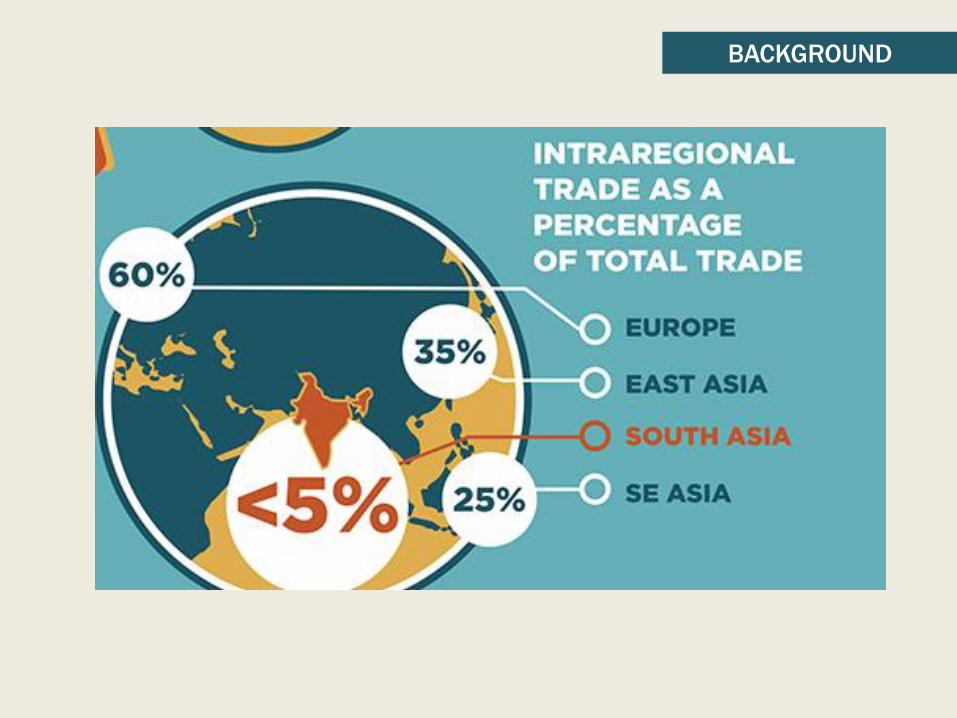
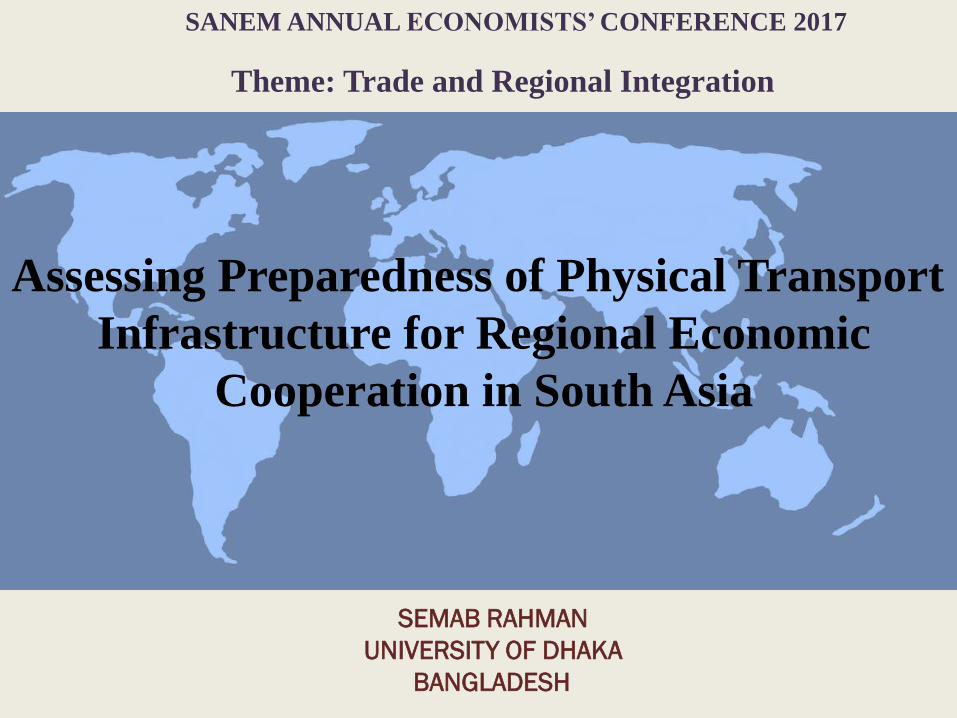
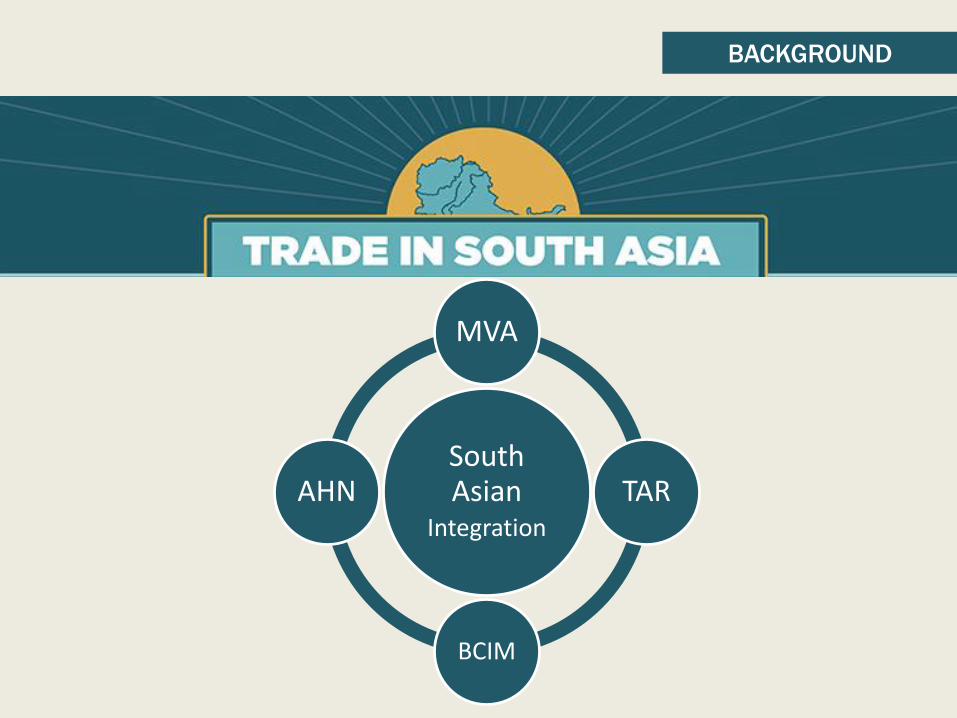
BACKGROUND
BACKGROUND
BACKGROUND
South Asian
Integration
MVA
TAR
BCIM
AHN
BACKGROUND
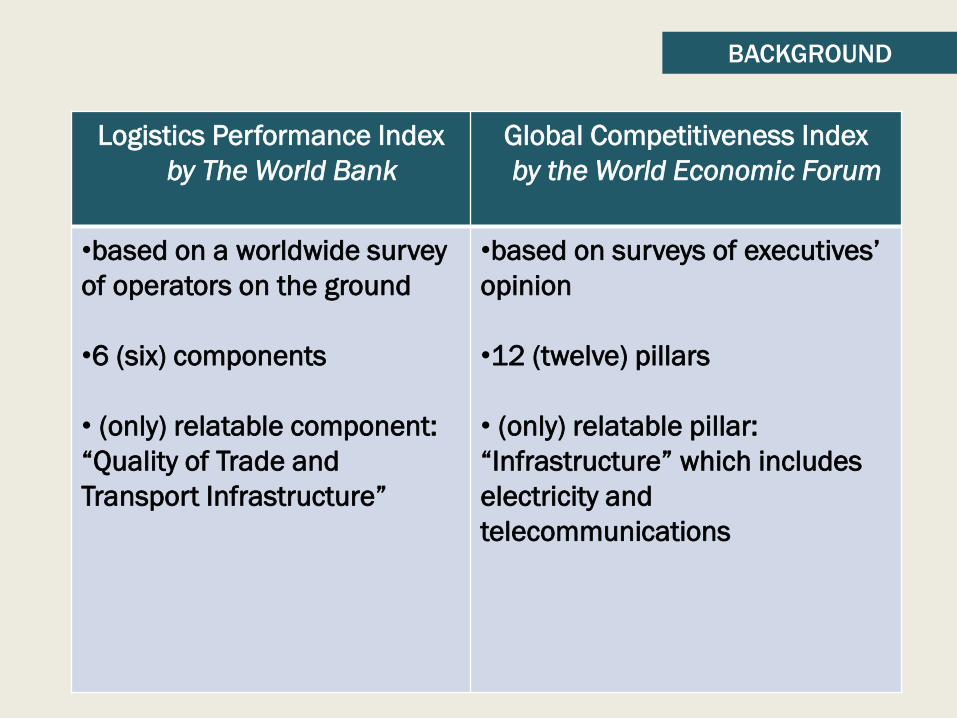
Logistics Performance Index
by The World Bank
Global Competitiveness Index
by the World Economic Forum
•based on a worldwide survey
of operators on the ground
•6 (six) components
• (only) relatable component:
“Quality of Trade and
Transport Infrastructure”
•based on surveys of executives’
opinion
•12 (twelve) pillars
• (only) relatable pillar:
“Infrastructure” which includes
electricity and
telecommunications
LITERATURE REVIEW
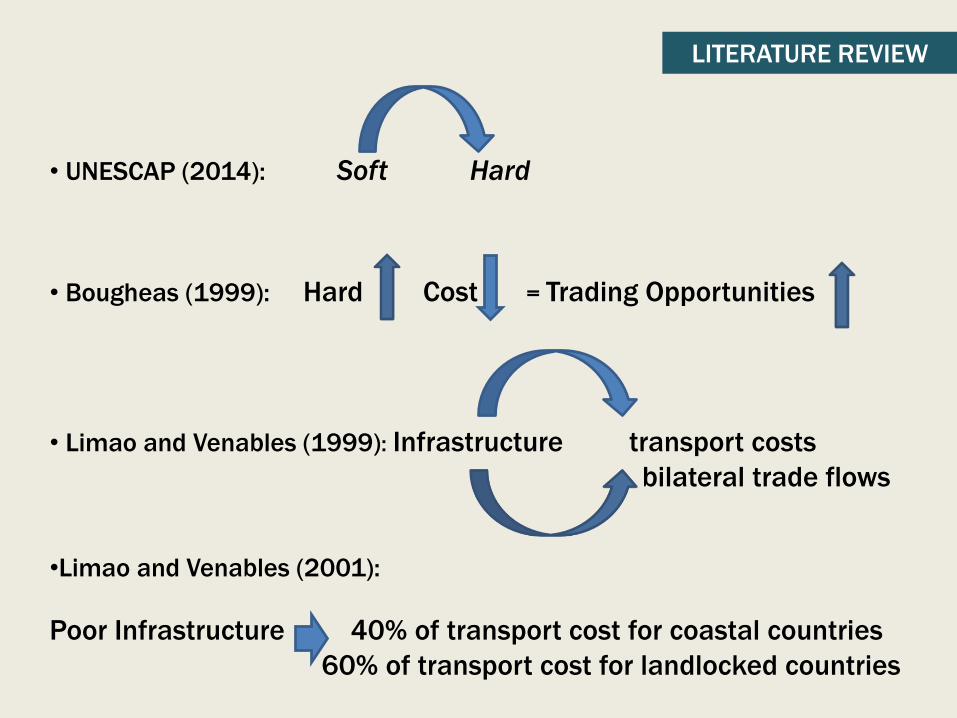
• UNESCAP (2014): Soft Hard
• Bougheas (1999): Hard Cost = Trading Opportunities
• Limao and Venables (1999): Infrastructure transport costs
bilateral trade flows
•Limao and Venables (2001):
Poor Infrastructure 40% of transport cost for coastal countries
60% of transport cost for landlocked countries

LITERATURE REVIEW
•Rahmatullah (2010):
•Prabir De (2014):
Global Value Chain Linkage Physical Infrastructure Issues
Economic Integration Soft Infrastructure Issues
Logistic Costs(As % of GDP)
13-14% 8%
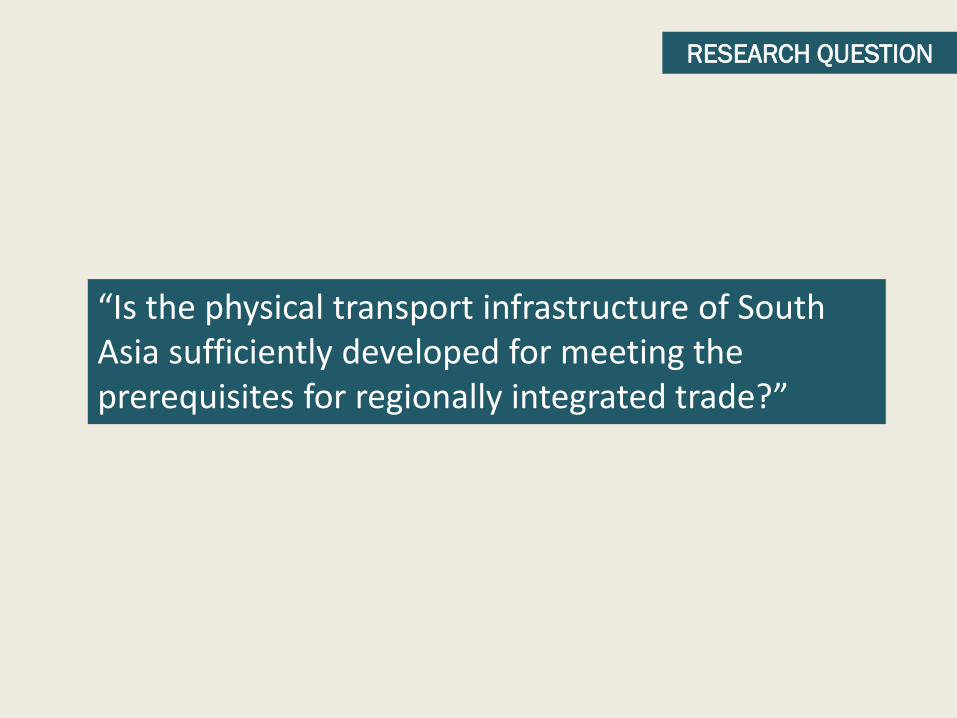
RESEARCH QUESTION
“Is the physical transport infrastructure of South Asia sufficiently developed for meeting the prerequisites for regionally integrated trade?”
METHODOLOGY
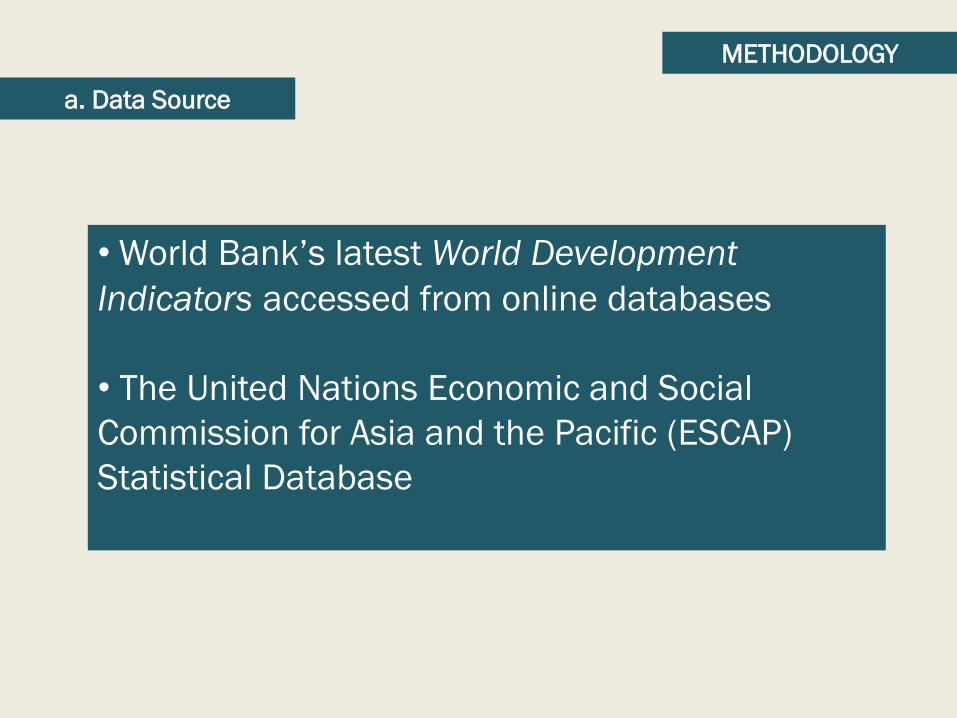
• World Bank’s latest World Development
Indicators accessed from online databases
• The United Nations Economic and Social
Commission for Asia and the Pacific (ESCAP)
Statistical Database
a. Data Source
METHODOLOGY
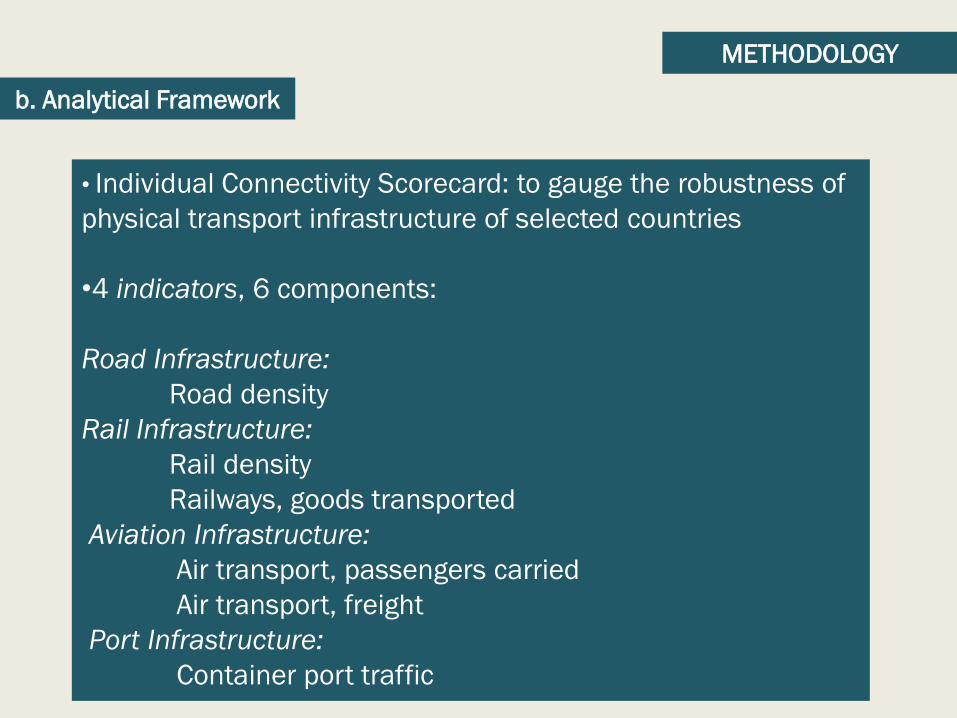
• Individual Connectivity Scorecard: to gauge the robustness of
physical transport infrastructure of selected countries
•4 indicators, 6 components:
Road Infrastructure:
Road density
Rail Infrastructure:
Rail density
Railways, goods transported
Aviation Infrastructure:
Air transport, passengers carried
Air transport, freight
Port Infrastructure:
Container port traffic
b. Analytical Framework
METHODOLOGY
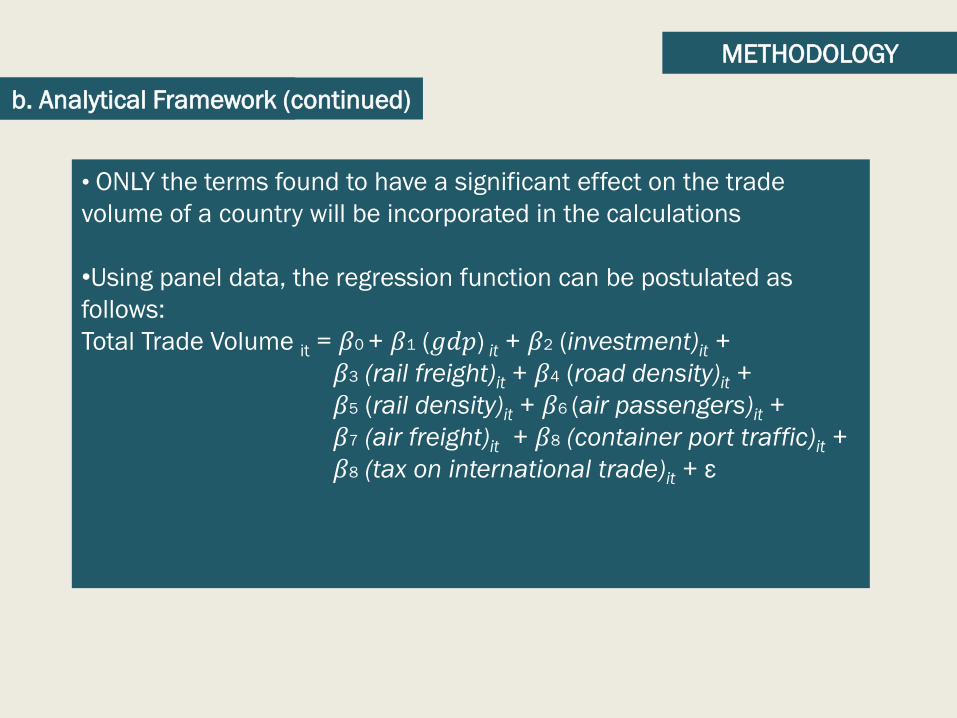
• ONLY the terms found to have a significant effect on the trade
volume of a country will be incorporated in the calculations
•Using panel data, the regression function can be postulated as
follows:
Total Trade Volume it = 𝛽0 + 𝛽1 (𝑔𝑑𝑝) it + 𝛽2 (investment)it +
𝛽3 (rail freight)it + 𝛽4 (road density)it +
𝛽5 (rail density)it + 𝛽6 (air passengers)it +
𝛽7 (air freight)it + 𝛽8 (container port traffic)it +
𝛽8 (tax on international trade)it + ε
b. Analytical Frameworkb. Analytical Framework (continued)
RESULTS
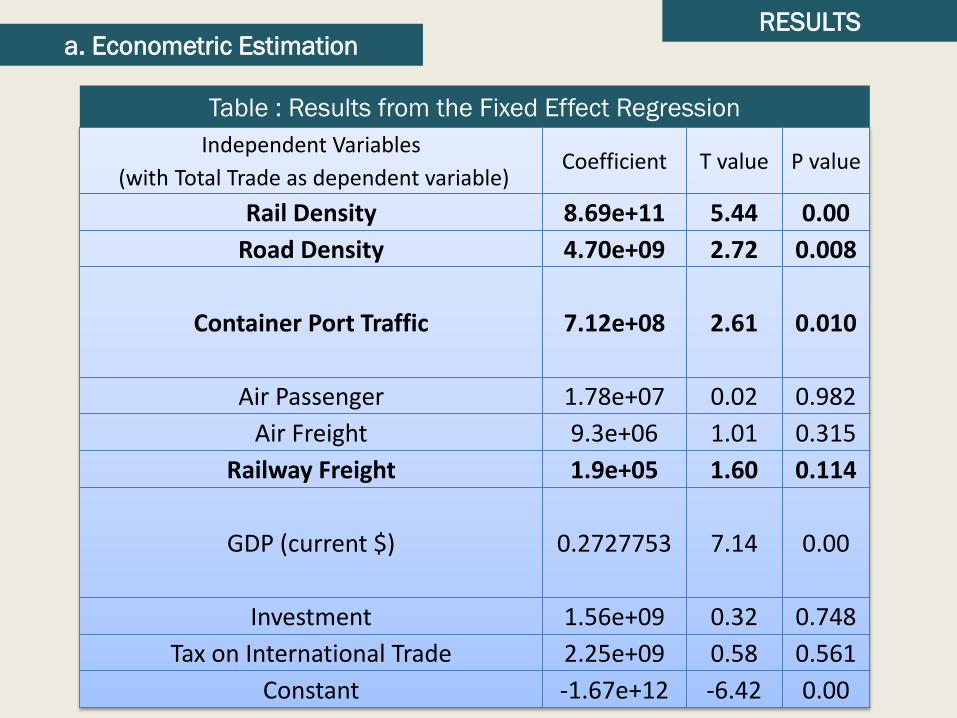
Table : Results from the Fixed Effect Regression
a. Econometric Estimation
Independent Variables
(with Total Trade as dependent variable)Coefficient T value P value
Rail Density 8.69e+11 5.44 0.00
Road Density 4.70e+09 2.72 0.008
Container Port Traffic 7.12e+08 2.61 0.010
Air Passenger 1.78e+07 0.02 0.982
Air Freight 9.3e+06 1.01 0.315
Railway Freight 1.9e+05 1.60 0.114
GDP (current $) 0.2727753 7.14 0.00
Investment 1.56e+09 0.32 0.748
Tax on International Trade 2.25e+09 0.58 0.561
Constant -1.67e+12 -6.42 0.00
RESULTS
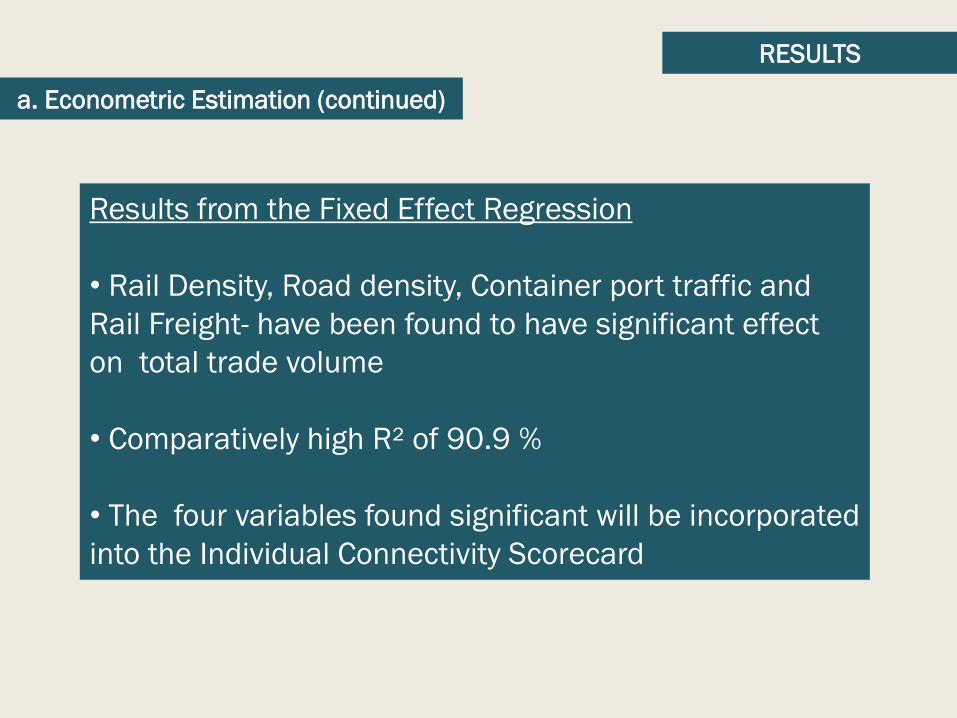
Results from the Fixed Effect Regression
• Rail Density, Road density, Container port traffic and
Rail Freight- have been found to have significant effect
on total trade volume
• Comparatively high R² of 90.9 %
• The four variables found significant will be incorporated
into the Individual Connectivity Scorecard
a. Econometric Estimation (continued)
RESULTS
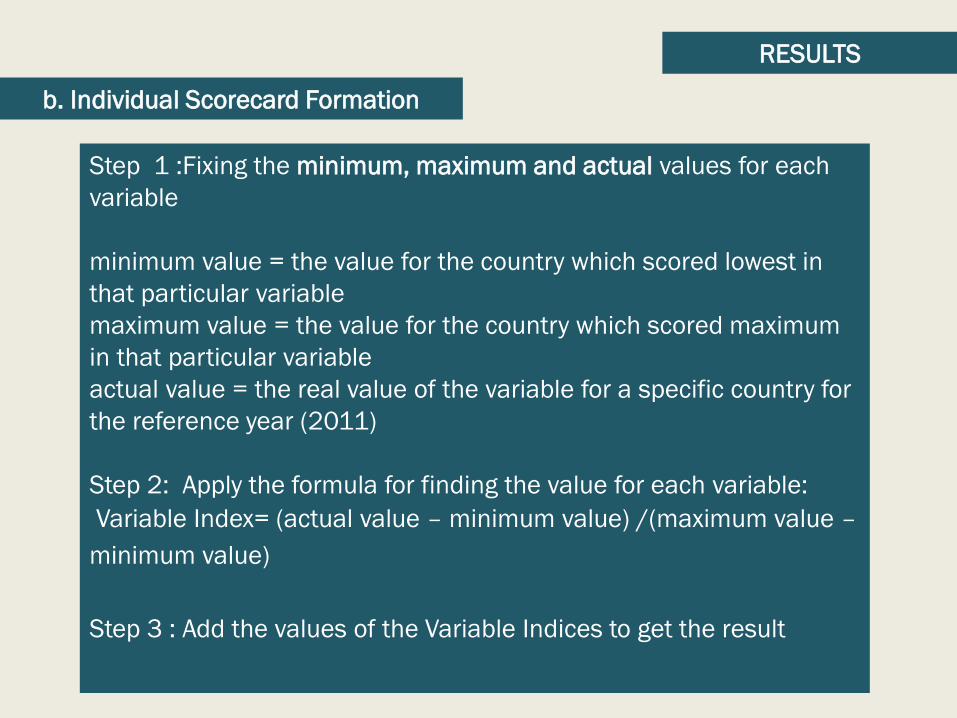
Step 1 :Fixing the minimum, maximum and actual values for each
variable
minimum value = the value for the country which scored lowest in
that particular variable
maximum value = the value for the country which scored maximum
in that particular variable
actual value = the real value of the variable for a specific country for
the reference year (2011)
Step 2: Apply the formula for finding the value for each variable:
Variable Index= (actual value – minimum value) /(maximum value –
minimum value)
Step 3 : Add the values of the Variable Indices to get the result
b. Individual Scorecard Formation
RESULTS
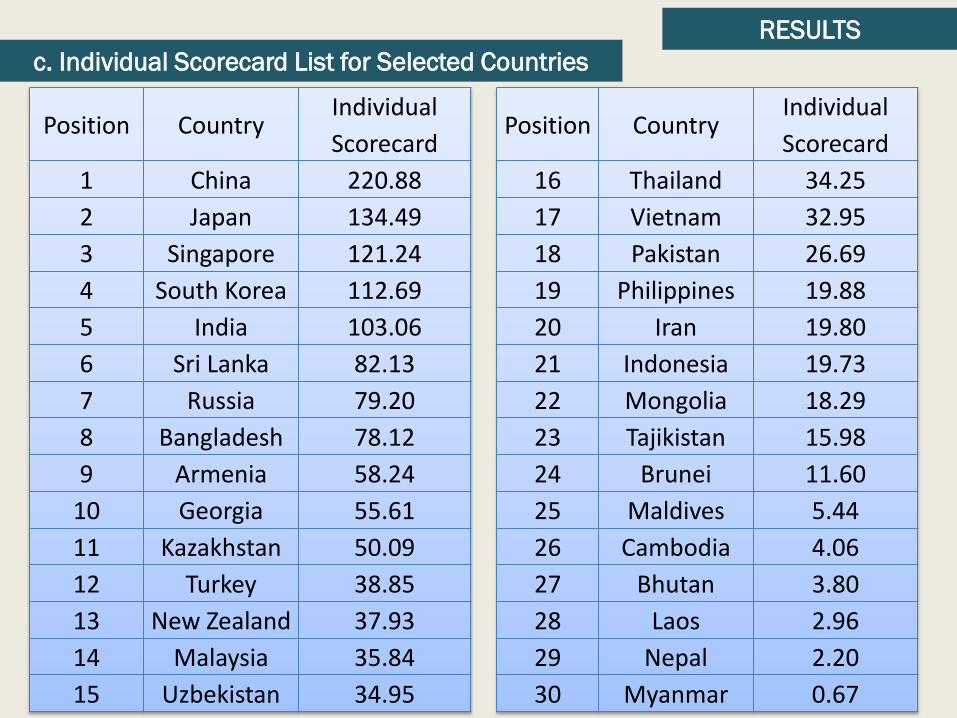
c. Individual Scorecard List for Selected Countries
Position CountryIndividual
Scorecard
1 China 220.88
2 Japan 134.49
3 Singapore 121.24
4 South Korea 112.69
5 India 103.06
6 Sri Lanka 82.13
7 Russia 79.20
8 Bangladesh 78.12
9 Armenia 58.24
10 Georgia 55.61
11 Kazakhstan 50.09
12 Turkey 38.85
13 New Zealand 37.93
14 Malaysia 35.84
15 Uzbekistan 34.95
Position CountryIndividual
Scorecard
16 Thailand 34.25
17 Vietnam 32.95
18 Pakistan 26.69
19 Philippines 19.88
20 Iran 19.80
21 Indonesia 19.73
22 Mongolia 18.29
23 Tajikistan 15.98
24 Brunei 11.60
25 Maldives 5.44
26 Cambodia 4.06
27 Bhutan 3.80
28 Laos 2.96
29 Nepal 2.20
30 Myanmar 0.67
RESULTS
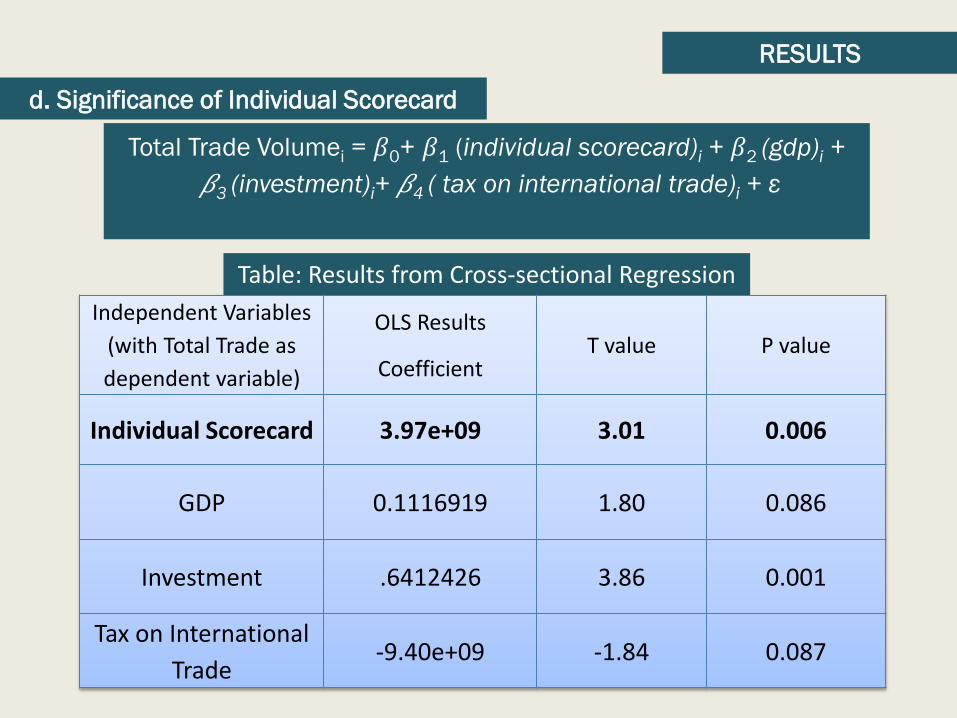
d. Significance of Individual Scorecard
Table: Results from Cross-sectional Regression
Total Trade Volumei = 𝛽0+ 𝛽1 (individual scorecard)i + 𝛽2 (gdp)i +
𝛽3 (investment)i+ 𝛽4 ( tax on international trade)i + ε
Independent Variables
(with Total Trade as
dependent variable)
OLS Results
CoefficientT value P value
Individual Scorecard 3.97e+09 3.01 0.006
GDP 0.1116919 1.80 0.086
Investment .6412426 3.86 0.001
Tax on International
Trade-9.40e+09 -1.84 0.087

RESULTS
27
8
5
25
29
18
6
(3.80)
(78.12)
(103.06)
(5.44)
(2.2)
(26.69)
(82.13)
e. Interpretation: South Asian
Countries’ Scores
RESULTS
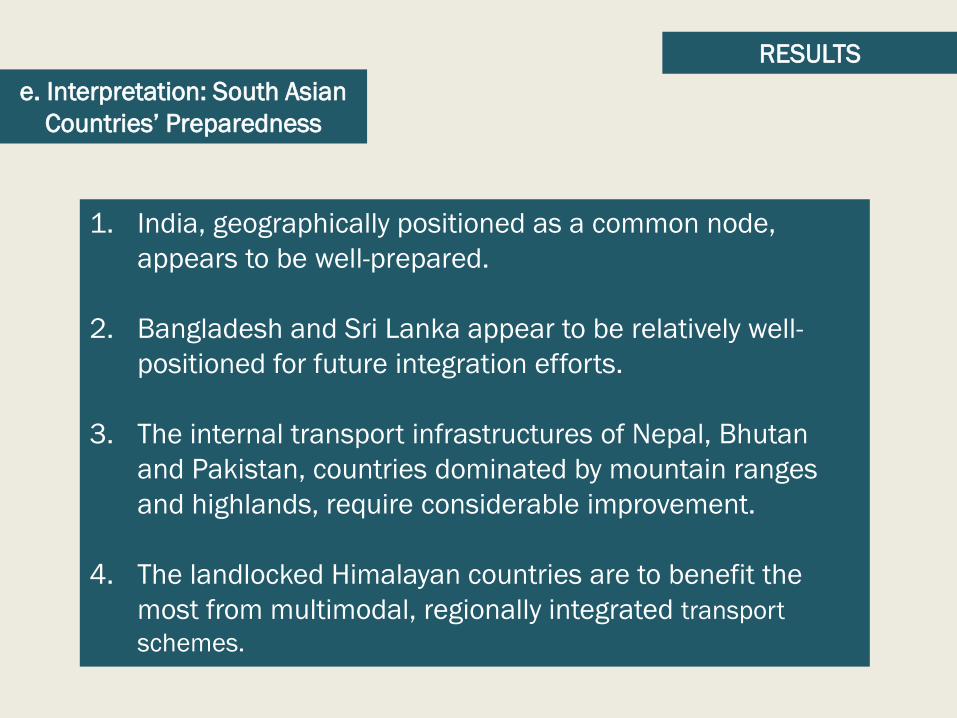
e. Interpretation: South Asian
Countries’ Preparedness
1. India, geographically positioned as a common node,
appears to be well-prepared.
2. Bangladesh and Sri Lanka appear to be relatively well-
positioned for future integration efforts.
3. The internal transport infrastructures of Nepal, Bhutan
and Pakistan, countries dominated by mountain ranges
and highlands, require considerable improvement.
4. The landlocked Himalayan countries are to benefit the
most from multimodal, regionally integrated transport
schemes.
RESULTS
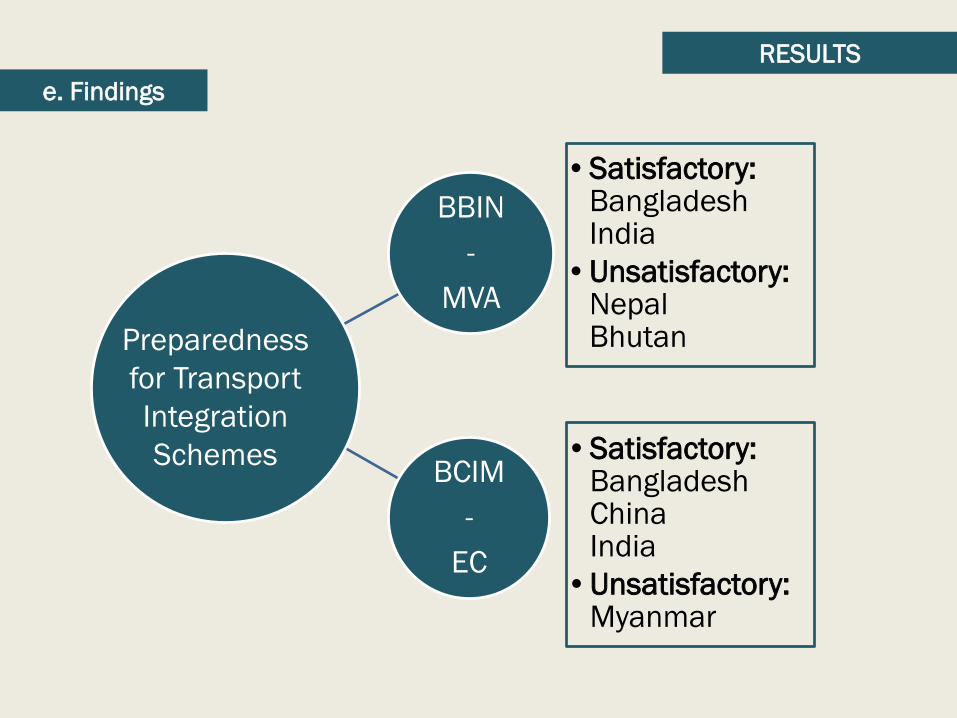
e. Findings
BBIN
-
MVA
•Satisfactory: Bangladesh India
•Unsatisfactory: Nepal Bhutan
BCIM
-
EC
•Satisfactory: Bangladesh China India
•Unsatisfactory: Myanmar
Preparedness
for Transport
Integration
Schemes
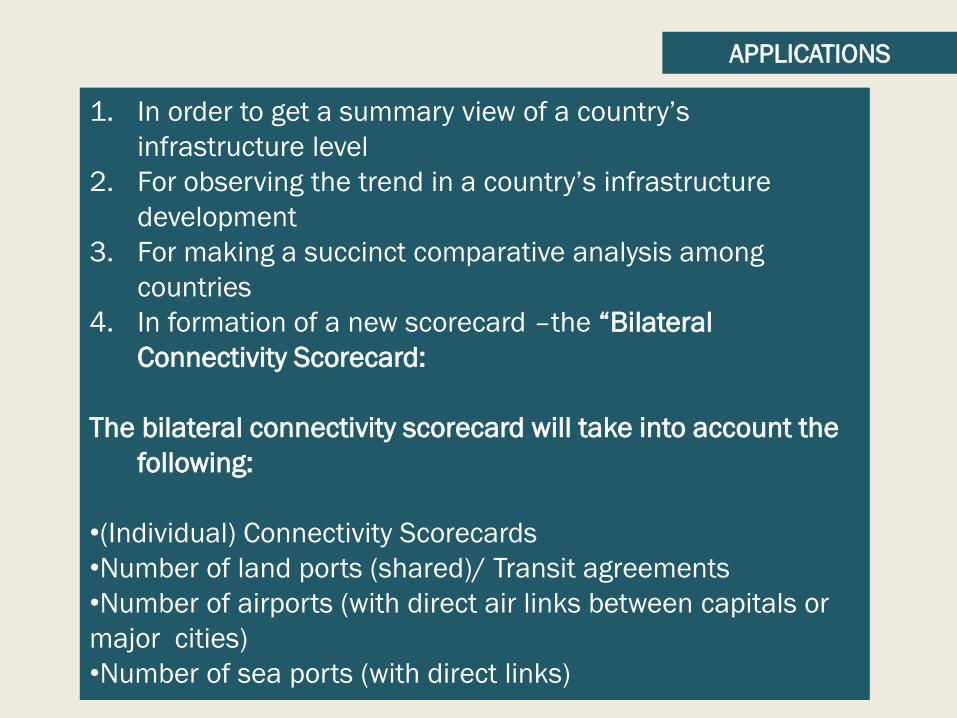
APPLICATIONS
1. In order to get a summary view of a country’s
infrastructure level
2. For observing the trend in a country’s infrastructure
development
3. For making a succinct comparative analysis among
countries
4. In formation of a new scorecard –the “Bilateral
Connectivity Scorecard:
The bilateral connectivity scorecard will take into account the
following:
•(Individual) Connectivity Scorecards
•Number of land ports (shared)/ Transit agreements
•Number of airports (with direct air links between capitals or
major cities)
•Number of sea ports (with direct links)
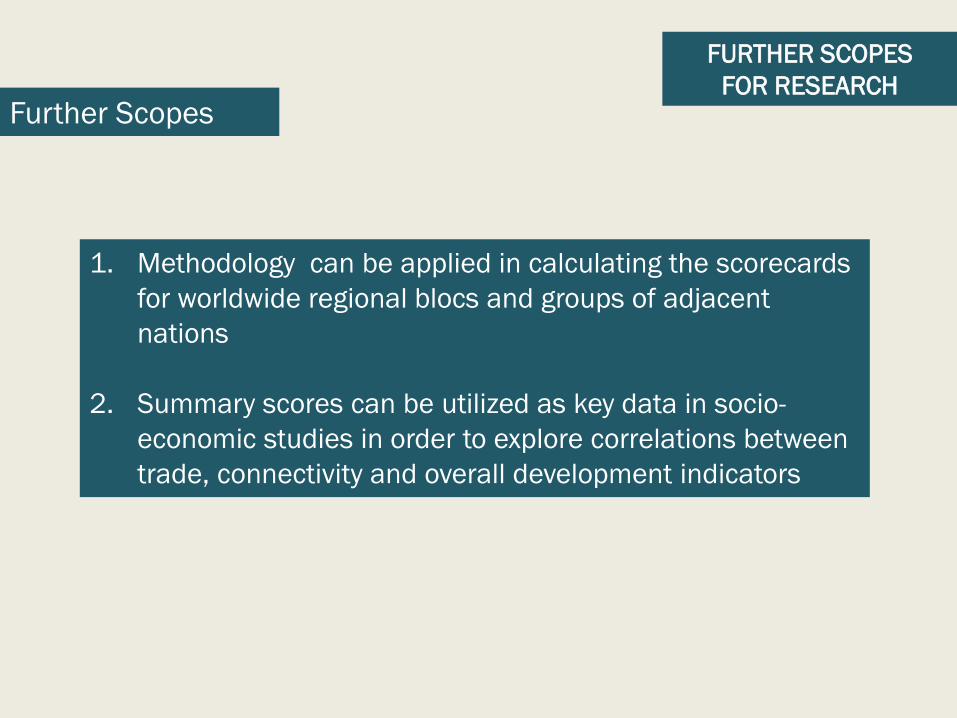
1. Methodology can be applied in calculating the scorecards
for worldwide regional blocs and groups of adjacent
nations
2. Summary scores can be utilized as key data in socio-
economic studies in order to explore correlations between
trade, connectivity and overall development indicators
Further Scopes
FURTHER SCOPES
FOR RESEARCH
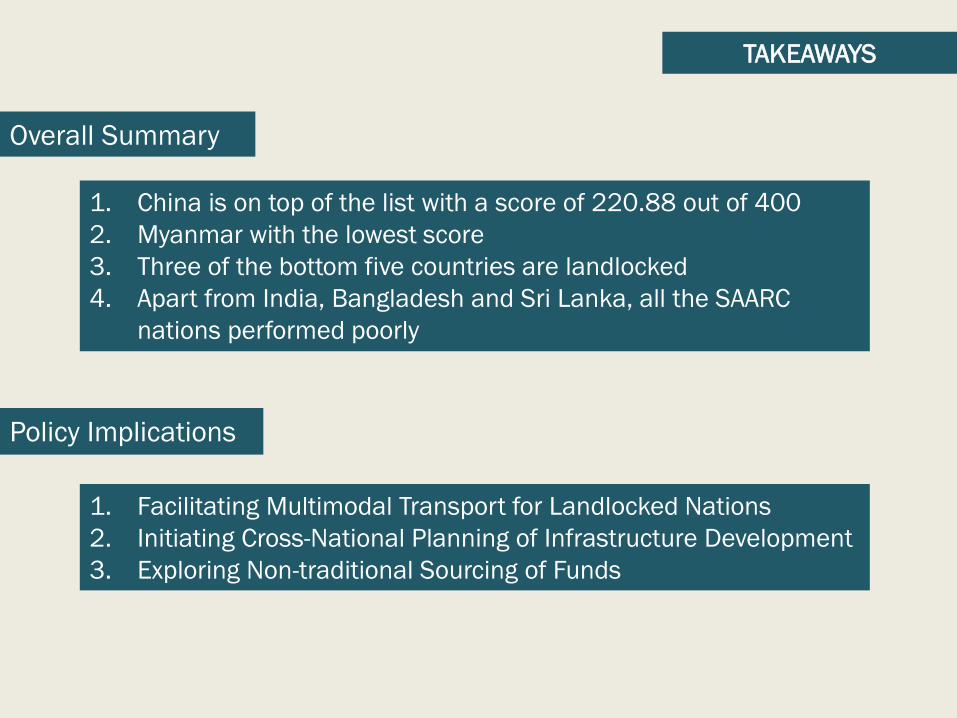
1. China is on top of the list with a score of 220.88 out of 400
2. Myanmar with the lowest score
3. Three of the bottom five countries are landlocked
4. Apart from India, Bangladesh and Sri Lanka, all the SAARC
nations performed poorly
Overall Summary
1. Facilitating Multimodal Transport for Landlocked Nations
2. Initiating Cross-National Planning of Infrastructure Development
3. Exploring Non-traditional Sourcing of Funds
Policy Implications
TAKEAWAYS

Thank You
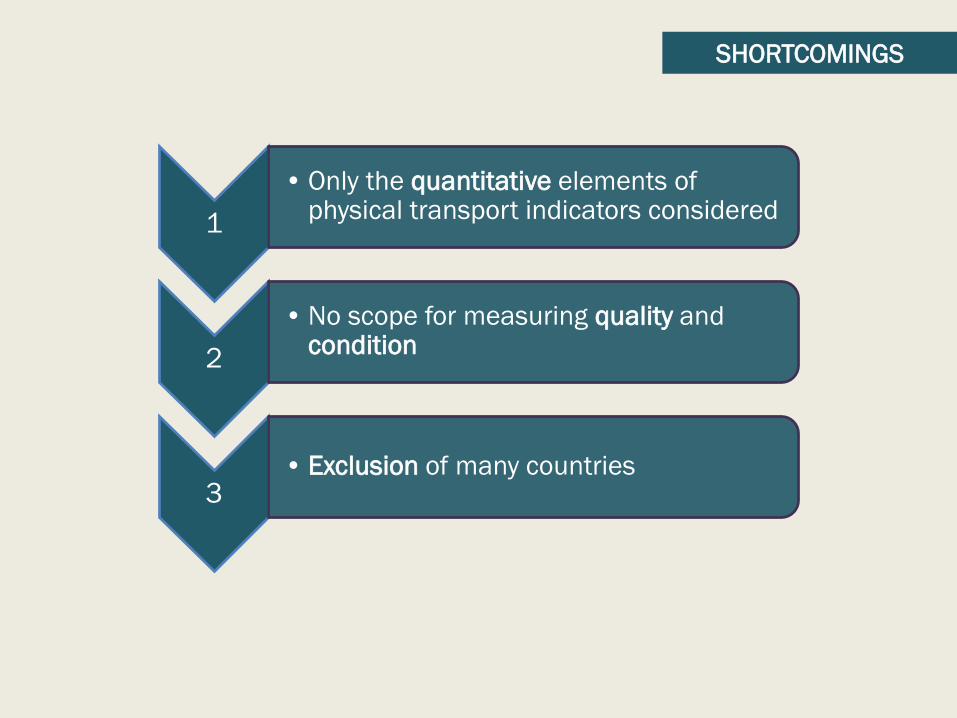
SHORTCOMINGS
1
• Only the quantitative elements of physical transport indicators considered
2
• No scope for measuring quality and condition
3• Exclusion of many countries