Assessing nanoparticle colloidal stability with single ...
12
PAPER IN FOREFRONT Assessing nanoparticle colloidal stability with single-particle inductively coupled plasma mass spectrometry (SP-ICP-MS) Nathan D. Donahue 1 & Emmy R. Francek 1 & Emi Kiyotake 1 & Emily E. Thomas 1 & Wen Yang 1 & Lin Wang 1 & Michael S. Detamore 1,2 & Stefan Wilhelm 1,2,3 Received: 18 May 2020 /Revised: 15 June 2020 /Accepted: 19 June 2020 # Springer-Verlag GmbH Germany, part of Springer Nature 2020 Abstract Biological interactions, toxicity, and environmental fate of engineered nanoparticles are affected by colloidal stability and aggregation. To assess nanoparticle aggregation, analytical methods are needed that allow quantification of individual nanopar- ticle aggregates. However, most techniques used for nanoparticle aggregation analysis are limited to ensemble measurements or require harsh sample preparation that may introduce artifacts. An ideal method would analyze aggregate size in situ with single- nanoparticle resolution. Here, we established and validated single-particle inductively coupled plasma mass spectrometry (SP- ICP-MS) as an unbiased high-throughput analytical technique to quantify nanoparticle size distributions and aggregation in situ. We induced nanoparticle aggregation by exposure to physiologically relevant saline conditions and applied SP-ICP-MS to quantify aggregate size and aggregation kinetics at the individual aggregate level. In situ SP-ICP-MS analysis revealed rational surface engineering principles for the preparation of colloidally stable nanoparticles. Our quantitative SP-ICP-MS technique is a platform technology to evaluate aggregation characteristics of various types of surface-engineered nanoparticles under physio- logically relevant conditions. Potential widespread applications of this method may include the study of nanoparticle aggregation in environmental samples and the preparation of colloidally stable nanoparticle formulations for bioanalytical assays and nanomedicine. Keywords Nanoparticle . Single-particle ICP-MS . Elemental analysis . Aggregation . Colloidal stability . Surface chemistry Introduction In contrast to their corresponding bulk materials, nanoparticles exhibit unique size-dependent optical, electric, magnetic, and biological properties that are exploited in various applications, including catalysis, display technology, energy generation and storage, and medicine [1–3]. Therefore, the effective applica- tion of nanoparticles requires precise and accurate quantifica- tion of nanoparticle size, size distributions, colloidal stability, and aggregation. Aggregation is a common nanoparticle trans- formation that changes nanoparticle size and surface chemis- try leading to alterations in cellular uptake, biodistribution, pharmacokinetics, toxicity, and overall fate [ 4 – 7 ]. Conventional analytical methods for measuring nanoparticle size and aggregation are often performed in batch mode and only provide population-averaged results. For a given nanoparticle sample, such averaged results can mask population heterogeneities (e.g., aggregation) that ulti- mately may affect the performance of nanoparticles in their respective applications. Examples of such batch analytical methods for nanoparticle size characterization include spec- troscopy techniques, light scattering, differential centrifugal sedimentation, field flow fractionation, atomic force micros- copy, and size exclusion chromatography [8–10]. While batch analytical methods are well-established and widespread, they are unable to measure individual nanoparticle and aggregate ABC Highlights: authored by Rising Stars and Top Experts. Electronic supplementary material The online version of this article (https://doi.org/10.1007/s00216-020-02783-6) contains supplementary material, which is available to authorized users. * Stefan Wilhelm [email protected] 1 Stephenson School of Biomedical Engineering, University of Oklahoma, Norman, OK 73019, USA 2 Institute for Biomedical Engineering, Science, and Technology (IBEST), Norman, OK 73019, USA 3 Stephenson Cancer Center, Oklahoma City, OK 73104, USA Analytical and Bioanalytical Chemistry https://doi.org/10.1007/s00216-020-02783-6
Transcript of Assessing nanoparticle colloidal stability with single ...

PAPER IN FOREFRONT
Assessing nanoparticle colloidal stability with single-particleinductively coupled plasma mass spectrometry (SP-ICP-MS)
Nathan D. Donahue1& Emmy R. Francek1 & Emi Kiyotake1
& Emily E. Thomas1 & Wen Yang1& Lin Wang1
&
Michael S. Detamore1,2& Stefan Wilhelm1,2,3
Received: 18 May 2020 /Revised: 15 June 2020 /Accepted: 19 June 2020# Springer-Verlag GmbH Germany, part of Springer Nature 2020
AbstractBiological interactions, toxicity, and environmental fate of engineered nanoparticles are affected by colloidal stability andaggregation. To assess nanoparticle aggregation, analytical methods are needed that allow quantification of individual nanopar-ticle aggregates. However, most techniques used for nanoparticle aggregation analysis are limited to ensemble measurements orrequire harsh sample preparation that may introduce artifacts. An ideal method would analyze aggregate size in situ with single-nanoparticle resolution. Here, we established and validated single-particle inductively coupled plasma mass spectrometry (SP-ICP-MS) as an unbiased high-throughput analytical technique to quantify nanoparticle size distributions and aggregation in situ.We induced nanoparticle aggregation by exposure to physiologically relevant saline conditions and applied SP-ICP-MS toquantify aggregate size and aggregation kinetics at the individual aggregate level. In situ SP-ICP-MS analysis revealed rationalsurface engineering principles for the preparation of colloidally stable nanoparticles. Our quantitative SP-ICP-MS technique is aplatform technology to evaluate aggregation characteristics of various types of surface-engineered nanoparticles under physio-logically relevant conditions. Potential widespread applications of this method may include the study of nanoparticle aggregationin environmental samples and the preparation of colloidally stable nanoparticle formulations for bioanalytical assays andnanomedicine.
Keywords Nanoparticle . Single-particle ICP-MS . Elemental analysis . Aggregation . Colloidal stability . Surface chemistry
Introduction
In contrast to their corresponding bulkmaterials, nanoparticlesexhibit unique size-dependent optical, electric, magnetic, andbiological properties that are exploited in various applications,including catalysis, display technology, energy generation and
storage, and medicine [1–3]. Therefore, the effective applica-tion of nanoparticles requires precise and accurate quantifica-tion of nanoparticle size, size distributions, colloidal stability,and aggregation. Aggregation is a common nanoparticle trans-formation that changes nanoparticle size and surface chemis-try leading to alterations in cellular uptake, biodistribution,pharmacokinetics, toxicity, and overall fate [4–7].Conventional analytical methods for measuring nanoparticlesize and aggregation are often performed in batch mode andonly provide population-averaged results.
For a given nanoparticle sample, such averaged results canmask population heterogeneities (e.g., aggregation) that ulti-mately may affect the performance of nanoparticles in theirrespective applications. Examples of such batch analyticalmethods for nanoparticle size characterization include spec-troscopy techniques, light scattering, differential centrifugalsedimentation, field flow fractionation, atomic force micros-copy, and size exclusion chromatography [8–10]. While batchanalytical methods are well-established and widespread, theyare unable to measure individual nanoparticle and aggregate
ABC Highlights: authored by Rising Stars and Top Experts.
Electronic supplementary material The online version of this article(https://doi.org/10.1007/s00216-020-02783-6) contains supplementarymaterial, which is available to authorized users.
* Stefan [email protected]
1 Stephenson School of Biomedical Engineering, University ofOklahoma, Norman, OK 73019, USA
2 Institute for Biomedical Engineering, Science, and Technology(IBEST), Norman, OK 73019, USA
3 Stephenson Cancer Center, Oklahoma City, OK 73104, USA
Analytical and Bioanalytical Chemistryhttps://doi.org/10.1007/s00216-020-02783-6

sizes. This limitation results in an inability to accurately assessthe true size heterogeneity for a given nanoparticle population.An ideal analytical method should rapidly and precisely pro-vide size information at the individual particle level. Severalsingle-particle resolution techniques are available and includeelectron microscopy methods, nanoparticle tracking analysis,and single-particle spectroscopy [11–13]. However, in elec-tron microscopy, colloidal nanoparticle samples are typicallyanalyzed after drying on support grids and require compleximage analysis algorithms to pinpoint clusters of nanoparticlesover multiple fields of view [14]. Meanwhile, light scatteringtechniques, such as nanoparticle tracking analysis, could po-tentially overestimate aggregate size by reporting hydrody-namic diameters and be skewed by changes in a dispersion’sviscosity, refractive index, and/or temperature [15].
One salient example of single-particle analytical techniquesthat is able to detect and quantify individual nanoparticles viaelemental analysis is single-particle inductively coupled plas-ma mass spectrometry (SP-ICP-MS) [16, 17]. In a SP-ICP-MS experiment, one nanoparticle at a time is introduced intothe ICP-MS instrument via a microfluidic system with con-trolled flow rate. Each individual nanoparticle is then atom-ized and ionized by an argon plasma, and the resulting ionplume is analyzed by a quadrupole-based mass analyzer toquantify the corresponding nanoparticle mass. This SP-ICP-MS technique has been applied to quantify a variety of nano-particle types and is being applied to quantify element con-centrations inside intact individual cells [17–19].
Our motivation for studying nanoparticle aggregation viaSP-ICP-MS is driven by the importance of evaluating nano-particle colloidal stability and how this stability can be affect-ed by nanoparticle surface engineering strategies [20–23].Understanding nanoparticle stability with single-particle reso-lution is critical for determining the environmental and bio-logical impact of nanoparticles [24–26]. Aggregation and col-loidal stability are therefore important parameters affectingnanoparticle physicochemical properties that need to be char-acterized when studying interactions between nanoparticlesand ecological and biological systems, including cells, tissues,and organs [27–29].
In the current study, we analyzed the size distributions ofvarious in-house synthesized gold nanoparticles with conven-tional batch and single-particle resolution techniques. Wedemonstrated and validated SP-ICP-MS to precisely quantifyengineered nanoparticles consisting of multiple sizes andshapes. Additionally, we applied SP-ICP-MS to quantifyengineered nanoparticle aggregation characteristics withsingle-aggregate resolution in situ. These nanoparticle aggre-gates are clusters of multiple individual nanoparticles and de-tected by the ICP-MS as a single event exhibiting a mass thatcorresponds to a single-nanoparticle mass multiplied by thenumber of nanoparticles per aggregate [30]. This approachrequires nanoparticles with narrow size distribution, and
hence narrow mass distribution, which is typically the casefor engineered nanoparticles.
Our single-particle analytical approach provides a quanti-tative tool for probing nanoparticle surface chemistries andcorresponding colloidal stability in situ under physiologicallyrelevant conditions. This reported SP-ICP-MS procedurecould be widely applied to study nanoparticle environmentalfate and to probe and establish surface engineering approachesleading to nanoparticle formulations with controlled colloidalstability to use in bioanalytical assays and nanomedicine.
Experimental section
Gold nanoparticle synthesis
For all synthesis steps, glass Erlenmeyer flasks were cleanedbefore synthesis with Aqua Regia, i.e., 3:1 (v/v) mixture ofhydrochloric acid (Sigma-Aldrich, ACS reagent, 37%, St.Louis, MO) and nitric acid (Sigma-Aldrich, ACS reagent,70%) to remove potential contaminants. Gold nanoparticles(AuNPs) with a nominal size of 16 nm were synthesized ac-cording to a previously published protocol [20]. To synthesize30- and 55-nm quasi-spherical AuNPs, a seed-mediated syn-thesis protocol developed by Perrault and Chan was adoptedusing 16-nm AuNPs as seed nanoparticles [31]. Gold nano-rods were synthesized according to previously published re-ports [32, 33]. Detailed procedures are provided in theElectronic Supplementary Material (ESM).
Nanoparticle characterization
The ZetaSizer Nano ZS (Malvern, UK) was used to measurethe z-average hydrodynamic diameter of nanoparticles basedon dynamic light scattering (DLS) and zeta potential based onelectrophoretic mobility. Transmission electron micrographs(TEM) were taken by a 200-kV field emission JEOL2010Fmicroscope (JEOL, USA) equipped with a Direct ElectronDE-12 camera (Direct Electron, USA). ImageJ (NIH) soft-ware was used to determine the diameters of AuNPs in theTEM images. An Agilent Cary 5000 UV-Vis-NIR spectro-photometer (Agilent, USA) was used to measure the visiblespectrum of AuNPs from 400 to 700 nm in 1.5-mL PMMAcuvettes.
Nanoparticle PEGylation
Surface modifications of AuNPs were performed usingHS(PEG)5kDa-methoxy (Laysan Bio, USA) and using a pre-viously reported procedure [20]. Detailed procedures are pro-vided in the ESM. The successful conjugation of differentPEG densities on the AuNPs was confirmed by DLS, zetapotential, and gel electrophoresis.
Donahue N.D. et al.
SP-ICP-MS instrument setup
All SP-ICP-MS measurements were performed using theNexION 2000 B ICP-MS (PerkinElmer, USA) fitted with acommercially available high-efficiency sample introductionsystem pictured in ESM Fig. S1. The ICP-MS instrumentwas operated using the conditions summarized in ESMTable S2. The SP-ICP-MS particle transport efficiency wasdetermined using commercially available polystyrene micro-particles (~ 3 μm in diameter) doped with Lu175 (Fluidigm,USA). A transport efficiency of 58.5 ± 3.9% was determined.With the same instrument setup,Merrifield et al. demonstratedthat transport efficiencies of polystyrene microparticles andstandard AuNPs do not statistically differ [34]. Typical trans-port efficiencies for single-particle/cell ICP-MS systems canrange between 9 and 70% [35–37]. Our system’s transportefficiency is on the higher end of the range reported in theliterature due to the high-efficiency nebulizer and spray cham-ber which minimize sample loss and ensure robust sampleintroduction to the ICP-MS. With high transport efficiency,micro-scale dwell time, no settling time, and low nebulizer gasflow, the instrument was optimized to quantify transient ionsignals from nanoparticles. Next, the mass detector was set toonly analyze Au197 signal and the ICP-MS was calibratedwith dissolved gold ion standards made from a stock solutionconsisting of 1000 μg/mL (Au) ICP single-component stan-dard in 2% HCl (high purity standards 100021-2-100, USA)via serial dilution. With our dissolved Au calibration curve,the measured pulse intensity from an ion plume was then usedto back-calculate nanoparticle mass as described by Pace et al.[38].
Nanoparticle sample preparation for SP-ICP-MS
To accurately analyze nanoparticle mass distributions withSP-ICP-MS, nanoparticle solutions were diluted to 1.66 ×10⁻¹⁶ M in nanopure water 18.2 MΩ cm from the initial con-centration determined by UV-Vis. This concentration of1.66 × 10−16 M was chosen as this is approximately 1 ×10⁵ particles mL−1, which can virtually eliminate the proba-bility of overlapping events from multiple nanoparticles dur-ing a single dwell time of 50 μs based on the Poisson distri-bution outlined by Pace et al. [39].
For making a 1:1 mixture of nanoparticles, 50μL of 1.66 ×10⁻¹⁵ M of each nanoparticle size was added to 900 μL ofnanopure water 18.2 MΩ cm and analyzed immediately onSP-ICP-MS. For gold nanorod analysis, 2 μL of the solutioncontaining citrate-coated nanorods was diluted into 10 mL ofnanopure water 18.2 MΩ cm. This diluted mixture of nano-rods was diluted again by taking 1 μL and adding that to999 μL of nanopure water and immediately analyzed on SP-ICP-MS. For measuring T0 of aggregation on SP-ICP-MS, theconcentrated nanoparticle and salt mixture were diluted to
1.66 × 10⁻¹⁶ M and analyzed immediately after salt addition.For the later time point, the concentrated nanoparticlesremained in salt and after 1 h had elapsed, the mixture wasdiluted to 1.66 × 10⁻¹⁶ M and analyzed immediately. For allnanoparticle samples, the mass detector was set to analyzeAu197 signal.
SP-ICP-MS data acquisition and analysis
All nanoparticle events were collected within 60 s. Syngistixsoftware (PerkinElmer, USA) was used in SP-ICP-MS modeto acquire single-particle elemental analysis data. Statisticalanalyses were performed with GraphPad Prism (GraphPad,USA).
Results and discussion
Nanoparticle synthesis and characterization
We synthesized three different batches of quasi-spherical cit-rate-coated colloidal AuNPs in house with nominal diametersof (i) 16 nm, (ii) 30 nm, and (iii) 55 nm, and characterizedthese AuNPs with three commonly used analytical tech-niques: (i) dynamic light scattering (DLS); (ii) UV-Vis spec-trophotometry (UV-Vis); and (iii) transmission electron mi-croscopy (TEM). Two of these methods, i.e., DLS and UV-Vis, are batch methods that analyze AuNP physicochemicaland photophysical properties for an entire ensemble of nano-particles, while TEM allows AuNP characterization at thesingle-nanoparticle level.
The nanoparticle hydrodynamic diameters obtained byDLS measurements are summarized in Fig. 1a. It is worthnoting that hydrodynamic diameters take into account nano-particle surface–bound ions and molecules as well as the layerof hydration around a nanoparticle surface. Hence, the synthe-sized 16-nm, 30-nm, and 55-nm citrate-coated AuNPs exhib-ited average hydrodynamic diameters of 18.0 ± 1.0 nm, 37.6± 2.6 nm, and 54.4 ± 3.8 nm, respectively. Our DLS resultsdemonstrate that the nanoparticle size distributions are narrow(< 10% size deviation) with polydispersity indices (PDI) be-low 0.1 indicating colloidal stability without detectable nano-particle aggregation.
Next, we used UV-Vis spectrophotometry to measure thenanoparticle size–dependent light absorption spectra of our in-house synthesized colloidal AuNPs. Observed spectra are aresult of AuNP light absorption due to the surface plasmonresonance (SPR) effect and light scattering due to the particlenature of the AuNPs [40]. Since nanoparticles with diametersbelow 100 nm were used, light absorption rather than lightscattering is the dominant factor accounting for the light ex-tinction spectra seen in Fig. 1b [41]. Compared with smallerAuNPs, larger sized AuNPs exhibited a red-shifted light
Assessing nanoparticle colloidal stability with single-particle inductively coupled plasma mass...

absorption peak with λmax 518 nm for 16-nm AuNPs, λmax
526 nm for 30-nm AuNPs, and λmax 532 nm for 55-nmAuNPs (Fig. 1b). This observation can be explained by nano-particle size–dependent changes in SPR frequencies [42]. Theobtained UV-Vis spectra corroborated our DLS experimentsto further confirm the colloidal stability and narrow size dis-tribution of our synthesized AuNPs. Despite the limitationsassociated with ensemble light-based techniques, DLS andUV-Vis provide rapid quantitative and qualitative informationon nanoparticle size and colloidal stability.
Since DLS and UV-Vis spectrophotometry methods do notprovide single-particle resolution, we used TEM to measureindividual nanoparticles (Fig. 1c). Quantitative image analysisof TEMmicrographs revealed average sizes of AuNPs of 16.3± 1.2 nm (16-nm sample), 30.6 ± 5.4 nm (30-nm sample), and52.2 ± 9.1 nm (55-nm sample). The corresponding size distri-bution histograms are shown in Fig. 1 d–f. The TEM charac-terization studies confirmed our results obtained by DLS andUV-Vis methods and demonstrated that our in-house synthe-sized AuNPs were monodisperse without detectable nanoparti-cle aggregation. Although TEM provides direct images ofAuNPs, it requires harsh conditions (i.e., sample drying onTEM grids, high vacuum conditions) and post-image analysis,which prevent high-throughput in situ characterization.
SP-ICP-MS of quasi-spherical nanoparticles
Next, we performed SP-ICP-MS on all three citrate-coatedAuNP colloidal samples using a PerkinElmer NexION 2000ICP-MS. The SP-ICP-MS method is an elemental analysistechnique that allows mass quantification of individual
nanoparticles, one nanoparticle at a time. To prepare theAuNP samples for SP-ICP-MS analysis, we quantified thecorresponding nanoparticle molar concentrations of AuNPstock dispersions by UV-Vis spectrophotometry using thenanoparticle size–dependent molar decadic extinction coeffi-cients listed in Table S1. We then diluted the AuNPs to ananoparticle concentration of 1.66 × 10⁻¹⁶ M (1.0 ×10⁵ AuNPs mL−1) in nanopure water. To analyze individualAuNPs, the ICP-MS was set up and calibrated according tothe parameters listed in Fig. S1 and Table S2 (see ESM).
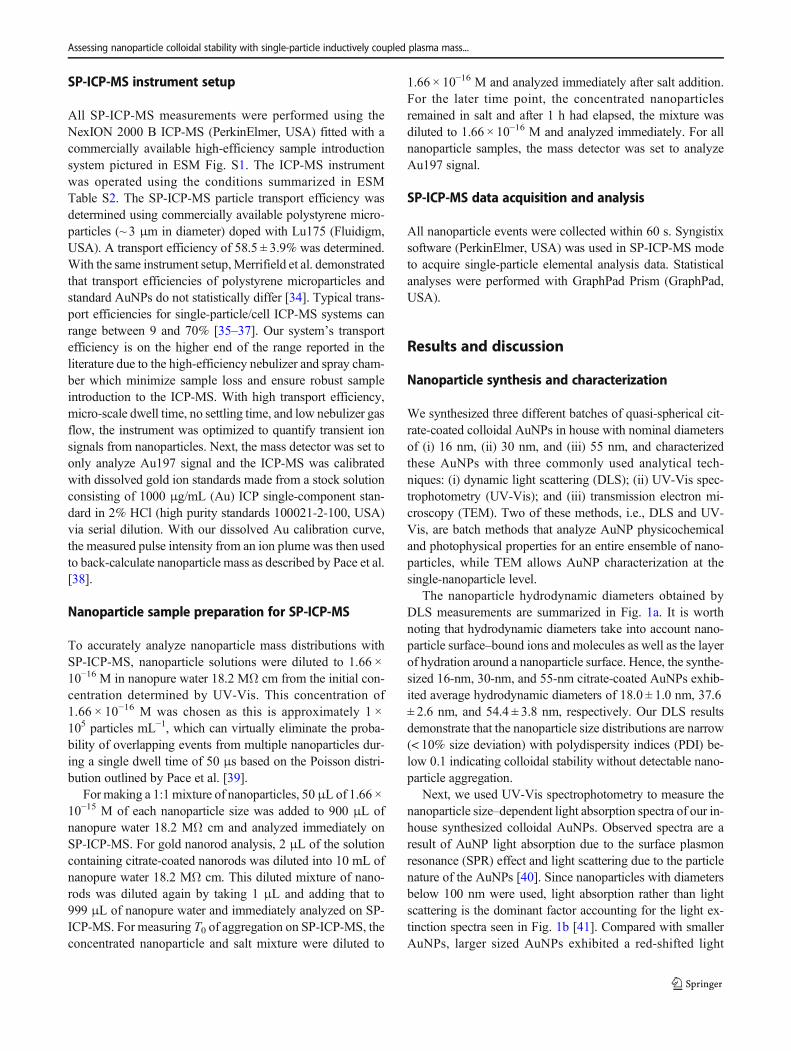
Individual AuNPs were introduced into the ICP-MS by acommercially available microfluidics autosampler connectedto a high-efficiency nebulizer and spray chamber for efficientaerosol generation of the aqueous nanoparticle dispersions(ESM Fig. S1). Individual AuNPs then pass through the argonplasma and become atomized and ionized, resulting in a tran-sient gold ion plume that is analyzed by a quadrupole massanalyzer and detected with microsecond dwell times, whichenables precise quantification of nanoparticle size [43]. Theintensities of the detected gold ion plumes correspond to in-dividual AuNP masses that were then displayed as mass his-tograms (Fig. 2a–c).
Based on our TEM imaging results (Fig. 1c), we approxi-mated the shape of our in-house synthesized AuNPs to bespherical. This approximation allowed us to estimate the di-ameter of an individual AuNP by converting the reported SP-ICP-MS AuNP mass according to Eq. 1:
d nm½ � ¼ffiffiffiffiffiffiffiffiffiffiffiffiffiffiffiffiffiffiffiffiffiffiffi
6 �MassNP
π � ρ3
s
ð1Þ
Fig. 1 Nanoparticle characterization of three different batches of citrate-coated AuNPs. a Hydrodynamic diameters as obtained by DLS. Barsrepresent mean values and standard deviation (n = 3). b UV-Visspectrophotometry spectra. c Transmission electron micrographs. Scale
bars indicate 50 nm, 100 nm, and 200 nm, respectively (top to bottom).d–f Nanoparticle size distribution histograms based on TEM imageanalysis using ImageJ. The AuNP distributions (black lines) were fittedusing a Gaussian distribution in GraphPad Prism
Donahue N.D. et al.

with MassNP as the reported SP-ICP-MS mass in [g] unit of asingle individual AuNP, and ⍴ is the density of gold (19.3 g/cm3). The obtained SP-ICP-MS-based AuNP size distributionhistograms are shown in Fig. 2 d–f.
The SP-ICP-MS method accurately determined the size distri-butions of the three different colloidal AuNP batches that we syn-thesized in house at a rate of ≥ 200 particles/min. Interestingly,with the SP-ICP-MS technique, we were able to quantifyAuNPs with masses as small as 20 ag (corresponding to sphericalnanoparticles with ~ 13 nm in diameter) which closely resemblesthe limits of detectionmentioned in other SP-ICP-MS reports [44].When compared with conventional nanoparticle characterizationtechniques, such as DLS, UV-Vis, and TEM (Fig. 2), SP-ICP-MSyielded overall comparable results. Table 1 provides a succincthead-to-head comparison of the results obtained from DLS,TEM, and SP-ICP-MS. All three methods provide similar nano-particle mean diameters and standard deviations of analyzedAuNPs batches (Table 1). These results validated SP-ICP-MS asa high-throughput, accurate, in situ quantitative analytical methodto determine the size distribution of individual AuNPs.
SP-ICP-MS of nanoparticle mixtures
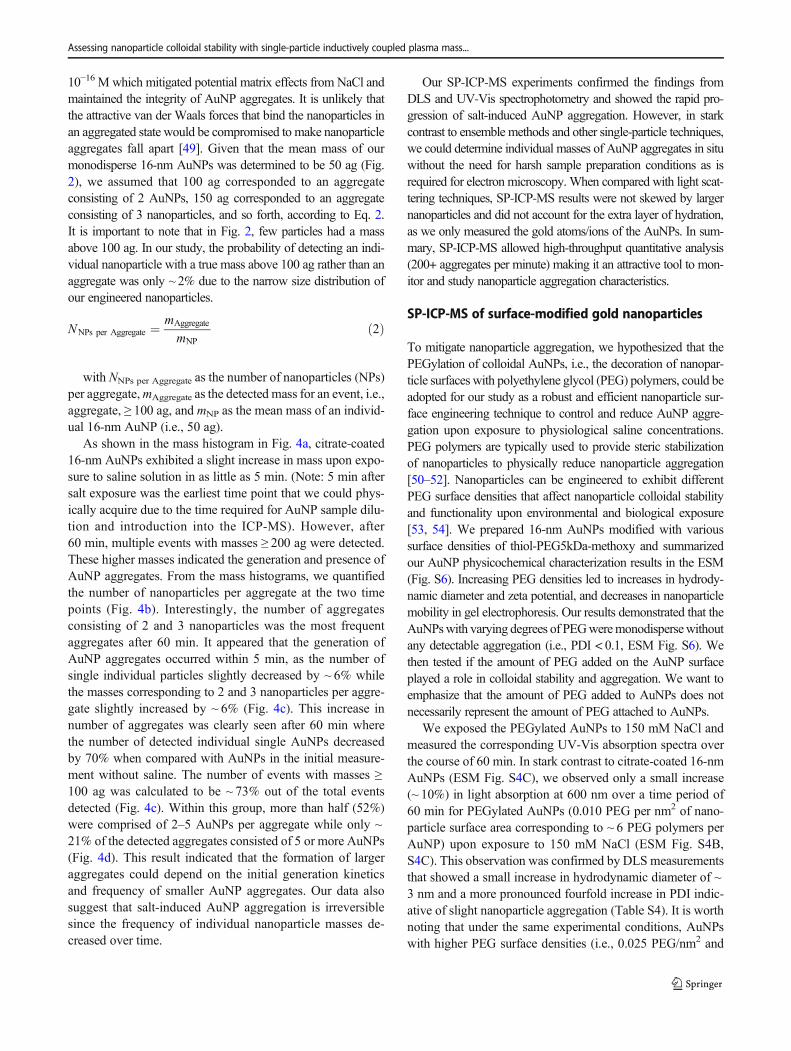
After successfully determining the mass and size distributionsof AuNPs with different sizes, we used SP-ICP-MS to differ-entiate between nanoparticles of different sizes in mixtures.We prepared a 1:1 mixture of in-house synthesized sphericalcitrate-coated 30-nm and 55-nm AuNPs.We analyzed this 1:1nanoparticle mixture with SP-ICP-MS and observed twoclearly separated nanoparticle populations in the SP-ICP-MSmass distribution histogram as well as the corresponding cal-culated size distribution histogram (Fig. 3). From the SP-ICP-MS analysis results of the 1:1 AuNP mixture, the 30-nm and55-nm AuNP mean diameters were calculated to be 30.8 nmand 57.9 nm, respectively. In addition, SP-ICP-MS also accu-rately determined that the AuNP mixture was indeed madefrom a 1:1 mixture of 30-nm and 55-nm AuNPs with 268particles determined as 30-nm AuNPs and 234 particles deter-mined as 55-nm AuNPs. This result indicated AuNP recoveryof ~ 90% from the original 1:1 mixture. We also confirmedthat the mean diameters and standard deviations of the AuNPs
Fig. 2 Nanoparticle size characterization based on SP-ICP-MS. Panelsa–c show SP-ICP-MS mass histograms for 16-nm AuNPs (a), 30-nmAuNPs (b), and 55-nm AuNPs (c). In panels d–f, the masses of a–c
histograms are converted into corresponding nanoparticle diameters.The AuNP distributions (black lines) were fitted using a Gaussiandistribution in GraphPad Prism
Table 1 Comparison of nanoparticle measurements
Sample Hydrodynamicdiameter (nm)
Nanoparticle corediameter (nm)
Mean nanoparticlemass (ag)
Calculatednanoparticlediameter (nm)
16-nmAuNPs 18.0 ± 1.0 16.3 ± 1.2 53.2 ± 16.0 17.2 ± 1.7
30-nmAuNPs 37.6 ± 2.6 30.6 ± 5.4 290.7 ± 164.4 29.7 ± 5.5
55-nmAuNPs 54.4 ± 3.8 52.2 ± 9.1 1952.1 ± 643.6 57.1 ± 6.1
Diameters and masses are provided as mean values ± standard deviation
Assessing nanoparticle colloidal stability with single-particle inductively coupled plasma mass...

measured in the mixture were not different from the AuNPmeasurement results reported in Table 1 for pure, unmixedAuNP samples. As shown in ESM Fig. S2, the nanoparticlediameters calculated from the SP-ICP-MS analysis of the 1:1AuNP mixture were not statistically significantly different(p < 0.01) compared with the pure, unmixed AuNPs. Our re-sults confirmed that SP-ICP-MS can simultaneously and pre-cisely measure AuNP mass distributions of multiple nanopar-ticle subpopulations for a given nanoparticle mixture andpoints to the possibility of analyzing complex nanoparticlemixtures with single-particle resolution.
SP-ICP-MS of nanorods
Next, we wondered whether SP-ICP-MS could be usedfor the quantitative analysis of non-spherical nanoparticlesthat exhibit an aspect ratio. As a model nanoparticle sys-tem, we synthesized citrate-capped gold nanorods inhouse. We analyzed the size distribution of the synthe-sized gold nanorods with TEM and quantified lengthand width of individual gold nanorods from correspond-ing micrographs with ImageJ. The average lengths andwidths of the gold nanorods were 63.5 nm and 9.0 nm,respectively (ESM Fig. S3). Based on the TEM micro-graphs, we assumed a cylindrical geometry of the goldnanorods and estimated the average nanoparticle mass tobe ~ 313 ag using Equations S1 and S2 (see ESM). Wethen used SP-ICP-MS to characterize individual goldnanorods from diluted aqueous dispersions. Our SP-ICP-MS analysis revealed an average nanoparticle mass of ~319 ag (ESM Fig. S3), which is in close agreement withthe estimated mass after TEM analysis (ESM Fig. S3).Our results corroborate previous reports that SP-ICP-MSis not limited to nanoparticles with a spherical shape, butcan additionally be used to accurately determine mass,and hence size distributions, of non-spherical and aniso-tropic nanoparticles [45, 46].
SP-ICP-MS of nanoparticle aggregates
Since SP-ICP-MS was able to determine nanoparticle mass inmixtures and of different sizes, we determined whether we couldquantify aggregation of our colloidal nanoparticles with single-particle (i.e., single aggregate) resolution using SP-ICP-MS. Wedefined aggregation as an irreversible process that results innanoparticle clusters of two or more individual nanoparticles.To generate aggregates of AuNPs, we exposed citrate-coated16-nm AuNP model nanoparticles with narrow size distributionto physiologically relevant saline concentrations (~ 150 mMNaCl). Upon exposure to high ionic strength conditions, electro-statically stabilized citrate-coated AuNPs experience substantialscreening of their overall negative surface charges [47]. The pro-cess of ionic strength–mediated surface charge screening causescolloidal citrate-coated AuNPs to irreversibly aggregate [48].Aggregation of AuNPs results in a visible color change fromred to blue. Using UV-Vis spectrophotometry, we monitoredaggregation kinetics of citrate-coated 16-nm AuNPs exposed to150 mMNaCl over a time period of 60 min (ESM Fig. S4). Theobserved increase in AuNP light absorption around 600 nm overtime (~ 110% change after 60 min, ESM Fig. S4) is due tosurface plasmon resonance (SPR) frequency changes as a resultof AuNP aggregation. Additional DLSmeasurements confirmedthe observed nanoparticle aggregation behavior with increases inhydrodynamic diameter and PDI and verified our UV-Vis spec-trophotometry results (Table S4). We further performed TEM tovisualize the aggregation of citrate-coated 16-nm AuNPs uponaddition of 150 mM NaCl (ESM Fig. S5).
After establishing the aggregation characteristics and kineticsof citrate-coated 16-nm AuNPs with UV-Vis spectrophotometryand DLS batch methods, we quantified the corresponding aggre-gation states with SP-ICP-MS at the individual aggregate level.First, AuNP aggregates were formed under the same conditionsused for UV-Vis and DLS analysis. Immediately prior to SP-ICP-MS analysis, AuNPs in the NaCl solution were diluted withnanopure water to obtain an AuNP concentration of 1.66 ×
Fig. 3 SP-ICP-MS analysis of 1:1 mixture of AuNPs. aMass histogramof 1:1 mixtures of 30-nm (blue population) and 55-nm (green population)AuNPs obtained by SP-ICP-MS. b Mass histogram from panel a isconverted into diameter histogram. The total number of AuNPsanalyzed was 502, with 268 particles determined as 30-nm AuNPs
(blue) and 234 particles determined as 55-nm (green) AuNPs by SP-ICP-MS. The AuNP distributions (black lines) were fitted using aGaussian distribution in GraphPad Prism. The AuNP distributions werestatistically significantly different based on an unpaired T test (t = 52.28,df = 500, p < 0.0001)
Donahue N.D. et al.
10−16 M which mitigated potential matrix effects from NaCl andmaintained the integrity of AuNP aggregates. It is unlikely thatthe attractive van der Waals forces that bind the nanoparticles inan aggregated state would be compromised to make nanoparticleaggregates fall apart [49]. Given that the mean mass of ourmonodisperse 16-nm AuNPs was determined to be 50 ag (Fig.2), we assumed that 100 ag corresponded to an aggregateconsisting of 2 AuNPs, 150 ag corresponded to an aggregateconsisting of 3 nanoparticles, and so forth, according to Eq. 2.It is important to note that in Fig. 2, few particles had a massabove 100 ag. In our study, the probability of detecting an indi-vidual nanoparticle with a true mass above 100 ag rather than anaggregate was only ~ 2% due to the narrow size distribution ofour engineered nanoparticles.
NNPs per Aggregate ¼ mAggregate
mNPð2Þ
with NNPs per Aggregate as the number of nanoparticles (NPs)per aggregate,mAggregate as the detected mass for an event, i.e.,aggregate, ≥ 100 ag, and mNP as the mean mass of an individ-ual 16-nm AuNP (i.e., 50 ag).
As shown in the mass histogram in Fig. 4a, citrate-coated16-nm AuNPs exhibited a slight increase in mass upon expo-sure to saline solution in as little as 5 min. (Note: 5 min aftersalt exposure was the earliest time point that we could phys-ically acquire due to the time required for AuNP sample dilu-tion and introduction into the ICP-MS). However, after60 min, multiple events with masses ≥ 200 ag were detected.These higher masses indicated the generation and presence ofAuNP aggregates. From the mass histograms, we quantifiedthe number of nanoparticles per aggregate at the two timepoints (Fig. 4b). Interestingly, the number of aggregatesconsisting of 2 and 3 nanoparticles was the most frequentaggregates after 60 min. It appeared that the generation ofAuNP aggregates occurred within 5 min, as the number ofsingle individual particles slightly decreased by ~ 6% whilethe masses corresponding to 2 and 3 nanoparticles per aggre-gate slightly increased by ~ 6% (Fig. 4c). This increase innumber of aggregates was clearly seen after 60 min wherethe number of detected individual single AuNPs decreasedby 70% when compared with AuNPs in the initial measure-ment without saline. The number of events with masses ≥100 ag was calculated to be ~ 73% out of the total eventsdetected (Fig. 4c). Within this group, more than half (52%)were comprised of 2–5 AuNPs per aggregate while only ~21% of the detected aggregates consisted of 5 or more AuNPs(Fig. 4d). This result indicated that the formation of largeraggregates could depend on the initial generation kineticsand frequency of smaller AuNP aggregates. Our data alsosuggest that salt-induced AuNP aggregation is irreversiblesince the frequency of individual nanoparticle masses de-creased over time.
Our SP-ICP-MS experiments confirmed the findings fromDLS and UV-Vis spectrophotometry and showed the rapid pro-gression of salt-induced AuNP aggregation. However, in starkcontrast to ensemble methods and other single-particle techniques,we could determine individual masses of AuNP aggregates in situwithout the need for harsh sample preparation conditions as isrequired for electron microscopy.When compared with light scat-tering techniques, SP-ICP-MS results were not skewed by largernanoparticles and did not account for the extra layer of hydration,as we only measured the gold atoms/ions of the AuNPs. In sum-mary, SP-ICP-MS allowed high-throughput quantitative analysis(200+ aggregates per minute) making it an attractive tool to mon-itor and study nanoparticle aggregation characteristics.
SP-ICP-MS of surface-modified gold nanoparticles
To mitigate nanoparticle aggregation, we hypothesized that thePEGylation of colloidal AuNPs, i.e., the decoration of nanopar-ticle surfaces with polyethylene glycol (PEG) polymers, could beadopted for our study as a robust and efficient nanoparticle sur-face engineering technique to control and reduce AuNP aggre-gation upon exposure to physiological saline concentrations.PEG polymers are typically used to provide steric stabilizationof nanoparticles to physically reduce nanoparticle aggregation[50–52]. Nanoparticles can be engineered to exhibit differentPEG surface densities that affect nanoparticle colloidal stabilityand functionality upon environmental and biological exposure[53, 54]. We prepared 16-nm AuNPs modified with varioussurface densities of thiol-PEG5kDa-methoxy and summarizedour AuNP physicochemical characterization results in the ESM(Fig. S6). Increasing PEG densities led to increases in hydrody-namic diameter and zeta potential, and decreases in nanoparticlemobility in gel electrophoresis. Our results demonstrated that theAuNPswith varying degrees of PEGweremonodispersewithoutany detectable aggregation (i.e., PDI < 0.1, ESM Fig. S6). Wethen tested if the amount of PEG added on the AuNP surfaceplayed a role in colloidal stability and aggregation. We want toemphasize that the amount of PEG added to AuNPs does notnecessarily represent the amount of PEG attached to AuNPs.
We exposed the PEGylated AuNPs to 150 mM NaCl andmeasured the corresponding UV-Vis absorption spectra overthe course of 60 min. In stark contrast to citrate-coated 16-nmAuNPs (ESM Fig. S4C), we observed only a small increase(~ 10%) in light absorption at 600 nm over a time period of60 min for PEGylated AuNPs (0.010 PEG per nm2 of nano-particle surface area corresponding to ~ 6 PEG polymers perAuNP) upon exposure to 150 mM NaCl (ESM Fig. S4B,S4C). This observation was confirmed by DLS measurementsthat showed a small increase in hydrodynamic diameter of ~3 nm and a more pronounced fourfold increase in PDI indic-ative of slight nanoparticle aggregation (Table S4). It is worthnoting that under the same experimental conditions, AuNPswith higher PEG surface densities (i.e., 0.025 PEG/nm2 and
Assessing nanoparticle colloidal stability with single-particle inductively coupled plasma mass...

0.050 PEG/nm2) were less affected by aggregation as demon-strated by UV-Vis spectrophotometry (data not shown) andDLS measurements (Table S4). Based on our collective UV-Vis spectrophotometry and DLS results, we concluded thatPEGylation of 16-nm AuNPs, even at PEG surface densitiesof only 6–30 PEG molecules per AuNP, effectively reducednanoparticle aggregation upon exposure to physiologicallyrelevant NaCl concentrations (ESM, Table S4 and Fig. S4).
To obtain a deeper understanding of the reduced aggregationbehavior seen with DLS and UV-Vis spectrophotometry, weused SP-ICP-MS to obtain mass distributions of the PEGylatedAuNPs exposed to saline solution (Fig. 5). The masses of thePEGylated AuNPs after 5 min primarily exhibited masses below100 ag (Fig. 5a). Interestingly, AuNPs with the lowest PEGsurface density (0.010 PEG/nm2) exhibited a small (~ 10%) de-crease in the number of single nanoparticles similar to theAuNPswith 0 PEG/nm2 (Fig. 5c). On the other hand,AuNPswith higherdensities of PEG, such as 0.025 PEG/nm2, only experienced a ~5% decrease in observed single particles. Meanwhile, AuNPswith the highest density of PEG (0.050 PEG/nm2) had only ~2% of all detected events above 100 ag similar to what wasobserved for AuNPs in Fig. 2 without exposure to salt. Thesefindings corroborated our observations that the onset nanoparti-cle aggregation occurred within 5 min after saline exposure. Inaddition, surface modifications like PEG can be used to physi-cally hinder the rapid onset of salt-induced aggregation in a PEGsurface density–dependent fashion. For a more concise compar-ison, the mean masses and standard deviations of the PEGylatedAuNPs in saline solutions are shown in ESM Fig. S7.
As the effects of aggregation were time dependent asshown in Fig. 4, and in ESM Fig. S6 and Table S4, we ana-lyzed the PEGylated AuNPs in saline solution, after 60 minvia SP-ICP-MS. Upon analysis, we observed that 98% of alldetected events for the PEGylated AuNPs had masses below150 ag (Fig. 5b). Remarkably, AuNPs modified with0.050 PEG/nm2 had twofold less events above 150 ag whencompared with the AuNPs with 0.010 and 0.025 PEG/nm2.This finding indicated that the formation of larger aggregates(3 or more nanoparticles) was virtually completely inhibitedby PEG. After 60 min in saline, more than 90% of all detectedevents were detected as individual nanoparticles for each PEGsurface density compared with the 27% of individual nano-particles observed for citrate-coated AuNPs (Fig. 5d). AuNPsmodified with 0.010 and 0.025 PEG/nm2 had similar amountsof masses > 100 ag (~ 6% out of all detected events). On theother hand, for AuNPs modified with 0.050 PEG/nm2, 97% ofdetected events were below a mass of 100 ag indicating neg-ligible (if any) aggregation in the saline solution after 60 min.For AuNPs with 0.050 PEG/nm2, the number of events withmasses > 100 ag was nearly identical to the baseline of ob-served events with true masses > 100 ag at both t5min andt60min indicating that high PEG surface densities preservedthe monodisperse character and colloidal stability of AuNPsin saline conditions over time. Our SP-ICP-MS results for thePEGylated AuNPs were corroborated by DLS measurementsin ESM Table S4 that showed lower PEG surface (0.010 and0.025 PEG/nm2) had PDI > 0.1, while only the AuNPs with0.050 PEG/nm2 had a PDI < 0.1 after 60 min in saline
Fig. 4 SP-ICP-MS to assesscitrate-coated AuNP aggregation.a Mass histograms of citrate-coated 16-nm colloidal AuNPsexposed to 150 mM aqueousNaCl solution over time. bDetected mass distribution inpanel a is converted into numberof nanoparticles per aggregate(bin size = 50 ag). c Percentage ofindividual nanoparticles arecomparedwith masses > 100 ag, amass which is equal to > 2nanoparticles per aggregate (i.e.,detected event). d Breakdown ofAuNP aggregates into bins of 2–5and > 5 AuNPs per aggregate(i.e., detected event)
Donahue N.D. et al.

solution. Our SP-ICP-MS findings confirmed that, based onour testing conditions, the addition of as little as 0.010 PEG/nm2 was sufficient for reducing the time-dependent effects ofaggregation for monodisperse 16-nm model AuNPs.Moreover, our results indicated that higher PEG surface den-sities better passivate AuNPs to reduce nanoparticle aggrega-tion likely due to improved steric stabilization by neutral PEGpolymers.
Conclusions
We established and validated SP-ICP-MS as a viable quanti-tative high-throughput analytical technique that enables therapid and precise measurement of engineered nanomaterialswith single-particle resolution. Our SP-ICP-MS results werecorroborated by both conventional ensemble nanoparticlecharacterization methods, such as UV-Vis spectrophotometryand DLS, as well as the single-particle data from TEM. Withour SP-ICP-MS approach, we were able to precisely detectand quantify the heterogeneity of AuNPs with high through-put (200+ nanoparticles/min) and recovery (> 90%).Additionally, we used SP-ICP-MS to accurately quantifyAuNPs with various shapes and different nanoparticle sizepopulations from nanoparticle mixtures. Furthermore, we ap-plied SP-ICP-MS as an in situ technique to quantify the col-loidal stability of AuNPs in physiologically relevant salineconditions and showed the mass distributions of AuNP aggre-gates with single aggregate resolution. Through rational sur-face engineering strategies, we demonstrated that increasingnanoparticle PEG surface densities could efficiently attenuate
irreversible nanoparticle aggregation through steric stabiliza-tion. The work presented in this study has potential far-reaching implications for researchers who seek to understandhow engineered nanoparticles aggregate over time in biolog-ically relevant environments and how surface modificationsaffect nanoparticle colloidal stability.
Acknowledgments The authors acknowledge assistance and fruitful dis-cussions by Drs. S. Foster, R. Merrifield, C. Stephan, A. Madden P.Larson, R. Forester, H. Kirit, and PerkinElmer.
Funding information This work was supported in part by an NSF MRIgrant (Award # 1828234), the IBEST/OUHSC Seed Grant forInterdisciplinary Research, and the Oklahoma Tobacco SettlementEndowment Trust awarded to the University of Oklahoma - StephensonCancer Center.
Compliance with ethical standards
Conflict of interest The authors declare that they have no conflict ofinterest.
Disclaimer The content is solely the responsibility of the authors anddoes not necessarily represent the official views of the OklahomaTobacco Settlement Endowment Trust.
References
1. Pelaz B, Alexiou C, Alvarez-Puebla RA, et al. Diverse applicationsof nanomedicine. ACS Nano. 2017;11:2313–81. https://doi.org/10.1021/acsnano.6b06040.
2. Wilhelm S. Perspectives for upconverting nanoparticles. ACSNano. 2017;11:10644–53.
Fig. 5 SP-ICP-MS to evaluateaggregation characteristics ofPEGylated 16-nm AuNPsexposed to 150 mM NaCl. Masshistograms of PEGylated 16-nmAuNPs at t5min in saline solution(a) and t60min in saline solution(b). Percentages of individualnanoparticles of total detectednanoparticle events are plotted att5min (c) and t60min (d) forPEGylated AuNPs in 150 mMNaCl
Assessing nanoparticle colloidal stability with single-particle inductively coupled plasma mass...

3. Narum SM, Le T, Le DP, et al. Passive targeting in nanomedicine:fundamental concepts, body interactions, and clinical potential. In:Nanoparticles for Biomedical Applications: Elsevier; 2020. p. 37–53.
4. Albanese A, Walkey CD, Olsen JB, et al. Secreted biomoleculesalter the biological identity and cellular interactions of nanoparti-cles. ACS Nano. 2014;8:5515–26. https://doi.org/10.1021/nn4061012.
5. Wilhelm S, Tavares AJ, Dai Q, et al. Analysis of nanoparticle de-livery to tumours. Nat Rev Mater. 2016;1:1–12.
6. Poon W, Zhang YN, Ouyang B, et al. Elimination pathways ofnanoparticles. ACS Nano. 2019;13:5785–98. https://doi.org/10.1021/acsnano.9b01383.
7. Donahue ND, Acar H, Wilhelm S. Concepts of nanoparticle cellu-lar uptake, intracellular trafficking, and kinetics in nanomedicine.Adv Drug Deliv Rev. 2019;143. https://doi.org/10.1016/j.addr.2019.04.008.
8. Modena MM, Rühle B, Burg TP, Wuttke S. Nanoparticle charac-terization: what to measure? Adv Mater. 2019;31:1901556. https://doi.org/10.1002/adma.201901556.
9. Marquis BJ, Love SA, Braun KL, Haynes CL. Analytical methodsto assess nanoparticle toxicity. Analyst. 2009;134:425–39.
10. Hoo CM, Starostin N, West P, Mecartney ML. A comparison ofatomic force microscopy (AFM) and dynamic light scattering(DLS) methods to characterize nanoparticle size distributions. JNanopart Res. 2008;10:89–96. https://doi.org/10.1007/s11051-008-9435-7.
11. Olson J, Dominguez-Medina S, Hoggard A, et al. Optical charac-terization of single plasmonic nanoparticles. Chem Soc Rev.2015;44:40–57.
12. Montaño MD, Lowry GV, Blue J. Current status and future direc-tion for examining engineered nanoparticles in natural systems.2010. https://doi.org/10.1071/EN14037.
13. Brar SK, Verma M. Measurement of nanoparticles by light-scattering techniques. TrAC - Trends Anal Chem. 2011;30:4–17.
14. Dastanpour R, Boone JM, Rogak SN. Automated primary particlesizing of nanoparticle aggregates by TEM image analysis. PowderTechnol. 2016;295:218–24. https://doi.org/10.1016/j.powtec.2016.03.027.
15. Filipe V, Hawe A, Jiskoot W. Critical evaluation of nanoparticletracking analysis (NTA) by NanoSight for the measurement ofnanoparticles and protein aggregates. Pharm Res. 2010;27:796–810. https://doi.org/10.1007/s11095-010-0073-2.
16. Montaño MD, Olesik JW, Barber AG, et al. Single particle ICP-MS: advances toward routine analysis of nanomaterials. AnalBioanal Chem. 2016;408:5053–74. https://doi.org/10.1007/s00216-016-9676-8.
17. Mozhayeva D, Engelhard C. A critical review of single particleinductively coupled plasma mass spectrometry – a step towardsan ideal method for nanomaterial characterization. J Anal AtSpectrom. 2020. https://doi.org/10.1039/c9ja00206e.
18. Corte Rodríguez M, Álvarez-Fernández García R, Blanco E, et al.Quantitative evaluation of cisplatin uptake in sensitive and resistantindividual cells by single-cell ICP-MS (SC-ICP-MS). Anal Chem.2017;89:11491–7. https://doi.org/10.1021/acs.analchem.7b02746.
19. Wilhelm S, Bensen RC, Kothapali NR, et al (2018) Quantificationof gold nanoparticle uptake into cancer cells using single cell ICP-MS. PerkinElmer Appl Note.
20. Lee JC, Donahue ND, Mao AS, et al. Exploring maleimide-basednanoparticle surface engineering to control cellular interactions.ACS Appl Nano Mater. 2020;3:2421–9. https://doi.org/10.1021/acsanm.9b02541.
21. Albanese A, Tang PS, ChanWCW. The effect of nanoparticle size,shape, and surface chemistry on biological systems. Annu RevBiomed Eng. 2012;14:1–16. https://doi.org/10.1146/annurev-bioeng-071811-150124.
22. Wilhelm S, Kaiser M, Würth C, et al. Water dispersibleupconverting nanoparticles: effects of surface modification on theirluminescence and colloidal stability. Nanoscale. 2015;7:1403–10.https://doi.org/10.1039/c4nr05954a.
23. Muhr V, Wilhelm S, Hirsch T, Wolfbeis OS. Upconversion nano-particles: from hydrophobic to hydrophilic surfaces. Acc ChemRes. 2014;47:3481–93. https://doi.org/10.1021/ar500253g.
24. Hassellöv M, Readman JW, Ranville JF, Tiede K. Nanoparticleanalysis and characterization methodologies in environmental riskassessment of engineered nanoparticles. Ecotoxicology. 2008;17:344–61.
25. Love SA,Maurer-JonesMA, Thompson JW, et al. Assessing nano-particle toxicity. Annu Rev Anal Chem. 2012;5:181–205. https://doi.org/10.1146/annurev-anchem-062011-143134.
26. Buchman JT, Hudson-Smith NV, Landy KM, Haynes CL.Understanding nanoparticle toxicity mechanisms to inform rede-sign strategies to reduce environmental impact. Acc Chem Res.2019;52:1632–42. https://doi.org/10.1021/acs.accounts.9b00053.
27. Albanese A, Chan WCW. Effect of gold nanoparticle aggregationon cell uptake and toxicity. ACS Nano. 2011;5:5478–89. https://doi.org/10.1021/nn2007496.
28. Maurer-Jones MA, Lin YS, Haynes CL. Functional assessment ofmetal oxide nanoparticle toxicity in immune cells. ACS Nano.2010;4:3363–73. https://doi.org/10.1021/nn9018834.
29. Maurer-Jones MA, Gunsolus IL, Murphy CJ, Haynes CL. Toxicityof engineered nanoparticles in the environment. Anal Chem.2013;85:3036–49. https://doi.org/10.1021/ac303636s.
30. Kim HA, Lee BT, Na SY, et al. Characterization of silver nanopar-ticle aggregates using single particle-inductively coupled plasma-mass spectrometry (spICP-MS). Chemosphere. 2017;171:468–75.https://doi.org/10.1016/j.chemosphere.2016.12.063.
31. Perrault SD, Warren CWC. Synthesis and surface modification ofhighly monodispersed, spherical gold nanoparticles of 50−200 nm.J Am Chem Soc. 2009;131:17042–3. https://doi.org/10.1021/ja907069u.
32. Vigderman L, Zubarev ER. High-yield synthesis of gold nanorodswith longitudinal SPR peak greater than 1200 nm using hydroqui-none as a reducing agent. Chem Mater. 2013;25:1450–7. https://doi.org/10.1021/cm303661d.
33. Zhou S, HuoD, Goines S, et al. Enabling complete ligand exchangeon the surface of gold nanocrystals through the deposition and thenetching of silver. J Am Chem Soc. 2018;140:11898–901. https://doi.org/10.1021/jacs.8b06464.
34. Merrifield RC, Stephan C, Lead JR. Quantification of Au nanopar-ticle biouptake and distribution to freshwater algae using single cell- ICP-MS. Environ Sci Technol. 2018;52:2271–7. https://doi.org/10.1021/acs.est.7b04968.
35. Corte-RodríguezM, Blanco-González E, Bettmer J, Montes-BayónM. Quantitative analysis of transferrin receptor 1 (TfR1) in individ-ual breast cancer cells bymeans of labeled antibodies and elemental(ICP-MS) detection. Anal Chem. 2019;91:15532–8. https://doi.org/10.1021/acs.analchem.9b03438.
36. Mavrakis E, Mavroudakis L, Lydakis-Simantiris N, Pergantis SA.Investigating the uptake of arsenate by Chlamydomonas reinhardtiicells and its effect on their lipid profile using single cell ICP-MSand easy ambient sonic-spray ionization-MS. Anal Chem. 2019;91:9590–8. https://doi.org/10.1021/acs.analchem.9b00917.
37. Cuello-Nuñez S, Abad-Álvaro I, Bartczak D, et al. The accuratedetermination of number concentration of inorganic nanoparticlesusing spICP-MS with the dynamic mass flow approach. J Anal AtSpectrom. 2020. https://doi.org/10.1039/c9ja00415g.
38. Pace HE, Rogers NJ, Jarolimek C, et al. Determining transportefficiency for the purpose of counting and sizing nanoparticles viasingle particle inductively coupled plasma mass spectrometry. AnalChem. 2011;83:9361–9. https://doi.org/10.1021/ac201952t.
Donahue N.D. et al.

39. Pace HE, Rogers NJ, Jarolimek C, et al. Single particle inductivelycoupled plasma-mass spectrometry: a performance evaluation andmethod comparison in the determination of nanoparticle size.Environ Sci Technol. 2012;46:12272–80. https://doi.org/10.1021/es301787d.
40. Kang H, Buchman JT, Rodriguez RS, et al. Stabilization of silverand gold nanoparticles: preservation and improvement of plasmon-ic functionalities. Chem Rev. 2019;119:664–99.
41. Muhammad Syed A, Sindhwani S, Wilhelm S, et al. Three-dimensional imaging of transparent tissues via metal nanoparticlelabeling. J Am Chem Soc. 2017;139:9961–71. https://doi.org/10.1021/jacs.7b04022.
42. Haiss W, Thanh NTK, Aveyard J, Fernig DG. Determination ofsize and concentration of gold nanoparticles from UV-Vis spectra.Anal Chem. 2007;79:4215–21. https://doi.org/10.1021/ac0702084.
43. Hineman A, Stephan C. Effect of dwell time on single particleinductively coupled plasma mass spectrometry data acquisitionquality. J Anal At Spectrom. 2014;29:1252–7. https://doi.org/10.1039/c4ja00097h.
44. Lee S, Bi X, Reed RB, et al. Nanoparticle size detection limits bysingle particle ICP-MS for 40 elements. Environ Sci Technol.2014;48:10291–300. https://doi.org/10.1021/es502422v.
45. Tan J, Yang Y, El Hadri H, et al. Fast quantification of nanorodgeometry by DMA-spICP-MS. Analyst. 2019;144:2275–83.https://doi.org/10.1039/c8an02250j.
46. Kálomista I, Kéri A, Ungor D, et al. Dimensional characterizationof gold nanorods by combining millisecond and microsecond tem-poral resolution single particle ICP-MS measurements. J Anal AtSpectrom. 2017;32:2455–62. https://doi.org/10.1039/c7ja00306d.
47. Christau S, Moeller T, Genzer J, et al. Salt-induced aggregation ofnegatively charged gold nanoparticles confined in a polymer brushmatrix. Macromolecules. 2017;50:7333–43. https://doi.org/10.1021/acs.macromol.7b00866.
48. Pamies R, Cifre JGH, Espín VF, et al. Aggregation behaviour ofgold nanoparticles in saline aqueous media. J Nanopart Res.2014;16. https://doi.org/10.1007/s11051-014-2376-4.
49. Kim T, Lee CH, Joo SW, Lee K. Kinetics of gold nanoparticleaggregation: experiments and modeling. J Colloid Interface Sci.2008;318:238–43. https://doi.org/10.1016/j.jcis.2007.10.029.
50. Suk JS, Xu Q, Kim N, et al. PEGylation as a strategy for improvingnanoparticle-based drug and gene delivery. Adv Drug Deliv Rev.2016;99:28–51.
51. Jokerst JV, Lobovkina T, Zare RN, Gambhir SS. NanoparticlePEGylation for imaging and therapy. Nanomedicine. 2011;6:715–28.
52. Manson J, Kumar D, Meenan BJ, Dixon D. Polyethylene glycolfunctionalized gold nanoparticles: the influence of capping densityon stability in various media. Gold Bull. 2011;44:99–105. https://doi.org/10.1007/s13404-011-0015-8.
53. Zhang XD, Wu D, Shen X, et al. Size-dependent in vivo toxicity ofPEG-coated gold nanoparticles. Int J Nanomedicine. 2011;6:2071–81. https://doi.org/10.2147/ijn.s21657.
54. Walkey CD, Olsen JB, Guo H, et al. Nanoparticle size and surfacechemistry determine serum protein adsorption and macrophage up-take. J Am Chem Soc. 2012;134:2139–47. https://doi.org/10.1021/ja2084338.
Publisher’s note Springer Nature remains neutral with regard to jurisdic-tional claims in published maps and institutional affiliations.
Nathan D. Donahue is a PhDgraduate student in Prof. StefanWi l h e l m ’ s g r o u p a t t h eS t e p h e n s o n S c h o o l o fB i om ed i c a l E n g i n e e r i n g(University of Oklahoma). In hisresearch, he applies elementalanalysis techniques to understandinteractions between engineerednanoparticles and biological sys-tems.
Emmy R. Francek is a biomedicalengineering undergraduate stu-dent in Prof. Stefan Wilhelm’sgroup at the Universi ty ofOklahoma. She focuses on thesynthesis and characterization ofnanoparticles for drug deliveryapplications.
Emi Kiyotake is a PhD candidatein Prof. Michael Detamore’sgroup in the Stephenson Schoolof Biomedical Engineering at theUniversity of Oklahoma. Her re-search focuses on the develop-ment and application of conduc-tive and injectable hydrogels fornerve repair after spinal cord inju-ry.
Emily E. Thomas is a biomedicalengineering undergraduate stu-dent in Prof. Michael Detamore’sgroup at the Universi ty ofOklahoma where she focuses onbiomaterials research for regener-ative medicine.
Assessing nanoparticle colloidal stability with single-particle inductively coupled plasma mass...

Wen Yang is a PhD graduate stu-dent in Prof. Stefan Wilhelm’sgroup at the Stephenson Schoolof Biomedical Engineering(University of Oklahoma). In herresearch, she focuses on nanopar-ticle surface engineering strate-gies for efficient drug delivery.
LinWang is a postdoctoral fellowin Prof. StefanWilhelm’s group atthe Stephenson School ofB i om ed i c a l E n g i n e e r i n g(University of Oklahoma). In herresearch, she focuses on develop-ing new nanoparticle engineerings t r a t e g i e s t o i m p r o v enanomedicine.
Michael S. Detamore is theFounding Director, StephensonChair #1, and Professor in theS t e p h e n s o n S c h o o l o fBiomedical Engineering at theUniversity of Oklahoma. He hasdeveloped a variety of new bio-materials for the application oftranslational regenerative medi-cine.
Stefan Wilhelm is an AssistantProfessor at the StephensonS c h o o l o f B i o m e d i c a lEngineering (University ofOklahoma). His research is fo-cused on bioanalytical chemistryand the study of nano-bio interac-tions for the development of next-generation nanomedicines.
Donahue N.D. et al.