Assessing Malaria Treatment and Control in Selected … · Stop Malaria Project Uganda Assessing...
43
Assessing Malaria Treatment and Control in Selected Health Facilities October 2010
Transcript of Assessing Malaria Treatment and Control in Selected … · Stop Malaria Project Uganda Assessing...

Assessing Malaria Treatment and Control in Selected Health Facilities
October 2010

Stop Malaria Project Uganda
Assessing Malaria Treatment and Control in selected Health Facilities ii
Stop Malaria Project is a five-year
program (2008-2013) of
development assistance funded by
the Presidential Malaria Initiative
and United States Agency for
International Development (USAID)
The Project is managed by Johns
Hopkins University Bloomberg
School of public health Center for
Communication programs
(JHU/CCP), Malaria Consortium, the
Infectious Disease Institute,
Communication for development
foundation and the Uganda Health
Marketing Group.
Plot 2 Sturrock Road,
Kololo Opposite Lohana Academy
P.O.box 8045 Kampala, Uganda
Tel: +256 (0) 312 300450
Tel: +256 (0) 312 300421
Fax: +256 (0) 312 300425

Stop Malaria Project Uganda
Assessing Malaria Treatment and Control in selected Health Facilities iii
Acknowledgements
Stop Malaria Project with support from Focus Development Associates performed the activities that led to the compilation of
this report. The report is based on information collected by Stop Malaria Project, analyzed and reported by Focus
Development Associates a management and Development Consultancy Firm.
The consultancy team comprised of Patrick Nsamba Oshabe, Prosper Behumbize and Dr. Kayita Godfrey. Special Thanks
goes to Dr. William Katamba, Dr. Sam Guidoi, and Flora Gombe from SMP who aided the smooth completion of all exercises
that led to the completion of this report. In addition we appreciate the efforts of supervisors, District Health Officers and
health facility staff of visited centers that fully supported the assessment activities and cooperated with the supervisors

Stop Malaria Project Uganda
Assessing Malaria Treatment and Control in selected Health Facilities iv

Stop Malaria Project Uganda
Assessing Malaria Treatment and Control in selected Health Facilities v
Table of Contents
1.0 BACKGROUND TO MALARIA IN UGANDA ............................................................................................................................................ 1
1.2 THE STOP MALARIA PROJECT ....................................................................................................................................................................... 2
1.3 SUPPORT SUPERVISION ................................................................................................................................................................................. 2
2.0 METHODOLOGY AND CHARACTERISTICS OF THE SUPERVISED FACILITIES...................................................................................... 3
3.0 SUPERVISION FINDINGS............................................................................................................................................................................ 5
3.1 MALARIA DURING PREGNANCY ......................................................................................................................................................... 5
3.1.1 Provision of ANC Services ................................................................................................................................................................... 5
3.1.2 IPTp during ANC Visits. ...................................................................................................................................................................... 6
3.1.3 IPTp under DOTs ................................................................................................................................................................................ 7
3.1.4 Routine provision of Folic Acid and De-worming of Pregnant Women................................................................................................. 8
3.1.5 Availability of Supply of Clean and Safe water to administer IPT under DOT...................................................................................... 9
3.1.6 Availability of ANC Cards ................................................................................................................................................................. 10
3.1.8 Utilization of ANC IEC Materials ...................................................................................................................................................... 12
3.1.8 Utilization of ANC IEC Materials ...................................................................................................................................................... 12
3.1.9 Dispensation of LLIN through ANC ................................................................................................................................................... 13
3.1.10 Provision of Health Education Talks during ANC ............................................................................................................................ 14
3.2 HEALTH MANAGEMENT INFORMATION SYSTEM ............................................................................................................................. 15
3.2.1 Existence of up to date HMIS registers .............................................................................................................................................. 15
3.2.2 Completing HMIS Reports Appropriately........................................................................................................................................... 16
3.2.3 Availability of trained HMIS officers ................................................................................................................................................. 17
3.2.4 Availability of data management computer ........................................................................................................................................ 18
3.2.5 Availability of Health Unit Management Committees......................................................................................................................... 19
3.3 CASE MANAGEMENT .......................................................................................................................................................................... 20
3.3.1 Availability of trained Staff to Manage Malaria ................................................................................................................................. 20
3.3.2 Utilization of treatment guidelines in treatment of malaria ................................................................................................................ 21

Stop Malaria Project Uganda
Assessing Malaria Treatment and Control in selected Health Facilities vi
3.3.3 Malaria Treatment based on Laboratory Diagnosis ........................................................................................................................... 22
3.3.4 Referral of Emergency Cases............................................................................................................................................................. 23
3.3.5 Facility Clinical Audit ....................................................................................................................................................................... 24
3.3.6 Monthly Malaria Case Management .................................................................................................................................................. 25
3.4 LABARATORY MANAGEMENT............................................................................................................................................................ 26
3.4.1 Availability of Functional Laboratory at the Facility ......................................................................................................................... 26
3.4.2 Availability of Skilled Human Resources............................................................................................................................................ 27
3.4.3 Techniques used in Diagnosis of Malaria........................................................................................................................................... 28
3.4.4 Maintenance of Laboratory Equipment .............................................................................................................................................. 29
3.4.5 Preparation of Stains used in Laboratory........................................................................................................................................... 29
3.4.6 Management of Laboratory Data....................................................................................................................................................... 30
3.4.7 Availability of Staff Trained in Logistics Management ....................................................................................................................... 31
3.5 DRUG VERIFICATION ........................................................................................................................................................................... 32
3.6 IEC VERIFICATION ................................................................................................................................................................................ 33
3.6.1Availability of Malaria Specific Health Education Talks ..................................................................................................................... 33
3.6.2 Community Awareness activities about Malaria................................................................................................................................. 34
3.7 SUPPORT SUPERVISION........................................................................................................................................................................ 35
4.0 RECOMMENDED ACTION POINTS......................................................................................................................................................... 36
5.0 APPENDICES ............................................................................................................................................................................................. 37

Stop Malaria Project Uganda
Assessing Malaria Treatment and Control in selected Health Facilities 1
1.0 BACKGROUND TO MALARIA IN UGANDA
In Uganda, malaria is the most commonly reported disease by both public and private health facilities. Clinically-
diagnosed malaria is the leading cause of morbidity and mortality, accounting for 25 to 40 percent of outpatient visits
at health facilities, 15 to 20 percent of all hospital admissions, and 9 to 14 percent of all hospital deaths. The overall
malaria specific mortality is estimated to be between 70000 and 100000 child deaths annually a death toll that exceeds
that of HIV/AIDs. Nearly half of in-patient deaths among children under the age of five are attributed to clinical malaria.
According to Ministry of Health, Malaria impacts negatively on the household, community incomes and the national
economy, thus keeping
the affected communities trapped in perpetual poverty. Available statistics show that families spend 25% of their
income on malaria. Poor school performance and absenteeism due to malaria reduce chances of escaping from
poverty. Poor people tend to live in environments conducive to mosquito breeding and malaria transmission. Thus
malaria enhances poverty, which in turn causes poor disease management, locking people in a malaria-poverty trap.
Despite the overwhelming burden imposed by malaria in Uganda, there is increasing optimism that the tide can be
turned through the establishment of several initiatives. The United States government launched the President’s Malaria
Initiative (PMI), with the goal of reducing malaria-related deaths in selected countries, including Uganda, by 50% within
five years. Through PMI and other large funding sources, such as the Global Fund to Fight AIDS, Tuberculosis and Malaria,
Uganda have an unprecedented opportunity to reduce malaria associated morbidity and mortality on a national
scale.
Several Policies, strategies and Innovative approaches to malaria control targeting high-risk populations have been
initiated by Ministry of Health and development partners, among which have included; the Malaria Control program,
malaria control policy, malaria strategic plan and a fully fledged malaria consortium to coordinate all these efforts.

Stop Malaria Project Uganda
Assessing Malaria Treatment and Control in selected Health Facilities 2
1.2 The Stop Malaria Project
The Stop Malaria Project is a five-year program (2008-2013) of development assistance funded by the Presidential
Malaria Initiative and United States Agency for International Development (USAID).
The project is designed to contribute to USAID Uganda’s Strategic Objective of improving human capacity through
improved human health. Specifically the project contributes to program by assisting the government of Uganda to
reach the PMI and Roll Back Malaria (RBM) goal of reducing malaria related mortality by 50%. To help achieve this goal,
SMP uses an integrated set of approaches that reach recipients at multiple levels, including behavioral change
interventions at the individual, household, and community levels, service delivery strengthening at the health facility
level, and institutional capacity building at the district and national levels.
1.3 Support Supervision
As a way of monitoring and evaluating project activities SMP collects data on a number of interventions including rapid
district assessments, support supervision and facility assessment. In months of August and September, 2009 SMP carried
out a support supervision exercise in 14 districts
The purpose of the support supervision was to assess the capacity and gaps of selected health facilities in controlling
and treatment of malaria related cases. The assessment investigated issues related to availability of services, quality of
services, and utilization of services.
Key services investigated included; ANC/IPTp services, Health Unit Management systems, Case Management,
Laboratory, Drug Verification, IEC verification and support supervision. The assessment was carried out in Government,
NGO/PNFP, and Private Health facilities especially those at the level of Hospitals, HCIVs, and HCIIIs.

Stop Malaria Project Uganda
Assessing Malaria Treatment and Control in selected Health Facilities 3
2.0 METHODOLOGY AND CHARACTERISTICS OF THE SUPERVISED FACILITIES A check list was used as a supervisory tool for the activity. It was adopted from the ministry of health and was reviewed
and revised in the supervisory orientation meetings. In each district Supervisors comprised of two team members from
SMP, a district malaria focal person, the HMIS focal person and Laboratory technician who could be joined with other
members who where previously trained as facilitators in IPTp.
A total of 482 facilities from 18 districts1 where supervised in the
fourth quarter; Majority (55) of them where from Mukono District
followed by Luwero (53), Wakiso (45), Mpigi (44), Hoima (41) Soroti
(34) and Masindi (33). Others included 27 facilities from Rakai, 24
facilities from Kibaale, 20 facilities from Kiboga and Nakasongola.
Katakwi (10), Buliisa (10), Bukedea (11), Nakaseke and Amuria 13
facilities where among the districts with fewest number of facilities
supervised.
Out of the 482 facilities supervised in the quarter majority (376)
were Government aided, 90 were aided by NGOs or faith based
organisations or churches and 16 were privately owned.
Of the 482 facilities supervised 274 were HCIIIs, 133 were HCIIs 43
HCIVs and 22 Hospitals. In some instances supervisors failed to
categorize health facilities especially those that are privately
owned. 2 were from Kaberamaido, 3 from Luwero, 2 from Mukono
and 2 from Rakai District
The supervisory activities where undertaken in the months of July,
August and completed in September 2010. And data analysis and report production commissioned and completed in
October 2010.
1
At the time of collecting this data some districts had been partitioned by government of Uganda, e.g Mukono now comprises of Buvuma and Buikwe, Mpigi
comprises of Gomba and Butambala, Masindi comprises of Kiryandongo etc. For the sake of this report Buvuma and Buikwe where taken as Mukono, Gomba
and Butambala as Mpigi, and Kiryandongo as Masindi.
Number of Supervised Facilities by Ownership
District Name Govt NGO-PNFP Private Total
AMURIA 9 4 13
BUKEDEA 8 3 11
BULIISA 8 1 1 10
HOIMA 33 6 2 41
KABERAMAIDO 10 2 2 14
KATAKWI 8 2 10
KIBAALE 18 6 24
KIBOGA 18 1 1 20
KUMI 13 2 15
LUWERO 32 15 6 53
MASINDI 28 5 33
MPIGI 34 9 1 44
MUKONO 40 14 1 55
NAKASEKE 11 2 13
NAKASONGOLA 18 2 20
RAKAI 24 3 27
SOROTI 26 6 2 34
WAKISO 38 7 45
Total 376 90 16 482

Stop Malaria Project Uganda
Assessing Malaria Treatment and Control in selected Health Facilities 4
At the time of the supervision of the 133 HCIIs supervised; 91 indicated that they had 3-6 members of staff, 29 facilities
indicated that they had less than 2 members of staff. It was only 8 and 3 facilities that indicated that they had a staff
team of 7-10 members and 11-20 members respectively.
Out of the 274 HCIIIs
supervised 115 facilities
indicated that they had a
staff team composing of 7-
10 members, 97 facilities
indicated that they had 3-
6 staff members and only 5
facilities indicated that
they had less than two
members of staff. Most (20)
HCIVs had more than 20
members of staff, while 18 facilities indicate that they had 11-20 members of staff.
It should be noted however that although a significant number of facilities indicated that they had higher numbers of
staff members, the data-set points out to the fact that a significant number of health workers were off duty during
support supervision. Although most (91) HCIIs had 3-6 staff members and only 29 facilities had less than 2 staff members,
90 facilities indicated that they had less than 2 members of staff on duty, only 40 facilities had 3-6 members present. The
same scenario can be seen with HCIIIs. Although there only 5 HCIIIs that reported to have less than 2 staff members, 55
HCIIIs had less than 2 staff members at the time of the assignment.
When it came to specific health worker staffing2 at facility level; o of the 133 HCIIs only 3 indicated that they can access services of a Doctor, only 18 facilities indicated that they had one or more clinical
officer(s), 71 had one or more Nurses, 63 had one or more laboratory personnel, and only 7 had one or more HMIS officer(s)
o Of the 274 HCIII supervised, only 7 facilities indicated that they had one or more Doctors, 155 had one more clinical officers, 196 had
one or more nurses, 188 facilities had one or more laboratory personnel, and 110 indicated that they had one or more HMIS officer(s).
o Of the 43 HCIVs supervised in this quarter, only 15 had one or more doctors, 29 had one or more clinical officers, 38 facilities indicated
that they one or more nurses, 39 facilities had laboratory personnel and 28 facilities had one or more HMIS officer(s).
o Of the 22 Hospitals supervised, 10 hospitals indicated that they lacked services of a Doctor, 3 did not give their opinion on whether they
had clinical officers, 2 hospitals expressed the desire for Nurses, 3 hospitals did not have a laboratory personnel and 2 had no HMIS
officers at the time of this assignment.
2 For details on staffing go to appendix????
Number of Health Workers at the Facility
Level No Response Less than 2 3-6 staff 7-10staff 11-20Staff 21+ Total
HC II 2 29 91 8 3 133 HC III 5 5 97 115 47 5 274 HC IV 1 1 3 18 20 43
Hospital 3 19 22 Number of health workers Present at the facility during
HC II 1 90 40 2 0 0 133 HC III 10 55 172 33 4 0 274
HC IV 5 0 14 19 5 0 43
Hospital 3 3 16 22

Stop Malaria Project Uganda
Assessing Malaria Treatment and Control in selected Health Facilities 5
3.0 SUPERVISION FINDINGS The section provides information on key supervisory areas which included, management of malaria among expecting
mothers, health information management system for malaria, management of malaria case, laboratory management,
IEC information, support supervision and drug management.
3.1 MALARIA DURING PREGNANCY
Malaria during pregnancy is associated with poor maternal, obstetrical and infant outcomes. Malaria affects pregnant
women living in both low and high transmission areas. In pregnant women living in high transmission areas, malaria
magnifies the risk of anemia, contributing indirectly or directly to significant morbidity and mortality.
In the malaria control strategic plan 2005/6-2009/10, pregnant women were to be targeted for the distribution with
ITN/LLIN particularly through ANC services. This was expected not only to increase the protection of this vulnerable
group but also help to improve the uptake of ANC services in general.
To increase the proportion of pregnant women receiving two doses of IPTp, SMP distributed malaria in pregnancy wall
charts and gestational wheels to health centers as job-aids. Health workers were trained in IPTp and received regular
supportive supervision. SMP also provided cups and safe drinking water to ensure that directly observed treatment of
IPTp dosing was possible at both public and private ANC clinics.
3.1.1 Provision of ANC Services
SMP intended to find out whether the supervised facilities provided antenatal care on a daily basis to help protect
pregnant women from dangers associated with malaria. From the data-set 135 (28%) facilities indicated that they do
not provide ANC on a daily basis. 3%(15) of the facilities indicated that they do not provide ANC services at all and 8
(2%) facilities did not give their opinion about this ANC query. Katakwi district has the highest percentage (80%) of her
facilities not providing ANC on a daily basis, followed by Kiboga with 45% of her facilities indicating the same. Wakiso
(38%), Soroti (38%), Nakaseke (38%), Amuria (38%), Mukono (33%) and Kibaale (33%) are other districts with a significant
percentage of their respective facilities indicating that they do not provide ANC on a daily basis. Kumi District (93%),
Luwero (87%), Buliisa (80%) and Mpigi (80%) had the highest coverage of facilities indicating that they provided ANC on
a daily basis.
Although most facilities indicated that they provided ANC on a daily basis, it was discovered that although services can
be accessed on all days of the week, there are specific days in almost all health facilities designated for
ANC clinic and most mothers are used to this system. However there health facilities where services cannot

Stop Malaria Project Uganda
Assessing Malaria Treatment and Control in selected Health Facilities 6
be accessed unless on the designated days of the week3 and facilities where ANC cannot be accessed at all because
they do not have midwives to attend to mothers.
3.1.2 IPTp during ANC Visits.
The current MOH Intermittent Preventive
Treatment (IPT) policy states that; all pregnant
women - even if they do not have fever or other
signs of malaria- should take 3 tablets of
Sulfadoxine-Pyramethamine (SP) once between
4 and 6 months of pregnancy and 3 SP tablets
between 7 and 9 months. Pregnant women
infected with HIV should take 3 doses of SP 1
month apart or stay on cotrimoxazol (e.g.
Septrin).
From table 3 above Amuria (38%) and Soroti (26%) Districts had the highest proportion of health facilities that do not
provide IPT during ANC visits. Katakwi and Kibaale had all their facilities reporting that they provide IPT during ANC.
Generally most districts had majority of their facilities reporting that they provided IPT. If the trend continues its
anticipated that the serious health risk for pregnant women posed by malaria in Uganda will reduce.
3 Most facilities have ANC clinics run twice a week on specific days agreed upon by the health facility and expecting mothers.
Proportion of facilities providing Intermittent Preventive Treatment
District Name
Facilities
without opinion
Facilities
providing IPTp
Facilities that do
not provide IPTp
Facilities that do
not provide ANC
AMURIA 62% 38%
BUKEDEA 73% 18% 9%
BULIISA 10% 90%
HOIMA 5% 85% 2% 7%
KABERAMAIDO 64% 21% 14%
KATAKWI 100%
KIBAALE 100%
KIBOGA 10% 80% 10%
KUMI 93% 7%
LUWERO 2% 98%
MASINDI 85% 12% 3%
MPIGI 2% 89% 9%
MUKONO 4% 87% 4% 5%
NAKASEKE 23% 69% 8%
NAKASONGOLA 90% 5% 5%
RAKAI 4% 89% 4% 4%
SOROTI 71% 26% 3%
WAKISO 91% 4% 4%
Total 3% 86% 7% 4%
Stop Malaria Project Uganda
Assessing Malaria Treatment and Control in selected Health Facilities 7
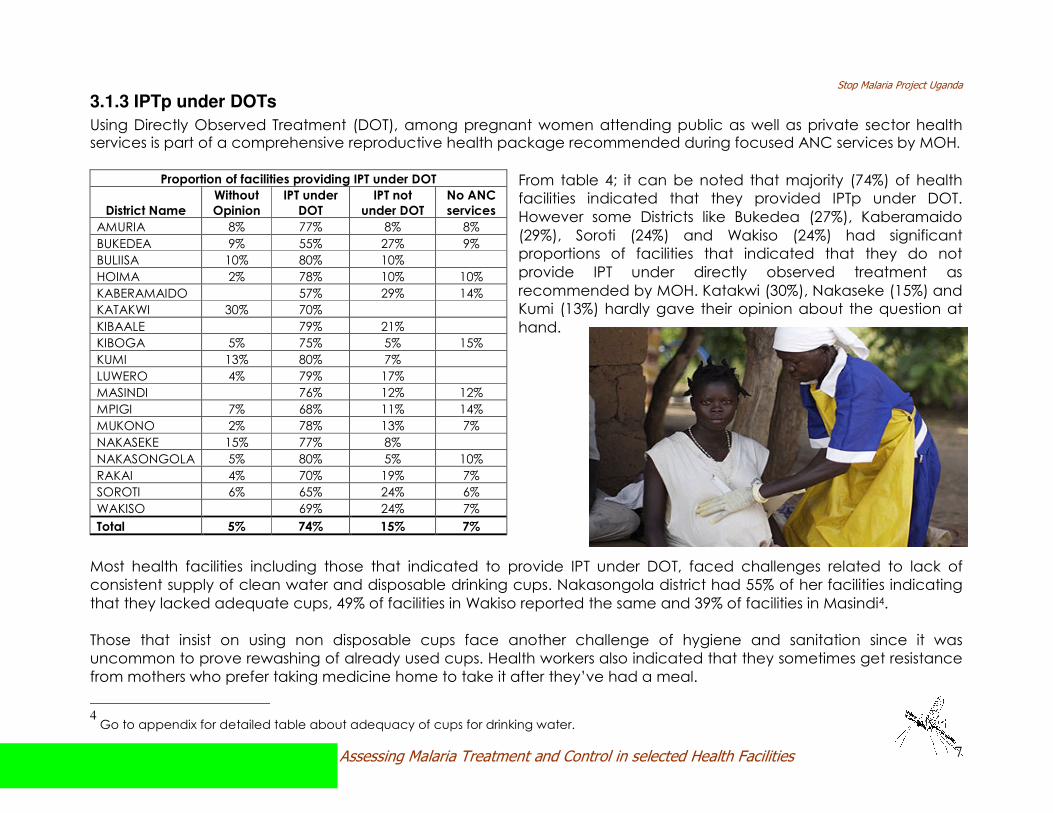
3.1.3 IPTp under DOTs
Using Directly Observed Treatment (DOT), among pregnant women attending public as well as private sector health services is part of a comprehensive reproductive health package recommended during focused ANC services by MOH.
From table 4; it can be noted that majority (74%) of health
facilities indicated that they provided IPTp under DOT.
However some Districts like Bukedea (27%), Kaberamaido
(29%), Soroti (24%) and Wakiso (24%) had significant
proportions of facilities that indicated that they do not
provide IPT under directly observed treatment as
recommended by MOH. Katakwi (30%), Nakaseke (15%) and
Kumi (13%) hardly gave their opinion about the question at
hand.
Most health facilities including those that indicated to provide IPT under DOT, faced challenges related to lack of
consistent supply of clean water and disposable drinking cups. Nakasongola district had 55% of her facilities indicating
that they lacked adequate cups, 49% of facilities in Wakiso reported the same and 39% of facilities in Masindi4.
Those that insist on using non disposable cups face another challenge of hygiene and sanitation since it was
uncommon to prove rewashing of already used cups. Health workers also indicated that they sometimes get resistance
from mothers who prefer taking medicine home to take it after they’ve had a meal.
4
Go to appendix for detailed table about adequacy of cups for drinking water.
Proportion of facilities providing IPT under DOT
District Name
Without
Opinion
IPT under
DOT
IPT not
under DOT
No ANC
services
AMURIA 8% 77% 8% 8%
BUKEDEA 9% 55% 27% 9%
BULIISA 10% 80% 10%
HOIMA 2% 78% 10% 10%
KABERAMAIDO 57% 29% 14%
KATAKWI 30% 70%
KIBAALE 79% 21%
KIBOGA 5% 75% 5% 15%
KUMI 13% 80% 7%
LUWERO 4% 79% 17%
MASINDI 76% 12% 12%
MPIGI 7% 68% 11% 14%
MUKONO 2% 78% 13% 7%
NAKASEKE 15% 77% 8%
NAKASONGOLA 5% 80% 5% 10%
RAKAI 4% 70% 19% 7%
SOROTI 6% 65% 24% 6%
WAKISO 69% 24% 7%
Total 5% 74% 15% 7%

Stop Malaria Project Uganda
Assessing Malaria Treatment and Control in selected Health Facilities 8
3.1.4 Routine provision of Folic Acid and De-worming of Pregnant Women
Proportion of facilities that provide Folic acid for pregnant
women
Proportion of facilities that routinely de-worm pregnant
women
District Name
Without
opinion
Folic acid
provided
No folic
acid
No
services
Without
opinion De-worming
provided
No de-worming
services
Not
Applicable
AMURIA 8% 85% 8% 23% 69% 8%
BUKEDEA 9% 73% 9% 9% 18% 73% 9%
BULIISA 10% 90% 10% 90%
HOIMA 2% 81% 12% 5% 7% 78% 10% 5%
KABERAMAIDO 86% 14% 86% 14%
KATAKWI 90% 10% 90% 10%
KIBAALE 4% 92% 4% 4% 96%
KIBOGA 5% 85% 10% 5% 85% 10%
KUMI 100% 100%
LUWERO 4% 91% 6% 9% 89% 2%
MASINDI 88% 9% 3% 91% 6% 3%
MPIGI 2% 80% 11% 7% 2% 82% 9% 7%
MUKONO 91% 4% 6% 4% 89% 2% 6%
NAKASEKE 8% 92% 8% 85% 8%
NAKASONGOLA 85% 10% 5% 5% 90% 5%
RAKAI 4% 78% 15% 4% 4% 89% 4% 4%
SOROTI 3% 74% 21% 3% 3% 88% 6% 3%
WAKISO 93% 4% 2% 4% 82% 11% 2%
Total 3% 86% 8% 4% 5% 86% 5% 4%
Most facilities in all districts were found to be providing de-worming services to pregnant women. However routine Stock
outs of Folic Acid were recorded in almost all health facilities including those that indicated that they provide it
routinely. They indicated that an inconsistency in the supply of albendazole causes failure to routinely de-worm
pregnant women in some facilities. However most health workers indicated that they sensitize pregnant women about
the advantages of de-worming to pregnant mothers.

Stop Malaria Project Uganda
Assessing Malaria Treatment and Control in selected Health Facilities 9
3.1.5 Availability of Supply of Clean and Safe water to administer IPT under DOT
During support supervision SMP desired to find out whether facilities have reliable supply of water safe for drinking 5 in
the ANC clinic. Most facilities in all districts indicated that they had safe water (treated or boiled) for drinking and use in
the ANC clinic.
It was only Buliisa district that
had no facilities indicating
that they had no safe water.
Nakaseke (31%),
Kaberamaido (29%) and
Bukedea (27%) had the
highest proportion of facilities
indicating that they do have
clean water. Nakaseke district
should be a point of concern because in table 4 above it had 77% of
her facilities indicating that they provide IPT under DOT. This may imply
that they could be using untreated water to administer the drugs.
Most facilities were found to use Aqua safe and water guard tablets to
treat water used in the ANC clinic. In times of stockut of drugs a few
health facilities where found with mechanisms of boiling water. Some
facilities sometimes improvise and use other water containers like
buckets, water jugs among others.
Supervision team intended to establish the source of clean water for the facilities. Apart from Kumi, Wakiso and Mukono
that had a significant number of facilities using tap water, majority depended on ordinary/shallow wells and boreholes
for water. Nakaseke, Bukedea and Kibaale districts had the biggest proportion of facilities depending on wells for water.
Some facilities had water tanks installed or other containers used to harvest rain water.
5
Water safe for drinking is either treated or boiled as opposed to many facilities that equated safe water to clean water e.g. rain water and borehole water
even when its not treated or boiled.
Proportion of facilities with safe water by district
District Name No Opinion
Safe Water
available
No safe
water
AMURIA 8% 77% 15%
BUKEDEA 9% 64% 27%
BULIISA 10% 90%
HOIMA 7% 73% 20%
KABERAMAIDO 14% 57% 29%
KATAKWI 90% 10%
KIBAALE 83% 17%
KIBOGA 15% 75% 10%
KUMI 73% 27%
LUWERO 2% 87% 11%
MASINDI 76% 24%
MPIGI 5% 77% 18%
MUKONO 9% 76% 15%
NAKASEKE 69% 31%
NAKASONGOLA 90% 10%
RAKAI 78% 22%
SOROTI 85% 15%
WAKISO 4% 82% 13%
Total 4% 79% 17%

Stop Malaria Project Uganda
Assessing Malaria Treatment and Control in selected Health Facilities 10
3.1.6 Availability of ANC Cards
The table below provides information on a cross
tabulation of all facilities that indicated that they
provided ANC services on a daily basis and those that
indicated that ANC is not6 daily against whether they
provided ANC cards during ANC visits.
In Amuria district 86% of facilities providing Anc on a
daily basis indicated that they provided ANC cards
while 14% of them do not provide ANC cards. Only
40% of facilities without daily ANC provided cards with
60% of them indicating that they do not provide cards.
Wakiso district had 52% of her facilities that provide
ANC on a daily basis providing cards while 48%
indicating that they do not provide cards. 47% of
Wakiso’s facilities that do not run daily ANC clinics
provides cards while 53% of them don’t provide cards.
All facilities in Masindi that don’t run daily ANC clinics
indicated that they provided cards, while almost all
facilities in Kibaale though they indicated that they run
daily ANC clinics, 50% of them did not provide cards
while 50% did not respond the query.
From the dataset in the above table, one can
conclude that facilities that provide daily ANC services
where found to provide Cards more than their
counterparts that do not run a daily clinic.
6
Some facilities may not be providing services daily but provides it say twice a week.
Proportion of facilities providing ANC services and ANC Cards during visits
District Name
ANC
Daily?
No
Response
Anc Cards
Provided
No Cards
Provides
No ANC
at all
Yes 86% 14% AMURIA
No 40% 60%
Yes 100% BUKEDEA
No 33% 67%
Yes 50% 50% HOIMA
No 100%
Yes 50% 50% KABERAMAIDO
No 33% 67%
Yes 100% KATAKWI
No 38% 63%
KIBAALE Yes 50% 50%
Yes 89% 11% KIBOGA
No 44% 44% 11%
KUMI Yes 93% 7%
Yes 2% 83% 15% LUWERO
No 71% 29%
MASINDI No 100%
MPIGI Yes 83% 17%
Yes 94% 6% MUKONO
No 78% 17% 6%
Yes 86% 14% NAKASEKE
No 60% 40%
Yes 71% 29% NAKASONGOLA
No 33% 33% 33%
Yes 44% 56% RAKAI
No 44% 44% 11%
Yes 45% 55% SOROTI
No 33% 67%
Yes 52% 48% WAKISO
No 47% 53%

Stop Malaria Project Uganda
Assessing Malaria Treatment and Control in selected Health Facilities 11
3.1.7 Record Management of IPTp activities
Amuria district recorded the highest proportion (80%) of facilities that do not record IPTp properly and all of them were
facilities that indicated that their ANC clinic is not open daily. Bukedea district followed the same situation with majority
(67%) of facilities found with poorly recorded IPTp being those that never provides it on a daily basis. This was the same
story in many districts with exception Buliisa, Kiboga Nakaseke and Nakasongola.
From the records most facilities had recorded IPTp properly with exception of few cases where the column for IPT3 was
found missing. Supervisors also observed lack of consistency in recording since registers are not managed by one
person. For example in some facilities IPTp was not recorded immediately and health workers indicated that they fill in
the gaps later on when they get time. Most facilities also experience regular stock out of ANC cards, and they indicated
that under such circumstances they request mothers to buy exercise books.
Proportion of facilities that recorded IPT correctly in the ANC register per district
District Name ANC daily?
Without Opinion
IPTp recorded well
IPTp poorly recorded
NO ANC services
Yes 100% AMURIA
No 20% 80%
Yes 100% BUKEDEA
No 33% 67%
Yes 87% 13% BULIISA
No 100%
Yes 96 % 4% HOIMA
No 78% 22%
Yes 11% 78% 12% KABERAMAIDO
No 67% 33%
Yes 100% KATAKWI
No 75% 25%
Yes 87% 13% KIBAALE
No 13% 62% 25%
Yes 12% 56% 33% KIBOGA
No 89% 12%
KUMI Yes 7% 93%
Proportion of facilities that recorded IPT correctly in the ANC register per district
District Name ANC daily?
Without Opinion
IPTp recorded well
IPTp poorly recorded
NO ANC services
Yes 6% 77% 13.00% 4 % LUWERO
No 57% 43%
Yes 95% 4.80% MASINDI
No 78% 27%
Yes 89% 11 % MPIGI
No 33% 33% 34%
Yes 5.90% 82% 12% MUKONO
No 5% 72% 16% 6%
Yes 100% NAKASEKE
No 20.00% 80.00%
Yes 88.20% 11.80% NAKASONGOLA
No 66.70% 33.30%
Yes 83.30% 16.70% RAKAI
No 66.70% 22.20% 11.10%
Yes 80.00% 20.00% SOROTI No 7.70% 61.50% 30.80%
Yes 7.40% 85.20% 7.40% WAKISO No 88.20% 5.90% 5.90%

Stop Malaria Project Uganda
Assessing Malaria Treatment and Control in selected Health Facilities 12
3.1.8 Utilization of ANC IEC Materials
Generally most facilities had pregnancy posters
displayed in the waiting area for patients to see. It was
rather unfortunate that most of the facilities had no
posters displayed in local language; most of them were
found to be in English. Given the fact that most of these
facilities are rural based, local language based IEC
materials would create more impact since people can
carry the message they carry with them instead of just
looking at pictures. They stand a chance of
misinterpreting which may be fatal to their lives.
From the table it can be observed that Kaberamaido
(57%), Kibaale (54%), Mukono (51%), Nakasongola (45%),
Wakiso (44%) and Soroti (35%) districts had the highest
proportion of facilities which did not have IEC materials
displayed.
Kumi (87%), Katakwi (80%), Amuria (77%), Nakaseke (77%)
Districts had the highest proportion of districts that had facilities with IEC materials with information focusing on mothers
displayed. It was rather unfortunate that most of these facilities had English based posters or IEC materials.
Other districts which significantly need to be supplied with adequate IEC materials are: Masindi, Buliisa, Luwero, Bukedea, Mpigi, Rakai, Katakwi and Kiboga.
Supervisors also observed outdated posters in some facilities hence those supplying ought to replace them with update
posters as recommended by ministry of health. These posters ought to be well hoisted and stacked on facility walls or
notice boards.
Proportion of facilities with IEC materials displayed in the ANC clinic
District Name
No
Response
IEC materials
displayed
No IEC
materials
No
Services
AMURIA 8% 77% 15%
BUKEDEA 64% 27% 9%
BULIISA 10% 60% 30%
HOIMA 10% 59% 29% 2%
KABERAMAIDO 29% 57% 14%
KATAKWI 80% 20%
KIBAALE 8% 38% 54%
KIBOGA 5% 65% 20% 10%
KUMI 7% 87% 7%
LUWERO 6% 64% 30%
MASINDI 6% 52% 39% 3%
MPIGI 7% 64% 25% 5%
MUKONO 6% 38% 51% 6%
NAKASEKE 8% 77% 15%
NAKASONGOLA 50% 45% 5%
RAKAI 11% 67% 22%
SOROTI 6% 56% 35% 3%
WAKISO 2% 49% 44% 4%
Total 6% 57% 34% 3%

Stop Malaria Project Uganda
Assessing Malaria Treatment and Control in selected Health Facilities 13
3.1.9 Dispensation of LLIN through ANC
The malaria control strategic plan 2005/6-2009/10 targeted pregnant women for the distribution of ITN/LLIN particularly
through ANC services. This was expected not only to increase the protection of this vulnerable group but also help
improve the uptake of ANC services in general.
The support supervision carried in the 4th quarter as
represented in the table below shows that only 6% of all the
facilities supervised distributed nets through ANC and 4% were
not sure or never gave their opinion.
It was only Buliisa (20%) Kumi (20%), Wakiso (11%) with
significant number of facilities indicating that they provide
LLNs through ANC.
Most facilities indicated that the government has not
previously supplied facilities with free nets to distribute to
pregnant mothers on a routine basis apart from those that
were distributed sometime back as one off activity. Most
facilities indicated that their patients have previously
benefited from in mass distribution of nets at community level
through local governments and local community leaders and
during child days plus at the health facility. Other distributions
are done occasionally by NGOs and other Programs
mentioned among them were Malaria Consortium, Pace and
Hunger project.
This partly explain why almost all facilities experienced stock out of LLNs. Health workers though indicated that they
continue to sensitize mothers about the importance sleeping under an insecticide treated mosquito net. However they
faced a challenge of prescribing the best quality nets especially when they send mothers to shops and the fact that
most mothers are poor. Nets that are permanently treated are very expensive and the ones in shops that are affordable
are either not treated or poorly treated and are of low quality.
Proportion of Facilities distributing LLNs through ANC
District Name
Without
opinion
LLNs
distributed
No LLNs
distributed
No
services
AMURIA 8% 92%
BUKEDEA 9% 9% 73% 9%
BULIISA 20% 60% 20%
HOIMA 5% 10% 78% 7%
KABERAMAIDO 8% 8% 69% 15%
KATAKWI 100%
KIBAALE 4% 4% 92%
KIBOGA 10% 85% 5%
KUMI 20% 80%
LUWERO 2% 98%
MASINDI 6% 6% 85% 3%
MPIGI 2% 82% 16%
MUKONO 6% 9% 78% 7%
NAKASEKE 8% 8% 85%
NAKASONGOLA 95% 5%
RAKAI 7% 4% 82% 7%
SOROTI 3% 9% 85% 3%
WAKISO 4% 11% 82% 2%
Total 4% 6% 84% 5%

Stop Malaria Project Uganda
Assessing Malaria Treatment and Control in selected Health Facilities 14
3.1.10 Provision of Health Education Talks during ANC
Majority of health facilities supervised in the 4th quarter were found to be providing educational talks about malaria
during ANC visits.
Most districts had higher proportions of facilities
indicating that they provided educational
talks. Districts with significant proportions of
facilities indicating that they do not provide
educational talks during ANC included;
Nakasongola (35%), Luwero (32%) Nakaseke
(31%), Masindi (30%), Kibaale (29%), Amuria
(23%) and Wakiso (22%).
It should be noted however that, it was only a
small number of facilities that could prove that
they actually undertake educational talks. The
few facilities that could prove had plans
displayed on notice boards/facility walls to
notify participants that there will education
talks. Other evidence was found in work plans
and timetables of health workers.
For the majority of health facilities, although
they quickly informed supervisors that they provided general health education talks including malaria, most of them
could neither produce a work plan nor a report as evidence to show that these are the topics and these were the
participants.
A significant number of these facilities indicated that health education is given but not formalized and it’s given on
individual basis as mothers come one at ago. As a way of responding to these some health facilities indicated that they
resorted to organizing educational talks on immunization days when many mothers are expected to attend. Routine
formal education talks at the facility were irregular and most facilities pointed towards lack of teaching aides, malaria
IEC materials and limited staff.
Proportion of facilities that provided educational talks about malaria during ANC
District Name
Without
opinion
Educational
talks provided
No Educational
talks provided
No ANC
Services
AMURIA 77% 23%
BUKEDEA 82% 9% 9%
BULIISA 10% 90%
HOIMA 5% 73% 17% 5%
KABERAMAIDO 78.60% 7% 14%
KATAKWI 10% 80% 10%
KIBAALE 4% 67% 29%
KIBOGA 10% 70% 10.00% 10.00%
KUMI 7% 93%
LUWERO 4% 64% 32%
MASINDI 6% 61% 30% 3%
MPIGI 7% 73% 11% 9%
MUKONO 6% 71% 18% 6%
NAKASEKE 8% 62% 31%
NAKASONGOLA 5% 55% 35% 5%
RAKAI 4% 82% 11% 4%
SOROTI 6% 79% 12% 3%
WAKISO 7% 67% 22% 4%
Total 5% 71% 19% 4%

Stop Malaria Project Uganda
Assessing Malaria Treatment and Control in selected Health Facilities 15
3.2 HEALTH MANAGEMENT INFORMATION SYSTEM7 The Health Management Information System (HMIS) collects data from all health facilities in the public and not-for profit private
sector with respect to curative as well as preventive services. The malaria control strategic plan 2005/6-2009/10 aimed at
improving the collection, quality and utilization of routine data to monitor the implementation of malaria related
interventions hence SMP supervised the existence of HMIS at facility level.
In the support supervision assignment, the team reviewed the existence of data registers at the facilities supervised,
whether reports were made, quality of data collected, existence of personnel, a database and utilization of data.
3.2.1 Existence of up to date HMIS registers.
From the table below majority of districts that were supervised for
HMIS indicated that they had well recorded and updated registers.
Apart from Kibaale where a significant proportion (29%) of facilities
never responded to the question, most facilities had evidence that
they where having updated registers. There were insignificant
proportions of facilities that were found missing OPD, ANC and
inpatients registers.
It should however be pointed out that many facilities indicated that
they experience regular stock outs of pre-printed registers. Counter
books or black books were found to be improvised in facilities as
away of adhering to the requirement.
A significant proportion of facilities were found to have registers but
with anomalies of proper recording. Some registers were found
missing some information like patients weight, client numbers,
headings, reasons for referral and in some instances health workers
were found to be using non conventional abbreviations in recording
data rendered such information unusable to the third party. It was also noted that some facilities improvising registers
were not distinguishing between severe and uncomplicated malaria.
7 It should be noted that data presented in this section is missing the districts of Nakasongola, Nakaseke and Rakai. In addition to that 9 facilities in Mpigi, 24 facilities in Mukono and 5 facilities in Wakiso are also missing. This was attributed to an error in printing the tools used in gathering information. So the user of this
report should put this error into consideration when making decisions regarding these 6 districts on this particular section.
Proportion of facilities with updated HMIS registers
District Name
No
Comment
Registers exist &
up –to-date
No
registers
AMURIA 100%
BUKEDEA 100%
BULIISA 89% 11.1%
HOIMA 5% 95%
KABERAMAIDO 7% 93%
KATAKWI 100%
KIBAALE 29% 71%
KIBOGA 10% 90%
KUMI 93% 7%
LUWERO 17% 81% 2%
MASINDI 18% 82%
MPIGI 3% 91% 6%
MUKONO 3% 97%
SOROTI 12% 79% 9%
WAKISO 3% 98%
Total 9% 89% 2%

Stop Malaria Project Uganda
Assessing Malaria Treatment and Control in selected Health Facilities 16
3.2.2 Completing HMIS Reports Appropriately
Majority (73%) of
facilities in all
districts that
reported that they
kept up-to-date
registers were found
to be compiling
monthly HMIS
summary reports.
It was mainly
Bukedea with a
highest proportion
of facilities that
were less effective
in completing
monthly reports
appropriately.
From the table above OPD forms were filled more compared to the inpatients forms and quarterly summary. With
exception of Masindi and Kibaale districts which were found at least consistently filling summary reports appropriately
for OPD all districts need to vitalize summary reports especially Bukedea district, Kumi, Kaberamaido, Katakwi and
Amuria
It should be noted that a significant proportion of facilities that had updated registers were hesitant to comment about
summary reports. This implies that they also do not fill them hence it points to weaknesses in the general utilization of
information gathered in the registers. In addition there was no evidence of report submission to the district or even a
feedback from the district about the shared data. There was no evidence to show that the reports are utilized in
decision making regarding health unit management and health service delivery.
Of the 383 facilities that SMP supervised their HMIS in the quarter; 42% had recorded their data wrongly, 27% missed the
comparison, it was only 31% of the facilities with properly recorded data and only 13% with exact data8.
8 Wrongly recorded HMIS data had the difference on the HMIS report and the register being greater than +-5, while properly recorded data had the difference
equals or with in +/-5. Exact data was data where there was no difference between HMIS report and the registers.
Proportion of facilities with completed HMIS summary reports in the last three months
HMIS 105-OPD form HMIS 106-Quarterly Summary HMIS 108 In-patients summary
District Month 1 Month 2 Month 3 Month 1 Month 2 Month 3 Month 1 Month 2 Month 3
AMURIA 15% 8% 8% 8% 8% 8%
BUKEDEA
BULIISA 56% 56% 56% 11% 11% 11% 33% 33% 33%
HOIMA 56% 56% 56% 15% 12% 12% 12% 12% 13%
KABERAMAIDO 29% 29% 29% 14% 14% 14% 21% 21% 21%
KATAKWI 20% 20% 10% 10% 10% 10%
KIBAALE 83% 83% 79% 25% 21% 21% 42% 42% 42%
KIBOGA 35% 35% 35% 10% 5% 5% 20% 20% 25%
KUMI 13% 13% 13% 13% 13% 13% 13% 13% 13%
LUWERO 28% 26% 25% 8% 8% 8% 9% 9% 9%
MASINDI 91% 91% 88% 31% 31% 31% 41% 41% 41%
MPIGI 40% 37% 37% 3% 3% 3% 3% 3% 3%
MUKONO 23% 19% 19% 10% 10% 10% 16% 13% 13%
SOROTI 24% 24% 24% 9% 9% 9% 9% 9% 9%
WAKISO 30% 30% 30% 30% 30% 30% 30% 30% 26%

Stop Malaria Project Uganda
Assessing Malaria Treatment and Control in selected Health Facilities 17
3.2.3 Availability of trained HMIS officers
From the table above, Hoima district (81%) had the highest proportion of facilities with HMIS officers at facility; however
30% of them indicated that they were not trained. Kumi had 73% of her facilities having HMIS officers and majority (91%)
of them had received training.
Bukedea district only had 46% of her facilities indicating that they have an HMIS officer and unfortunately only 60% of
them had received training, the 40% indicated that they had not received training.
Although Buliisa (22%), Kaberamaido (29%), and Kiboga (32%) had fewer facilities indicating that they had a HMIS
officer, all the few that existed were found trained.
It should be noted that Masindi (52%), Mukono (31%) Kibaale (33%) and Wakiso (33%) were among the districts that high
proportions of their facilities lacking HMIS officers but at the same times they had higher proportions of untrained HMIS
officers.
Proportion of facilities with HMIS Officers Proportion of facilities whose HMIS officer is trained
District Name
No
comment
HMIS is
available
No HMIS
officer
HMIS
officer? No Comment
HMIS officer was
trained
HMIS officer not
trained
AMURIA 17% 67% 17% Yes 13% 63% 25%
BUKEDEA 46% 55% Yes 60% 40%
BULIISA 22% 78% Yes 100%
HOIMA 81% 20% Yes 70% 30%
KABERAMAIDO 7% 29% 64% Yes 100%
KATAKWI 60% 40% Yes 100%
KIBAALE 67% 33% Yes 69% 31%
KIBOGA 32% 68% Yes 100%
KUMI 73% 27% Yes 9% 91%
LUWERO 8% 45% 47% Yes 13% 79% 8%
MASINDI 6% 42% 52% Yes 7% 64% 29%
MPIGI 3% 38% 59% Yes 83% 17%
MUKONO 69% 31% Yes 9% 55% 36%
SOROTI 56% 44% Yes 11% 90%
WAKISO 68% 33% Yes 11% 56% 32%
Total 3% 55% 42% Total 6% 73% 19%

Stop Malaria Project Uganda
Assessing Malaria Treatment and Control in selected Health Facilities 18
3.2.4 Availability of data management computer
Modern day data management requires electronic gadgets that are used in storing huge some of data. A computer is
one of them. From the table below Very few facilities indicated that they have a computer at the facility dedicated to
management of health information.
Its only Kiboga district (50%) where half of her health facilities accessed a computer for data management. Other
districts Like Kumi (27%), Luwero (25%), Mukono (26%), Soroti (27%), and Wakiso (23%) had only a quarter or less of their
facilities having a data management computer.
It’s important to note that some facilities that indicated to have a computer in many instances their computers where
found either un-utilized or non functional. This was either because they lacked servicing or because they are not
connected to electricity or solar power supply. In some facilities there was no person trained to use them since some of
them are donations.
Proportion of facilities that had a computer for Data management
District No Comment Computer Available No Computer
AMURIA 8% 92%
BUKEDEA 9% 91%
BULIISA 22% 78%
HOIMA 20% 81%
KABERAMAIDO 14% 86%
KATAKWI 20% 80%
KIBAALE 25% 75%
KIBOGA 50% 50%
KUMI 27% 73%
LUWERO 8% 25% 68%
MASINDI 6% 12% 82%
MPIGI 6% 20% 74%
MUKONO 3% 26% 71%
SOROTI 3% 27% 71%
WAKISO 23% 78%
Total 3% 23% 75%

Stop Malaria Project Uganda
Assessing Malaria Treatment and Control in selected Health Facilities 19
3.2.5 Availability of Health Unit Management Committees
From the table above it can be seen that most (82%) facilities where found to have HMUC in all districts. All facilities in
Buliisa, Katakwi and Kumi indicated that they had these committees. Luwero district (28%) had the highest proportion of
facilities without HUMC, followed by Wakiso (23%) and Bukedea (18%).
Bukedea (43%), Amuria (42%), Katakwi (40%) and Kibaale (35%) were among the districts with high proportions of
facilities that indicated that they have a HUMC but don’t meet regularly. Facilities indicated that they face challenges
with holding meeting because of limited funds and lack of commitment from members hence they end up taking long
without holding them. Some facilities hold meetings once a year and others twice a year instead of the recommended
quarterly basis.
Although many facilities indicated that they hold quarterly meetings, in some facilities supervisors failed to find evidence
in form of minutes or reports of the held meetings. There also a general lack of HUMC guidelines for use at the facility.
Majority of facilities (53%) indicated that they do not conduct Self Assessments worst among them being
Kibaale and Bukedea where only 8% and 18% respectively reported that they hardly do self assessments.
Proportion of facilities that had a health unit management committee Proportion of facilities with a functional HUMC
District Name No Comment HUMC exist No HUMC HUMC? No comment HUMC meet HUMC don’t Meet
AMURIA 8% 92% Yes 58% 42%
BUKEDEA 18% 64% 18% Yes 57% 43%
BULIISA 100% Yes 11% 67% 22%
HOIMA 85% 15% Yes 9% 69% 23%
KABERAMAIDO 14% 79% 7% Yes 18% 64% 18%
KATAKWI 100% Yes 10% 50% 40%
KIBAALE 4% 83% 13% Yes 15% 50% 35%
KIBOGA 90% 10% Yes 11% 67% 17%
KUMI 100% Yes 87% 13%
LUWERO 13% 59% 28% Yes 19% 77% 3%
MASINDI 94% 6% Yes 7% 84% 10%
MPIGI 9% 86% 6% Yes 10% 87% 3%
MUKONO 3% 90% 7% Yes 7% 79% 14%
SOROTI 85% 15% Yes 10% 90%
WAKISO 8% 70% 23% Yes 7% 75% 18%
Total 5% 82% 13% Total 10% 72% 17%

Stop Malaria Project Uganda
Assessing Malaria Treatment and Control in selected Health Facilities 20
3.3 CASE MANAGEMENT According to the Malaria operation plan, Key objectives of the Malaria Control strategic plan for 2005-2010 included;
Ensuring universal access to ACTs including patients accessing treatment through the private sector, enhancing the
prompt treatment of children under five within 24 hours of fever onset through the provision of home-based
management of malaria fever using ACT, Reducing the case fatality of severe malaria by establishing a system to
provide highly effective pre-referral treatment and improve the management capacity for severe malaria at health
facilities and hospitals. It also aimed at increasing the proportion of malaria cases confirmed by high quality clinical and parasitological diagnosis guided by feasibility and cost effectiveness.
3.3.1 Availability of trained Staff to Manage Malaria
Proportion of facilities with a given number of trained staff in
uncomplicated malaria
Proportion of facilities with a given number of trained
staff in severe malaria
District Trained Staff?
No Comment One
two-three four-six
Seven -10 Ten+
No Comment One
two-three four-six
Seven-ten Ten+
AMURIA Yes 40% 40% 20% 20% 20% 40% 10% 10%
BUKEDEA Yes 20% 50% 20% 10% 20% 40% 20% 10% 10%
BULIISA Yes 67% 11% 22% 33% 22% 22% 11% 11%
HOIMA Yes 26% 11% 37% 26% 11% 14% 37% 34% 3%
KABERAMAIDO Yes 9% 9% 36% 9% 9% 9% 9% 55% 9% 27%
KATAKWI Yes 50% 38% 13% 38% 38% 13% 13%
KIBAALE Yes 55% 20% 15% 5% 5% 15% 15% 25% 25% 5% 15%
KIBOGA Yes 47% 6% 24% 12% 12% 38% 6% 44% 6% 6%
KUMI Yes 20% 7% 7% 47% 13% 7% 20% 13% 20% 33% 7% 7%
LUWERO Yes 32% 35% 19% 11% 3% 24% 43% 19% 11% 3%
MASINDI Yes 48% 13% 19% 10% 6% 3% 10% 26% 29% 29% 6%
MPIGI Yes 11% 40% 20% 20% 9% 14% 26% 23% 29% 9%
MUKONO Yes 74% 16% 7% 2% 27% 30% 9% 32% 2%
NAKASEKE Yes 11% 22% 33% 22% 11% 11% 11% 22% 22% 22% 11%
NAKASONGOLA Yes 14% 14% 36% 29% 7% 14% 36% 29% 14% 7%
RAKAI Yes 60% 5% 20% 10% 5% 24% 14% 19% 33% 10%
SOROTI Yes 17% 25% 42% 17% 4% 8% 8% 25% 38% 17% 4%
WAKISO Yes 36% 9% 21% 27% 3% 3% 42% 9% 18% 18% 12%
79% (381) of the facilities supervised indicated that they had at least a staff trained in management of malaria cases. It
was 12% of facilities that indicated that they had no trained staff. The table above represents data on the number of
staff in uncomplicated malaria and severe malaria. Most facilities had between 1and 6 staff members
trained.

Stop Malaria Project Uganda
Assessing Malaria Treatment and Control in selected Health Facilities 21
3.3.2 Utilization of treatment guidelines in treatment of malaria
In June 2005, after a study
on the malaria treatment
policy took a decision to
change the policy on
malaria treatment from
Chloroquine +
Sulfadoxine/Pyrimethamine
combination to Artemisinin-
based Combination
Therapies (ACTs).
Artemether/Lumefantrine is
henceforth the first line
treatment for
uncomplicated malaria
and Artesunate +
Amodiaquine the
alternative. Parenteral
quinine is the
recommended treatment
for severe and
complicated malaria and
Sulfadoxine/Pyrimethamine
is the recommended medicine for Intermittent Preventive Treatment (IPT) during pregnancy the policy reads. Guidelines
in line with the new policy were developed and were expected to be distributed to most of the health facilities.
From the table above most facilities in all the districts were found to be using the clinical and treatment guidelines. It
should be pointed out that Bukedea (46%), Kaberamaido (36%), Mpigi (32%), Amuria (31%), Katakwi (30%) and Kibaale
(29%) districts had significant proportions of facilities indicating that they hardly follow the guidelines. This was partly
attributed to limited supply of first line drugs hence they often get out of stock leaving HW with no alternative.
50% of the facilities in Nakaseke and Kibaale districts, followed by 36% and 35% of Luwero and Soroti respectively were
among the districts with high proportions of facilities having no clinical and treatment guidelines in the OPD
and IPW. Some facilities were found with 2003 guidelines which are outdated.
Proportion of facilities with health workers treating
according National Malaria treatment guidelines
Proportion of facilities with Malaria
guidelines in the OPD and IPW
District Name
No
Comment
Guidelines
followed
Guidelines
Not followed
No
Comment
Guidelines
in OPD &IPW
No guidelines in
OPD & IPW
AMURIA 69% 31% 77% 23%
BUKEDEA 55% 46% 73% 27%
BULIISA 90% 10% 90% 10%
HOIMA 5% 81% 15% 2% 78% 20%
KABERAMAIDO 64% 36% 79% 21%
KATAKWI 70% 30% 80% 20%
KIBAALE 71% 29% 4% 46% 50%
KIBOGA 80% 20% 15% 60% 25%
KUMI 100% 93% 7%
LUWERO 17% 62% 21% 4% 60% 36%
MASINDI 9% 73% 18% 67% 33%
MPIGI 9% 59% 32% 2% 48% 50%
MUKONO 84% 16% 4% 67% 29%
NAKASEKE 8% 69% 23% 46% 54%
NAKASONGOLA 10% 65% 25% 55% 45%
RAKAI 11% 70% 19% 4% 70% 26%
SOROTI 91% 9% 6% 59% 35%
WAKISO 4% 89% 7% 4% 80% 16%
Total 5% 75% 20% 3% 66% 31%

Stop Malaria Project Uganda
Assessing Malaria Treatment and Control in selected Health Facilities 22
3.3.3 Malaria Treatment based on Laboratory Diagnosis
The Malaria treatment policy advocates for no more
presumptive treatment of malaria by Cleary stating that;
The diagnosis of malaria will largely be dependent on
history and physical examination. Blood slide
microscopy was to remain the “gold” standard for
malaria laboratory diagnosis. Rapid diagnostic tests
(RDTs) were to be used in special situations such as
malaria epidemics and mass population
displacements9.
Apart from Kumi and Bukedea district the rest of the
districts had considerable proportions of their facilities
indicating that they do not use laboratory diagnosis in
management of malaria cases which is adjacent to the
malaria treatment policy 2005.
Amuria (69%), Nakaseke (54%) Hoima (51%) Buliisa (50%),
Kibaale (50%), Luwere (49%) were among the districts
with majority of their health facilities indicating that
malaria treatment is not laboratory based.
Some of the above facilities indicated that they were lacking functional laboratories to help in the diagnosis of Malaria.
Other facilities indicated that they rely on clinical treatment which mainly uses signs and symptoms. And in some
facilities were laboratories were existent faced challenges of stock out of reagents and inability/reluctance of patients
to meet the laboratory costs hence a hardship in replenishment of laboratory supplies.
Almost all facilities supervised indicated that their facilities are open all the time and that health workers are on duty 24
hours a day and 7 days a week. Supervisors later on discovered that it was hard for health workers supervised to inform
the team that some days the facility is closed and staff off duty. A more triangulated approach about consistent
functionality of the facility and availability of health workers may be thought about in the next quarter supervision.
9
National Policy on Malaria Treatment 2005
Proportion of facilities that treated malaria based on lab diagnosis
District Name No
Response Lab Diagnosis
based Not Lab diagnosis
based
AMURIA 31% 69%
BUKEDEA 91% 9%
BULIISA 50% 50%
HOIMA 49% 51%
KABERAMAIDO 71% 29%
KATAKWI 70% 30%
KIBAALE 50% 50%
KIBOGA 55% 45%
KUMI 87% 13%
LUWERO 6% 45% 49%
MASINDI 3% 49% 49%
MPIGI 41% 59%
MUKONO 62% 38%
NAKASEKE 46% 54%
NAKASONGOLA 50% 50%
RAKAI 63% 37%
SOROTI 59% 41%
WAKISO 58% 42%
Total 1% 55% 44%

Stop Malaria Project Uganda
Assessing Malaria Treatment and Control in selected Health Facilities 23
3.3.4 Referral of Emergency Cases
It is a general rule in the health service provision for HWs to
provide some type of assistance for transporting a sick person to
a referral facility, such as communicating to the next level,
providing ambulance, arranging community transport and
or/funds for public means.
From the table below Buliisa (70%), followed by Bukedea,
Mukono (62%), Soroti (56%) Katakwi (50%) and Kibaale(50%)
districts exhibited the higher proportions of their facilities
indicating that they did not have a systematic and consistent
referral mechanism for emergency cases. Other districts with
significant number of their facilities indicating that they did not
have a referral system included; Masindi (49%), Mpigi (48%),
Nakaseke (46%), Nakasongola (45%), Luweero (36%) Kiboga
(35%), Hoima (32%) and Amuria (31%).
Facilities that indicated that they have a referral system were
found to be located within smaller distances to the HSD or the
district hospital where they easily can an ambulance. Some
facilities especially HCIVs had ambulances only that most of
them would demand for fuel from patients in case of an
emergency. Some like in Masindi had broken down and required
repair
In most facilities supervised, it was incumbent on the patient or care takers to find transport in case of emergency
situations. Among the private means mentioned during the activity included Taxis and Bodabodas.
Many facilities did not have referral forms neither referral maps, caretakers just need to take heed of an instruction to
take the patient to a given higher level facility without any kind of support.
Proportion of Facilities with a referral system for
emergency cases
District Name
No
Response
Referral system
Available
No Referral
System
AMURIA 69% 31%
BUKEDEA 36% 64%
BULIISA 30% 70%
HOIMA 5% 63% 32%
KABERAMAIDO 71% 29%
KATAKWI 50% 50%
KIBAALE 4% 46% 50%
KIBOGA 10% 55% 35%
KUMI 87% 13%
LUWERO 2% 62% 36%
MASINDI 3% 49% 49%
MPIGI 11% 41% 48%
MUKONO 38% 62%
NAKASEKE 54% 46%
NAKASONGOLA 5% 50% 45%
RAKAI 4% 74% 22%
SOROTI 3% 41% 56%
WAKISO 7% 69% 24%
Total 4% 54% 41%

Stop Malaria Project Uganda
Assessing Malaria Treatment and Control in selected Health Facilities 24
3.3.5 Facility Clinical Audit
Clinical audit is a quality improvement process that seeks to improve patient care and outcomes through systematic
review of care against explicit criteria and the implementation of change. The clinical audit process seeks to identify
areas for health service improvement, develop & carry out action plans to rectify or improve service provision and then
to re-audit to ensure that these changes have an effect.
From the table above Kumi (87%), Katakwi (80%), Kaberamaido (79%), Bukedea (64%), Amuria (62%) and Soroti (50%)
districts had the highest proportion of their facilities indicating that they had a trained staff in clinical audit. However
apart from Kumi (85%) and Kaberamaido (73%) majority of health facilities in these districts had never done a clinical
audit. On the other hand, districts like Buliisa (75%), Kiboga (75%) and Mukono (62%) which had lower proportions of their
facilities having trained staff in clinical audit were among the districts which had more facilities indicating to have done
clinical audit. There was no evidence to show that audit was done since most facilities had no action plans.
Proportion of facilities with a trained staff in
clinical audit
Proportion of facilities with a trained staff that ever
conducted a clinical audit
District Name
No
Response
Staff
trained
No staff
trained Trained?
No
Response
Clinical
audit Done
No Clinical
audit done
AMURIA 62% 39% Yes 25% 75%
BUKEDEA 9% 64% 27% Yes 100%
BULIISA 40% 60% Yes 75% 25%
HOIMA 7% 27% 66% Yes 64% 36%
KABERAMAIDO 79% 21% Yes 9% 73% 18%
KATAKWI 80% 20% Yes 13% 88%
KIBAALE 4% 29% 67% Yes 57% 43%
KIBOGA 5% 20% 75% Yes 75% 25%
KUMI 87% 13% Yes 85% 15%
LUWERO 6% 21% 74% Yes 55% 46%
MASINDI 39% 61% Yes 15% 85%
MPIGI 5% 25% 71% Yes 9% 36% 46%
MUKONO 24% 76% Yes 62% 39%
NAKASEKE 39% 62% Yes 40% 60%
NAKASONGOLA 35% 65% Yes 14% 29% 57%
RAKAI 4% 44% 52% Yes 8% 33% 50%
SOROTI 50% 50% Yes 6% 35% 59%
WAKISO 4.40% 26.70% 68.90% Yes 8% 42% 50%
Total 2.90% 36.10% 60.60% 4% 47% 48%

Stop Malaria Project Uganda
Assessing Malaria Treatment and Control in selected Health Facilities 25
3.3.6 Monthly Malaria Case Management
From the table above, it can be seen that with exception of Wakiso (64%) and Rakai (52%) districts most districts had
majority of their facilities indicating that they do no carry out monthly malaria case management. Most facilities
indicated that although they carry out monthly CMEs, they had not been particular or specific on malaria. Other
facilities indicated that they are not consistently doing CMEs on a monthly basis but rather on a quarterly basis.
It’s important to note that it was had for supervisors to verify previous activities in CME because most facilities hardly had
any report and or action plans to help in decision making or reporting to the district.
Proportion of facilities that conduct monthly Malaria Case
Management
District Name
No
Response
Does Case
Management
No Case
Management
AMURIA 15% 85%
BUKEDEA 18% 82%
BULIISA 40% 60%
HOIMA 10% 20% 71%
KABERAMAIDO 14% 36% 50%
KATAKWI 40% 60%
KIBAALE 8% 29% 63%
KIBOGA 20% 15% 65%
KUMI 7% 47% 47%
LUWERO 11% 42% 47%
MASINDI 6% 24% 70%
MPIGI 11% 39% 52%
MUKONO 56% 26% 18%
NAKASEKE 23% 77%
NAKASONGOLA 75% 10% 15%
RAKAI 15% 52% 33%
SOROTI 12% 29% 59%
WAKISO 7% 64% 29%
Total 18% 33% 50%

Stop Malaria Project Uganda
Assessing Malaria Treatment and Control in selected Health Facilities 26
3.4 LABARATORY MANAGEMENT Improving laboratory services and promoting accurate diagnosis of malaria at
community level saves lives and prevent wastage of valuable resources. Increasing
levels of resistance to cheap, first-line antimalarials means that many health workers
now promote new, more expensive treatment in the form of Artemisinin-based
Combination Therapies (ACTs).
The importance of accurate diagnosis of all the major diseases cannot be
underestimated, and efficient laboratory testing is vital to identifying and treating life-
threatening illnesses. Laboratory services in many rural areas are often run down and
yet they are critical for public health, disease control and surveillance as well as
guiding patient diagnosis and care.
Poor quality laboratory services have the greatest negative impact on poor and
vulnerable people because these people carry the largest burden of ill health. The
effective diagnosis of malaria and other life-threatening illnesses at both community
and laboratory level helps in reducing this burden. There is indirect evidence to
suggest that the mismanagement of malaria and other fevers contributes to a vicious cycle of deepening poverty and
increasing ill health in Uganda.
3.4.1 Availability of Functional Laboratory at the Facility
According to the national health system, all HCIIIs, HIVs and hospitals are expected to be running a functional
laboratory or designate a place for carrying out laboratory tests. From the data set all hospitals supervised in all districts
had functional laboratories. Majority of HCIVs with exception of 2 facilities in Wakiso had Labaratories. Kibaale (8/24)
had the highest number of HCIIIs, followed by Mpigi (6/44) and Wakiso (6/45). Other districts had 1 or 2 HCIII only
indicating that they miss a functional laboratory.
Most facilities that were found with a functional laboratory had testing protocol available at the lab. Its important to
point out that, Mukono (45%), Mpigi (30%), Luwero (29%), Hoima 27%), Kaberamaido (25%) and Nakasongola (25%) were
among the districts with significant proportions of their facilities found without testing protocols.
Through out all districts there were a few pockets of health centers with laboratories that had faulty
equipment and missing/off duty personnel hence not being fully utilized.

Stop Malaria Project Uganda
Assessing Malaria Treatment and Control in selected Health Facilities 27
3.4.2 Availability of Skilled Human Resources
All facilities that indicated that had functional laboratories were found to have skilled personnel, with capacity to make
all diagnoses required. It was Kiboga district, Bukedea, Hoima, Luwero, Mpigi, Nakasongola and Soroti with 1 or 2
facilities indicating that they did not have a skilled personel. It should be noted however that some of the facilities that
did not have laboratory facilities indicated that they have personnel with skills in the subject. These facilities were from
Amuria, Bukedea, Kaberamaido, Buliisa, Mukono and Wakiso districts.
The biggest proportion of facilities in all districts indicated that they had not had their technicians to train specifically in
Microscopy/RDT either as assistants or as technicians. However there were considerable proportions of facilities that
indicated that they had 1-3 staff members who had accessed the required training as assistants and technicians.
However this was mostly true with HCIII and above in the health system.
Proportion of facilities with skilled staff in laboratory Management
District Functional
Lab? No Response
Skilled staff available
Staff not Available District
Functional Lab?
No Response
Skilled staff available
Staff not Available
Yes 100% KUMI Yes 100% AMURIA
No 100% Yes 4% 89% 7%
Yes 89% 11% LUWERO
No 100% BUKEDEA
No 100% MASINDI Yes 100%
Yes 14% 86% Yes 4% 87% 9% BULIISA
No 50% 50% MPIGI
No 14% 86%
Yes 4% 89% 8% Yes 13% 84% 3% HOIMA
No 14% 14% 72% MUKONO
No 29% 29% 43%
Yes 100% Yes 100% KABERAMAIDO
No 33% 33% 33% NAKASEKE
No 100%
Yes 100% Yes 8% 83% 8% KATAKWI
No 100% NAKASONGOLA
No 90%
Yes 100% Yes 100% KIBAALE
No 100% RAKAI
No 100%
Yes 8% 75% 17% Yes 12% 84% 4% SOROTI
No 100%
Yes 100% KIBOGA
No 33% 66% WAKISO
No 9% 36% 54%

Stop Malaria Project Uganda
Assessing Malaria Treatment and Control in selected Health Facilities 28
3.4.3 Techniques used in Diagnosis of Malaria
Diagnosis of malaria involves identification of malaria parasites or its
antigens/products in the blood of the patient. The diagnosis of malaria is
confirmed by blood tests and can be divided into microscopic and non-
microscopic tests.
Microscopy: For nearly a hundred years, the direct microscopic visualization
of the parasite on the thick and/or thin blood smears has been the
accepted method for the diagnosis of malaria in most settings, from the
clinical laboratory to the field surveys. The careful examination of a well-
prepared and well-stained blood film currently remains the "gold standard"
for malaria diagnosis.
Microscopy was found to be the most widely used technique in diagnosing
malaria in all districts. Most facilities supervised were found to be using a binocular type of microscope, with monocular types reported in a few
facilities in Masindi, Bukedea and Kibaale.
Rapid Diagnostic Tests: These tests are based on the capture of the parasite antigens from the peripheral blood using either monoclonal or polyclonal antibodies against the parasite antigen targets. Currently, immunochromatographic tests can target the histidine-rich protein 2 of P.
falciparum, a pan-malarial Plasmodium aldolase, and the parasite specific lactate dehydrogenase. These RDTs do not require a laboratory, electricity, or any special equipment. A good number of facilities in Luwero, Kumi, Katakwi and Amuria indicated that they sometimes use RDTs. Some facilities recommended the method for being helpful in rural areas and during emergency cases however they indicated dissatisfaction with the inability of the method to quantify the number of malaria parasites, and that sometimes the strips fail to react or they react after a long period. Quantitative Buffy Coat (QBC) tests: The QBC Test, involves staining of the centrifuged and compressed red cell layer with acridine orange and its examination under UV light source. It is fast, easy and claimed to be more sensitive than the traditional thick smear examination. The method was reported to be used by a few facilities in Buliisa, Katakwi, Luwero and Kibaale but still not as the main method for malaria diagnosis.
Techniques used to diagnose malaria
District Microscopy RDT QBC
AMURIA 83% 25%
BUKEDEA 73% 18%
BULIISA 60% 20% 10%
HOIMA 49% 5%
KABERAMAIDO 71% 7%
KATAKWI 40% 20% 10%
KIBAALE 54% 13% 4%
KIBOGA 55% 5%
KUMI 80% 27%
LUWERO 49% 11% 4%
MASINDI 61% 3%
MPIGI 46% 7%
MUKONO 67% 11% 2%
NAKASEKE 62% 15%
NAKASONGOLA 50% 10%
RAKAI 74% 4%
SOROTI 74% 3%
WAKISO 62% 20% 2%
Total 60% 10% 2%

Stop Malaria Project Uganda
Assessing Malaria Treatment and Control in selected Health Facilities 29
3.4.4 Maintenance of Laboratory Equipment
Microscopes; Depending on their use, microscopes should receive routine service once, twice, or even four times a
year. Microscopes need; complete cleaning of all optical surfaces, lubrication of all moving mechanisms, adjustments
and realignments and thorough cleaning of all external surfaces. Repairs and replacement of Power Cords, Outlets and
Voltage many times are required. Since most users are not trained in handling and maintenance of these delicate
machines breakdowns are expected since.
Apart from Luwero, Bukedea and Buliisa, every district had four or more facilities reporting to have a faulty microscope.
Although some were found to have broken down, there is a problem with maintenance of these machines. Facilities in
Amuria had taken more than a year when the microscope ran down, in Hoima about 4 microscopes had spent over 2
years, Kibaale had 1 facility with a microscope which has been for 6 years and other 2 for 3 years and the same story
goes in almost all districts.
There seemed to be no plan for maintenance plans apart from when JMS, Malaria Consortium or Baylor and other
NGOS/programs offer support. Otherwise most facilities pointed to regional hospital equipment mechanics that were
found to be very irregular and less prompt.
3.4.5 Preparation of Stains used in Laboratory
Most facilities in all districts indicated that stains come when they are commercially prepared from Joint medical stores
or National Medical Stores supplied by the districts. However many facilities with exception of those from Luwero district
indicated that stains is prepared by Laboratory staff at the facility.
Most facilities were found using the positive and negative standard control to quality assure stains especially in Amuria,
Hoima, Kumi and in Kiboga they indicated that they use the unknown slides to quality assure the stains. Other facilities
indicated that they keep a sample and take it to next level facility say at the district for quality assurance.
It is important to point out that, guidelines on quality assurance of stains and slides needs to be made known and
displayed to ensure quality for the benefit of patients. Otherwise, whereas some districts send their malaria focal person
to monitor the quality of slides in facilities, other facilities rely on keeping the positive slides to use them as a control
measure for others. A common guideline known to all facilities and laboratory assistants need to be promulgated if not
formulated.

Stop Malaria Project Uganda
Assessing Malaria Treatment and Control in selected Health Facilities 30
3.4.6 Management of Laboratory Data
Data management practices aims at strengthening practices of documentation, analysis, utilization and sharing of
laboratory data generated at facility level: this may involve; Storage and retrieval of patient files, Compilation, analysis
and utilization of medical data in Malaria treatment, periodic summary reports to districts and Synthesis of interventions
that have led to improvement and those that have not.
From the table above its evident that most facilities indicated that they correctly record the medical records in the
laboratory registers however there was little evidence for analysis and summary reports for utilization at the facility. This
was is mainly attributed to limited access to electronic data management practices, which may easily analyse an
present reports as opposed to the currently used manual methods of data capture.
Proportion of facilities with a functional laboratory that enters lab data correctly
District Name Functional
Lab? No Response
Data is recorded correctly
Data is not recorded correctly
AMURIA Yes 90% 10%
BUKEDEA Yes 33% 56% 11%
BULIISA Yes 86% 14%
HOIMA Yes 15% 65% 20%
KABERAMAIDO Yes 100%
KATAKWI Yes 25% 75%
KIBAALE Yes 93% 7%
KIBOGA Yes 8% 75% 17%
KUMI Yes 100%
LUWERO Yes 18% 68% 15%
MASINDI Yes 5% 77% 19%
MPIGI Yes 9% 91%
MUKONO Yes 11% 79% 11%
NAKASEKE Yes 75% 25%
NAKASONGOLA Yes 33% 67%
RAKAI Yes 10% 91%
SOROTI Yes 8% 88% 4%
WAKISO Yes 3% 90% 6%

Stop Malaria Project Uganda
Assessing Malaria Treatment and Control in selected Health Facilities 31
3.4.7 Availability of Staff Trained in Logistics Management
The table shows information of health facilities
that indicated that their staff had received
training in logistics management. From the data
set a cross tabulation of facilities and their
responses on whether they had a functional
laboratory against their opinion on having a
trained staff was done.
Bukedea (22%) Rakai (29%)and Buliisa(29%), had
the lowest proportion of facilities with trained
staff in logistics management. Masindi and
Nakasongola followed with only 32% and 33% of
facilities with trained staff in Logistics
Management.
District
Functional
Lab?
No
Response
Trained staff
available
No staff
trained
Not
Applicable
Yes 60% 40% AMURIA
No 100%
Yes 22% 22% 56% BUKEDEA
No 100%
BULIISA Yes 14% 29% 57%
Yes 15% 39% 47% HOIMA
No 14% 14% 71%
Yes 13% 38% 50% KABERAMAIDO
No 33% 67%
Yes 75% 25% KATAKWI
No 100%
Yes 57% 43% KIBAALE
No 13% 50% 38%
Yes 25% 58% 17% KIBOGA
No 67% 33%
KUMI Yes 17% 50% 33%
Yes 32% 50% 18% LUWERO
No 33% 67%
MASINDI Yes 14% 32% 55%
Yes 22% 44% 34% MPIGI
No 14% 57% 29%
Yes 34% 47% 18% MUKONO
No 57% 43%
Yes 25% 50% 25% NAKASEKE
No 50% 50%
Yes 17% 33% 50% NAKASONGOLA
No 33% 67%
Yes 29% 29% 43% RAKAI
No 100%
Yes 12% 48% 40% SOROTI
No 33% 67%
Yes 24% 41% 31% 3% WAKISO
No 9% 9% 82%

Stop Malaria Project Uganda
Assessing Malaria Treatment and Control in selected Health Facilities 32
3.5 DRUG VERIFICATION Proper inventory management of malaria drugs is essential in the malaria control program. All health facilities are
required to have stock cards to assist staff in monitoring the supply of selected essential malaria treatment supplies. In
this assessment quantities on Stock cards were compared with actual physical count at facility stores.
Availability updated stock cards; with exception of Bukedea, most
facilities in all districts indicated that they had updated stock cards.
Nakaseke district also had only 46% of the facilities in the district
reporting to have updated stock cards, a significant number 31%
would hardly respond to the query.
Stock out cases of Malaria drugs; most HCII and HCIII indicated that
they rarely consistently get supply of essential drugs. Sometimes they
may get supplies after a month and when they receive supplies
they are always inadequate. “…We experienced Stock Out before, we received drugs in august
and ran up to middle of September and at the moment they are out
of stock Again” Lamented the in charge of Ngariam HCIII in Katakwi
District.
Whereas some facilities where complaining about stock out of
coartem, SP and IV quinine some facilities had them in stock for the
last three months.
Proportion of facilities with updated stock cards
District No Response
Stock cards available
No updated stock cards
AMURIA 23% 62% 15%
BUKEDEA 9% 18% 73%
BULIISA 100%
HOIMA 17% 83%
KABERAMAIDO 15% 77% 8%
KATAKWI 20% 80%
KIBAALE 8% 75% 17%
KIBOGA 91% 9%
KUMI 7% 93%
LUWERO 32% 53% 15%
MASINDI 27% 70% 3%
MPIGI 31% 67% 2%
MUKONO 9% 89% 2%
NAKASEKE 39% 46% 15%
NAKASONGOLA 15% 80% 5%
RAKAI 23% 77%
SOROTI 18% 71% 12%
WAKISO 2% 87% 11%
Total 18% 74% 8%

Stop Malaria Project Uganda
Assessing Malaria Treatment and Control in selected Health Facilities 33
3.6 IEC VERIFICATION Effective communication is the basis of behavior change for all stakeholders, their families, community leaders, program
managers and service providers. Mobilizing the communities, local, regional and national as well as political and
religious leaders to play an active role in malaria control and ensuring proper understanding of the core interventions by
the population and promoting positive change of behaviors is the major purpose of advocacy, IEC & social mobilization
malaria control strategy.
3.6.1Availability of Malaria Specific Health Education Talks
Although significant proportions of facilities especially in
Nakaseke (39%), Luwero (37%), Bukedea (36%), Kibaale (33%),
Masindi (33%), Nakasongola (32%) and Amuria (31%) indicated
that they do not provide educational talks to their clients,
majority of facilities in all districts indicated that educational talks
about malaria are provided.
It should however be noted that in almost all the facilities that
provided educational talks, there were no clear planning for
educational activities. Health workers indicated that they find
challenges with mobilizing people hence they conduct them
once in-a-while. In Soroti district most facilities only offered
malaria educational talks in OPD and ANC and during
community meetings. In Nakaseke district there are no formal
educational talks but patients are advised on key strategies to
fight malaria and it’s a one on one basis.
Availability of teaching aides: with exception of Kumi district where 87% of facilities indicated that they had job aides to help in implementation of health education, significant proportions of facilities in most districts did not have malaria teaching aides
probably this is part of the reasons to keep malaria education informal.
Availability of a health educator/Assistant attached to the facility: Facilities in Buliisa indicated that the health assistant is available and visits the facilities however in other districts most facilities indicated that health assistants are attached to their facilities but they are very irregular and has made limited contributions in malaria ED.
Proportion of facilities that gave malaria education talks to patients
District No Comment Talks available No Talks
AMURIA 69% 31%
BUKEDEA 9% 55% 36%
BULIISA 100%
HOIMA 7% 63% 29%
KABERAMAIDO 100%
KATAKWI 10% 70% 20%
KIBAALE 67% 33%
KIBOGA 10% 70% 20%
KUMI 100%
LUWERO 13% 49% 37%
MASINDI 67% 33%
MPIGI 86% 14%
MUKONO 82% 18%
NAKASEKE 62% 39%
NAKASONGOLA 68% 32%
RAKAI 4% 85% 12%
SOROTI 3% 82% 15%
WAKISO 4% 89% 6%
Total 4% 75% 22%

Stop Malaria Project Uganda
Assessing Malaria Treatment and Control in selected Health Facilities 34
3.6.2 Community Awareness activities about Malaria
Health facilities are expected to conduct community awareness
activities with the aim of informing families on malaria prevention and
protection through supporting community initiatives such as
Information Education & Communication and Behaviour Change
Communication.
With exception of Bukedea and Katakwi districts Community
awareness activities in use of LLNS, sanitation, IPTp, Malaria treatment
and treatment seeking behavior was largely proportionately low in all
districts. Hoima district and Nakasongola had no single facility
reporting to carry community awareness activities.
Many facilities especially in Wakiso, Rakai, Nakaseke, Kibaale and
Soroti indicated that the work of community sensitization requires
resources because it requires mobilisation of the communities hence
making it a little had for health facilities to organize regular sensitization meetings. Such facilities indicated that
community awareness activities are now limited to activities of the health assistant with VHTs and during community
outreaches.
There were only few facilities in all districts that were found using health facility data in planning community awareness
activities. This was attributed to the less importance of health facility data in making decisions in regard to client service
in all districts. Data collected at health facilities is corrected because it’s mandatory and is prepared for the district and
MOH.
It was only Katakwi and Kumi districts with majority of their facilities indicating that they use IEC materials during
community sensitization. In all other districts it was only a few facilities where malaria related materials for the community
are available especially with the health assistant.
Higher proportions of health facilities that indicated that they carry out health education and had no reports are in the
data set. It was only Kumi (54%) with majority facilities indicating that they shared health education reports with the
district and at the facility other districts had negligible proportions of facilities conducting health education and sharing
reports with the DHE/DHI.
Stop Malaria Project Uganda
Assessing Malaria Treatment and Control in selected Health Facilities 35
3.7 SUPPORT SUPERVISION Supportive supervision is a proven approach that helps transfer knowledge to practice and that ensures that learning
continues beyond the traditional training setting. Through routine visits, supervisors can provide follow-up training to
improve performance and solve other systemic problems that contribute to poor malaria management. The ultimate
goal is a sustainable system that works with supervisors to give health workers the consistent guidance and mentoring
they need to implement and maintain a safe and effective malaria program.
Proportion of facilities that received supervision from upper levels Proportion of facilities that carried out support supervision to lower
level HFs
District No Response Received Supervision No Supervision No Response Carried out Supervision Did not carry out supervision
Not Applicable
AMURIA 15% 23% 62% 8% 15% 77%
BUKEDEA 82% 18% 9% 18% 36% 36%
BULIISA 10% 90% 10% 10% 20% 60%
HOIMA 5% 83% 12% 7% 15% 37% 42%
KABERAMAIDO 9% 82% 9% 9% 9% 55% 27%
KATAKWI 100% 10% 30% 40% 20%
KIBAALE 70% 30% 17% 35% 48%
KIBOGA 5% 60% 35% 5% 25% 45% 25%
KUMI 7% 93% 7% 40% 53%
LUWERO 2% 89% 9% 2% 19% 26% 53%
MASINDI 6% 85% 9% 3% 12% 36% 49%
MPIGI 16% 73% 11% 9% 14% 30% 48%
MUKONO 2% 93% 6% 7% 36% 33% 24%
NAKASEKE 8% 85% 8% 17% 50% 33%
NAKASONGOLA 95% 5% 20% 35% 45%
RAKAI 7% 89% 4% 7% 41% 30% 22%
SOROTI 9% 79% 12% 12% 27% 38% 24%
WAKISO 2% 80% 18% 2% 44% 36% 18%
Total 5% 82% 13% 6% 24% 36% 34%
From the table above it can be seen that with exception of Amuria District, a big proportion of facilities in the rest of the
districts indicated that they had received support supervision in the previous quarter. In Buliisa facilities mentioned
support supervision to have been carried out by IDI, Baylor College and MOH. However most support supervision done
was not malaria specific except when it is done by Stop Malaria Project.
Wakiso district (44%) and Rakai district (41%) and Mukono (36%) had the highest proportion of facilities that
indicated that they had carried out supervision to lower level health facilities.

Stop Malaria Project Uganda
Assessing Malaria Treatment and Control in selected Health Facilities 36
4.0 RECOMMENDED ACTION POINTS o Proposed areas for Improvement
o Proposed Action to be taken

Stop Malaria Project Uganda
Assessing Malaria Treatment and Control in selected Health Facilities 37
5.0 APPENDICES