
ASSESSING INHERENT HEALTH HAZARD FOR PROPOSED … · ASSESSING INHERENT HEALTH HAZARD FOR PROPOSED...
13
Jurnal Teknologi, 39(F) Dis. 2003: 53–65 © Universiti Teknologi Malaysia ASSESSING INHERENT HEALTH HAZARD FOR PROPOSED PLANTS H. MIMI* Abstract. Proper selection of chemical process route is one of the main design decisions during the preliminary stages of chemical plant design. Previously, the most important factor for selecting the best chemical process route was only the economics. But now, safety, environmental and health issues have become important factors to be considered. Health risks on workers could also be reduced by proper selection of chemical process route. However, the health hazards needed to be quantified in order to choose the ‘healthiest’ route. Process Route Healthiness Index (PRHI) has been developed to foresee the potential health hazards from chemical processes. PRHIP ranks process routes in terms of their occupational healthiness. The higher the index, the higher is the hazard. PRHI is influenced by the health impact due to chemical releases and the concentration of airborne chemicals inhaled by workers. In this article, PRHI has been applied on six alternative routes for Methyl Methacrylate (MMA). The results of the ranking was compared to the Inherent Safety Index, Environmental Hazard Index and production costs for the six alternative chemical process routes. Keywords: Occupational health hazard, assessment method, ISHE, ranking index Abstrak. Di peringkat awal reka bentuk loji kimia, keputusan paling penting dan kritikal yang perlu dibuat adalah ketika pemilihan proses kimia yang bakal digunakan untuk penghasilan produk yang dikehendaki. Sebelum ini, ekonomi merupakan faktor yang diberi keutamaan dalam pemilihan proses kimia yang terbaik. Sebaliknya kini, faktor kesihatan, keselamatan serta alam sekitar merupakan isu penting yang menjadi tumpuan dan amat dititikberatkan dalam pengoperasian sesebuah loji. Risiko ke atas kesihatan para pekerja di kawasan loji berikutan terdedah kepada bahan-bahan kimia di tempat kerja dapat dikurangkan melalui pemilihan proses kimia yang betul. Proses yang paling ‘sihat’ dapat dikenal pasti dengan menjumlahkan ancaman ke atas kesihatan manusia. Dalam projek ini, PRHI telah diperkenalkan untuk menjangka potensi ancaman proses kimia ke atas kesihatan pekerja. Proses alternatif yang wujud bagi menghasilkan produk yang sama akan disusun berdasarkan tahap kesihatan yang dihasilkan oleh setiap proses. Lebih tinggi nilai indeks yang diperolehi, maka lebih berbahayalah sesuatu proses itu. Nilai PRHI dikira berdasarkan pelepasan bahan kimia serta kuantiti bahan kimia yang dihidu oleh pekerja. Indeks yang telah dibangunkan dalam projek ini diaplikasikan ke atas enam proses kimia alternatif yang wujud bagi menghasilkan metil metakrilat (MMA). Keputusan bagi pengiraan PRHI ini kemudiannya dibandingkan dengan Inherent Safety Index (ISI), Environmental Hazard Index serta kos penghasilan produk bagi kesemua enam proses alternatif. Kata kunci: ISHE, teknik penilaian keselamatan loji * Department of Chemical Engineering, Universiti Teknologi Malaysia, Skudai, Malaysia JTKK39F5[baru].pmd 2/16/07, 7:33 PM 53
Transcript of ASSESSING INHERENT HEALTH HAZARD FOR PROPOSED … · ASSESSING INHERENT HEALTH HAZARD FOR PROPOSED...

ASSESSING INHERENT HEALTH HAZARD FOR PROPOSED PLANTS 53
Jurnal Teknologi, 39(F) Dis. 2003: 53–65© Universiti Teknologi Malaysia
ASSESSING INHERENT HEALTH HAZARD FOR PROPOSEDPLANTS
H. MIMI*
Abstract. Proper selection of chemical process route is one of the main design decisions duringthe preliminary stages of chemical plant design. Previously, the most important factor for selecting thebest chemical process route was only the economics. But now, safety, environmental and health issueshave become important factors to be considered. Health risks on workers could also be reduced byproper selection of chemical process route. However, the health hazards needed to be quantified inorder to choose the ‘healthiest’ route. Process Route Healthiness Index (PRHI) has been developed toforesee the potential health hazards from chemical processes. PRHIP ranks process routes in terms oftheir occupational healthiness. The higher the index, the higher is the hazard. PRHI is influenced by thehealth impact due to chemical releases and the concentration of airborne chemicals inhaled by workers.In this article, PRHI has been applied on six alternative routes for Methyl Methacrylate (MMA). Theresults of the ranking was compared to the Inherent Safety Index, Environmental Hazard Index andproduction costs for the six alternative chemical process routes.
Keywords: Occupational health hazard, assessment method, ISHE, ranking index
Abstrak. Di peringkat awal reka bentuk loji kimia, keputusan paling penting dan kritikal yangperlu dibuat adalah ketika pemilihan proses kimia yang bakal digunakan untuk penghasilan produkyang dikehendaki. Sebelum ini, ekonomi merupakan faktor yang diberi keutamaan dalam pemilihanproses kimia yang terbaik. Sebaliknya kini, faktor kesihatan, keselamatan serta alam sekitar merupakanisu penting yang menjadi tumpuan dan amat dititikberatkan dalam pengoperasian sesebuah loji.Risiko ke atas kesihatan para pekerja di kawasan loji berikutan terdedah kepada bahan-bahan kimia ditempat kerja dapat dikurangkan melalui pemilihan proses kimia yang betul. Proses yang paling ‘sihat’dapat dikenal pasti dengan menjumlahkan ancaman ke atas kesihatan manusia. Dalam projek ini,PRHI telah diperkenalkan untuk menjangka potensi ancaman proses kimia ke atas kesihatan pekerja.Proses alternatif yang wujud bagi menghasilkan produk yang sama akan disusun berdasarkan tahapkesihatan yang dihasilkan oleh setiap proses. Lebih tinggi nilai indeks yang diperolehi, maka lebihberbahayalah sesuatu proses itu. Nilai PRHI dikira berdasarkan pelepasan bahan kimia serta kuantitibahan kimia yang dihidu oleh pekerja. Indeks yang telah dibangunkan dalam projek ini diaplikasikanke atas enam proses kimia alternatif yang wujud bagi menghasilkan metil metakrilat (MMA). Keputusanbagi pengiraan PRHI ini kemudiannya dibandingkan dengan Inherent Safety Index (ISI), EnvironmentalHazard Index serta kos penghasilan produk bagi kesemua enam proses alternatif.
Kata kunci: ISHE, teknik penilaian keselamatan loji
* Department of Chemical Engineering, Universiti Teknologi Malaysia, Skudai, Malaysia
JTKK39F5[baru].pmd 2/16/07, 7:33 PM53
H. MIMI54
1.0 INTRODUCTION
A chemical process route can be defined as a system involving raw material(s) andthe sequence of reactions that converts them to the desired product(s)[1]. To avoid anyundesirable accidents or hazardous events from occurring, it is better to design a newplant which is inherently safe, rather than to install control systems for an existingplant.
Nowadays, health issue has been taken as one of the most important factors toconsider when designing a chemical plant apart from safety and environmental issues.Industrialists have seriously taken into consideration the importance of health effectsto the workers exposed. Introduction of Inherent Safety, Health and Environment(ISHE) concept by Trevor Kletz [2] underlines the need to consider health factor asone of the most important priority when selecting chemical process route.
The earlier the healthiness of a proposed plant is taken into account, the greaterwould be the benefits. Based on the ISHE concept, the potential hazards from all thealternative production routes could be identified early. This is indeed crucial since thechoice of a process route fixes the chemicals present in a plant, and hence, its healthiness.
2.0 DEFINITION OF PRHI
The level of health hazard posed by a chemical plant is influenced by two basic factors:
(1) The type of chemical substance present(2) The amount of chemicals released
The PRHI for each route is calculated using the basis stated above, by evaluatingthe exposures and effects of each chemical in each route. In this report, chemicalexposure is defined as the amount of chemicals released due to pipe leakage.Calculations of chemical concentration being inhaled by workers is one of the mostcritical steps in PRHI. This is due to the fact that some chemicals are harmless in asmall quantity but can be very hazardous if they exist in a large quantity. Paracelsuswrote, ‘All substances are poison. There is none which is not poisonous. The rightdose differentiates a poison from a remedy’ [3].
The PRHI of each route is given by:
max
min
WECHHIPRHI ICPHIMHI OEL
= × × (1)
3.0 METHODOLOGY
3.1 Potentially Harmful Activities and Process Conditions
Different routes may involve different activities that could possibly expose workers tochemicals more frequently. For the assessment purpose, each activity is assigned a
JTKK39F5[baru].pmd 2/16/07, 7:33 PM54

ASSESSING INHERENT HEALTH HAZARD FOR PROPOSED PLANTS 55
Table 1 Summary of penalty for activities or operations
Activities or operations Range Penalty
Transportation Pipes 1Bag 2
Drums 3
Vibration 4
Mode of process Continuous 1
Semi-continuous 2
Batch 3
Sampling On-line analyser 1
Collect from close loop 2
Runs volatile liquid on pad 3
Venting or flaring Scrub vent effluent 1
Above occupiable platform level 2
Occupiable platform level 3
Maintenance works No 0
Yes 1
Others Extrusion 3
Air open mixing 3
Solid handling 2
Size reduction 2
Agitation 1
Others 1
penalty. Higher penalty indicates higher hazards posed by the activity performed (SeeTable 1).
JTKK39F5[baru].pmd 2/16/07, 7:33 PM55

H. MIMI56
Table 2 Summary of penalty for proses conditions
Conditions Range Penalty
Temperature High (> 92°C) 1Low 0
Pressure (atm) Low 0High (> 68 atm) 1
Viscosity High (0.1–1 cp) 3Medium (1–10 cp) 2Low (10–100 cp) 1
Ability to precipitate Yes 1No 0
Density difference High (0–2.5 sg) 3Medium (0–1.5 sg) 2Low (0–1 sg) 1
Ability to cause corrosion Yes 1No 0
Volume changes High (33–50%) 3Medium (25–32%) 2Low (>25%) 1
Solubility Yes (50%) 1No 0
Material State Powder 4Granules 3Slurry 2Liquid 1Gas 0
Potentially harmful conditions will arise as a result of the inherent chemical andphysical properties, which are intrinsic in the materials involved. Like activities, theseprocess conditions are also given a penalty based on their severity. (See Table 2)
3.2 Ability to Cause Typical Occupational Diseases
Occupational Health and Safety Association (OSHA), Health Code (HC) and HealthEffects (HE) list principal effects of exposure of each substance, which is based on guidelinein their Field Operations Manual, OSHA Instruction CPL 2.45B, chapter IV, 1989 [4]. TheHE values range from 1 to 20, with 1 representing the most severe health effects. The effectsbecome less severe as the value approaches to 20. To ensure the penalty system is consistant,in that a high value would indicate the more severe situations, the 21-HE code penaltysystem will be applied for health effects (See Table 3).
JTKK39F5[baru].pmd 2/16/07, 7:33 PM56

ASSESSING INHERENT HEALTH HAZARD FOR PROPOSED PLANTS 57
3.3 Material Harmful Index
For assessing occupational health hazard, only value for health was taken as the MaterialHarmful Index, which ranges from 1 to 4. In order for the penalty system to remainconsistent, the penalties were inverted, and a value of 4 – NFPAhealth was used.
MHI = 4 – NFPAhealth (2)
4.0 ESTIMATING THE WORKER EXPOSURECONCENTRATION (WEC)
There are two possible quantifiable sources of chemical emissions into workplace;small leaks and fugitive emission. General ventilation rate (Equation (3)) used in the
Table 3 Ranking matrix for occupational disease
Diseases Severity RankingPenalty
Cancer—Currently regulated by OSHA as carcinogen HE 1 20Chronic (Cumulative) Toxicty—Known or Suspected animal orhuman carcinogen, mutagen (except Code HE1 chemicals) HE 2 19
Chronic (Cumulative) Toxicity—Long-term organ toxicity otherthan nervous, respiratory, hematologic or reproductive HE 3 18
Acute Toxicity—Short-term high risk effects HE 4 17Reproductive Hazards—Teratogenesis or other reproductiveimpairment HE 5 16
Nervous System Disturbances—Cholinesterase inhibition HE 6 15Nervous System Disturbances—Nervous system effects other thannarcosis HE 7 14
Nervous System Disturbances—Narcosis HE 8 13Respiratory Effects Other Than Irritation—Respiratory sensitization(asthma or other) HE 9 12
Respiratory Effects Other Than Irritation—Cumulative lung damage HE 10 11Respiratory Effects—Acute lung damage/edema or other HE 11 10Hematologic (Blood) Disturbances—Anemias HE 12 9Hematologic (Blood) Disturbances—Methemoglobinemia HE 13 8Irritation-Eyes, Nose, Throat, Skin—Marked HE 14 7Irritation-Eyes, Nose, Throat, Skin—Moderate HE 15 6Irritation-Eyes, Nose, Throat, Skin—Mild HE 16 5Asphyxiants, Anoxiants HE 17 4Explosive, Flammable, Safety (No adverse effects encounteredwhen good housekeeping practices are followed) HE 18 3
Generally Low Risk Health Effects—Nuisance particulates, vapoursor gases HE 19 2
Generally Low Risk Health Effects—Odour HE 20 1
Taken from OSHA web page, http://www.osha-slc.gov/dts/chemicalsampling/field.html
JTKK39F5[baru].pmd 2/16/07, 7:33 PM57

H. MIMI58
estimation will not likely be less than 0.2 mixing air changes per hour (ACH) and willmost likely not be higher than 30 ACH. 0.2 ACH is considered as worst-case scenariowhereas 30 ACH is the best-case scenario [5].
Ventilation rate, Q = ACH × (room volume) (3)
Hypothetical worker will respire at a rate of 20 liters per minute, which is equivalentto 10 m3 of air inhaled in an 8-hour workday [6]. This corresponds to an average-sizeman working on a moderate rate [7]. Chemicals from small leakage is assumed to bediffused into a 10-m3 volume of air. However, concentration of chemicals inhaled byexposed workers should have been diluted via the dilution factor, and not by theconcentration of materials at leakage point.
4.1 Determining Airborne Quantity via a Small Leak
Three possible sources of airborne via small leaks in the workplace that might beinhaled by the workers are:
(i) Airborne from Gaseous Release
The following equation, based on the sonic gas flow rate equation, is used to estimatethe airborne quantity for a gas release [8].
6 24.751 10273avg
g a
MWAQ D P
T−= ×
+(4)
(ii) Airborne from Flashing Liquids
This is possible when the leakage in a plant involves liquid instead of gaseous. Theamount of liquid spill needs to be quantified first using Equation (5) [8].
7 29.44 10 1000 g lL D P ρ−= × (5)
The diameter, D in the equation can have a maximum value of ¼” because holeformation of ¼” size is possible in various process equipment. [4] Part of liquids withlow boiling points may instantaneously flash into a vapor. The flashed portion can beestimated via Equation (6) by assuming that the vaporization process is adiabatic.
( ) = −
p
v s bv
CF T T × L
H (6)
JTKK39F5[baru].pmd 2/16/07, 7:33 PM58
ASSESSING INHERENT HEALTH HAZARD FOR PROPOSED PLANTS 59
(iii) Airborne Evaporated from the Pool Surface
Total liquid releases was calculated by assuming that the pool would reach its finalsize after 15 minutes [8].
WT = 900 L (7)
Then, the size of puddle spreading out on the ground was estimated.
A 100 p
l
Wρ
= (8)
Airborne Quantity evaporated from the pool surface, AQp is given by:
( ) ( )4 0 959 0 10273
−= ×+
.. vp p
MW PAQ A
T(9)
Fugitive Emissions
Fugitive emissions are ‘leaks’ that occur wherever there are discontinuities in the solidbarrier that maintains containment. It can also be defined as emissions that cannot becaught by a capture system [9]. Fugitive emissions are quantified using AverageEmission Factor Approach developed by the Environment Protection Agency. Equation(10) is used to estimate TOC mass emissions from all of the equipment in a stream ofa given equipment type.
E TOC = FA × WF TOC × N (10)
Workplace Concentration (WC) can be estimated using Equation (11) based on allthe values calculated before.
1
max 3 1min
( ) kg.h( )
5 m h
SM FESM FEWC
Q
−
−++
= = (11)
1
min 3 1min
( ) kg.h( )
300 m h
SM FESM FEWC
Q
−
−++
= = (12)
In order to obtain WEC, Workplace Concentration (WC) should be corrected withthe estimated exposure time, EET.
jj i
EETWEC WC
AWD= × (13)
JTKK39F5[baru].pmd 2/16/07, 7:33 PM59
H. MIMI60
5.0 ESTIMATION OF THE OCCUPATIONAL EXPOSURE LIMIT(OEL)
For materials with no Occupational Exposure Limit (OEL) or Threshold Limit Value(TLV) available due to lack of data, the values should be estimated. The collectedOEL values for each compound are used to calculate the average OEL for the outputstream from main reaction stage.
OELavg = All i component OELi × MFi (14)
6.0 CASE STUDIES
The index developed was tested on the MMA process. There are six main routesavailable to produce methyl methacrylate:
• Acetone Cyanohydrin Route (ACH)• Ethylene via Propionaldehyde Route (C2/PA)• Ethylene via Methyl Propionate Route (C2/MP)• Propylene Route (C3)• Isobutylene Route (i-C4)• Tertiary Butyl Alcohol Route (TBA)
7.0 RESULTS AND DISCUSSION
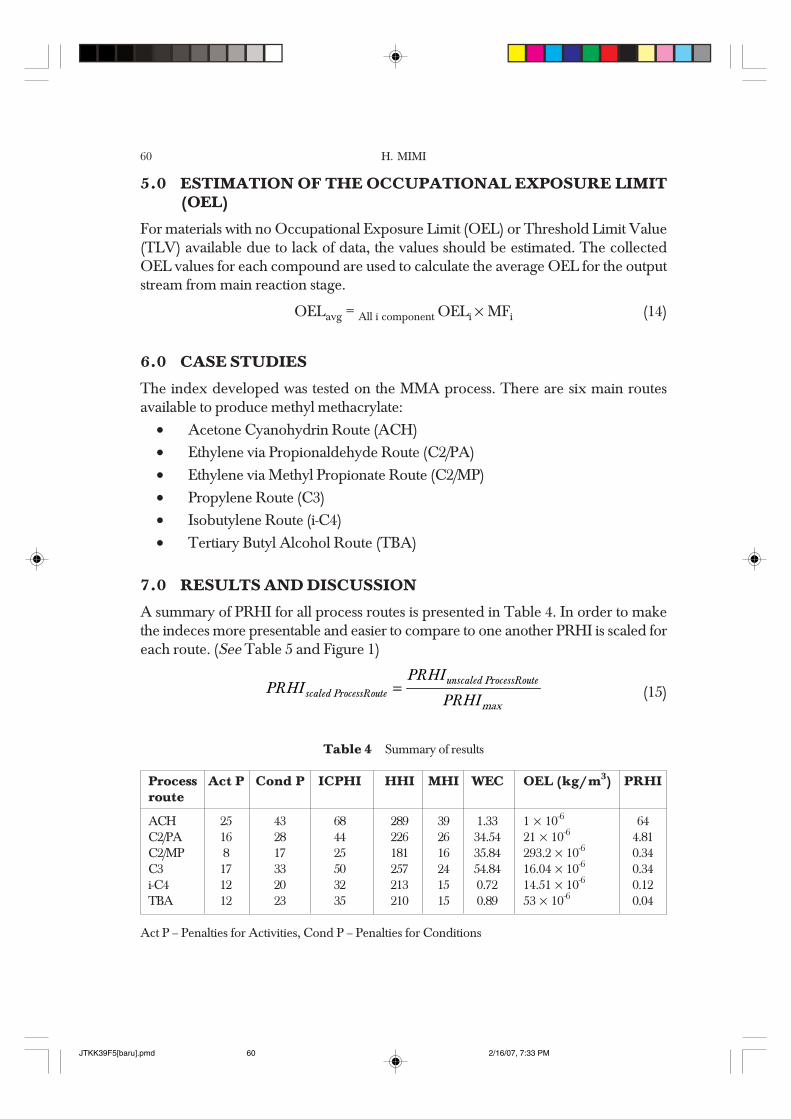
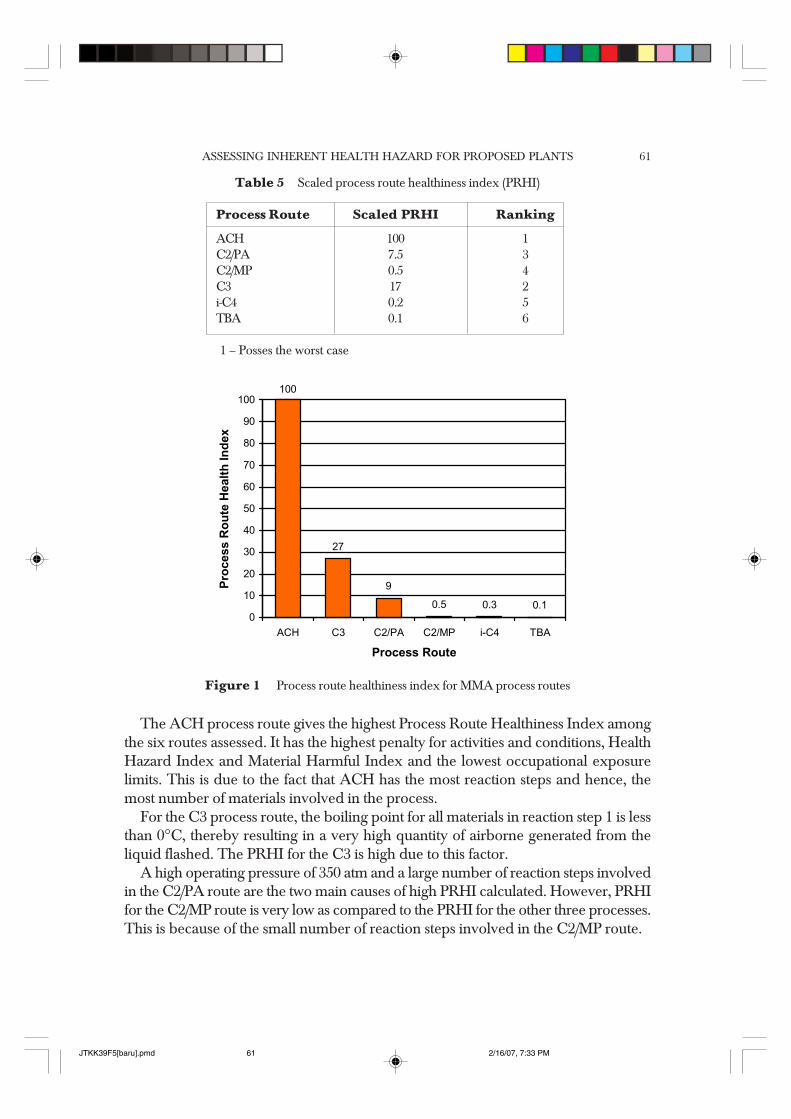
A summary of PRHI for all process routes is presented in Table 4. In order to makethe indeces more presentable and easier to compare to one another PRHI is scaled foreach route. (See Table 5 and Figure 1)
= PrPr
max
unscaled ocessRoutescaled ocessRoute
PRHIPRHI
PRHI (15)
Table 4 Summary of results
Process Act P Cond P ICPHI HHI MHI WEC OEL (kg/m3) PRHIroute
ACH 25 43 68 289 39 1.33 1 × 10⁻⁶ 64C2/PA 16 28 44 226 26 34.54 21 × 10-6 4.81C2/MP 8 17 25 181 16 35.84 293.2 × 10⁻⁶ 0.34C3 17 33 50 257 24 54.84 16.04 × 10⁻⁶ 0.34i-C4 12 20 32 213 15 0.72 14.51 × 10⁻⁶ 0.12TBA 12 23 35 210 15 0.89 53 × 10-6 0.04
Act P – Penalties for Activities, Cond P – Penalties for Conditions
JTKK39F5[baru].pmd 2/16/07, 7:33 PM60
ASSESSING INHERENT HEALTH HAZARD FOR PROPOSED PLANTS 61
The ACH process route gives the highest Process Route Healthiness Index amongthe six routes assessed. It has the highest penalty for activities and conditions, HealthHazard Index and Material Harmful Index and the lowest occupational exposurelimits. This is due to the fact that ACH has the most reaction steps and hence, themost number of materials involved in the process.
For the C3 process route, the boiling point for all materials in reaction step 1 is lessthan 0°C, thereby resulting in a very high quantity of airborne generated from theliquid flashed. The PRHI for the C3 is high due to this factor.
A high operating pressure of 350 atm and a large number of reaction steps involvedin the C2/PA route are the two main causes of high PRHI calculated. However, PRHIfor the C2/MP route is very low as compared to the PRHI for the other three processes.This is because of the small number of reaction steps involved in the C2/MP route.
Table 5 Scaled process route healthiness index (PRHI)
Process Route Scaled PRHI Ranking
ACH 100 1C2/PA 7.5 3C2/MP 0.5 4C3 17 2i-C4 0.2 5TBA 0.1 6
1 – Posses the worst case
Figure 1 Process route healthiness index for MMA process routes
100
27
9
0.5 0.3 0.10
10
20
30
40
50
60
70
80
90
100
ACH C3 C2/PA C2/MP i-C4 TBA
Process Route
Proc
ess
Rou
te H
ealth
Inde
x
JTKK39F5[baru].pmd 2/16/07, 7:33 PM61

H. MIMI62
The i-C4 process route is more or less the same with the TBA route in terms of theprocess conditions and the materials involved. The only difference is the usage of tert-butyl alcohol as the raw material in TBA process route and isobutylene in i-C4 processroute. The latter poses higher health effects to human than the tert-butyl alcohol.
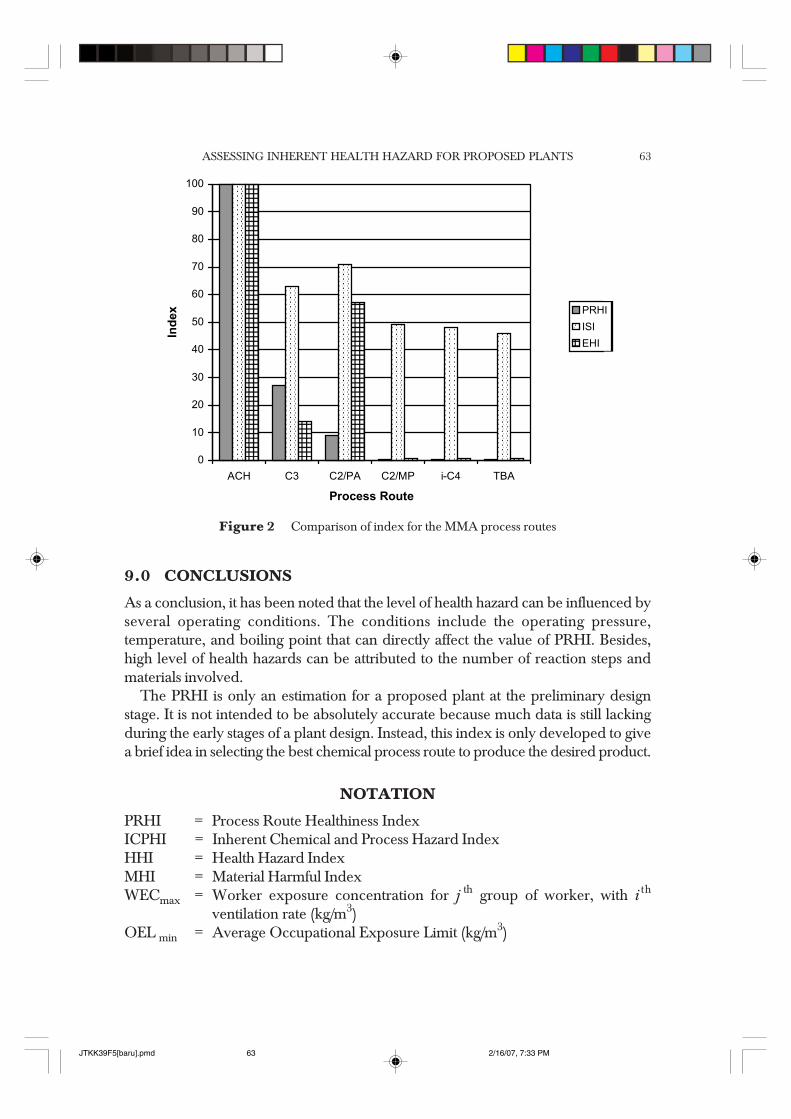
8.0 COMPARING PRHI WITH ISI, EHI AND COP
Edwards and Lawrence had assessed the routes to MMA in term of their inherentsafety and cost of production (COP)[1]. Index Safety Index (ISI) had been developedto rank MMA process routes in terms of inherent safety. The cost of production index,COP ranked the economics of the six process routes of MMA on the basis of producingone tonne with a return on investment of 20%. Sion Cave had developed another indexcalled Environmental Hazard Index (EHI)[10]. EHI is a dimensionless number, whichindicates the potential environmental hazards for a given route. Like PRHI; the higherthe EHI, the higher the hazards. A comparison of the routes based on PRHI, COP,ISI and EHI is shown in Table 6.
Table 6 Comparison of safety, health, environmental and cost indexes
Order Scaled PRHI COP ISI EHI
Worst process ACH ACH ACH ACHC3 C2/PA C2/PA C2/PA
C2PA i-C4 C3 C3Best process C2/MP C3 C2/MP C2/MP
i-C4 TBA i-C4 TBATBA C2/MP TBA i-C4
Based on the comparison, the ACH is the least safe, healthy and environmentallyfriendly process with the highest cost of production. The ranking order for the ISI isvery similar to that for the PRHI. The only difference is in the order of the C3 and C2/PA. Routes ranking in the PRHI are different from that of the ISI and the EHI sincethe two latter indices are fundamentally based on the inventory of the routes whereasPRHI does not consider inventory in the assessment. The similarity of the calculationmethods in ISI and EHI resulted in the similarity in terms of the ISI and the EHIranking (See Figure 2).
JTKK39F5[baru].pmd 2/16/07, 7:33 PM62
ASSESSING INHERENT HEALTH HAZARD FOR PROPOSED PLANTS 63
9.0 CONCLUSIONS
As a conclusion, it has been noted that the level of health hazard can be influenced byseveral operating conditions. The conditions include the operating pressure,temperature, and boiling point that can directly affect the value of PRHI. Besides,high level of health hazards can be attributed to the number of reaction steps andmaterials involved.
The PRHI is only an estimation for a proposed plant at the preliminary designstage. It is not intended to be absolutely accurate because much data is still lackingduring the early stages of a plant design. Instead, this index is only developed to givea brief idea in selecting the best chemical process route to produce the desired product.
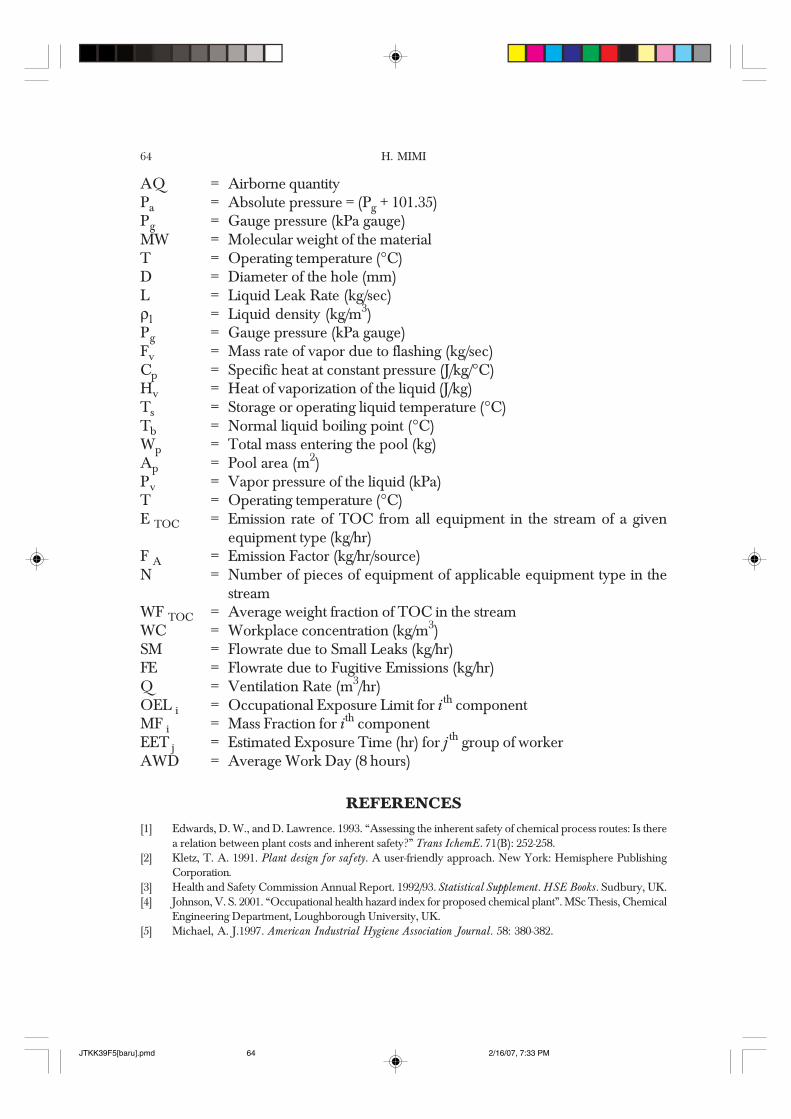
NOTATION
PRHI = Process Route Healthiness IndexICPHI = Inherent Chemical and Process Hazard IndexHHI = Health Hazard IndexMHI = Material Harmful IndexWECmax = Worker exposure concentration for j th group of worker, with i th
ventilation rate (kg/m3)OEL min = Average Occupational Exposure Limit (kg/m3)
Figure 2 Comparison of index for the MMA process routes
������������������������������������������������������������������������������������������������������������������
������������������������������������������������������������������������������
��������������������������������������������������������������������������������������������������
������������������������������������������������������������
������������������������������������������������������������
������������������������������������������������������������
������������������������������������������������������������������������������������������������������������������
������������������������
������������������������������������������������������������������������ ������ ������ ������0
10
20
30
40
50
60
70
80
90
100
ACH C3 C2/PA C2/MP i-C4 TBA
Process Route
Inde
x PRHI����ISI����EHI
JTKK39F5[baru].pmd 2/16/07, 7:33 PM63
H. MIMI64
AQ = Airborne quantityPa = Absolute pressure = (Pg + 101.35)Pg = Gauge pressure (kPa gauge)MW = Molecular weight of the materialT = Operating temperature (°C)D = Diameter of the hole (mm)L = Liquid Leak Rate (kg/sec)ρl = Liquid density (kg/m3)Pg = Gauge pressure (kPa gauge)Fv = Mass rate of vapor due to flashing (kg/sec)Cp = Specific heat at constant pressure (J/kg/°C)Hv = Heat of vaporization of the liquid (J/kg)Ts = Storage or operating liquid temperature (°C)Tb = Normal liquid boiling point (°C)Wp = Total mass entering the pool (kg)Ap = Pool area (m2)Pv = Vapor pressure of the liquid (kPa)T = Operating temperature (°C)E TOC = Emission rate of TOC from all equipment in the stream of a given
equipment type (kg/hr)F A = Emission Factor (kg/hr/source)N = Number of pieces of equipment of applicable equipment type in the
streamWF TOC = Average weight fraction of TOC in the streamWC = Workplace concentration (kg/m3)SM = Flowrate due to Small Leaks (kg/hr)FE = Flowrate due to Fugitive Emissions (kg/hr)Q = Ventilation Rate (m3/hr)OEL i = Occupational Exposure Limit for i th componentMF i = Mass Fraction for ith componentEET j = Estimated Exposure Time (hr) for j th group of workerAWD = Average Work Day (8 hours)
REFERENCES[1] Edwards, D. W., and D. Lawrence. 1993. “Assessing the inherent safety of chemical process routes: Is there
a relation between plant costs and inherent safety?” Trans IchemE. 71(B): 252-258.[2] Kletz, T. A. 1991. Plant design for safety. A user-friendly approach. New York: Hemisphere Publishing
Corporation.[3] Health and Safety Commission Annual Report. 1992/93. Statistical Supplement. HSE Books. Sudbury, UK.[4] Johnson, V. S. 2001. “Occupational health hazard index for proposed chemical plant”. MSc Thesis, Chemical
Engineering Department, Loughborough University, UK.[5] Michael, A. J.1997. American Industrial Hygiene Association Journal. 58: 380-382.
JTKK39F5[baru].pmd 2/16/07, 7:33 PM64
ASSESSING INHERENT HEALTH HAZARD FOR PROPOSED PLANTS 65
[6] Nolan, R. J., W. T. Stott, and P. G. Wantanabe. 1995. “Toxicologic data in chemical safety evaluation”.In: Patty’s Industrial Hygiene and Toxicology. L. J. Cralley, J. S. Bus; Eds. Volume III, Part B, 3rd ed. NewYork: John Wiley & Sons, Inc., pp 40.
[7] Dinman, B. D. 1991. “The mode of absorption, distribution, and elimination of toxic materials”. In: Patty’sIndustrial Hygiene and Toxicology. G. D. Clayton, F. E. Clayton, Eds. Volume 1, Part A, 4th ed., New York:John Wiley & Sons, Inc., pp 222.
[8] Chemical Exposure Index Guide. 1993. Corporate S/LP/S, Electronic (Revised June 1997).[9] Lipton, S., and J. Lynch. 1987. Health hazard control in the chemical process industry. USA: John Wiley &
Sons, Inc.[10] Cave, S. R., and D. W. Edwards. 1997. “Chemical process routes selection based on assessment of inherent
environmental hazard”. Computers Chemical Engineering. 21: S965 – S970
JTKK39F5[baru].pmd 2/16/07, 7:33 PM65