Assessing Hurricane Sandy Impacts on Benthic Habitats in ...
18
Assessing Hurricane Sandy Impacts on Benthic Habitats in Barnegat Bay with New Topographic-Bathymetric Lidar Technology Jenn Dijkstra, Lindsay McKenna, Chris Parrish
Transcript of Assessing Hurricane Sandy Impacts on Benthic Habitats in ...

Assessing Hurricane Sandy Impacts on Benthic Habitats in Barnegat Bay with New Topographic-Bathymetric
Lidar Technology
Jenn Dijkstra, Lindsay McKenna, Chris Parrish

Hurricane Sandy
Landfall- October 29, 2012 Cost: 50 billion dollars in damages Most of the damage was focused the coastal
zones of New York, New Jersey and Connecticut

Project Goal
• Investigate the effects of Hurricane Sandy on benthic habitats using topo-bathy lidar
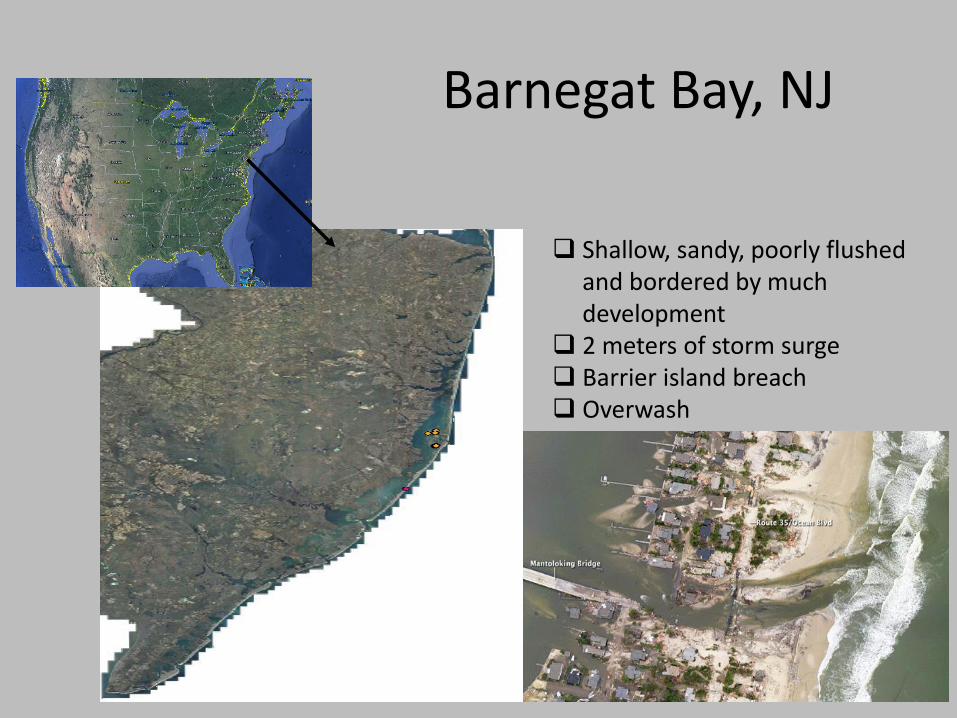
Barnegat Bay, NJ
Shallow, sandy, poorly flushed and bordered by much development
2 meters of storm surge Barrier island breach Overwash
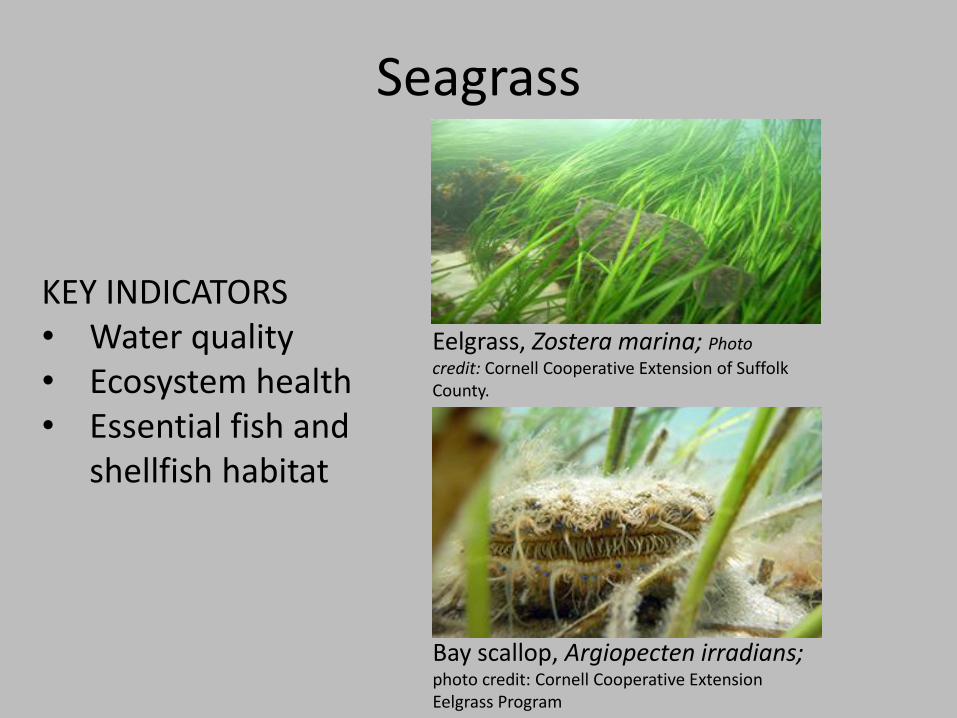
Seagrass
KEY INDICATORS• Water quality• Ecosystem health• Essential fish and
shellfish habitat
Eelgrass, Zostera marina; Photo
credit: Cornell Cooperative Extension of Suffolk County.
Bay scallop, Argiopecten irradians; photo credit: Cornell Cooperative Extension Eelgrass Program

Benthic Habitats

• Emerging class of topo-bathy lidarsystem
– Occupies middle ground between conventional topographic and bathymetric systems:
• Narrow beam, low power, small FOV, very high sampling rates
• Focus is on shallow water and environmental applications
• Why of interest to NOAA & partners?
– Uniquely suited for shoreline mapping
• Seamless, high-resolution data across backshore, intertidal, and nearshoremarine zones
– Fill in shallow water gap (shoreward of NALL line)
– SLR analysis, inundation modeling
– Habitat mapping
– Riverine mapping
– Coastal zone management, coastal science => IOCM!
Topo-Bathy Lidar

• Compute (ideally in real-time) features related to return waveform shape (amplitude, width, etc.)• For V-line systems, Riegl computes 2 features and stores them in LAS Extra Bytes: “reflectance” and “pulse deviation”• Grid these features and use resultant raster layers in habitat classification
Use of Waveform Features for Habitat Mapping
Parrish, C.E. et al. 2014. Geoscience and Remote Sensing Letters, Vol. 11, No. 2, pp. 569-573.

June 2013 Airborne Data Acquisition
NOAA DeHavilland Twin Otter (DHC-6)NOAA Hawker Beechcraft King Air 350ER
Sept 2013 Airborne Data Acquisition
Furthest aft: Riegl VQ-820-G topo bathy lidar. Foreground: Applanix DSS DualCam digital aerial camera
Left: Riegl LMS Q-680, Right: RieglVQ-820-G

Study Locations
BathymetryWaveform Features Pulse Shape Deviation Reflectance
Aerial Imagery

Ground Truth
Recorded: Site GPS points using a hand
held GPS Image of recorded point
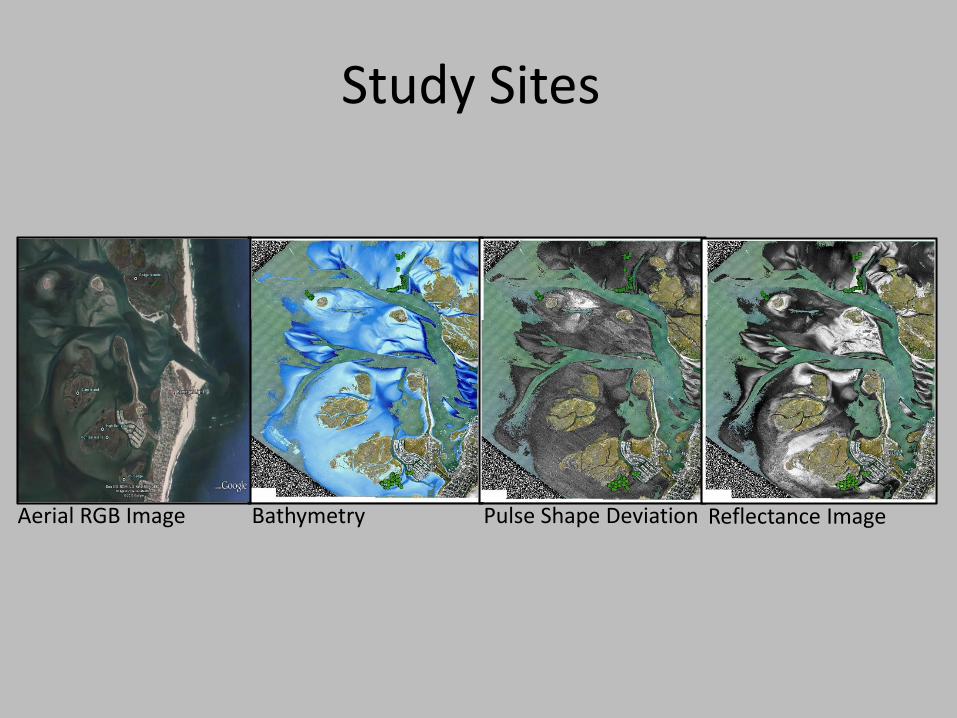
Study Sites
Aerial RGB Image Pulse Shape Deviation Reflectance ImageBathymetry

Sand
Camera Photo Aerial RGB Image Pulse Shape Deviation
Reflectance Image Bathymetry
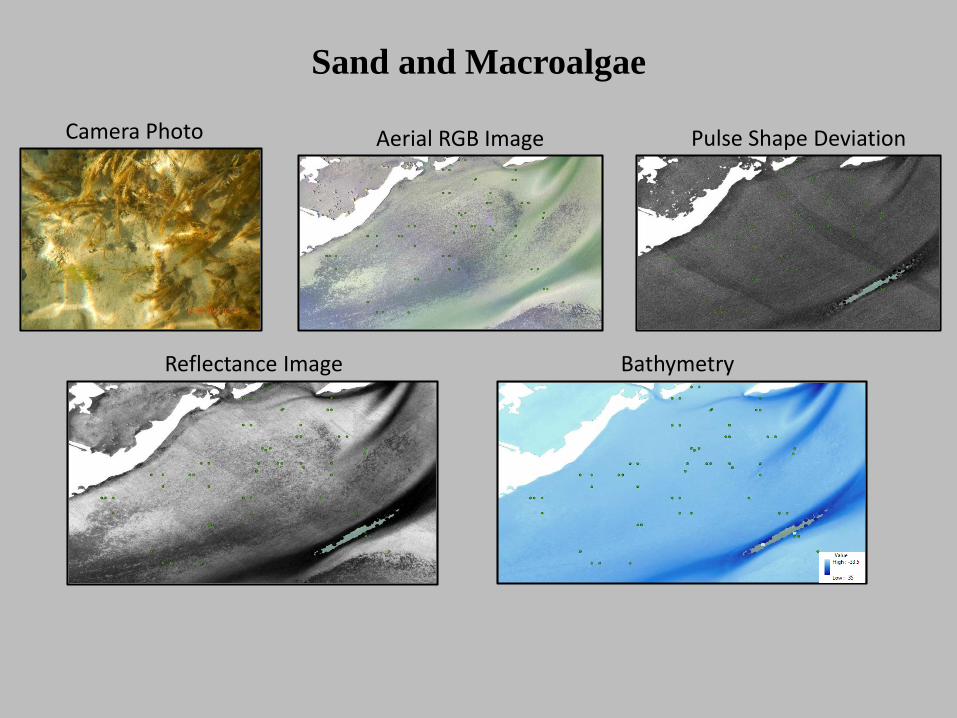
Sand and Macroalgae
Camera Photo Aerial RGB Image Pulse Shape Deviation
Reflectance Image Bathymetry

Sand and Eelgrass
Camera Photo Aerial RGB Image Pulse Shape Deviation
Reflectance Image Bathymetry

Eelgrass
Camera Photo Aerial RGB Image Pulse Shape Deviation
Reflectance Image Bathymetry

Future Directions
• Object-based classification
• Investigate the impacts of Hurricane Sandy on eelgrass beds:
– Waveform metrics, specifically reflectance to pre-and post Hurricane Sandy lidar
– Pre- and post-Images (satellite, airborne) of Barnegat Bay
Acknowledgements
• Funding Sources:
• Other:
– Brian Madori
NA14NOS4830001
Jacques Cousteau National Estuarine Research Reserve
Gregg Sakowicz