Assessing Farm Size and Mechanization on Indian ...India present different needs and capabilities...
46
Assessing Farm Size and Mechanization on Indian Agricultural Yield By Kevin McNamee Submitted to Central European University Department of Economics In partial Fulfillment of the requirements for the degree of Master of Arts in Economic Policy & Global Markets Supervisor: Robert P. Lieli Budapest, Hungary CEU eTD Collection
Transcript of Assessing Farm Size and Mechanization on Indian ...India present different needs and capabilities...

Assessing Farm Size and Mechanization on Indian
Agricultural Yield
By
Kevin McNamee
Submitted to
Central European University
Department of Economics
In partial Fulfillment of the requirements for the degree of Master of Arts in Economic
Policy & Global Markets
Supervisor: Robert P. Lieli
Budapest, Hungary
CE
UeT
DC
olle
ctio
n
i
Abstract This thesis will illustrate the process, and importance of farm mechanization and highlight the potential
economic ramifications and benefits to developing nation, in particular the Indian case. Individual states in
India present different needs and capabilities working towards the goal of mechanization. National and state
level policies and schemes will be assessed as to their level of effectiveness and potential benefits starting with
the agriculture sector down to individual farmers.
There is ample literature on the subject of farm mechanization. While it is universally accepted that
machinery increases farming output, analytically significant results are sparse. Countries concerned with farm
mechanization invariably fall under developing nation status, facing many issues at the national level. India
offers a unique opportunity as an emerging economy to provide a blueprint for modernizing their farms, which
has potential to be applied to countries on a similar growth path. India, among its developing nations brethren,
is in the enviable position of having flourishing sectors of its economy. Comparatively, this allows India greater
financial wherewithal, granting them the ability to think in terms of not IF they can modernize and mechanize
their agriculture sector, but simply a question of HOW is the best way of going about doing it.
Since the turn of the century the Indian government has recognized the potential of their agriculture
sector and has taken on the task of modernization headlong. This study finds that, as expected, there is a
positive effect from increased mechanization on agricultural output as a whole. It appears that in the case of
India, accounting for other underlying institutional and systematic conditions it is still in the best interests of
all Indian states to further promote modernization of their farmers. The benefits of such an effort would have
far reaching effects in a country that still relies on its agriculture for a significant portion of its Gross Domestic
Product and, in the author’s opinion more importantly, the overwhelming portion of the nation’s work force
that it employs.
CE
UeT
DC
olle
ctio
n

ii
Acknowledgements Thanks Mom and Dad! No really both of you have provided your own forms of encouragement and
motivation and I promise they have been affective and much appreciated (even if there was a lag period before
it took affect). Professor Lieli for your patient guidance of this blind horse to water, without it, direction for
this thesis might never have appeared. Special thanks to Mr. Bangara Raju of the Indian Agriculture Research
Institute for procuring data that I was in fear of never finding, practically with a wave of his hand. Finally,
certainly not least of all, the CEU community for which I have leaned on repeatedly to get inspiration from all
of the brilliant people that that surround me on a daily basis. It has been a heck of a ride.
CE
UeT
DC
olle
ctio
n

iii
Table of Contents
Abstract .......................................................................................................................................................... i
Acknowledgements ....................................................................................................................................... ii
List of Figures, Illustrations, and Tables ........................................................................................................ v
List of Abbreviations .................................................................................................................................... vi
Introduction .................................................................................................................................................. 1
Chapter I: Farms and Mechanization ............................................................................................................ 3
1.1: World Farming at a Glance ................................................................................................................ 3
1.2: India’s Mechanization and Farming Outlook ..................................................................................... 5
Chapter 2: India, State Wise Conditions ....................................................................................................... 7
2.1: Geographical and Environmental Conditions .................................................................................... 7
2.2: Farm Size .......................................................................................................................................... 12
2.3: Policy and Government Roll ............................................................................................................. 15
Chapter 3: Literature Review ...................................................................................................................... 18
Chapter 4: Data ........................................................................................................................................... 26
3.1: Dependent Variables ....................................................................................................................... 26
3.2: Independent Variables ..................................................................................................................... 26
3.3: Control Variables.............................................................................................................................. 28
Chapter 5: Methodology, Limitations, & Results ........................................................................................ 28
5.1 Methodology ..................................................................................................................................... 28
CE
UeT
DC
olle
ctio
n

iv
5.2 Results ............................................................................................................................................... 29
5.3 Limitations ......................................................................................................................................... 32
Conclusion & Policy Recommendations ..................................................................................................... 33
Bibliography ................................................................................................................................................ 37
Appendix – Figures & Tables ....................................................................................................................... 39
CE
UeT
DC
olle
ctio
n
v
List of Figures, Illustrations, and Tables
Figure 1 Proportion of Land in Climate Type & Climate Type by Main Produce ........................................ 12
Figure 2 Percent of Farm Land in Small Farms Compared to State Yield ................................................... 13
Figure 3 Log Line of Best Fit for all Year/Output/Small Farm Percent’s ..................................................... 14
Figure 4 Total Factor Productivity ............................................................................................................... 21
Figure 5 Farm Power & Productivity ........................................................................................................... 22
Figure 6 OLS Output / Tractors ................................................................................................................... 29
Figure 7 FE Output / Tractors ...................................................................................................................... 31
Figure 8 Export Growth Rates ..................................................................................................................... 39
Figure 9 Recipients of India’s Agricultural Exports ..................................................................................... 39
Illustration 1: Map of India Representing Ecological Regions and Production Systems ............................... 8
Illustration 2: India State Map ...................................................................................................................... 9
Illustration 3: India’s Regional Mechanization Levels ................................................................................. 11
Table 1: Number of Operational Holdings & Average Holding Size in India ................................................. 4
Table 2: Availability of Farm Power Different Resources ............................................................................. 7
Table 3: Potential Savings Values Through Mechanized Vs Indigenous Farming ....................................... 17
CE
UeT
DC
olle
ctio
n

vi
List of Abbreviations
AACP - Agricultural Competitiveness Project ACD - Agriculture Census Division AMPP - Agricultural Mechanization Promotion Policy ARIASP - The Assam Rural Infrastructure and Agricultural Services Project CAP - Common Agriculture Policy CSAM - Center for Sustainable Agriculture Mechanization DAC - Department of Agriculture & Cooperation FAO – Food and Agriculture Organization GDPPC - Gross Domestic Product Per Capita ICRISAT - International Crops Research Institute for the Semi-Arid Tropics IFPRI - Food Policy Research Institute MMA - Macro Management of Agriculture NCR - National Capital Region NIC - National Informatics Centre RKVY - Rashtriya Krishi Vikas Yojana TFP - Total Factor of Productivity USDA – United States Department of Agriculture WTO - World Trade Organization
CE
UeT
DC
olle
ctio
n

1
Introduction
“Growing 100 bushels of wheat in 1830 required five acres of land and 300 man hours of labour,
same as in biblical times,”
- Howard Dahl, President, Amity Technology
That statement has profound meaning when you think about it. Thousands of years ago, humans had
the capabilities to produce as much, and as efficiently as we could as recently as a little less than two hundred
years ago. Or from the opposite perspective, until a little less than 200 years ago we were still only as good at
farming as humans whose major breakthrough at the time was metal casting. The problem is, for the
overwhelming majority of the world’s population, agriculture is still a painfully laborious and inefficient process.
The birth of agriculture can be traced back 10,000 to 11,000 years ago, when humankind first stopped
being a nomadic peoples and settled down to reliably grow their own food. This could be argued, is the single
greatest “invention” for humans ever, comparable with the first tools used and sustaining heavier than air flight.
Throughout human history, agriculture advancement has allowed mankind to flourish and overcome adversity.
As the saying goes, necessity is the mother of invention, agriculture being no different. No one seeks out
progress where none is needed or asked for. Time and time again though, either through famine, growing
population, shrinking farmland, mankind has been forced to come through with new and better ways to feed
its people.
Agriculture progress can be summarized most easily by three distinct leaps forward. First the invention
of agriculture; Second, mechanization which coincided with the European Industrial Revolution1, which in turn
freed up a greater amount of population to pursue other endeavors and allowed cities to flourish and made
labor more efficient; Third, what has become known as the “Green Revolution” which has been centered
CE
UeT
DC
olle
ctio
n
2
around technological and biological breakthroughs in the plants and animals themselves allowing for greater
yields.
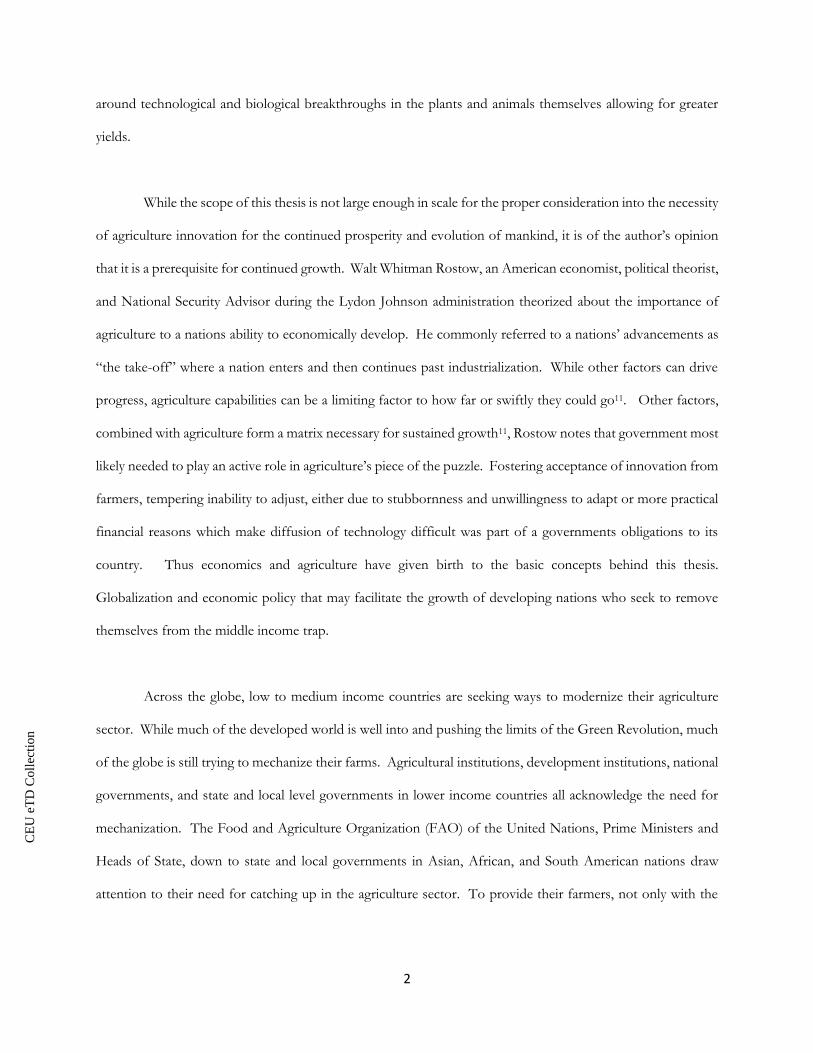
While the scope of this thesis is not large enough in scale for the proper consideration into the necessity
of agriculture innovation for the continued prosperity and evolution of mankind, it is of the author’s opinion
that it is a prerequisite for continued growth. Walt Whitman Rostow, an American economist, political theorist,
and National Security Advisor during the Lydon Johnson administration theorized about the importance of
agriculture to a nations ability to economically develop. He commonly referred to a nations’ advancements as
“the take-off” where a nation enters and then continues past industrialization. While other factors can drive
progress, agriculture capabilities can be a limiting factor to how far or swiftly they could go11. Other factors,
combined with agriculture form a matrix necessary for sustained growth11, Rostow notes that government most
likely needed to play an active role in agriculture’s piece of the puzzle. Fostering acceptance of innovation from
farmers, tempering inability to adjust, either due to stubbornness and unwillingness to adapt or more practical
financial reasons which make diffusion of technology difficult was part of a governments obligations to its
country. Thus economics and agriculture have given birth to the basic concepts behind this thesis.
Globalization and economic policy that may facilitate the growth of developing nations who seek to remove
themselves from the middle income trap.
Across the globe, low to medium income countries are seeking ways to modernize their agriculture
sector. While much of the developed world is well into and pushing the limits of the Green Revolution, much
of the globe is still trying to mechanize their farms. Agricultural institutions, development institutions, national
governments, and state and local level governments in lower income countries all acknowledge the need for
mechanization. The Food and Agriculture Organization (FAO) of the United Nations, Prime Ministers and
Heads of State, down to state and local governments in Asian, African, and South American nations draw
attention to their need for catching up in the agriculture sector. To provide their farmers, not only with the
CE
UeT
DC
olle
ctio
n
3
tools to adequately feed their people, but, taken a step further, become active on the international markets with
their comparative advantages in labor and farm space.
The problems facing developing nations modernizing their agriculture force are not simple ones, and
vary widely in complexion and solutions. Certainly western, highly developed nations are far removed from
the yield and effort levels illustrated in the opening quote to produce a given amount of food. They are far into
the green revolution where the reality is, feeding themselves as nations is hardly the main concern of their
individual agriculture sectors. There are inescapable differences between say, United States farms, and Indian
farms.
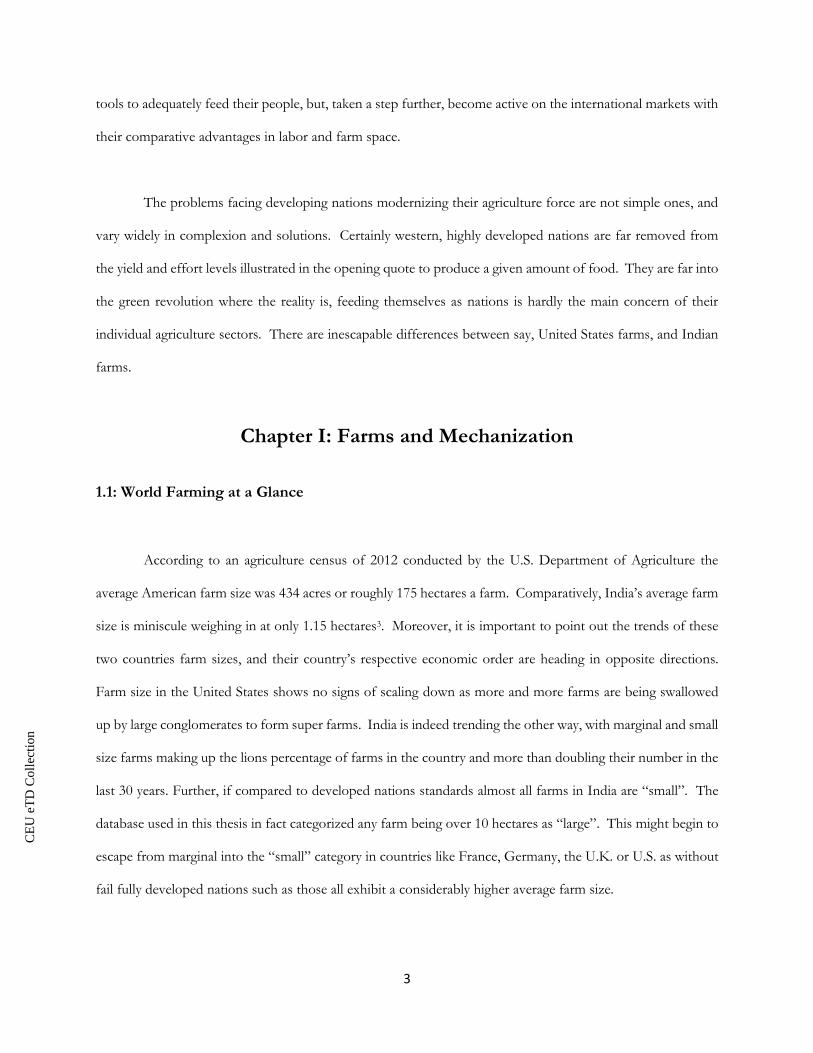
Chapter I: Farms and Mechanization
1.1: World Farming at a Glance
According to an agriculture census of 2012 conducted by the U.S. Department of Agriculture the
average American farm size was 434 acres or roughly 175 hectares a farm. Comparatively, India’s average farm
size is miniscule weighing in at only 1.15 hectares3. Moreover, it is important to point out the trends of these
two countries farm sizes, and their country’s respective economic order are heading in opposite directions.
Farm size in the United States shows no signs of scaling down as more and more farms are being swallowed
up by large conglomerates to form super farms. India is indeed trending the other way, with marginal and small
size farms making up the lions percentage of farms in the country and more than doubling their number in the
last 30 years. Further, if compared to developed nations standards almost all farms in India are “small”. The
database used in this thesis in fact categorized any farm being over 10 hectares as “large”. This might begin to
escape from marginal into the “small” category in countries like France, Germany, the U.K. or U.S. as without
fail fully developed nations such as those all exhibit a considerably higher average farm size.
CE
UeT
DC
olle
ctio
n
4
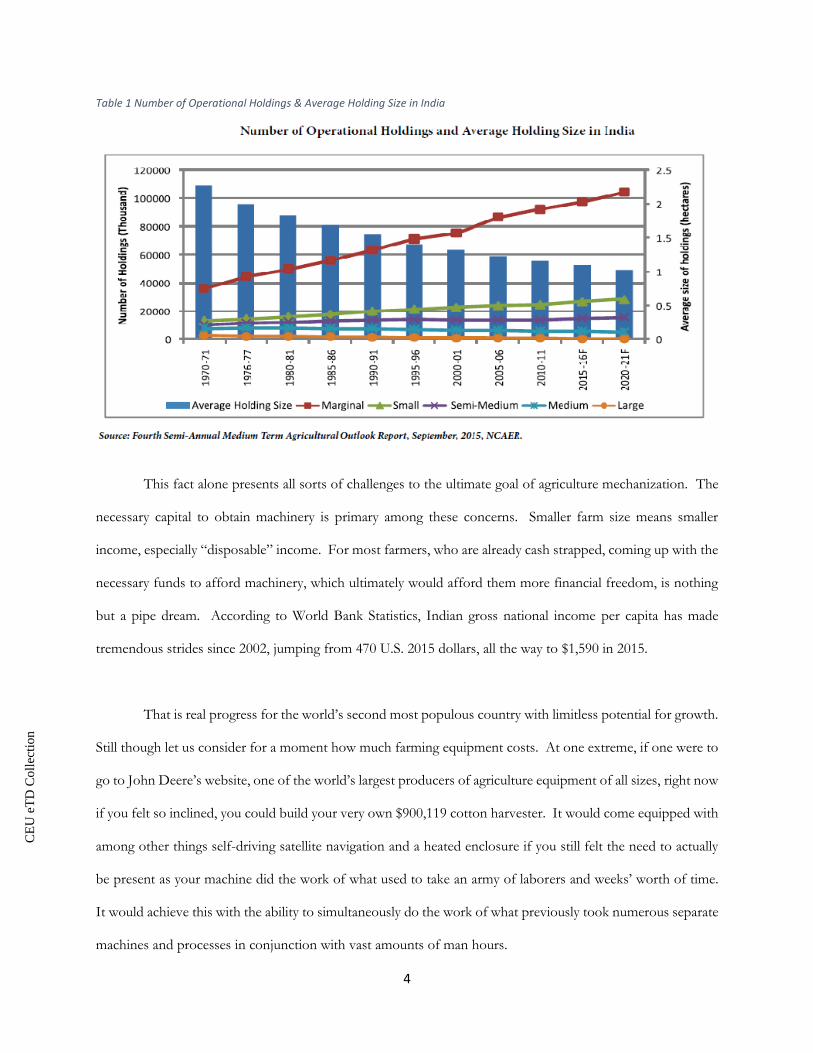
Table 1 Number of Operational Holdings & Average Holding Size in India
This fact alone presents all sorts of challenges to the ultimate goal of agriculture mechanization. The
necessary capital to obtain machinery is primary among these concerns. Smaller farm size means smaller
income, especially “disposable” income. For most farmers, who are already cash strapped, coming up with the
necessary funds to afford machinery, which ultimately would afford them more financial freedom, is nothing
but a pipe dream. According to World Bank Statistics, Indian gross national income per capita has made
tremendous strides since 2002, jumping from 470 U.S. 2015 dollars, all the way to $1,590 in 2015.
That is real progress for the world’s second most populous country with limitless potential for growth.
Still though let us consider for a moment how much farming equipment costs. At one extreme, if one were to
go to John Deere’s website, one of the world’s largest producers of agriculture equipment of all sizes, right now
if you felt so inclined, you could build your very own $900,119 cotton harvester. It would come equipped with
among other things self-driving satellite navigation and a heated enclosure if you still felt the need to actually
be present as your machine did the work of what used to take an army of laborers and weeks’ worth of time.
It would achieve this with the ability to simultaneously do the work of what previously took numerous separate
machines and processes in conjunction with vast amounts of man hours.
CE
UeT
DC
olle
ctio
n

5
However, it is understandable that particular piece of equipment has no bearing on anything close to
a typical farm in India. It merely serves the purpose to illustrate the vast difference, capital and scale wise,
between fully developed and developing nation’s agriculture sectors. There is such a technological and
mechanization gap in farming efficiency it can clearly be illustrated by per hectare yields of both the U.S. and
India. According to The World Bank’s database, in 2001 the United States per hectare yield for wheat was
5890.8 tons which increased to 7638.1 by 2014. In comparison India’s was less than half of that, at 2423.1 tons
per hectare in 2001 to 2984.1 in 2014. So not only is there a sizable productivity gap to begin with, America
saw an impressive 30% increase in its per hectare output in those 13 years, while India saw a 23% increase in
their per hectare productivity. They are not closing the gap, but in fact it is growing. For a country who still
obtains nearly 14%4 of its GDP from agriculture it quickly becomes apparent why increased efficiency in the
agriculture sector would be mightily beneficial for them.
1.2: India’s Mechanization and Farming Outlook
India’s world agriculture outlook is a hodgepodge of statistics and rankings. As far as natural resources
that cater to agriculture, India’s outlook is very good. It ranks 8th in the world in agriculture land in square
kilometers, 2nd in value added even after the fact that it ranks 84th in cereal yield per hectare. If India could
move that needle for yield up even marginally to enter the top 50, it would have a significant impact for its 2nd
world ranked amount of farm workers. In India this amounts 261 million working in there agriculture sector
as of 2008, which was the year all of these statistics were taken from, provided by the online databases Food
and Agriculture Organization of the United Nations12, Nation Master13, and CIA World Factbooks14.
The goals for Indian agricultural modernization and therefore mechanization are more grounded than
purchasing a nearly million dollar piece of equipment for every farmer. Much more modest aspirations as far
as machines are being pursued. The FAO shows India ranked 75th in the world in tractors per 1000 hectares of
CE
UeT
DC
olle
ctio
n
6
farm land at 2.38. This is despite the fact that they also report India possessing the 2nd most tractors in the
world at 2.53 million tractors. With one third of world's tractor production in India7 it has become a pure
numbers game of tractors versus population for the world’s second most populace nation to supply its farmers
sufficiently.
If we once again visit John Deere’s website and look for more obtainable pieces of machinery we
come across their smallest tractor at a mere 22.4 horsepower, compared with the 450 horsepower provided by
the 900 thousand dollar piece of equipment highlighted earlier. This tractor can be obtained for pennies on
the dollar at only $12,000. One might think that’s a reasonable amount for something that can provide a farm
with invaluable increased capabilities, and you would be correct. In a more capitalistic developed society that is
would be the case. At 7.5 times the average Indian’s salary a loan is almost certainly still required to make such
a crucial investment. Therein lies the problem, loan acquirement is not as easily achieved for an Indian farmer
as for your typical American who shows a propensity for good farming, walks into a bank and asks for a loan.
Despite the difficulties his country faces the Union Minister of Agriculture in India, Radha Mohan
Singh, speaking in June of 2016 at a conference on “Innovations in Agricultural Mechanization - Development
of linkage among R&D Institutes - Industry – Farmers” highlighted the fact he wanted his country to become
further modernized in agriculture and was constantly working on making machinery available to his farmers.
Plans are being explored and implemented to further encourage farmers and manufacturers working together
to increase farmer income and yield of the ample land available for farming present in India.2
CE
UeT
DC
olle
ctio
n
7
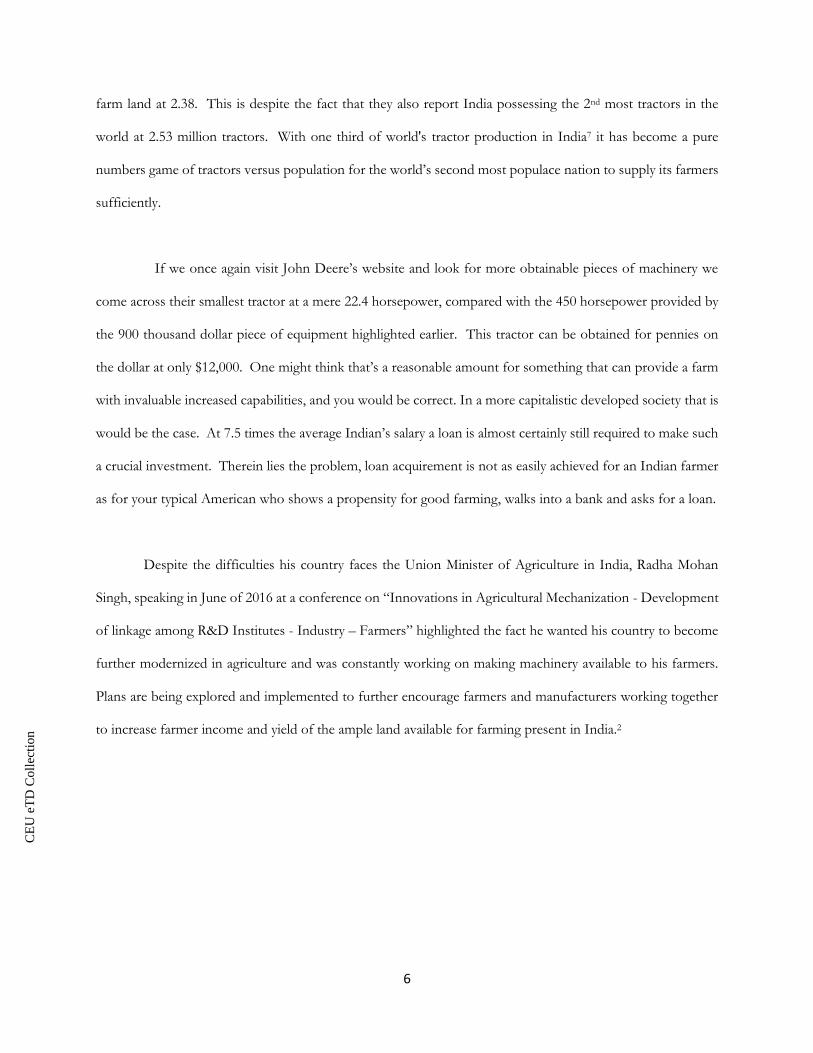
Table 2 Availability of Farm Power Different Resources
Chapter 2: India, State Wise Conditions
2.1: Geographical and Environmental Conditions
To better understand individual state outcomes from the data it is useful to at minimum be aware of
the inherent differences in their agriculture outlook. This will be useful to bear in mind while using a fixed
effect model later in this paper. India consists of 29 states and 7 more union territories, the difference being,
the union territories are controlled and governed by the central government directly whereas the states have
their own central government. For this thesis the author has used the same sources to establish prevailing
agriculture conditions from which the variable data was obtained for the best possible reflection of from one
to another.
CE
UeT
DC
olle
ctio
n

8
Illustration 1 Map of India Representing Ecological Regions and Production Systems
In the maps above in illustration 1 the different agricultural environments present in India are
illustrated ranging from the hilly and mountainous dominated north-eastern border defined by their proximity
to the Himalayan mountains, to the lush, almost tropical settings of the coast line that stretch from Bangladesh
all the way around and up to the North-West desert like conditions bordering Pakistan to the Indian interior
which is a vast expanse of plains and flat lands mixed with jungle like conditions. One further key condition
to note is the presence of irrigation or not which is a telling influential factor for agriculture production. To
expand on the illustration on the left, to the right we can see the main production present in each of the
environments. They typically reflect what one might expect would be the strength of the local eco system,
fruiting type agriculture dominating more tropical wet eco-systems, more resilient grains prospering in the
interior where little is needed for their success, and more specialty type outputs representing smaller portions
of the overall land that require special growing conditions.
CE
UeT
DC
olle
ctio
n

9
It is fair to assume that the effects and benefits of input variables in agriculture are at the mercy of
existing conditions much the same as the true value of a million dollar fishing boat is predicated on whether it
is put in a pond in the middle of the desert or put in an ocean teeming with ocean life. In this way it shall be
taken into account during this analysis the prevailing ecosystems of each state under question. While some
states are dominated by their proximity to the Himalayas, other are defined by their more tropical settings near
the coast, and yet others still are completely plain and landlocked, themselves affected by whether or not they
have access to irrigation or are rain water fed.
Illustration 2 India State Map
CE
UeT
DC
olle
ctio
n
10
These factors all go a long way to determining a particular states agricultural productivity, efficiency,
and efficacy to agriculture in the first place. More importantly and specifically to this thesis the predisposition
of a particular state allocating resources (capital and otherwise) to furthering their agriculture sector. A broad
picture is offered from illustrations 1 & 2 as to which geographically differing areas might lend themselves
better or worse to agricultural development more or less so than others.
Categorization of states will be kept to the five present on the map for simplicity sake and to keep
uniform with the numerical analysis that will come later which will be completed for the 17 states that full data
was available for the three years under study.
Starting in the North-West and moving clockwise Gujarat and Rajasthan are mostly arid environments
whose major production is millet and other fodder type grains that are resilient and easy to grow. Moving east
towards the mountains are Himachal Pradesh, Uttar Pradesh, Assam, West Bengal which sees most of their
production come in the form of rice, maize or wheat which can usually flourish in the hilly wet conditions
present where clouds tend to dump all of their water before they attempt to rise above the Himalayas1. Andhra
Pradesh and Jharkhand both directly benefit from the Himalayas being their neighbors in the form of easy
access to the run-off water as a byproduct from the wet conditions. As well, most of the Indian interior is
heavily dependent on rain water, with the rainy season determining much of how yearly harvests go as far as
output.
1 Because of this phenomenon, a desert is on the other side of the great mountain range as water is to heavy to make it over.
CE
UeT
DC
olle
ctio
n
11
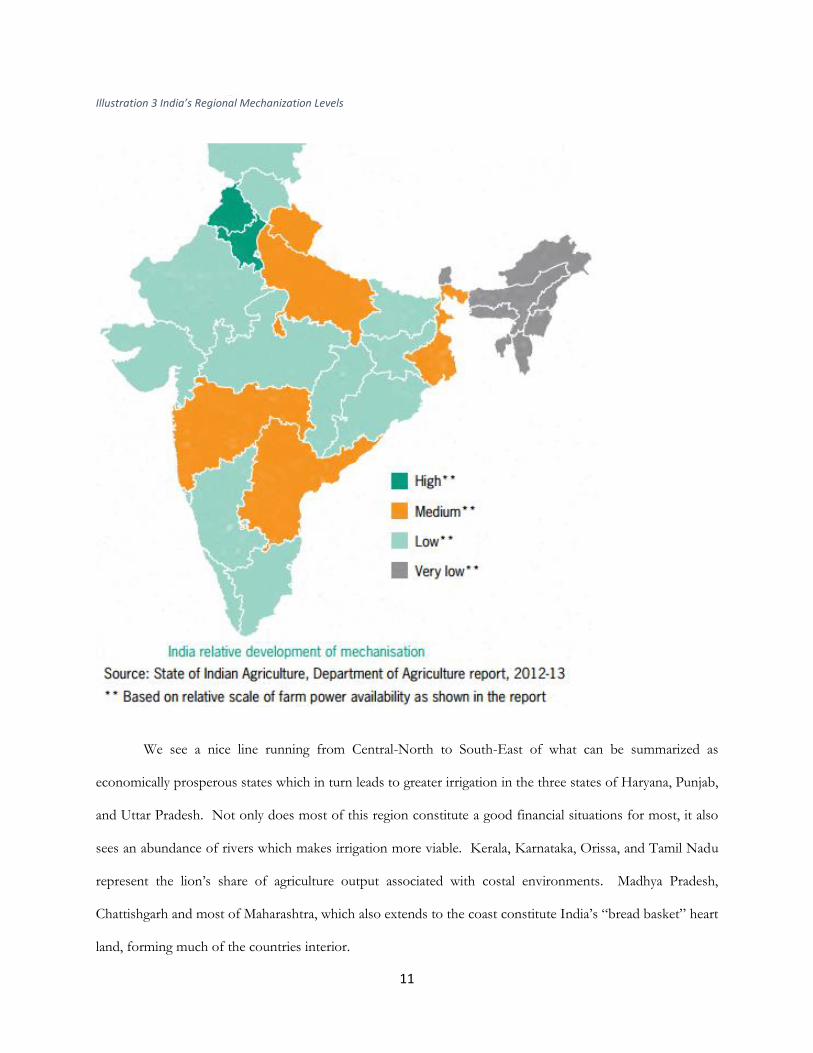
We see a nice line running from Central-North to South-East of what can be summarized as
economically prosperous states which in turn leads to greater irrigation in the three states of Haryana, Punjab,
and Uttar Pradesh. Not only does most of this region constitute a good financial situations for most, it also
sees an abundance of rivers which makes irrigation more viable. Kerala, Karnataka, Orissa, and Tamil Nadu
represent the lion’s share of agriculture output associated with costal environments. Madhya Pradesh,
Chattishgarh and most of Maharashtra, which also extends to the coast constitute India’s “bread basket” heart
land, forming much of the countries interior.
Illustration 3 India’s Regional Mechanization Levels
CE
UeT
DC
olle
ctio
n
12
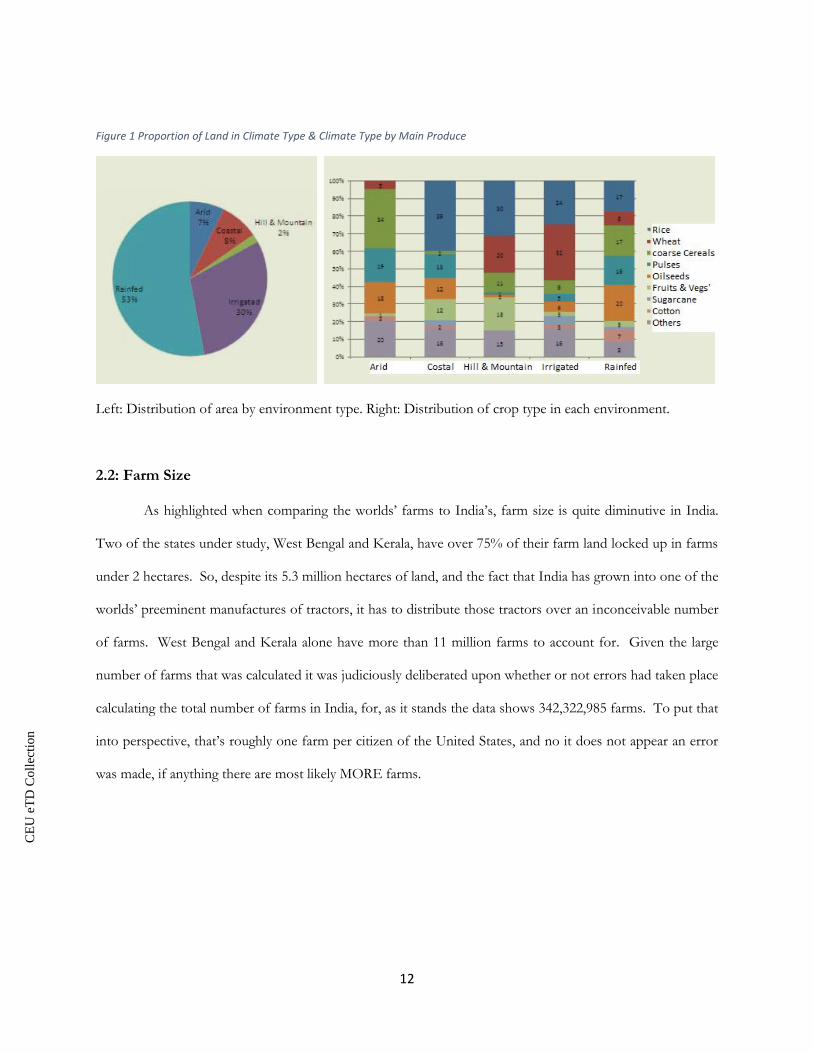
Figure 1 Proportion of Land in Climate Type & Climate Type by Main Produce
Left: Distribution of area by environment type. Right: Distribution of crop type in each environment.
2.2: Farm Size
As highlighted when comparing the worlds’ farms to India’s, farm size is quite diminutive in India.
Two of the states under study, West Bengal and Kerala, have over 75% of their farm land locked up in farms
under 2 hectares. So, despite its 5.3 million hectares of land, and the fact that India has grown into one of the
worlds’ preeminent manufactures of tractors, it has to distribute those tractors over an inconceivable number
of farms. West Bengal and Kerala alone have more than 11 million farms to account for. Given the large
number of farms that was calculated it was judiciously deliberated upon whether or not errors had taken place
calculating the total number of farms in India, for, as it stands the data shows 342,322,985 farms. To put that
into perspective, that’s roughly one farm per citizen of the United States, and no it does not appear an error
was made, if anything there are most likely MORE farms.
CE
UeT
DC
olle
ctio
n

13
Figure 2 Percent of Farm Land in Small Farms Compared to State Yield
The chart above reflects year over year change of the total farmland area represented by small farms
against that state’s yearly average yield per hectare. Some insight was sought to try and better gauge whether
smaller farms or larger farms see better yields per hectare of farmland. This can be parlayed into whether it is
important that governments promote access to mechanization to smaller farms swiftly to further exploit the
abundance of small farms in India or to try to consolidate farms into larger ones potentially making them more
productive. More data is required to know for a mathematical certainty whether the impact of farm size is
significant. From the limited data alone, it appears as though, for many states increased smaller farm percentage
did still allow for growth in yield. While this is slightly surprising to the author, if it holds true, it does allow
for states to not have to change the infrastructure of their farming systems YET for as it stands positive changes
to output would not be facing much hindrance from farm size alone. As shown from the chart, at least half of
the states in question exhibited yield growth even with their small farm size percent increasing.
50
250
450
650
850
1050
1250
1450
1650
1850
7.50% 17.50% 27.50% 37.50% 47.50% 57.50% 67.50% 77.50% 87.50% 97.50%
Per
Hec
tare
Ou
tpu
t in
to
ns
of
Pro
du
ce
Percent of Total Farmland in Small Farms
Percent of Farm Land in Small Farms Compared to State YieldAndhra Pradesh
Assam
Chattisgarh
Gujarat
Haryana
Himachal Pradesh
Jharkhand
Karnataka
Kerala
Madhya Pradesh
Maharashtra
Orissa
Punjab
Rajasthan
Tamil Nadu
Uttar Pradesh
West Bengal
CE
UeT
DC
olle
ctio
n

14
Figure 3 Log Line of Best Fit for all Year/Output/Small Farm Percent’s
Above is the trend line superimposed upon the previous graph. From this simple trend line we can
begin to see how farm sizes might affect the output for a given state. With such a small number of observations
this might not be sufficient to make a conclusion though, as the trend line above could easily be swayed one
way or another with the inclusion of any number of states that was missing data2. If the two outwardly
appearing outliers are removed, the trend line sign is reversed to slightly positive. Given so many states were
omitted due to lack of sufficient data, it was decided to keep them. As we do not know where the other states
would lie, it would be superfluous to remove these two as it stands.
2 The idea was played with to exclude what appeared to be two outlier states in the top left of that graph, but as many states were missing to begin with, those two states could in fact be in an acceptable range of values when the nearly 20 excluded states can be considered.
50
250
450
650
850
1050
1250
1450
1650
1850
0.00% 10.00% 20.00% 30.00% 40.00% 50.00% 60.00% 70.00% 80.00% 90.00%
Per
Hec
tare
Ou
tpu
t in
to
ns
of
Pro
du
ce
Percent of Total Farmland in Small Farms
Log Line of Best Fit for all Year/Output/Small Farm Percent's
CE
UeT
DC
olle
ctio
n
15
2.3: Policy and Government Roll
Much like the United States, different states put different emphasis on their agriculture, even though
nationally, agriculture is an economic driving force there still are differences present between each states policy
and attitude much like you would expect importance of agriculture to be different from Kansas to Louisiana.
While the national government has taken a more active role in the last decade or two, much has still been left
to be determined at the state level.
Maharashtra, which has the 2nd largest state population in this thesis, at 112 million inhabitants, and
subsequently the 2nd highest GDP Per Capita as well, has been a leader in attempting to mechanize its farmers.
The Macro Management of Agriculture (MMA) scheme was introduced at the national level in 2000-2001, with
Maharashtra quickly adapting the scheme, which among its 17 components, farm mechanization is emphasized.
Despite Maharashtra’s economic prosperity, it’s per hectare output remains quite low, even to Indian standards.
Since 2001 for every year under study, they did not post a per-hectare yield in the top 50th percentile of states
which seems extraordinary considering their economic outlook. A couple theories persist in explaining this
and chief among them is the fact that irrigation levels are quite poor for the state. According to state by state
evaluation of the MMA, Maharashtra only had 18% of its crop land irrigated against the national average of
42%19. While the state put considerable funds into developing its irrigation system it also targeted
mechanization as well with the newly appointed national funds. Implementation had humble starting goals
when the scheme was introduced in 2001. Of $344,004 earmarked for farmer’s subsidies and mechanization
promotion only $310 which ever made it to farmers. By 2007, goals became loftier, with a target amount of
$1,518,579, which was actually exceeded with close to $1.55 million being dispersed.
While certainly causality is not being claimed from this one statistic alone, there was a 5 fold increase
of machine power available to farmers from the year 2006 to 2011 in Maharashtra. This was accompanied by
CE
UeT
DC
olle
ctio
n

16
a 15% increased total of agriculture output, and an even better 17% jump in per hectare production. With the
third best improvement over the 2001-11’ decade among studied states and compared to the national average
per hectare growth of only slightly more than 4% the outlook for Maharashtra is quite healthy moving forward.
Assam represents a conditionally different perspective from Maharashtra, as it has no Mumbai type
world market scale city providing it considerable access to capital and wealth. Among the states in this study,
Assam represented the 2nd lowest Gross Domestic Product Per Capita (GDPPC) in 2011 at $578 and in a
statistical coincidence it also constituted the 2nd lowest GDPPC growth over the 10 year span of 2001-2011.
Assam’s farmers mainly consist of subsistence farming, have very little connection with bigger picture markets,
have little to no credit options, and are facing very low levels of mechanization, fertilizer usage, and once again
irrigation.
Despite these adverse conditions Assam’s government has aggressively pursued advancing its
agriculture sector. Two projects were initiated in the hopes of doing just that, first The Assam Rural
Infrastructure and Agricultural Services Project (ARIASP) was introduced in 1995 and then in 2004 the
Agricultural Competitiveness Project (AACP) which both received heavy funding from the World Bank. The
ARIASP’s impact on mechanization came in the form of direct machine contributions to the poorest segments
of farmers in Assam. 554 tractors, 1500 power tillers, and 300 power threshers were provided20 under the
project’s name as well as attempts to establish training centers for farmers to come and educate themselves on
the most efficient manner in which to utilize the machines.
West Bengal represents the biggest jump in machine power available per hectare of farmland at almost
4 times the availability from 2001 to 2011. Along with Karnataka, and Madhya Pradesh which exhibited
machine availability growth upwards of 3 times and to a lesser extent Orissa at 2.5 (though from 01’-06’ it was
marginal at best and displayed a meteoric rise in the second half of the decade) the lessons of how these states
went about increasing their mechanized portion of farming power is of particular curiosity.
CE
UeT
DC
olle
ctio
n
17
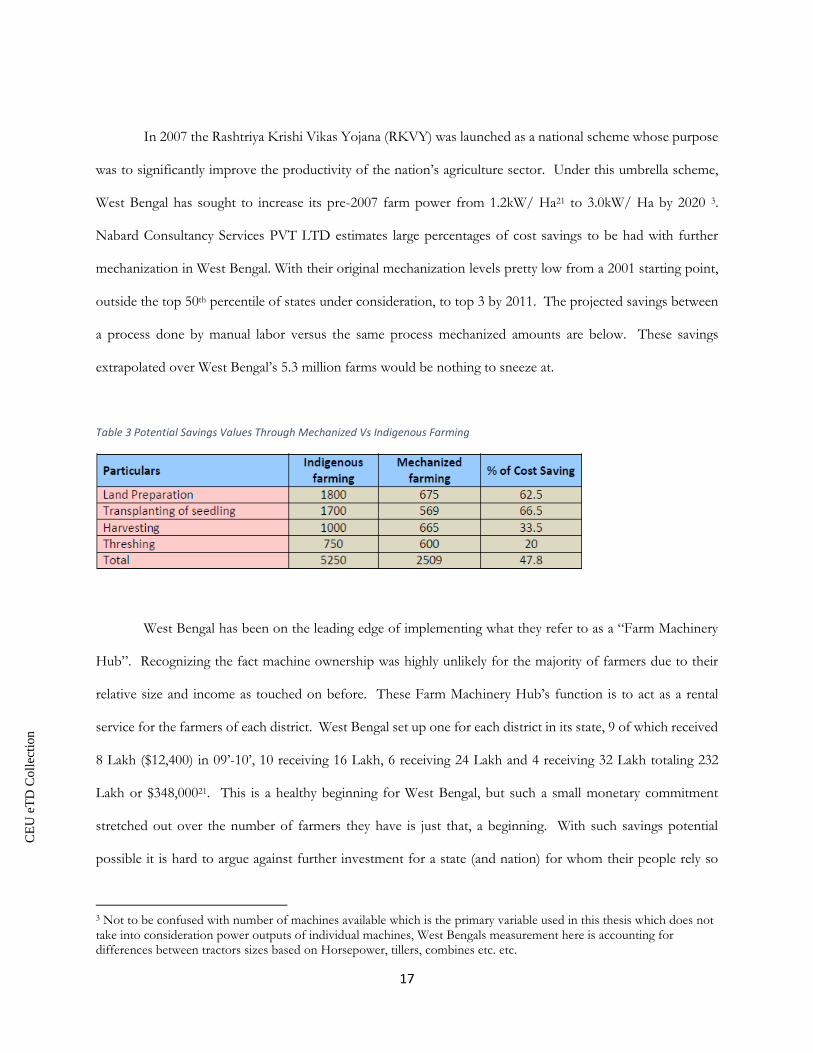
In 2007 the Rashtriya Krishi Vikas Yojana (RKVY) was launched as a national scheme whose purpose
was to significantly improve the productivity of the nation’s agriculture sector. Under this umbrella scheme,
West Bengal has sought to increase its pre-2007 farm power from 1.2kW/ Ha21 to 3.0kW/ Ha by 2020 3.
Nabard Consultancy Services PVT LTD estimates large percentages of cost savings to be had with further
mechanization in West Bengal. With their original mechanization levels pretty low from a 2001 starting point,
outside the top 50th percentile of states under consideration, to top 3 by 2011. The projected savings between
a process done by manual labor versus the same process mechanized amounts are below. These savings
extrapolated over West Bengal’s 5.3 million farms would be nothing to sneeze at.
Table 3 Potential Savings Values Through Mechanized Vs Indigenous Farming
West Bengal has been on the leading edge of implementing what they refer to as a “Farm Machinery
Hub”. Recognizing the fact machine ownership was highly unlikely for the majority of farmers due to their
relative size and income as touched on before. These Farm Machinery Hub’s function is to act as a rental
service for the farmers of each district. West Bengal set up one for each district in its state, 9 of which received
8 Lakh ($12,400) in 09’-10’, 10 receiving 16 Lakh, 6 receiving 24 Lakh and 4 receiving 32 Lakh totaling 232
Lakh or $348,00021. This is a healthy beginning for West Bengal, but such a small monetary commitment
stretched out over the number of farmers they have is just that, a beginning. With such savings potential
possible it is hard to argue against further investment for a state (and nation) for whom their people rely so
3 Not to be confused with number of machines available which is the primary variable used in this thesis which does not take into consideration power outputs of individual machines, West Bengals measurement here is accounting for differences between tractors sizes based on Horsepower, tillers, combines etc. etc.
CE
UeT
DC
olle
ctio
n

18
heavily on agriculture not only for the primary monetary creator but still very much as the only source of food
as their connection to outside markets is limited.
Haryana represents one of the wealthiest states in India according to their GDPPC, ranking 2nd, 1st, and
3rd in the years 2011, 2006, and 2001 respectively. It is also near the bottom of the list of states in size with
only 4.4 million hectares of land weighing in at a whopping 1.3%23 of the country’s overall total land area. With
its diminutive size it still commits 80% of that land to cultivation, and 84%23 of that is irrigated. Despite its
apparent capital wealth and commitment to agriculture through its high irrigation rates, it does not rank
especially high on tractors per hectare indexes, with states Tamil Nadu, and Uttar Pradesh easily outpacing it in
that category4. Haryana continues its conundrum of statistical combinations, it was the fastest state in India to
obtain food self-sufficiency from its inception in 1996 and has since become the second biggest contributor to
India’s food stocks23.
Haryana is worried about their declining productivity as they are facing issues with over fertilization
which is contributing to a growing soil nutrient deficiency, and water tables being adversely affected as they
drill more and more wells to spread irrigation. They have acknowledged these facts and have sought remedies
through infrastructure reforms coupled with government assistance on natural resource management. They
make note of their ample access to larger markets with their proximity to the National Capital Region (NCR)
as additional incentive to increase productivity.
Chapter 3: Literature Review
While not exactly “literature” some personal connections were utilized for insight into modern farming,
concerning medium to large5 scale farming in the state of North Carolina in the U.S. The owner and founder
4 Tamil Nadu did experience an uncharacteristic rise in GDPPC during the timeframe under consideration which could explain some of the discrepancy, but Uttar Pradesh’s GDPPC was less than a 3rd of Haryana’s and it had nearly double the tractors per hectare as Haryana. 5 Medium to large on the developed aka. much larger than Indian scale.
CE
UeT
DC
olle
ctio
n
19
of A New Leaf Landscaping & Nursery explained a piece of equipment called a “grain drill”. This relatively
simple machine is fed by a hopper full of seed, as the machine goes along, it completes multiple tasks at once;
it plows rows equidistance apart to a predetermined depth suited to the seed; it then drops seed into the plowed
lane; and as it passes, it then covers up the lane with dirt and the planting process is finished. Efficient, waste
reducing and time saving. These machines come in varying degrees of complexity and sophistication capable
of tackling small fields to giant machines with air-conditioned cabins that can cover fields as far as the eye can
see motoring along at speeds of 6/10mph. Now compare this process to how one might imagine it is done on
a typical Chinese farm, as an army of laborers marched, hunched over a patty field with a sack of seeds slung
over their back reaching into the water and carefully place one seed at a time or if speed was sought, a device
that spun a horizontal wheel and allowed seed to drop down on to it, in the process slinging seed in every which
direction6. Neither of which are ideal for timeliness or efficient use of agri-inputs. Germination rates for
“spreaders” and labor time for hand planted fields are horribly inefficient compared to their mechanized
brethren.
From the above illustration, with such capability differences to something so essential to life such as
farming one can imagine there is much literature on the topic of agriculture mechanization. With China
attributing an estimated 9%5 of its 2016 GDP to agriculture, which is upwards of 11 trillion dollars5, and as
previously mentioned, India attributing 14% of its 2 trillion dollar GDP figure, there is plenty of economic
incentive to try and make these sectors as beneficial to their immense populations as possible. The fact that
China and India are developing nations, with burgeoning modernization of their respective agricultures sectors
foresees a lot of growing pains. The necessity to swiftly and effectively arm their farmers with tools to better
do their jobs is paramount.
6 This creates much waste as the seeds are not properly “planted” into the ground and therefore this type of planting can typically expect to see 40-50% of spread seeds wasted.
CE
UeT
DC
olle
ctio
n
20
One of the most common methods used to measure agriculture output will be familiar to economists,
Total Factor of Productivity (TFP).
“The substantial literature that decomposes TFP and analyzes its sources (Evenson
[1993] reviewed more than 78 such studies) shows that the TFP, as a residual, cannot be considered to be simple technical
or technological change. It is produced by changes in infrastructure, skills, and institutions as well as technology.”
- Evenson, Pray, Rosengrant (1999)9
While it would be nice and self-containing for the purposes of studies and research such as this thesis
to attribute all changes in TFP to the variable under scrutiny, tractor per hectare, in the real world that does not
hold much water. It is good to bear in mind other factors much like any other real world assessment. As far
as agriculture output, there is a plethora of mitigating factors other than increased machine usage that can have
a negative or positive impact. Agriculture especially is susceptible to varying outside influences, besides
common ones such as changes in education, liberalization of markets, capital access etc. you have more basic,
fundamental things like the weather, water levels, prevailing local environments that can vastly differ across a
nation as large as India.
With some institutions’ predictions on global food needs doubling by 2015(GHI 2011), and the added
and ever looming issue of sustainability which was not present in previous centuries to the degree it is now, the
issue of increasing the world’s and individual nations agricultural TFP has once again taken center stage. There
is little debate about whether or not machines or mechanical advantages ease the human work load and increase
productivity. That is like asking did the wheel allow humans to travel faster, does the computer allow us to
tackle infinitely more complex tasks every day.
CE
UeT
DC
olle
ctio
n
21
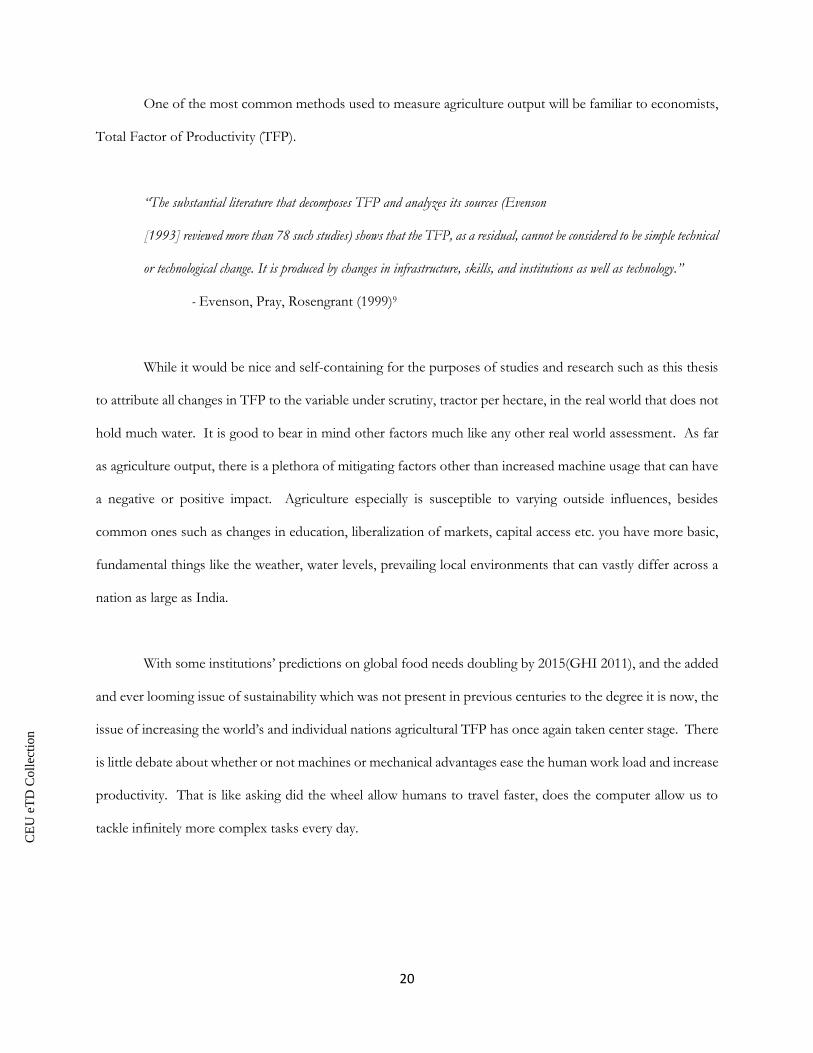
Figure 4 Total Factor Productivity
The chart above shows the TFP for cotton in the U.S. south. The large jump is clearly visible from
1950 to the early 60’s. This directly coincides with a few key historical developments in agriculture. Firstly,
WWII had pillaged a lot of the labor force around the globe, specifically 21% of the rural black population
went elsewhere between 1940 and 195010 much of which historically represented farm labor. Necessity being
the mother of invention, this loss of labor spurred on the research and development of tools that might replace
such a drop. In the end the labor loss was turned into a large jump in TFP in the realization of the cotton
combine. In the span of a decade the U.S. went from 125 man hours needed to produce one acre of cotton to
a mere 25 man hours10. During the same time frame many other plants, fruits, and vegetables saw their
processes mechanized, most of which were born of similar necessary circumstances due to labor shortages in
the United States rural south, with tobacco and tomato harvesting seeing similar man hour requirements
slashed. Farm mechanization increases efficiency in many different aspects, it saves time and labor, cuts costs,
reduces losses, and props up total output and farmer income in the long run6.
CE
UeT
DC
olle
ctio
n
22
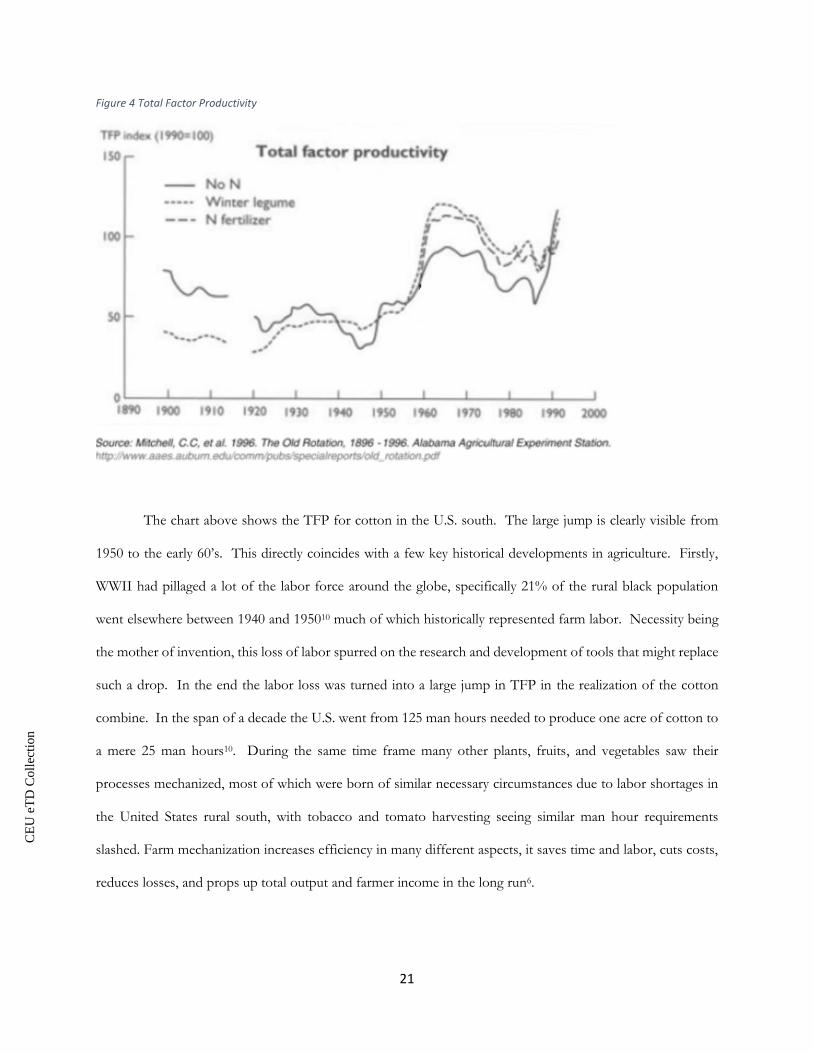
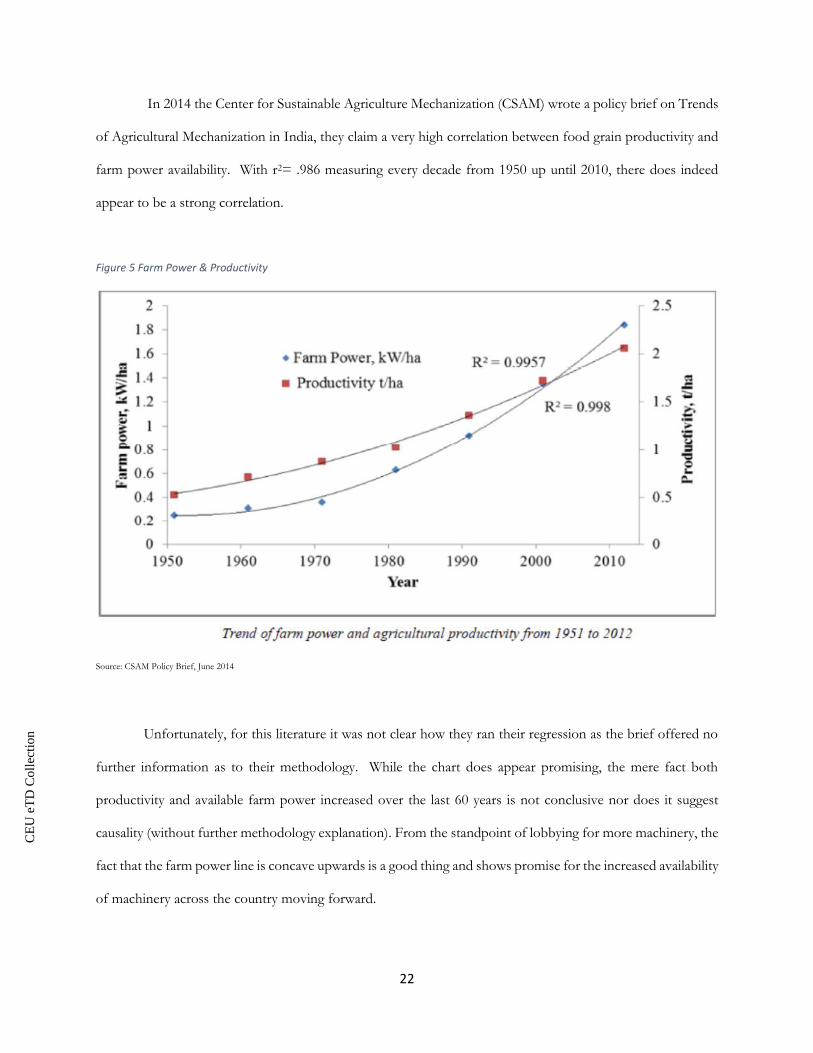
In 2014 the Center for Sustainable Agriculture Mechanization (CSAM) wrote a policy brief on Trends
of Agricultural Mechanization in India, they claim a very high correlation between food grain productivity and
farm power availability. With r2= .986 measuring every decade from 1950 up until 2010, there does indeed
appear to be a strong correlation.
Figure 5 Farm Power & Productivity
Source: CSAM Policy Brief, June 2014
Unfortunately, for this literature it was not clear how they ran their regression as the brief offered no
further information as to their methodology. While the chart does appear promising, the mere fact both
productivity and available farm power increased over the last 60 years is not conclusive nor does it suggest
causality (without further methodology explanation). From the standpoint of lobbying for more machinery, the
fact that the farm power line is concave upwards is a good thing and shows promise for the increased availability
of machinery across the country moving forward.
CE
UeT
DC
olle
ctio
n
23
An abundance of case studies offer their input on farm mechanization from many African countries
trying to better its economic standing. Just as there are differences between India and more developed nations,
there exist differences between African country’s agriculture outlook and India’s. Nonetheless it may prove
useful to observe the arguments and results that have been put forth. While the issue of labor marginalization
for agriculture workers in India is present, it is much more pronounced in Africa, and for this fact
mechanization in Africa has remained a hot button issue. It has been the topic of debate for engineers,
economists, agriculturalists, and politicians alike15. As poor a condition capital obtainment is for the average
Indian farmer, it is a practical non-thought for the average African farmer to obtain a loan for a piece of farming
equipment. Instead Africa’s attempt at raising their TFP has been concentrated more on divisible inputs like
fertilizer, seed varieties, and chemicals. One can always buy more or less of seeds or spray, but dividing the
cost of a singular physical input like a plow is more difficult.
Still though the African farming situation does allow us some useful mirrors to compare, similar farm
sizes, similar capital access problems, these lead to an exaggerated version of Indian conditions. As was
discussed previously, it is likely that government will need to play a somewhat active role to promote
mechanization. Whereas developed nations had time to mature their mechanical sector, and had comparatively
much better economic situations than their developing counterparts, African and Asian developing nations are
not afforded the luxury of allowing markets, specifically the private markets, to develop and fill the need in
their own due course15. A key factor in Africa’s case is their current inability to manufacture these mechanical
inputs themselves, ironically, a large portion of their mechanical inputs are imported from India (and China)16.
It is the simple matter of developing a nation’s agriculture sectors sizes have outpaced their ability to mechanize.
Population growth is a matter of fact, technological progress faces a multitude of hurdles for developing
nations.
A very pointed and specific study was conducted as to the impact on production and employment in
Indonesia. A recurring theme that keeps cropping up is that some developing nations while admitting they
CE
UeT
DC
olle
ctio
n

24
would like to see their agriculture sectors more productive and prosperous are concerned with employment
being negatively affected. This seems to be an especially emphasized topic in this study. They do go on
however to point out that on average, mechanized farms in their area of study of West Java were 3 times larger
than their non-mechanized counterparts and still required less labor17. Here the farmers were actually facing
labor shortages during peak season, as a result turning to mechanization for the answer. This was usually closely
followed by enlarging their farm size due to permanently increased access to working power as the tractors
were always available versus seasonal workers. While claiming inconclusive results for the “isolated” effects of
mechanization, they were confident enough in their analysis to vehemently say mechanized farms obtained
higher yields, with less labor, less pesticides, and were considerably larger. Only to cover their analysis by saying
the cause of the increased yield is just as likely to be attributable to any other input as to mechanization.
The International Food Policy Research Institute (IFPRI) wrote a discussion paper December of 2016
on effects of mechanization on small farm holders in Nepal. Their focus was on Terai zone of Nepal which
saw custom-hiring of tractors go from 10% 20 years ago to 50% as recently as 2010. Much like most developing
nations, Nepal’s average farm size was low, around .5 hectares so similar tractor procurement problems were
faced by the average farmer here as in India. The study was assessing the different impacts of increased
mechanization availability on small verse larger farms. Finding that accounting for previously neglected
specialization in off-farm activities for smaller farms, the benefits of mechanization were comparable to those
of larger farms.
From 1995 onwards, Nepal introduced a litany of programs and policies to promote agriculture
competitiveness, with a few of these specifically targeting mechanization. The Nepalese government appears
to have been doing their due diligence to bring their country up to speed, creating agriculture engineering units
in the 50’s, agriculture research councils that test and develop machinery for Nepal’s specific needs, and national
training programs have been developed to try and better educate their farmers. A major hindrance Nepal faces
for these policies has been lack of adequate funding18.
CE
UeT
DC
olle
ctio
n
25
With this in mind, the Government of Nepal enacted the Agricultural Mechanization Promotion Policy
(AMPP) in 2014 with the stated goals of undertaking research, adopting, developing use, expansion, and
promotion of agricultural machinery and equipment for increasing productivity in the agricultural sector and
for making the sector sustainable and competitive. Their study revealed some interesting and surprising results.
Small farm owners who transitioned from manual cultivation to mechanical cultivation, through custom
cultivator renting schemes, saw their per capita income increase by 13%18. While that is not necessarily
surprising, the same regression run for medium size farms saw nearly identical per capita income increases. For
study conductors, this was proof enough that it is just as beneficial to promote mechanization to smaller farms
as it was larger ones, one result that the author of this thesis hopes to mimic or replicate.
Politics it appears, and bureaucratic red tape are always a concern when trying to develop a nation’s
strategy and therefore implementing policy changes to positively affect the bottom line. In Africa this rings
particularly true for thin skinned politicians who do not appreciate infringements upon their self-perceived
worth15(page 17). So not only do national policies or better yet strategies, that politicians are presented with so that
they may form THEIR policies, need to be affective and financially viable, they need to pander to the politicians
who hold their potential success or failure in their hands.
The FAO has developed a chronological course of action to create what one would hope will ultimately
become a part of a nationally established institution. State objectives, define goals, establish targets, develop
policies, initialize a strategy, build the program, and create specific projects. With strategies, programs, and
projects usually being left to state level government branches better capable of more catering to localized
conditions, the rest being procured at the national level so as to set a common goal.
CE
UeT
DC
olle
ctio
n

26
Chapter 4: Data
3.1: Dependent Variables
The main focus of this thesis is agricultural output per hectare of farmland present in each state of
India. An aggregate calculation of all output was made from data sets produced by the International Crops
Research Institute for the Semi-Arid Tropics (ICRISAT) hosted on Village Dynamics in South Asia’s website22.
These data files gave an in depth every fifth year break down dating back as far as 1966 for some states for their
agricultural production profile. These files showed what and how much each state under study was producing,
as for this analysis it was not deemed important the individual products as the overall goal is to improve
production regardless of the product. These were then mated with statistics on total farmland in hectares which
were provided by the Department of Agriculture & Cooperation (DAC), Agriculture Census Division (ACD),
in cooperation with the National Informatics Centre (NIC). The resulting dependent variable is then presented
in ton of agriculture production per hectare of arable land over the years 2001, 2006, and 2011 for 15 complete
state statistics and 2 more partial ones.
3.2: Independent Variables
The independent variables consist of one agri-input and one hypothesized determinant of agricultural
output. The first, machine power available to farmers was the summation of the number of power tillers,
tractors, and combines regardless of horsepower or size present in each state at the time of the surveys in 01’,
06’, and 11’. The second was farm size, originally separated into 5 size categories, this was later reduced to
small7, medium8, and large9.
7 Smaller than two hectares. 8 Between two and ten hectares. 9 Larger than ten hectares.
CE
UeT
DC
olle
ctio
n
27
Machine power, or tractors_per_hectare, this thesis theorizes, is a key component to developing
nations elevating their agriculture sector to compete on the global scale. Without it, these nations are at a
distinct disadvantage production capacity wise, it is the attempt of this paper to ascertain, within the nation of
India to what degree does mechanization affect productivity. Fortunately there was ample, whole data sets
regarding machines available at not only the state level, but it had been sorted into farm size as well.
For developing nations, farm sizes tend to be small compared to developed nations. This directly and
materially affects the ability of farmers to acquire machinery, and sparked, the idea of how the spread of
machinery across different farm sizes affects efficiency. A question born from this study was, how a governing
body makes machinery available to so many small individual holdings. And further down this line of thinking,
would it be more prudent for governments to promote larger farms as they appear to be more efficient in their
machine usage or can small farms, armed with machinery become as efficient.
Thus, farm size was dissected and taken into account in the regressions run to determine their effect
on a state’s agriculture output if any. Of particular interest was to seek out and find any trends being projected
on output from a state’s relative growth or decline of smaller farms and if putting an emphasis on larger farms
receiving machinery over smaller farms was a prudent plan moving forward. Number of farms in each size
bracket, percent of total number of farms in each size bracket, and percent of farm land represented by each
size bracket were taken into account. A state could have vastly differing numbers in each category. Larger
farms being present would almost certainly not sway the total number of farms in their favor, but it could
drastically reduce the percentage of farmland allocated to smaller farms.
We will take Jharkhand as a prime example, in 2011, small farms made up more than 84% of total
number of farms in the state. With the average right around 80% this is a pretty unremarkable statistic, what
does stand out though, Jharkhand has the largest difference between percent of total farms that are small, and
total farming area that is attributed to small farms. Only 42% of all farmland in Jharkhand is locked up in small
CE
UeT
DC
olle
ctio
n

28
farms, that’s easily the biggest discrepancy between those two percentages, at 41%. That’s a quarter higher than
the national 30% average difference between total farms and farm area in small farms. Unfortunately Jharkhand
had only one year of usable data and these noteworthy statistics were not able to be expanded upon much
further.
3.3: Control Variables
The control variable that was accounted for was Gross Domestic Product Per Capita (GDPPC). In
an attempt to account for underlying differences from one state to another’s ability to procure funding for their
respective farmers. States individual GDP’s and population numbers were taken from India’s state census
site23. This is included in the analysis with the thinking being, wealthier states could and should better support
their farmers. This in fact should be reflected in the future even further by reinvesting its increased returns and
savings back into the agriculture sector.
Chapter 5: Methodology, Limitations, & Results
5.1 Methodology
The quantifiable effects of farm mechanization on agricultural output should be better evaluated, in
India’s case, as well as the majority of developing countries, it should also be determined whether or not the
prevailing small farm sizes will be an obstacle to overcome the goal of more efficient use of inputs resulting in
higher output. In order to achieve this Stata was utilized to capture the interactions between the variables
previously described from multiple perspectives. A combination of regressions were run between OLS and
Fixed-Effect models with varying inclusion or exclusion of variables at the disposal of this thesis. The
combination of regressions were run on 17 states, 15 with 3 years, 1 with 2 years, and 1 with 1 years’ worth of
data.
CE
UeT
DC
olle
ctio
n

29
5.2 Results
First we will take a look at the OLS model. This iteration has output per hectare as the dependent
variable against tractors per hectare, percent of tractors in small farms versus medium or large farms, the
interaction term between those two, GDPPC, and the percent of total farmland attributed to small farms.
Figure 6 OLS Output / Tractors
Some key take aways from the OLS model above. The two variables offering good significance is a
welcome sight, even with limited observations we can count on those two for some trustworthy accuracy. The
first three variables should also be viewed and analyzed as an interacting group. To determine their true meaning
some calculation were needed. Beginning with tractors_per_hectare, we would like to isolate its effects by
taking its derivative thus we have:
𝑡𝑟𝑎𝑐𝑡𝑜𝑟𝑠𝑝𝑒𝑟ℎ𝑒𝑐 − 𝑖𝑛𝑡𝑡𝑟𝑝𝑒𝑟ℎ𝑝𝑐𝑡𝑟𝑎𝑐𝑖𝑛𝑠𝑚𝑎𝑙𝑙 ∗ 𝑎𝑣𝑒𝑟𝑎𝑔𝑒 𝑣𝑎𝑙𝑢𝑒 𝑜𝑓 𝑝𝑒𝑟𝑐𝑒𝑛𝑡𝑡𝑟𝑎𝑐𝑖𝑛𝑠𝑚𝑎𝑙𝑙
3325 − 3321 ∗ .66
= 1134
This is interpreted in such a way, that if the proportion of tractors in small farms to medium/large
farms is kept constant, and we increased the number of tractors per hectare by 1 we would expect to see an
increased yield of 1,134 tons per hectare. This is an extreme case, for as it stands our “best” tractor per hectare
CE
UeT
DC
olle
ctio
n
30
rating is not quite 1.1, adding 1 would double our best case state, and multiply our worst case state’s tractor
availability by a factor of 9.
Adding 1 tractor per hectare would be a monumental undertaking for a country with such a large
amount of farm land. Instead let us transform those numbers to something more reasonable, a potential target
for policy makers perhaps. Keeping to more realistic figures, the average difference for the 17 states, from 1
five year period to the next came out to a positive growth rate of .13 tractors added per hectare. Keeping to
that figure and as the idea is to grow more than has been exhibited, let us hope for .15 tractor growth per
hectare. This scenario would return an expected 170 additional tons per hectare in agricultural output.
Now the flipside of this regression is as follows. If instead we are interested in determining the effects
of keeping the number of total of tractors the same, but moving them from medium/large to small or small to
medium/large we would use the same technique but instead isolate this time for percent_trac_in_small. The
same principle is applied, -657 – (3321*.3110) = - 1,686.
So hypothetically, if the total number of tractors in the state in question remains the same, and you
start with every tractor in the state on large farms then take every tractor and put them on small farms, you
could expect that states per hectare agricultural yield to decrease by 1,686 tons11.
A more realistic scenario, you have a certain percentage of tractors on large and small farms. You then
increase the percent of tractors on small farms by 10% (thereby removing them from large farms, as number
of total tractors has to remain the same). In this 10% tractor relocation scenario we would expect to see a 168
ton per hectare yield reduction. Conversely and of more applicable use, if you moved tractors from small farms
to medium/large ones you can expect to see reflectively similar increases of output.
10 .31 being the average value of tractor per hectare 11 In this case changing “1” is an all or nothing case as this is a percent as opposed to the trac_per_hectare which is a numeric value
CE
UeT
DC
olle
ctio
n

31
Figure 7 FE Output / Tractors
Above is the same regression run as the previous, only this time with Fixed-Effects (FE Model). It is
immediately apparent that taking fixed affects into account, the coefficients become narrower in their scope as
the idea behind running a fixed effect model is to account for inherent underlying differences that go mostly
unchanged from time period to time period between states12. This will “level the playing field” as it were, to
account for persistent differences between states output13.
Although the numbers appear drastically different at first the important thing to keep in mind is the
way you interpret the coefficients for the same variables is the same, and in doing so reveals very similar results.
We interpret and manipulate this graph the same as the first, 330 – 645 * .31 = 130. Once again this is the
12 For this particular thesis, as has been touched on previously, fixed effect differences in agriculture are many and variable. If one state has 1/3 of the entire countries rivers run through it we can expect their total outputs to be universally higher than an otherwise identical state. Permanent political difference supporting agriculture, annually higher rain amounts, perpetually better soil conditions etc. etc. can all fall under this category. 13 If year over year, one states output is 1300-1600 tons per hectare, and another’s is 400-600, it is most likely safe to assume there are underlying unaccounted for differences, those talked about in the previous footnote, that are comprising the large differences and will therefore have a skewing effect on the inputs that we are running out regressions for.
CE
UeT
DC
olle
ctio
n
32
resulting difference we would expect if we kept total number of tractors constant and moved all tractors from
large to small. Somewhat surprising to see a positive number there, this is where the weak confidence intervals
actually play in our favor as this is most likely not the case, and at +130 it is close enough to allow reasonable
doubt to sneak in. Also keep in mind, if the average tractor per hectare value of .31 keeps increasing, which is
the hope of this thesis, then the coefficient will continue to approach zero and pass into the negatives.
Keeping big – small tractor allocation constant we get, 547 – 645 * .66 = 122. As well for tractor
efficiency, the lower the percentage of tractors going towards small farms, the better resulting yields you can
expect when additional tractors are added. From the results, the numbers show us tentatively that small farm
size, and specifically sending available tractor to smaller sized farms rather than bigger ones will be an issue. If
you are adding tractors, as expected we see a positive coefficient impact on output. If where the tractors are
being sent is not taken into consideration though, the expected benefits can be negated simply by the fact that
the tractors will not be used efficiently across smaller farms. This makes sense from a practical standpoint,
much like budget airlines are very concise of how long their plans are on the tarmac rather than going on
flights14. Farmers will face an overall negative impact if they purchase a capital intensive input and then realize
their farm is not big enough to benefit from the increased working power they now possess15.
5.3 Limitations
There were limitations that were born from the data that produced a less than desired number of
observations. Originally data was sought for all of India’s 36 states and Union territories, but it was quickly
apparent that no singular source could provide such a data set. Rather than try and piece together fragments
14 Budget airlines are aware down to the minute how long their airplanes are sitting versus when they are in the air as it costs them money every second their planes are not in flight, hence the very quick turnaround times for carriers like Wizz and RyanAir 15 To clarify if not emphasized enough already, work power differential between a few laborers and even the most modest tractors is monumental. It certainly could catch many a farm owners by surprise when they realize they are getting what might have taken a few weeks done now in just a few days. Then this nice shiny new expensive piece of equipment is sitting gathering dust with nothing to do.
CE
UeT
DC
olle
ctio
n
33
of data with differing sources, the most complete singular source was used. The most complete dataset offered
statistics only at a 5 year interval at best and this only ran as far back as 2001 before even more states regularly
started missing pertinent information. From 36 states usable data was narrowed down to 17 over 3 years.
Although not centrally important to this analysis, it would have been desirable to put more weight behind the
amount of money lent out to farmers. As it stood the available data regarding this was not very clear for the
most part and therefore not as heavily emphasized as was anticipated going into the research.
All in all data appears to be getting better organized and more complete as the issue of mechanization
takes a more central stage. This research could certainly use another analysis in the coming years when data
sets become more filled in as the concept is rather simply evaluated given enough information.
Conclusion & Policy Recommendations
It is just about universally accepted that farm mechanization is the correct direction for agriculture in
developing worlds. From an output perspective the numbers are uncontestable, higher yield, better efficiency
in both manpower and inputs, long term savings, and less waste. In the end these things all mean greater
income for the farmer, and a healthier agriculture sector of the nations’ economy. The only negative that can
be construed is displacement of labor from heavy employment rates in farming. The absolute necessity of more
food for a growing population will quickly outweigh this small contention. Historically, countries seeing a leap
forward into a mechanized agriculture see urbanization with the displaced labor finding gainful employment
elsewhere or in many cases labor leaves first and mechanization is the answer to labor shortages.
Large scale implementation of machinery has the potential to allow less developed countries explore
their comparative advantages in the agriculture international trade market. India has displayed just this
capability in the last 15 years or so. According to the United States Department of Agriculture (USDA) India’s
total agriculture exports have soared since 2001, going from 5 billion US dollars to nearly 40 billion24. This
CE
UeT
DC
olle
ctio
n
34
comfortably positions them as the world’s leader in terms of export growth in that period at 21%, securely
ahead of Indonesia and Brazil between 15-18% and easily pacing China who saw an export growth rate of
11.8% during that span24.
As has been mentioned, India has the benefit of seeing other sectors of their economy flourishing,
namely its service sector25, which has attracted a lot of foreign direct investment as its growth potential has
become apparent. Credit to India’s rise in exports can certainly be passed around to different causes but the
USDA makes a point of mentioning increased “power” support, among irrigation and fertilizer support.
Subsidies have been applied directly to support their farmers16 much like many nations, but this is not to take
away from the fact that greater overall investment in machinery is yielding positive long term results.
With a continued, and ideally, increased government attitude of a hands on approach, India can expect
to see greater returns from its mechanical investments in agriculture. Direct export subsidies as a whole are
not a long term solution for agriculture, and in fact the world market through the World Trade Organization
(WTO) has deemed them counterproductive and have moved to ban them. As of the 10th Ministerial
Conference the WTO has moved to outright abolish export subsidies for agriculture in fully developed nations.
Furthermore the same thing is expected of developing nations by the end of 201826. India is currently in a
position that the EU was in around the turn of the century, as their agriculture sector was being propped up by
the Common Agriculture Policy (CAP). Their goods were being exported to poorer countries, those countries
markets were being suppressed and yet the EU’s farmers were still complaining. This is quite an important
issue to India as they have filled a niche that was once held by more developed nations exporting their
agriculture to developing nations, with only the United States receiving more Indian agriculture exports than
countries like China, Malaysia, Pakistan, and the UAE24.
16 Until 2014 India had not let the international world know of its agriculture subsidies since 2003-2004 which was drawing the ire of many richer nations complaining of skirting WTO regulations.
CE
UeT
DC
olle
ctio
n
35
The massive amount of money poured into supporting farmers year to year in the form of subsidies,
can be put into infantile projects and schemes that are already in place to promote innovation rather than
hindering quantifiable progress through handouts. Seeing past month, and even 1-3 year horizons should be
emphasized in order to prioritize more long term gains. Machine loan credit lines, direct machinery subsidies
rather than output based subsides, communal machine loan centers are all promising viable options. In an ideal
world personal machine ownership would be even further prioritized among these possible options as it has
been shown to more effective than loan systems17
Fortunately it can be projected that machine loan systems or “custom hiring” can still have quite a
positive affect for the users of such programs. In Nepal’s case the results were promising concerning custom
hiring institutions when they saw a jump in usage with outputs predictably higher18. These kinds of programs
have the added benefit of a sort of built in education method regarding the machinery. It self creates a
community of people knowledgeable on the machinery being used. This is another hurdle that India faces as
it moves to mechanization, the lack of knowhow, even if you give fighter jets to a crop duster18 it doesn’t mean
they know how to use them. Much the same as generations of farmers in India and other developing nations,
if you just hand them tractors they will need time to get the most out of them, developing an educational
platform for mechanical inputs will be just as paramount moving forward. India has begun this process, with
many states chartering instructional hubs that allow farmers to come educate themselves on just how they can
advance their farms potential through machine usage. They combined this with state and national sponsored
machine testing centers so that the government may make educated suggestions on which pieces of machinery
will perform best depending on the individual farmers’ situation.
17 The inherent timeliness that come with owning your own piece of equipment rather than being at the mercy of a communal loaning center directly lends itself to higher returns on the initial investment of such a piece of equipment. Like most such inputs, the more it is running versus sitting for any amount of time, the more valuable it becomes. 18 Old school, usually propeller, plane that will fly over a cultivated field to mass spread out fertilizer or pesticide in a spray form allowing farmers to coast their entire fields in the matter of a few hours after a couple of passes.
CE
UeT
DC
olle
ctio
n

36
While data available for this analysis left the author desiring more, it did allow for some promising
results nonetheless. The significance levels and confidence intervals were not as tight as the author would have
wished for but the numbers produced do point in a direction policy makers could start planning their country’s
future needs. As a policy maker in developing nations, it would be in the interests of your nation to keep
promoting mechanization, and on a more long term horizon, develop plans to promote farm consolidation into
bigger farms to get the most out of the machinery once it is in the hands of farmers. Machine loan systems are
promising, they can alleviate times where tractors do not have work due to their not being enough of it on a
small farm as the next farmer can come and use it with no down time. Problems arise during peak labor times,
when all farms in region are harvesting, or planting, and loan centers not having enough machinery to go
around. Therefore pointing once again to individual ownership on bigger farms.
CE
UeT
DC
olle
ctio
n

37
Bibliography
1The Three Agricultural Revolutions By:Hinasahar Muneeruddin on:Sun 02 of May, 2010, http://www.lewishistoricalsociety.com/wiki/tiki-print_article.php?articleId=2
2 "Mechanization is key to modernization of agriculture "TNN | Jul 8, 2016, 10.33 AM IST, The Times of India 3 “State of Indian Agriculture” Government of India, Ministry of Agriculture & Farmers Welfare Department of Agriculture, Cooperation & Farmers Welfare Directorate of Economics & Statistics New Delhi 4 “Transforming Agriculture Through Mechanization” A Knowledge Paper on Indian Farm Equipment Sector, 4th International Exhibition & Conference on Agri-Machinery & Equipment, A. Didar Singh, Rahul Kapur 5 The World Bank, visited May 17th, 2017.
6 “Trends of Agricultrue Mechanization in India”, CSAM Policy Brief, Pg. 5 7 “ Current Trends of Indian Tractor Industry: A Critical Review” Subrata Kr. Mandal, Atanu Maity, Scientist, CSIR-Central Mechanical Engineering Research Institute, Durgapur, India. App. Sci. Report. 3 (2), 2013: 132-139 8 “The Impact of Mechanization on Agriculture” John F. Reid, Fall Issue of The Bridge on Agriculture and Information Technology, SEPTEMBER 15, 2011 VOLUME 41 ISSUE 3 9 “Agricultural Research and Productivity Growth in India” Evenson, Pray, Rosegrant. International Food Policy Research Institute. 1999. 10 http://www.livinghistoryfarm.org/farminginthe50s/machines_15.html, Bill Ganzel, the Ganzel Group. First published in 2007, accessed May 18th, 2017. 11 “The Stages of Economic Growth” Author(s): W. W. Rostow. The Economic History Review, New Series, Vol. 12, No. 1 (1959), pp. 1-16 Published by: Wiley on behalf of the Economic History Society 12 http://www.fao.org/faostat/en/#country/100, accessed May 18, 2017 13 http://www.nationmaster.com/country-info/profiles/India/Agriculture, accessed May 18, 2017 14 https://www.cia.gov/library/publications/the-world-factbook/geos/in.html, accessed May 18, 2017 15 “Agricultural Mechanization Policies and Strategies in Africa”, Case Studies from Commonwealth African Countries, edited by Geoffrey Mrema, published by Food Production and Rural Development Division, Commonwealth Secretariat, 1990 16 “Agricultural mechanization and agricultural transformation”. Diao, Xinshen, Silver, Jed, Takeshima, Hiroyuki. IFPRI Discussin Paper, April 2016
CE
UeT
DC
olle
ctio
n
38
17 John Lingard & Al Sri Bagyo (1983) The Impact of Agricultural Mechanisation on Production and Employment in Rice Areas of West Java, Bulletin of Indonesian Economic Studies, 19:1, 53-67, DOI: 10.1080/00074918312331334299 18 “Effects of Agricultural Mechanization on Smallholders and their Self-Selection into Farming An Insight from the Nepal Terai”. Takeshima, Shrestha, Kaphle, Karkee, Pokhrel, Kumar. Development Strategy and Goverance Division. December 2016 19 Macro Management of Agriculture Scheme in Maharashtra: An Evaluation. Jayanti Kajale. Vol. LII, No. 3, September 2010, pp. 230-249, GIPE Journal - Artha Vijnana 20 Assam Agriculture at a Glance. Assam Small Farmers’ Agri Business Consortium. http://assamagribusiness.nic.in/ASAGRI.pdf 21 Stata Agriculture Plan for West Bengal. Nabard Consultancy Services PVT LTD, West Bengal Regional Office. 22 Statistical database. http://vdsa.icrisat.ac.in/. Access from May 1st onwards. 23 Haryana State Agriculture Policy. Kisan Ayog. Government of India. 24 “India’s Agriculture Exports Climb to Record High” United States department of Agriculture, Foreign Agriculture service. https://www.fas.usda.gov/data/india-s-agricultural-exports-climb-record-high 25 Brand India, Industry, Services Sector in India. https://www.ibef.org/industry/services.aspx 26 Tenth WTO Ministerial Conference, Nairobi, 2015. Export Competition. Export Subsidies. https://www.wto.org/english/thewto_e/minist_e/mc10_e/l980_e.htm
CE
UeT
DC
olle
ctio
n

39
Appendix – Figures & Tables
Figure 8 Export Growth Rates
https://www.fas.usda.gov/data/india-s-agricultural-exports-climb-record-high
Figure 9 Recipients of India’s Agricultural Exports
https://www.fas.usda.gov/data/india-s-agricultural-exports-climb-record-high
CE
UeT
DC
olle
ctio
n

![4[1]. automation and mechanization](https://static.fdocuments.in/doc/165x107/58f146991a28ab82588b4567/41-automation-and-mechanization.jpg)