Assessing Emotional Intelligence Competencies in...
41
1 Assessing Emotional Intelligence Competencies in Two Global Contexts 1 Joan Manuel Batista-Foguet Department of Quantitative Methods ESADE. Universitat Ramon Llull Richard E. Boyatzis Department of Organizational Behaviour Weatherhead School of Management Case Western Reserve University Department of Human Resources ESADE. Universitat Ramon Llull Laura Guillén ESADE. Universitat Ramon Llull Ricard Serlavós Department of Human Resources ESADE. Universitat Ramon Llull Received: February, 2006 Abstract Emotional Intelligence (EI) competencies have been shown to predict effectiveness in leaders and managers in many countries around the world. Many of these studies use qualitative methods that are sensitive to cultural differences in style, such as critical incident interviews, but many also use questionnaire-based measures. Once respondent measures are used, issues of cultural compatibility and cross-cultural meaning arise as potential challenges to validity and interpretation. In this study, data come from two management schools: MBA and EMBA students at Weatherhead School of Management, at Case Western Reserve 1 Forthcoming in Peter Salovey, Manas Mandal, Vinod Shanwal and Robert Emmerling (eds.) Emotional Intelligence: Theoretical and Cultural Perspectives. San Francisco: Nova Science Publishers.
Transcript of Assessing Emotional Intelligence Competencies in...
1
Assessing Emotional Intelligence Competencies in Two Global Contexts1
Joan Manuel Batista-Foguet
Department of Quantitative Methods ESADE. Universitat Ramon Llull
Richard E. Boyatzis
Department of Organizational Behaviour Weatherhead School of Management
Case Western Reserve University Department of Human Resources ESADE. Universitat Ramon Llull
Laura Guillén
ESADE. Universitat Ramon Llull
Ricard Serlavós Department of Human Resources ESADE. Universitat Ramon Llull
Received: February, 2006
Abstract
Emotional Intelligence (EI) competencies have been shown to predict effectiveness in leaders and managers in many countries around the world. Many of these studies use qualitative methods that are sensitive to cultural differences in style, such as critical incident interviews, but many also use questionnaire-based measures. Once respondent measures are used, issues of cultural compatibility and cross-cultural meaning arise as potential challenges to validity and interpretation. In this study, data come from two management schools: MBA and EMBA students at Weatherhead School of Management, at Case Western Reserve
1 Forthcoming in Peter Salovey, Manas Mandal, Vinod Shanwal and Robert Emmerling (eds.) Emotional Intelligence: Theoretical and Cultural Perspectives. San Francisco: Nova Science Publishers.
2
University in Cleveland, Ohio, USA; and ESADE, at Ramon Llull University in Barcelona, Spain. The ECI-U (Emotional Competency Inventory - University version) is the questionnaire used to determine whether the assessment of EI competencies means the same in samples reflecting different cultural backgrounds. The ECI-U is a 360º instrument collecting data from the student and others around him/her. Multiple group analysis using Structural Equation Modelling (SEM) examines the psychometric properties of the ECI-U responses from informants for both competency scales and clusters of competencies. This allows for a more accurate comparison of means and variances than would be obtained by traditional means using ANOVAs or t-tests. But prior to making any comparison, factorial invariance has been assessed to evaluate the degree to which items, scales, and competency clusters have the same meaning for the different groups.
Problems with comparability (that may have arisen through translation problems, cultural interpretation of the behaviour being assessed, cultural appropriateness (i.e., degrees of good versus bad) of the behaviour exhibited) are discussed before any substantive conclusion is reached.
Joan Manuel Batista-Foguet. <[email protected]> Richard Boyatzis. <[email protected]> Laura Guillén. <[email protected]> Ricard Serlavós. <[email protected]>

3
Introduction Emotional Intelligence (EI) competencies have been shown to predict effectiveness in leaders and managers in many countries of the world (Austin, 2004; Boyatzis, 1982; Boyatzis and Sala, 2004; Day and Carroll, 2004; Dulewicz and Higgs, 2000; Goleman, 1998; Sala, 2002; Spencer and Spencer, 1993). Many of these studies use qualitative methods that are sensitive to cultural differences in style, like critical incident interviews, but many also use questionnaire based measures. Once respondent measures are used, issues of cultural compatibility and cross-cultural meaning arise as potential challenges to validity and interpretation. This is especially critical when translating the questionnaire into different languages and using it with people from different cultural backgrounds. A model of emotional intelligence competencies has been used by two Business Schools, Weatherhead School of Management (WSOM), at Case Western Reserve University in Cleveland Ohio, USA and ESADE at Ramon Llull University in Barcelona, Spain. Both schools share a commitment to integrating competency development into their curricula as an essential part of their mission. EI competencies are assessed by the university version of Emotional Competence Inventory (ECI-U), a 360° instrument that assesses the handling of emotions in life and work settings (Boyatzis, 1994). Both institutions are engaged in a research project investigating the impact of MBAs in developing the competencies bearing on outstanding managerial and leader performance. This framework (Boyatzis, Baker, Leonard, Rhee and Thompson, 1995) gives a good opportunity to conduct a comparative study and to test the validity of the instrument in different cultural environments. Comparisons between countries based on the usage of questionnaires frequently miss out a vital step. Before computing and interpreting the results of cross-cultural comparisons, one must assess the degree to which items and the measured constructs have the same meaning for
4
the respondents of the different groups to be compared. Even if the process and model are well established, and they are applied to samples of matched profiles, and questionnaires are carefully back-translated, we can not simply assume that they are valid for comparing our MBAs. In this chapter we will illustrate the pre-testing of this equivalence which is known as various terms such as factorial invariance, factorial equivalence, measurement equivalence, and construct comparability. We will evaluate the extent to which the items contained in a questionnaire (ECI-U), and especially the dimensions that they measure (El competencies), have the same meaning for members of different groups. The level of equivalence that is established will determine which inferences can be made, and whether comparison of the groups is well-founded. This will lead to a more accurate comparison of the score distribution of the factors than the run-of-the-mill ANOVA and t-tests, which do not guarantee a valid comparison of the various groups. Failure to conduct such an analysis means that the distribution of the underlying dimensions among groups may be attributable to different meanings attached to those factors in psychology (Meredith, 1993; Little, 1997) or in management literature (Mullen, 1995; Vandenberg and Lance, 2000). Factorial invariance must therefore be checked in any analysis with multiple groups. However, it is particularly vital in cross-cultural research (as in our case) for evaluating whether or not data of different MBA’s groups can be taken as equivalent, given that there are reasons to believe that certain evaluations or perceptions are structured differently rather than merely because the various groups receive translated versions of questionnaires (e.g. Reise et al. 1993; Steenkamp and Baumgartner, 1998). Implications of this for the behavioral measurement of El competencies and the use of 360° measures in multiple cultural contexts will be discussed.
5
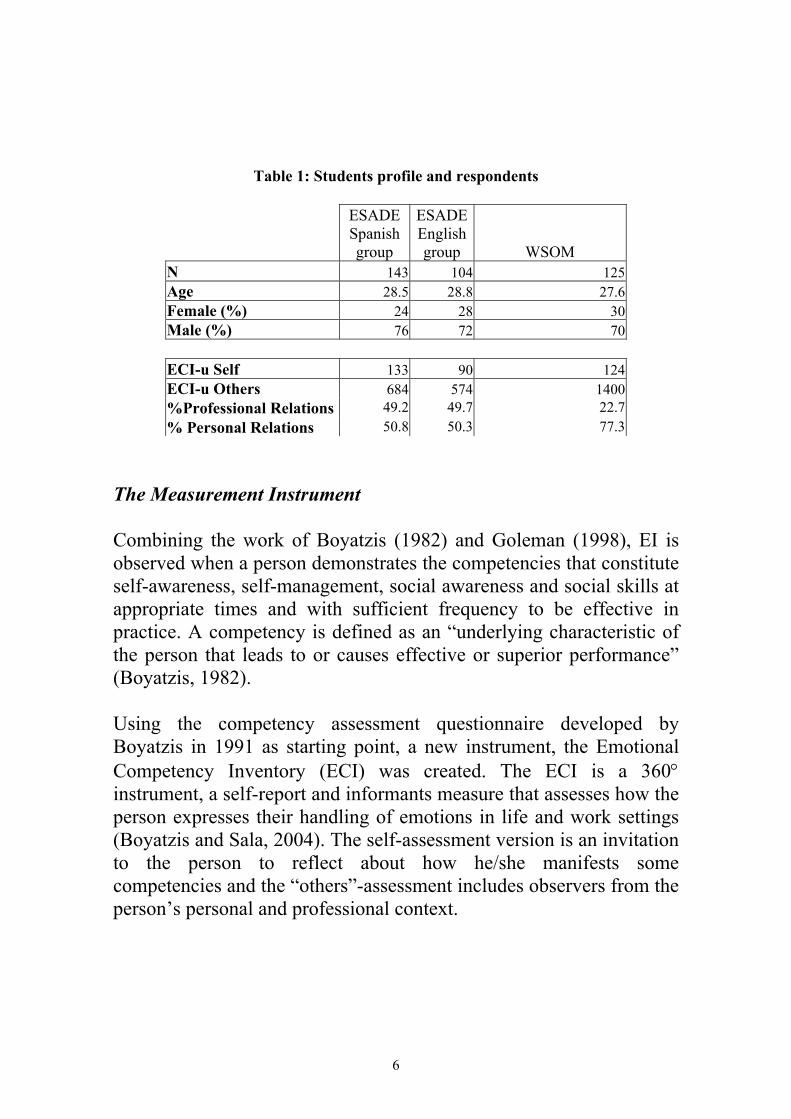
Methodology The Sample and Test The comparative study is based on three samples from the two Management Schools. Participants were 372 Full-Time MBA students, 125 coming from WSOM,-and 247 coming from ESADE, Students at ESADE were split into two samples corresponding to the English (104 students) and Spanish (143 students) sections of the MBA program. In both schools, students belonged to the cohorts entering in 2003 and 2004. All students had signed Informed Consent for the use of their data. Students’ presented a similar age profile (Spanish: Mean=28.52, SD=2.227; English: Mean=28.80, SD=2.656; WSOM: Mean=27.63, SD=4.019). The percentage of women was slightly higher at WSOM (30% at Weatherhead and 24-28% at ESADE). The nationality composition in the three cohorts was culturally different. The full-time MBAs at WSOM were about 60% American/Canadian and 40% from other countries, mostly Asian. Meanwhile, the full time MBAs at ESADE (Spanish and English sections) were about 20% from Spain and 80% from other European countries and Latin America.
6
Table 1: Students profile and respondents
ESADE Spanish group
ESADEEnglish group WSOM
N 143 104 125 Age 28.5 28.8 27.6 Female (%) 24 28 30 Male (%) 76 72 70 ECI-u Self 133 90 124 ECI-u Others 684 574 1400 %Professional Relations 49.2 49.7 22.7 % Personal Relations 50.8 50.3 77.3
The Measurement Instrument Combining the work of Boyatzis (1982) and Goleman (1998), EI is observed when a person demonstrates the competencies that constitute self-awareness, self-management, social awareness and social skills at appropriate times and with sufficient frequency to be effective in practice. A competency is defined as an “underlying characteristic of the person that leads to or causes effective or superior performance” (Boyatzis, 1982). Using the competency assessment questionnaire developed by Boyatzis in 1991 as starting point, a new instrument, the Emotional Competency Inventory (ECI) was created. The ECI is a 360° instrument, a self-report and informants measure that assesses how the person expresses their handling of emotions in life and work settings (Boyatzis and Sala, 2004). The self-assessment version is an invitation to the person to reflect about how he/she manifests some competencies and the “others”-assessment includes observers from the person’s personal and professional context.
7
Based on sample collections and statistical analyses, the scales of the ECI were revised in 1998 and rewritten again in 1999. These changes affected the initial clustering proposed and the clustering of the ECI current version reflects a model of four groups of competences: self-awareness, self-management, social awareness and social skills (e.g. Goleman et al., 2002; Boyatzis et al. 2000). The ECI-U is the university version of the questionnaire. The WSOM version has 72 items, while the ESADE version uses only a subset of those. Both samples used 61 items in common. They are assessed with a five-point scale. It is formed by eighteen competencies grouped in five clusters: 1) Self-Awareness (Emotional self-awareness, and Self-Confidence); 2) Self-Management (Emotional self-control, Adaptability, Achievement, Initiative and Optimism); 3) Social Awareness (Empathy, Organizational Awareness and Leveraging Diversity); and 4) Social Skills (Developing Others, Inspirational Leadership, Change Catalyst, Influence, Conflict Management, Teamwork and Collaboration); 5) Cognitive skills (Systems Thinking and Pattern Recognition). The ECI-U questionnaire has response categories based on frequency of demonstration or observation. An optional answer of ‘I don’t know’ or ‘I have not had the opportunity to observe the person in an appropriate setting’ is read into the data as blank. The current version of the ECI-U asks the respondent to describe each item on a scale of 1 to 5. Each step is progressively labelled from ‘... the behaviour is never shown’ to the highest response indicating ‘... the behaviour is consistently shown by the individual’. The data used in this research are the average of the responses of “other observers” to the ECI-U questionnaires evaluating each student. Originally written in English the ECI-U questionnaire was translated into Spanish following a doubled blinded process. The ESADE English sample and the WSOM sample completed the questionnaire in
8
English. The ESADE Spanish sample completed the questionnaire in Spanish. Design and Strategy of Analysis Before checking the existence of factorial invariance of the ECI-U, we specified a confirmatory factor analysis (CFA) for the Boyatzis and Goleman model (Boyatzis, 1982; Goleman, 1998, Goleman et al., 2002) on a sample of about 67,000 respondents using the ECI-2 (i.e., a similar by slightly different version of the test). Since we took a common strategy closer to what is known as model generating (Jöreskog & Sörbom, 1993), the empirical clusters showed a structure similar to the one from Boyatzis & Sala (2002) and slightly different from that originally hypothesised. In this chapter comparisons will be made based on this five cluster structure (Boyatzis et. al, 2005), which psychometric properties –validity and reliability– evaluation is beyond the scope of this chapter, and to save ink, we will only provide the final outcome regarding the retained items, competencies and clusters (See Table 2). The reader should be aware that due to sample size and representativeness of our data, any reference make to “significance” in this chapter will be understood as more descriptive and suggestive than inferential and conclusive.
9
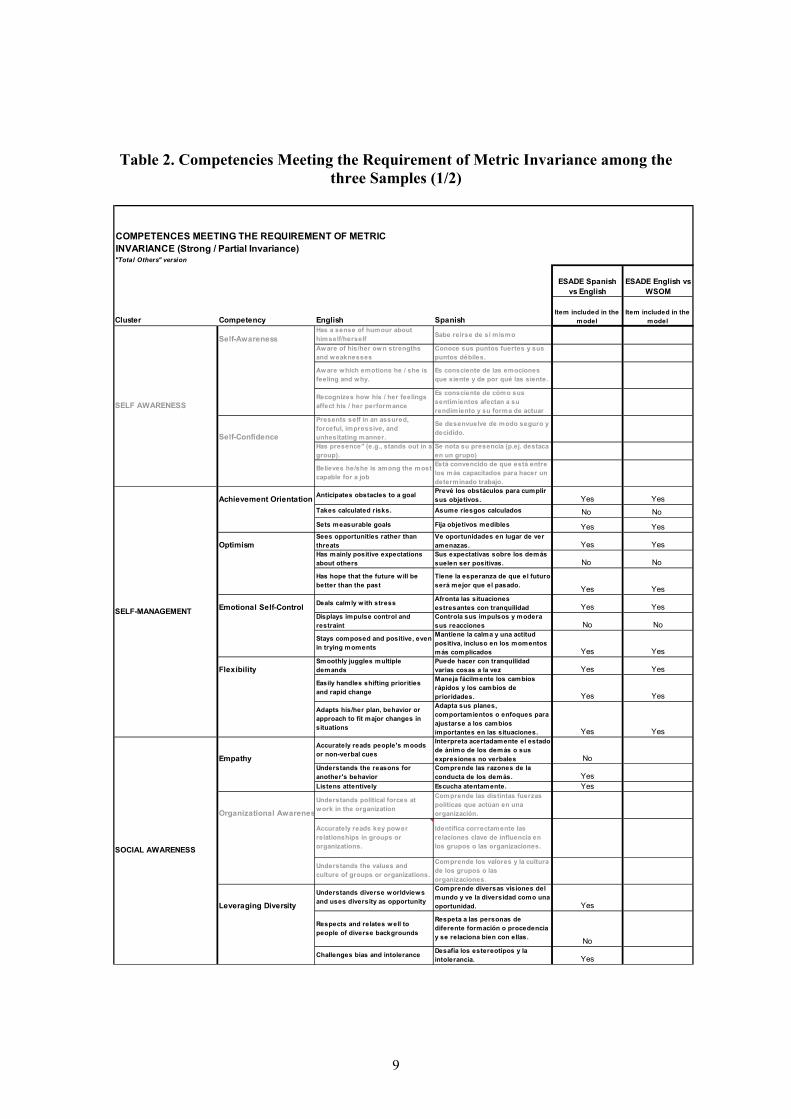
Table 2. Competencies Meeting the Requirement of Metric Invariance among the three Samples (1/2)
"Total Others" version
ESADE Spanish vs English
ESADE English vs WSOM
Cluster Competency English Spanish
Self-AwarenessHas a sense of humour about himself/herself Sabe reírse de sí mismo
Aw are of his/her ow n strengths and weaknesses
Conoce sus puntos fuertes y sus puntos débiles.
Aw are which emotions he / she is feeling and why.
Es consciente de las emociones que siente y de por qué las siente.
Recognizes how his / her feelings affect his / her performance
Es consciente de cómo sus sentimientos afectan a su rendimiento y su forma de actuar
Self-Confidence
Presents self in an assured, forceful, impressive, and unhesitating manner.
Se desenvuelve de modo seguro y decidido.
Has presence" (e.g., stands out in a group).
Se nota su presencia (p.ej. destaca en un grupo)
Believes he/she is among the most capable for a job
Está convencido de que está entre los más capacitados para hacer un determinado trabajo.
Achievement Orientation Anticipates obstacles to a goal Prevé los obstáculos para cumplir sus objetivos. Yes Yes
Takes calculated risks. Asume riesgos calculados No No Sets measurable goals Fija objetivos medibles Yes Yes
OptimismSees opportunities rather than threats
Ve oportunidades en lugar de ver amenazas. Yes Yes
Has mainly positive expectations about others
Sus expectativas sobre los demás suelen ser positivas. No No
Has hope that the future w ill be better than the past
Tiene la esperanza de que el futuro será mejor que el pasado. Yes Yes
Emotional Self-Control Deals calmly with stress Afronta las situaciones estresantes con tranquilidad Yes Yes
Displays impulse control and restraint
Controla sus impulsos y modera sus reacciones No No
Stays composed and positive, even in trying moments
Mantiene la calma y una actitud positiva, incluso en los momentos más complicados Yes Yes
FlexibilitySmoothly juggles multiple demands
Puede hacer con tranquilidad varias cosas a la vez Yes Yes
Easily handles shifting priorities and rapid change
Maneja fácilmente los cambios rápidos y los cambios de prioridades. Yes Yes
Adapts his/her plan, behavior or approach to fit major changes in situations
Adapta sus planes, comportamientos o enfoques para ajustarse a los cambios importantes en las situaciones. Yes Yes
Empathy
Accurately reads people's moods or non-verbal cues
Interpreta acertadamente el estado de ánimo de los demás o sus expresiones no verbales No
Understands the reasons for another's behavior
Comprende las razones de la conducta de los demás. Yes
Listens attentively Escucha atentamente. Yes
Organizational Awarenes
Understands political forces at work in the organization
Comprende las distintas fuerzas políticas que actúan en una organización.
Accurately reads key power relationships in groups or organizations.
Identifica correctamente las relaciones clave de influencia en los grupos o las organizaciones.
Understands the values and culture of groups or organizations.
Comprende los valores y la cultura de los grupos o las organizaciones.
Leveraging Diversity
Understands diverse worldviews and uses diversity as opportunity
Comprende diversas visiones del mundo y ve la diversidad como una oportunidad. Yes
Respects and relates w ell to people of diverse backgrounds
Respeta a las personas de diferente formación o procedencia y se relaciona bien con ellas. No
Challenges bias and intolerance Desafía los estereotipos y la intolerancia. Yes
Item included in the model
Item included in the model
COMPETENCES MEETING THE REQUIREMENT OF METRIC INVARIANCE (Strong / Partial Invariance)
SELF AWARENESS
SELF-MANAGEMENT
SOCIAL AWARENESS
10
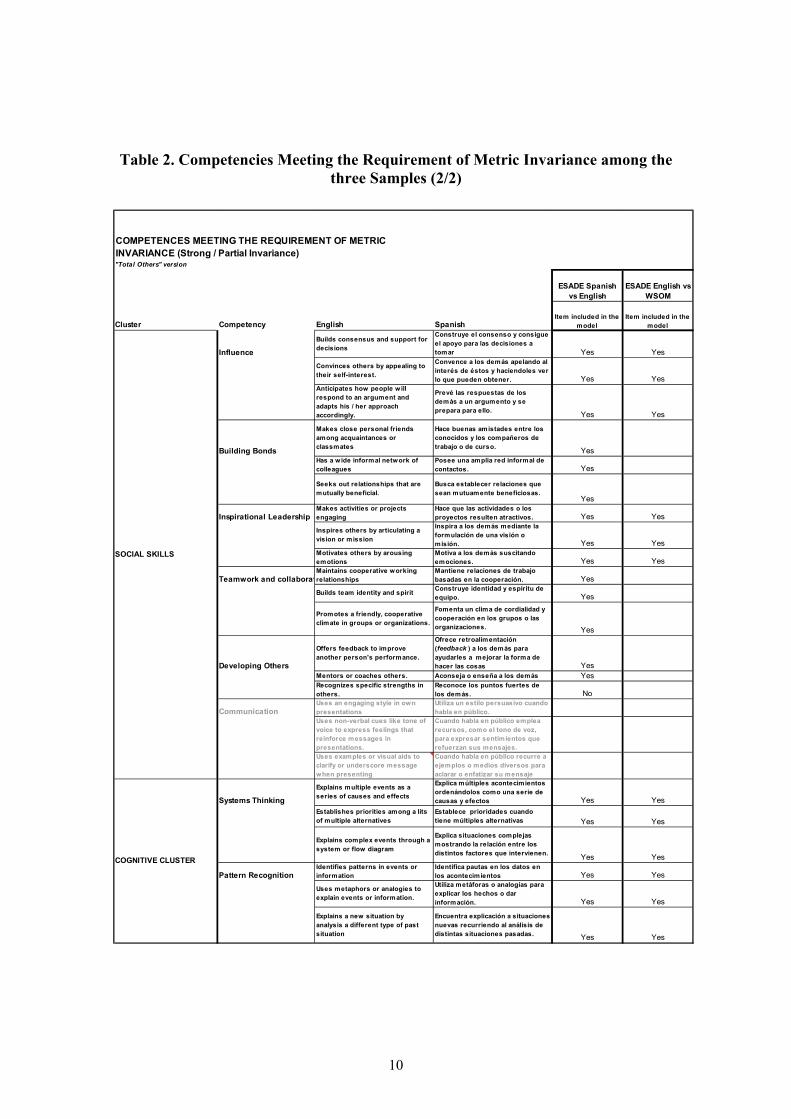
Table 2. Competencies Meeting the Requirement of Metric Invariance among the three Samples (2/2)
"Total Others" version
ESADE Spanish vs English
ESADE English vs WSOM
Cluster Competency English Spanish
Influence
Builds consensus and support for decisions
Construye el consenso y consigue el apoyo para las decisiones a tomar Yes Yes
Convinces others by appealing to their self-interest.
Convence a los demás apelando al interés de éstos y haciendoles ver lo que pueden obtener. Yes Yes
Anticipates how people will respond to an argument and adapts his / her approach accordingly.
Prevé las respuestas de los demás a un argumento y se prepara para ello. Yes Yes
Building Bonds
Makes close personal friends among acquaintances or classmates
Hace buenas amistades entre los conocidos y los compañeros de trabajo o de curso. Yes
Has a wide informal network of colleagues
Posee una amplia red informal de contactos. Yes
Seeks out relationships that are mutually beneficial.
Busca establecer relaciones que sean mutuamente beneficiosas.
Yes
Inspirational LeadershipMakes activities or projects engaging
Hace que las actividades o los proyectos resulten atractivos. Yes Yes
Inspires others by articulating a vision or mission
Inspira a los demás mediante la formulación de una visión o misión. Yes Yes
Motivates others by arousing emotions
Motiva a los demás suscitando emociones. Yes Yes
Teamwork and collaboratMaintains cooperative working relationships
Mantiene relaciones de trabajo basadas en la cooperación. Yes
Builds team identity and spirit Construye identidad y espíritu de equipo. Yes
Promotes a friendly, cooperative climate in groups or organizations.
Fomenta un clima de cordialidad y cooperación en los grupos o las organizaciones. Yes
Developing Others
Offers feedback to improve another person's performance.
Ofrece retroalimentación (feedback ) a los demás para ayudarles a mejorar la forma de hacer las cosas Yes
Mentors or coaches others. Aconseja o enseña a los demás YesRecognizes specific strengths in others.
Reconoce los puntos fuertes de los demás. No
CommunicationUses an engaging style in own presentations
Utiliza un estilo persuasivo cuando habla en público.
Uses non-verbal cues like tone of voice to express feelings that reinforce messages in presentations.
Cuando habla en público emplea recursos, como el tono de voz, para expresar sentimientos que refuerzan sus mensajes.
Uses examples or visual aids to clarify or underscore message when presenting
Cuando habla en público recurre a ejemplos o medios diversos para aclarar o enfatizar su mensaje
Systems Thinking
Explains multiple events as a series of causes and effects
Explica múltiples acontecimientos ordenándolos como una serie de causas y efectos Yes Yes
Establishes priorities among a lits of multiple alternatives
Establece prioridades cuando tiene múltiples alternativas Yes Yes
Explains complex events through a system or flow diagram
Explica situaciones complejas mostrando la relación entre los distintos factores que intervienen. Yes Yes
Pattern RecognitionIdentifies patterns in events or information
Identifica pautas en los datos en los acontecimientos Yes Yes
Uses metaphors or analogies to explain events or information.
Utiliza metáforas o analogías para explicar los hechos o dar información. Yes Yes
Explains a new situation by analysis a different type of past situation
Encuentra explicación a situaciones nuevas recurriendo al análisis de distintas situaciones pasadas. Yes Yes
COGNITIVE CLUSTER
Item included in the model
Item included in the model
COMPETENCES MEETING THE REQUIREMENT OF METRIC INVARIANCE (Strong / Partial Invariance)
SOCIAL SKILLS
11
Next, we tested the measurement equivalence of the clusters/subscales structure across groups with multi-group CFA models. Maximum likelihood was the estimation criteria used in the interactive LISREL 8.7 software. This approach allowed us to carry out two tests: Test 1 compares the two ESADE’s samples (which involved comparing the English and Spanish versions of the questionnaire); Test 2 compares the WSOM sample with the ESADE’s English section sample both using the same English version of the questionnaire. The combination of these two tests allow us to determine whether the instrument is equally understood for people from the three samples (and thus make comparison feasible), or, where understandings differ, to attribute the differences in interpretation to translation or cultural issues. If Test 1 shows significant differences and Test 2 does not, we could conclude that we have a translation problem. If Test 1 does not show significant differences but Test 2 does, then we could appreciate a cultural issue of interpretation. Finally, once factorial invariance was established through CFA models, we could then proceed to comparing competences across groups. Stages in the Evaluation of Measurement Equivalence The equivalence of measures can be established through sequential steps in nested multi-group mean and covariance structure models in order to determine the extent to which constructs can be compared across groups. The first requirement is configural invariance (structural or construct invariance) - i.e. that the individuals in the various groups conceptualise the constructs in the same way (Riordan and Vandenberg, 1994; Meredith, 1993, Vandenberg and Lance, 2000). Meeting this requirement implies that the same CFA model, the same
12
factor structures, will apply to with the same items, factors, free loadings, intercepts and error of variances. This first model is considered here as the basic model. In our study, acceptable levels of configural invariance mean that the cluster of competences applies to each group, i.e., that only the unidimensional competences within the cluster account for the interrelations among the items of the scale. It is possible that the configural invariance condition may not be met if the cultures or life experiences of those in each group are so different as to render the meaning of the constructs different (this may also be the case if the construct does not exist for a given group - see Batista-Foguet & Saris, 1997). The condition may also not be met where there are problems in translating the questionnaire. Indeed, the issue may even arise where groups interpret words written in the same language in different ways (for example, as a result of educational differences between groups). Usually, the first step to ensure configural equivalence involves to fit a CFA model to the data by combining all the samples and then to compare this separately for each of the samples. However, in our case since we had previously established (Goleman, Boyatzis and McKee, 2002) clusters of specific competences we have used them as the basis for our comparison. So, configural invariance will be tested in only one step by applying the same CFA model to each one of the already established clusters on the three groups. This implies that the same construct is being assessed; however score levels (i.e. measurement units) may or may not be equivalent across groups. The second requirement is metric invariance (or measurement unit equivalence), which in addition to configural invariance, also requires that loadings are the same in both groups. Thus, the composition of factors must be constant and the weight of each variable in the factor construction (i.e. loadings) should be constrained to be equal across both groups. So, we can now assume that the units of measurement are the same for the groups and thus that differences between group scores
13
can be meaningfully compared. Metric invariance is a requirement for being able to compare variances and co-variances between groups or regression coefficients relating factors. Some authors (Byrne et al., 1989) argue that if some of the items fulfil these conditions, that is sufficient to anchor a common meaning to the factors between groups. This is the so-called partial factorial invariance. A third requirement is strong factorial invariance (or scalar invariance). In addition to metric invariance, scalar invariance requires that the origin of the measurement scale has to be the same (i.e., that the constant terms in the measurement equations –should be constrained to be equal across groups). Strong factorial invariance is a requirement for being able to compare factor means (which is the final aim of this chapter) between groups, but it is sufficient that it be met by some of the items in each dimension. Comparisons of scores across groups are only meaningful if this highest level of equivalence has been established. On the Diagnostic Indexes of SEM As has been mentioned, examining measurement equivalence of each cluster of competences across groups involves testing configural, metric and strong factorial invariance conditions that lead to comparison of nested models (i.e., a scalar model is nested in the metric model, which in turn is nested in a configural model). For some unfathomable reason, this comparison is usually carried out using only the change statistic in χ2 and ignoring all other measures of goodness of fit (e.g. Byrne et al. 1989; Reise et al., 1993; Steenkamp and Baumgartner, 1998). The advantage of using SEM is that it provides various global diagnostic indices. Furthermore, given that both our case sample size and the reliability leave something to be desired, we can use the full range of these indices that summarize the
14
overall goodness of fit of the model (note that such indices usually prove too sensitive in other situations because their power is too high). Cheung and Rensvold (2002) used a large-scale simulation to show that Bentler’s (1990) Comparative Fit Index (CFI, which according to Hu & Bentler, 1999, values equal or superior to 0.95 indicate a good model’s fit to the data) was the most appropriate index for establishing whether there was construct invariance. Those authors suggested computing the difference (∆CFI) between the CFI figures for both models. If the CFI falls by 0.01 or less on introducing the restrictions, the restricted model is considered valid and the factorial invariance condition is deemed to have been met. Fortunately, this criterion (which has so far only been established for two-group) applies to our comparison strategy. Moreover, since our clusters do not include too many competences, the models were not complex and as a consequence CFI will be a trusty tool for the comparisons made (Beauducel & Wittmann, 2005). In our case, since sample size does not matters (i.e. excessive power is not involved), besides ∆CFI we could also use the χ2 change (∆χ2) for comparing a model with any other that only differs by relaxing one or more restrictions. A nested model meets the bill here. Under the null hypothesis (restrictions are correct) the statistic is distributed as a χ2 with degrees of freedom equal to the number of restrictions tested. However, Satorra (2000) or Satorra & Bentler (2001) showed that the difference between two χ2 cannot be obtained by computing the simple difference between them (since ∆χ2 is not robust to non-normality even if bothχ2 statistics are), So in Tables 3 and 4 the robust χ2 change is computed as Satorra & Bentler proposed. However, our reduced sample size does not allow computation of fourth order moments, and as a consequence the scaling correction of χ2 by Satorra and Bentler (SBχ2, 1988, 1994) can not be computed. Accordingly, we have used the Normal theory weighted least squares chi-square statistic for computing the robust χ2 change in Tables 3 and 4.
15
Another useful index is the Standardized Root Mean Square Residual (SRMR: Bentler. 1995), that Hu and Bentler’s (1999) decision rules claim that a model adequately fits the data if SRMR <0.05. However, SRMR can also be improved by using the degrees of freedom instead of the number of variances and covariances (Corten et al., 2000) to take parsimony into account. Tables 3 & 4 show this correction of SRMR (PSRMR). The most popular statistic of global fit nowadays is probably the Root Mean Squared Error of Approximation (RMSEA due to Steiger, 1990), which also takes into account model parsimony (corrects for the degrees of freedom) and has a threshold (values below 0.06, lead to model’s not rejection (Browne & Cudeek, 1992; see also Hu and Bentler, 1999)). Moreover, since the sampling distribution of the RMSEA is known, it is possible to construct confidence intervals and test the hypothesis of approximate fit (0.05 and 0.08, constitute the usual thresholds for the lower and upper boundaries of the 90% RMSEA confidence interval).
16
Results A CFA model is specified for each of the 5 empirical clusters (self awareness, self management, social skills, leadership, and cognitive) close to the ones established by Boyatzis, Goleman and Rhee (2000) and further empirically clarified by Boyatzis and Sala (2004). Then a multigroup analysis for testing metric equivalence among the groups revealed that only three of the clusters (self management, leadership and cognitive) actually met all the requirements for the necessary equivalence in order to carried out the two comparative tests proposed. Regarding Test 1, comparing the two ESADE’s groups, it turned out that almost every indicator-item included to measure the competences within all but one cluster (Self awareness) were construct equivalent meaning that respondents saw the clusters as sets of interrelated competencies that are conceptualized in the same way. Differences in means were not significant in the clusters, with the sole exception of the social skills one. In this cluster, the Spanish group systematically evaluates higher than the English group for all competencies. The fit parameters for the CFA are shown in Table 3. The configural invariance column indicates whether the two groups met the construct invariance condition. As has been mentioned, Comparative Fit Index (CFI) above 0.95, a Root mean Square Error of Approximation (RMSEA) lower than 0.06 with lower and upper boundaries of its 90% Confidence Interval below the aforementioned threshold, and PSRMR values not exceeding 0.05, reveals that a single factor accounts for the interrelationships among the items of a competency. Since all the empirical clusters met this condition, we interpret that evaluators perceive consistent relationship among competencies within each cluster. Since configural equivalence was demonstrated, it justified the interpretation that observers from both groups understand the same when talking about self-management, social skills, leadership, and cognitive competences. However, our aim is to compare the scores of
17
these competences between the two groups and to check whether the items are equivalent in metric and scalar terms. This requires that loadings and intercepts of corresponding items must be the same in both groups. The next column in Table 3 shows the results of the previous model where both, loadings and intercepts have been restricted to be equal across the two groups.
18
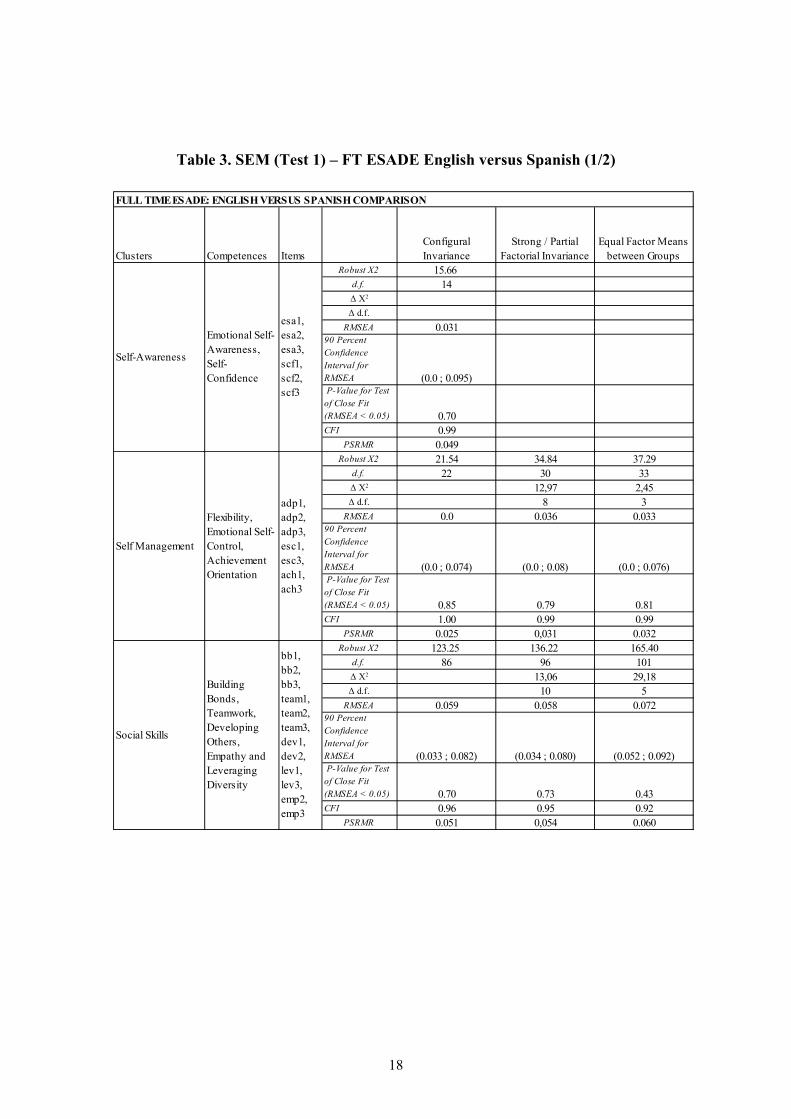
Table 3. SEM (Test 1) – FT ESADE English versus Spanish (1/2)
Clusters Competences ItemsConfigural Invariance
Strong / Partial Factorial Invariance
Equal Factor Means between Groups
Robust X2 15.66 d.f. 14∆ X2
∆ d.f.RMSEA 0.031
90 Percent Confidence Interval for RMSEA (0.0 ; 0.095) P-Value for Test of Close Fit (RMSEA < 0.05) 0.70CFI 0.99
PSRMR 0.049Robust X2 21.54 34.84 37.29
d.f. 22 30 33∆ X2 12,97 2,45∆ d.f. 8 3
RMSEA 0.0 0.036 0.03390 Percent Confidence Interval for RMSEA (0.0 ; 0.074) (0.0 ; 0.08) (0.0 ; 0.076) P-Value for Test of Close Fit (RMSEA < 0.05) 0.85 0.79 0.81CFI 1.00 0.99 0.99
PSRMR 0.025 0,031 0.032Robust X2 123.25 136.22 165.40
d.f. 86 96 101∆ X2 13,06 29,18∆ d.f. 10 5
RMSEA 0.059 0.058 0.07290 Percent Confidence Interval for RMSEA (0.033 ; 0.082) (0.034 ; 0.080) (0.052 ; 0.092) P-Value for Test of Close Fit (RMSEA < 0.05) 0.70 0.73 0.43CFI 0.96 0.95 0.92
PSRMR 0.051 0,054 0.060
Self Management
Flexibility, Emotional Self-Control, Achievement Orientation
adp1, adp2, adp3, esc1, esc3, ach1, ach3
FULL TIME ESADE: ENGLISH VERSUS SPANISH COMPARISON
Social Skills
Building Bonds, Teamwork, Developing Others, Empathy and Leveraging Diversity
bb1, bb2, bb3, team1, team2, team3, dev1, dev2, lev1, lev3, emp2, emp3
Self-Awareness
Emotional Self-Awareness, Self-Confidence
esa1, esa2, esa3, scf1, scf2, scf3
19
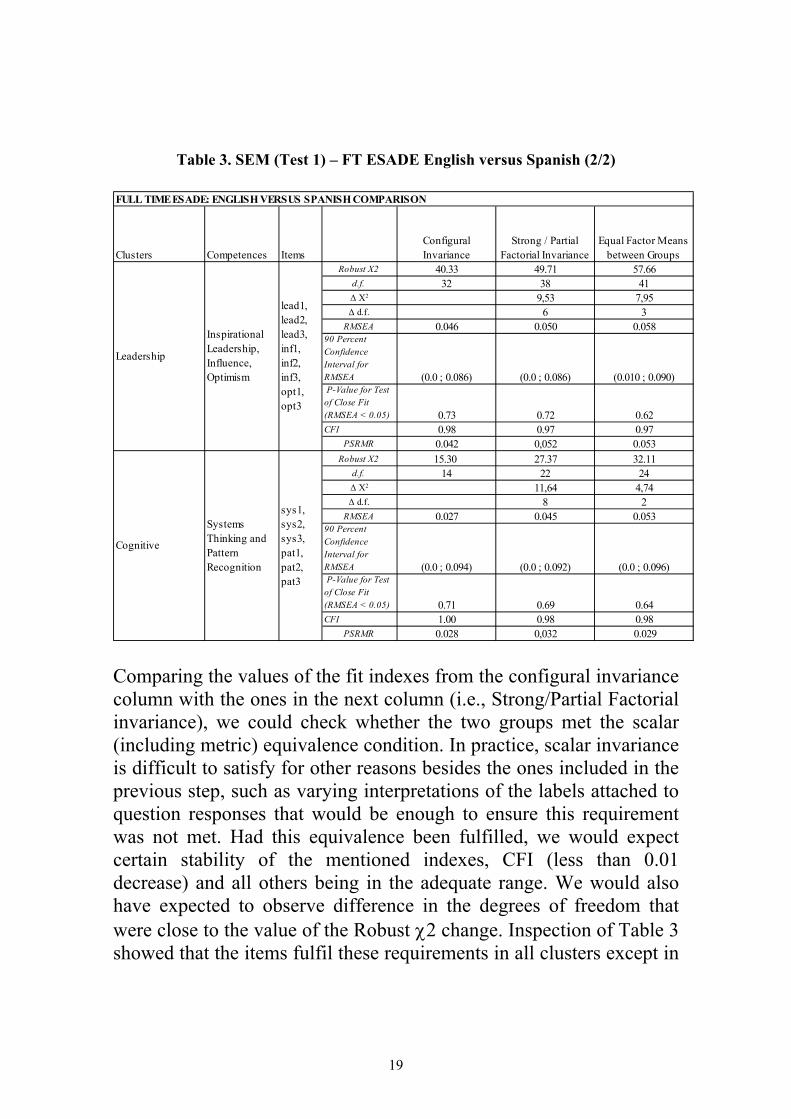
Table 3. SEM (Test 1) – FT ESADE English versus Spanish (2/2)
Clusters Competences ItemsConfigural Invariance
Strong / Partial Factorial Invariance
Equal Factor Means between Groups
Robust X2 40.33 49.71 57.66d.f. 32 38 41∆ X2 9,53 7,95∆ d.f. 6 3
RMSEA 0.046 0.050 0.05890 Percent Confidence Interval for RMSEA (0.0 ; 0.086) (0.0 ; 0.086) (0.010 ; 0.090) P-Value for Test of Close Fit (RMSEA < 0.05) 0.73 0.72 0.62CFI 0.98 0.97 0.97
PSRMR 0.042 0,052 0.053Robust X2 15.30 27.37 32.11
d.f. 14 22 24∆ X2 11,64 4,74∆ d.f. 8 2
RMSEA 0.027 0.045 0.05390 Percent Confidence Interval for RMSEA (0.0 ; 0.094) (0.0 ; 0.092) (0.0 ; 0.096) P-Value for Test of Close Fit (RMSEA < 0.05) 0.71 0.69 0.64CFI 1.00 0.98 0.98
PSRMR 0.028 0,032 0.029
Cognitive
Systems Thinking and Pattern Recognition
sys1, sys2, sys3, pat1, pat2, pat3
Leadership
Inspirational Leadership, Influence, Optimism
lead1, lead2, lead3, inf1, inf2, inf3, opt1, opt3
FULL TIME ESADE: ENGLISH VERSUS SPANISH COMPARISON
Comparing the values of the fit indexes from the configural invariance column with the ones in the next column (i.e., Strong/Partial Factorial invariance), we could check whether the two groups met the scalar (including metric) equivalence condition. In practice, scalar invariance is difficult to satisfy for other reasons besides the ones included in the previous step, such as varying interpretations of the labels attached to question responses that would be enough to ensure this requirement was not met. Had this equivalence been fulfilled, we would expect certain stability of the mentioned indexes, CFI (less than 0.01 decrease) and all others being in the adequate range. We would also have expected to observe difference in the degrees of freedom that were close to the value of the Robust χ2 change. Inspection of Table 3 showed that the items fulfil these requirements in all clusters except in
20
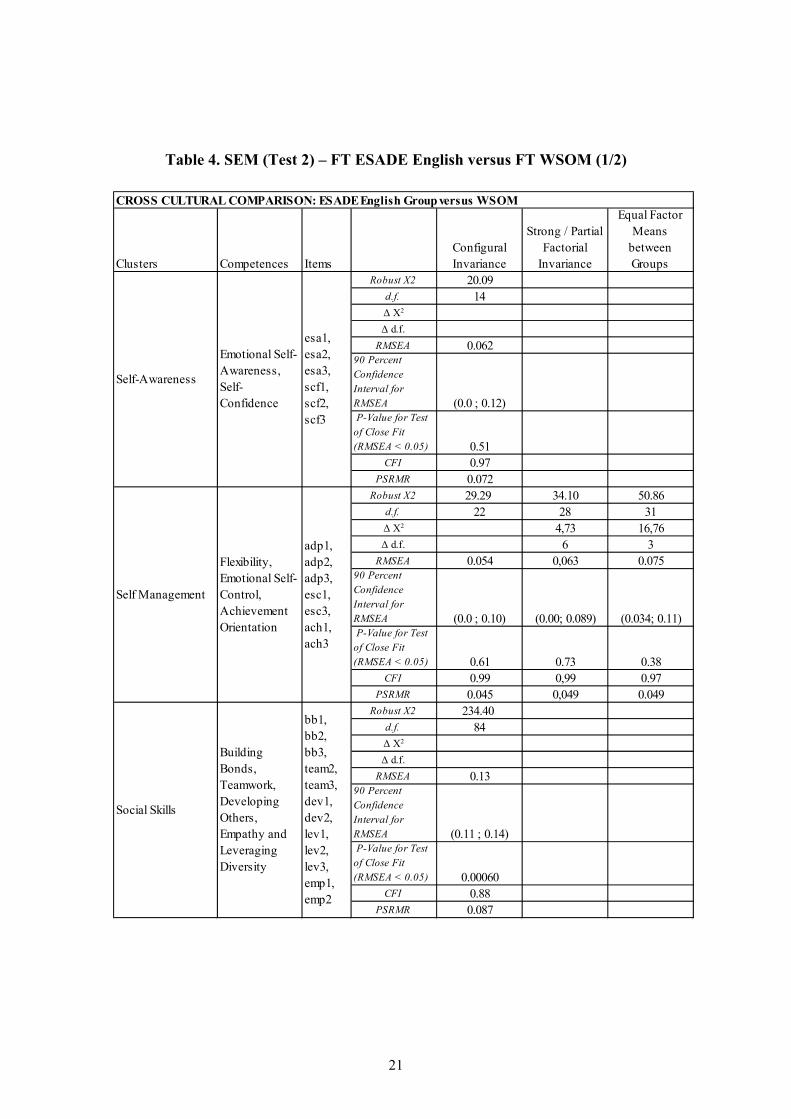
Self-awareness, where observers from the two samples appear to construct the competencies of this cluster in a different way. Since the analysis confirms our hypotheses, we are entitled to move from column 2 to column 3 (note that the previous CFA model introduced the restriction of equal competency means in both groups). Then, if we observe a significant Robust χ2 change, we may conclude that genuine differences exist in the means of the latent competencies of the compared groups. Table 5 shows the means at competency level and the differences between the two groups. Results of the competencies of the self awareness cluster are not comparable. But, we can interpret that Self-management, Leadership and Cognitive clusters include competencies which means are equal, while, we have observed significant differences of some competencies included in the social skills cluster across both groups. For Test 2, Table 4 illustrates the comparison of ESADE’s English group with WSOM, and shows that only three clusters of competencies – (Self-management, Leadership and Cognitive) met the factorial invariance requirements. Differences among the means of the latent competencies were not significant in Leadership and Cognitive clusters but were significant in Self-management. In this cluster, Table 6 shows that the evaluations of the WSOM group are systematically higher than ESADE’s English group for all competencies.
21
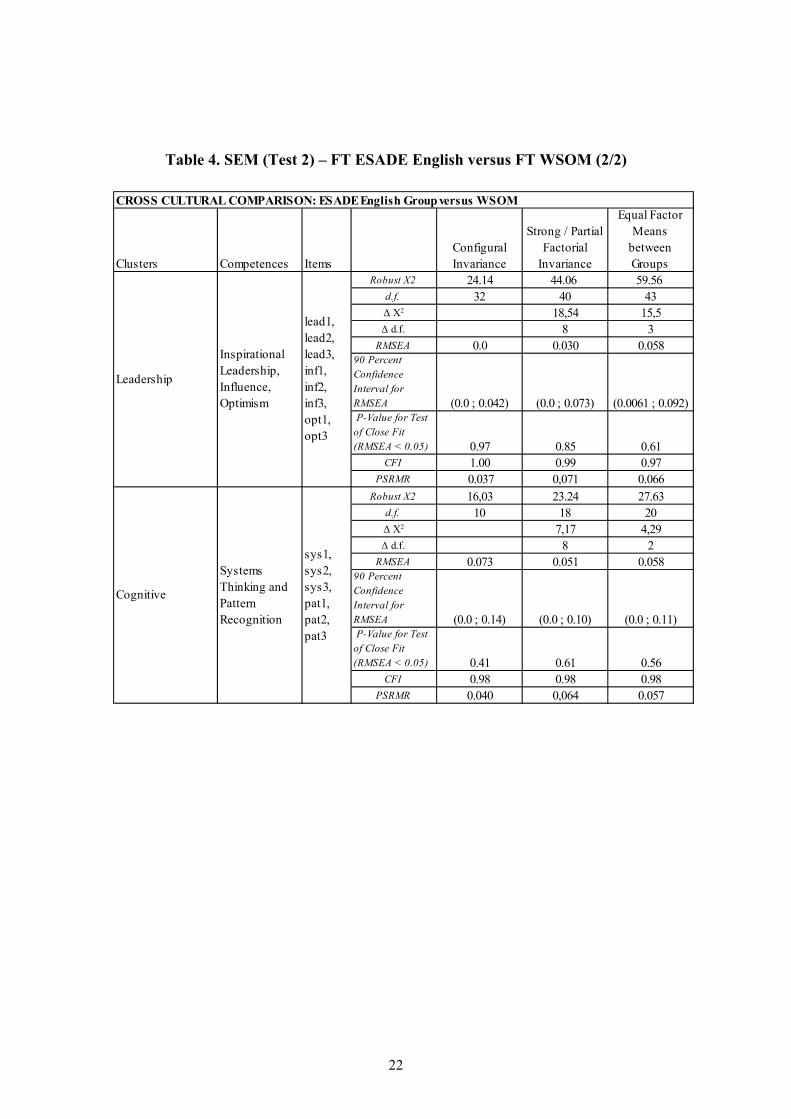
Table 4. SEM (Test 2) – FT ESADE English versus FT WSOM (1/2)
Clusters Competences ItemsConfigural Invariance
Strong / Partial Factorial
Invariance
Equal Factor Means
between Groups
Robust X2 20.09d.f. 14∆ X2
∆ d.f.RMSEA 0.062
90 Percent Confidence Interval for RMSEA (0.0 ; 0.12) P-Value for Test of Close Fit (RMSEA < 0.05) 0.51
CFI 0.97PSRMR 0.072
Robust X2 29.29 34.10 50.86d.f. 22 28 31∆ X2 4,73 16,76∆ d.f. 6 3
RMSEA 0.054 0,063 0.07590 Percent Confidence Interval for RMSEA (0.0 ; 0.10) (0.00; 0.089) (0.034; 0.11) P-Value for Test of Close Fit (RMSEA < 0.05) 0.61 0.73 0.38
CFI 0.99 0,99 0.97PSRMR 0.045 0,049 0.049
Robust X2 234.40 d.f. 84∆ X2
∆ d.f.RMSEA 0.13
90 Percent Confidence Interval for RMSEA (0.11 ; 0.14) P-Value for Test of Close Fit (RMSEA < 0.05) 0.00060
CFI 0.88PSRMR 0.087
CROSS CULTURAL COMPARISON: ESADE English Group versus WSOM
Self Management
Flexibility, Emotional Self-Control, Achievement Orientation
adp1, adp2, adp3, esc1, esc3, ach1, ach3
Building Bonds, Teamwork, Developing Others, Empathy and Leveraging Diversity
bb1, bb2, bb3, team2, team3, dev1, dev2, lev1, lev2, lev3, emp1, emp2
Self-Awareness
Emotional Self-Awareness, Self-Confidence
esa1, esa2, esa3, scf1, scf2, scf3
Social Skills
22
Table 4. SEM (Test 2) – FT ESADE English versus FT WSOM (2/2)
Clusters Competences ItemsConfigural Invariance
Strong / Partial Factorial
Invariance
Equal Factor Means
between Groups
Robust X2 24.14 44.06 59.56 d.f. 32 40 43∆ X2 18,54 15,5∆ d.f. 8 3
RMSEA 0.0 0.030 0.05890 Percent Confidence Interval for RMSEA (0.0 ; 0.042) (0.0 ; 0.073) (0.0061 ; 0.092) P-Value for Test of Close Fit (RMSEA < 0.05) 0.97 0.85 0.61
CFI 1.00 0.99 0.97PSRMR 0.037 0,071 0.066
Robust X2 16,03 23.24 27.63d.f. 10 18 20∆ X2 7,17 4,29∆ d.f. 8 2
RMSEA 0.073 0.051 0.05890 Percent Confidence Interval for RMSEA (0.0 ; 0.14) (0.0 ; 0.10) (0.0 ; 0.11) P-Value for Test of Close Fit (RMSEA < 0.05) 0.41 0.61 0.56
CFI 0.98 0.98 0.98PSRMR 0.040 0,064 0.057
CROSS CULTURAL COMPARISON: ESADE English Group versus WSOM
Cognitive
Systems Thinking and Pattern Recognition
sys1, sys2, sys3, pat1, pat2, pat3
Leadership
Inspirational Leadership, Influence, Optimism
lead1, lead2, lead3, inf1, inf2, inf3, opt1, opt3
23
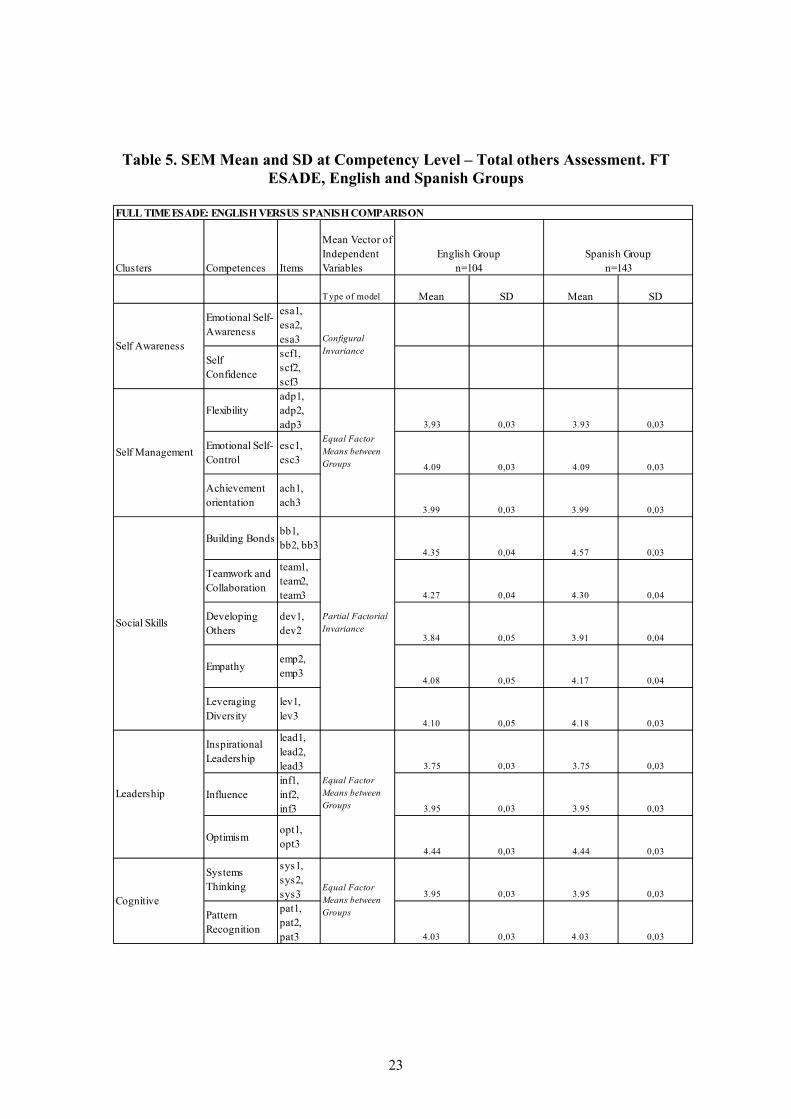
Table 5. SEM Mean and SD at Competency Level – Total others Assessment. FT ESADE, English and Spanish Groups
Clusters Competences Items
Mean Vector of Independent Variables
Type of model Mean SD Mean SD
Emotional Self-Awareness
esa1, esa2, esa3
Self Confidence
scf1, scf2, scf3
Flexibilityadp1, adp2, adp3 3.93 0,03 3.93 0,03
Emotional Self-Control
esc1, esc3
4.09 0,03 4.09 0,03
Achievement orientation
ach1, ach3
3.99 0,03 3.99 0,03
Building Bondsbb1, bb2, bb3
4.35 0,04 4.57 0,03
Teamwork and Collaboration
team1, team2, team3 4.27 0,04 4.30 0,04
Developing Others
dev1, dev2
3.84 0,05 3.91 0,04
Empathyemp2, emp3
4.08 0,05 4.17 0,04
Leveraging Diversity
lev1, lev3
4.10 0,05 4.18 0,03
Inspirational Leadership
lead1, lead2, lead3 3.75 0,03 3.75 0,03
Influenceinf1, inf2, inf3 3.95 0,03 3.95 0,03
Optimismopt1, opt3
4.44 0,03 4.44 0,03
Systems Thinking
sys1, sys2, sys3 3.95 0,03 3.95 0,03
Pattern Recognition
pat1, pat2, pat3 4.03 0,03 4.03 0,03
FULL TIME ESADE: ENGLISH VERSUS SPANISH COMPARISON
English Group n=104
Spanish Group n=143
Equal Factor Means between Groups
Self Awareness
Self Management
Cognitive
Social Skills
Leadership
Configural Invariance
Equal Factor Means between Groups
Partial Factorial Invariance
Equal Factor Means between Groups
24
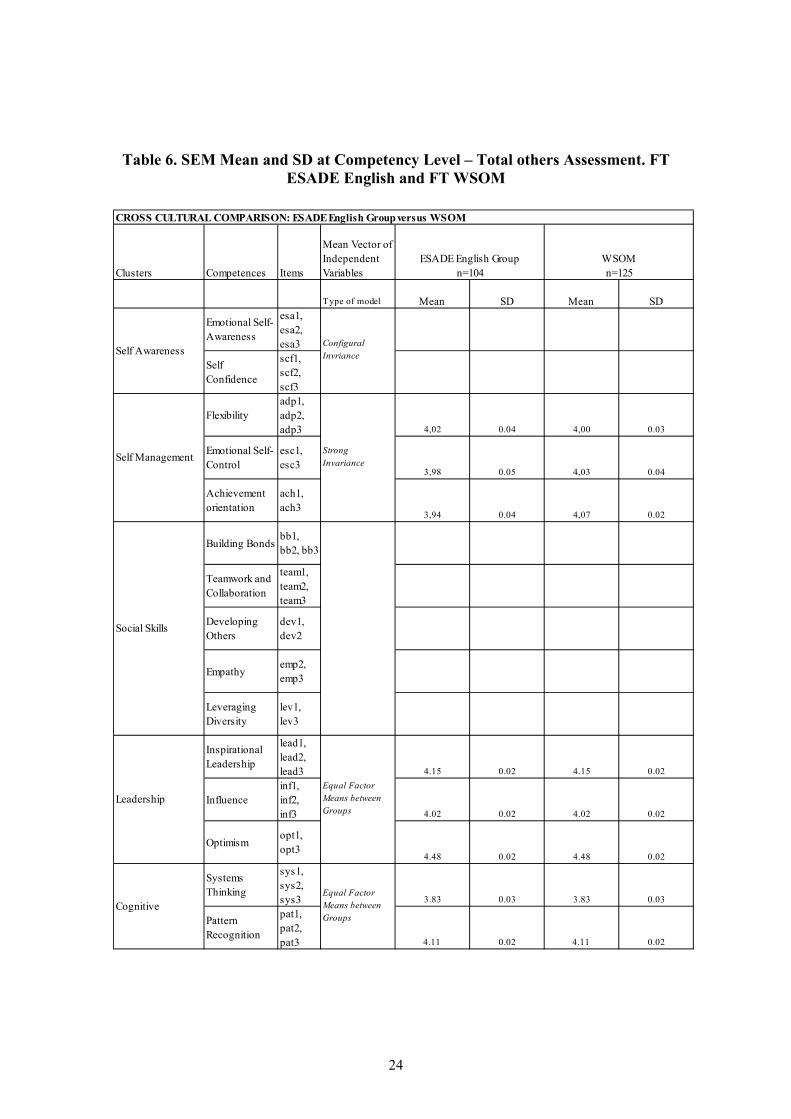
Table 6. SEM Mean and SD at Competency Level – Total others Assessment. FT ESADE English and FT WSOM
Clusters Competences Items
Mean Vector of Independent Variables
Type of model Mean SD Mean SD
Emotional Self-Awareness
esa1, esa2, esa3
Self Confidence
scf1, scf2, scf3
Flexibilityadp1, adp2, adp3 4,02 0.04 4,00 0.03
Emotional Self-Control
esc1, esc3
3,98 0.05 4,03 0.04
Achievement orientation
ach1, ach3
3,94 0.04 4,07 0.02
Building Bondsbb1, bb2, bb3
Teamwork and Collaboration
team1, team2, team3
Developing Others
dev1, dev2
Empathyemp2, emp3
Leveraging Diversity
lev1, lev3
Inspirational Leadership
lead1, lead2, lead3 4.15 0.02 4.15 0.02
Influenceinf1, inf2, inf3 4.02 0.02 4.02 0.02
Optimismopt1, opt3
4.48 0.02 4.48 0.02
Systems Thinking
sys1, sys2, sys3 3.83 0.03 3.83 0.03
Pattern Recognition
pat1, pat2, pat3 4.11 0.02 4.11 0.02
Equal Factor Means between Groups
Self Awareness
Self Management
Cognitive
Social Skills
Leadership
Configural Invriance
Strong Invariance
Equal Factor Means between Groups
CROSS CULTURAL COMPARISON: ESADE English Group versus WSOM
ESADE English Group n=104
WSOM n=125
25
Self Awareness competencies were not construct equivalent among the two groups, so were are not entitled to establish any comparisons. Social Skills do not even meet this first requirement, meaning that this set of competencies was not perceived as a cluster for at least respondents from one of the two groups. As we saw in Test 1, both ESADE’s groups met this requirement so we could conclude that it was the WSOM group which does not recognise this cluster. To sum up, both ESADE’s samples admit the comparison for the clusters Self management, Social skills, Leadership, and Cognitive but not for Self-awareness. This could be a problem in translating the questionnaire, or one involving emotional expression of Self-awareness (that which is observable by others in social and work settings). ESADE’s English group sample and WSOM admit the comparison for clusters such as Self-management, Leadership and Cognitive, but not for Self-awareness and Social skills. This could mean that in Self-awareness and social skills, the problem may be also due to a different understanding of the items raising a cross-cultural or a semantic issue. Analysis per Cluster The Leadership cluster including Inspirational leadership and Influence, coming from the theoretical Relationship Management cluster, and Optimism, coming from the theoretical Self-Management cluster met the three requirements of Factorial equivalence when comparing the two ESADE’s groups and ESADE’s English group with WSOM. CFI varies from 0.98 to 0.97 in Test 1 and from 1 to 0.99 in Test 2. All the other indexes are within the established parameters (Table 3). So these competencies are not only comparable but they are equally evaluated in all three samples. The results were even better with the Cognitive cluster including Systems thinking and Pattern recognition. One should note in passing
26
that in Test 2 (Table 4) RMSEA was not as good when configural invariance was tested (0.073) but shows a surprisingly significant decrease when the highest level of equivalence restrictions were introduced (0.051). So, if there were any initial doubt about the consistency of the cluster, this is dispelled by the strong agreement in the interpretation of the items among respondent in both groups. From the original Self-Management cluster we kept Flexibility, Emotional self control and Achievement. This cluster met the three requirements of factorial invariance when comparing the two ESADE’s samples and also for the comparison between the ESADE’s English group and WSOM group. However, unlike in Table 3, column 3, Table 4 shows that the latter comparison reveals different competency means in both groups. So, these competencies are comparable and equally evaluated by respondents of the two ESADE’s samples and are also comparable but differently evaluated by ESADE’s English group and WSOM. From the theoretical cluster, we ruled out Initiative which showed very poor consistency and Optimism which fitted better in the Leadership cluster. The Social Skills cluster combines competencies coming from the theoretical clusters Social Awareness and Relationship Management. This includes Empathy, Leveraging diversity, Building bonds, Teamwork, and Developing others. Again, when comparing the two ESADE’s samples, this cluster met the three requirements while the comparison between the ESADE’s English group and WSOM did not meet any requirement (Table 4 shows that configural invariance was already rejected). These competencies are comparable between the two ESADE’s samples (with Spanish group respondents evaluating always higher than English group respondents) but are not comparable between ESADE’s English group and WSOM. In fact, WSOM respondents do not even see this group of competencies as a consistent cluster. Furthermore, from the theoretical model we previously ruled out Organizational awareness, Communication, Conflict management, and Change catalyst which had a very poor consistency.
27
Emotional Self-Awareness and Self-Confidence could form a fifth cluster although it only met the first requirement of configural invariance in both comparative tests. Column 1 in Table 4 rejects that the items of the cluster even have configural invariance. This means that respondents from all three samples see an important relationship between the two competencies but they conceptualize them in very different ways. Means comparisons The means of the latent competencies evaluated for the observers in the three groups are shown in Tables 5 and 6. Comparing the FT ESADE Spanish with the English one, it can be stated that means of the competencies are not different in three clusters -Self-Management, Leadership and Cognitive. On the contrary, since Self-awareness cluster met only the requirement of configural invariance does not allow us to make any comparison. Nevertheless, Emotional Self-Awareness has a higher mean in the English group (mean: 4.34; SD: 0.05) than in the Spanish one (mean: 4.13; SD: 0.04) while Self-confidence shows an opposite pattern (English Group: mean=4.22; SD=0.04, Spanish Group: mean=4.29, SD=0.04). This reinforces the idea of the students of the two groups conceptualizing these two competencies in different ways. The Social Skills cluster shows a tendency in all competencies of being scored higher in the Spanish section than in the English one. In this case, Partial Invariance was met, because an item of the Developing Others competence (dev2) was not constrained. Comparing the FT ESADE English and the FT WSOM, two clusters have not shown differences in competencies’ means, which are Leadership and Cognitive. In the same way that the ESADE Spanish and English comparison, the Self-awareness cluster only met the
28
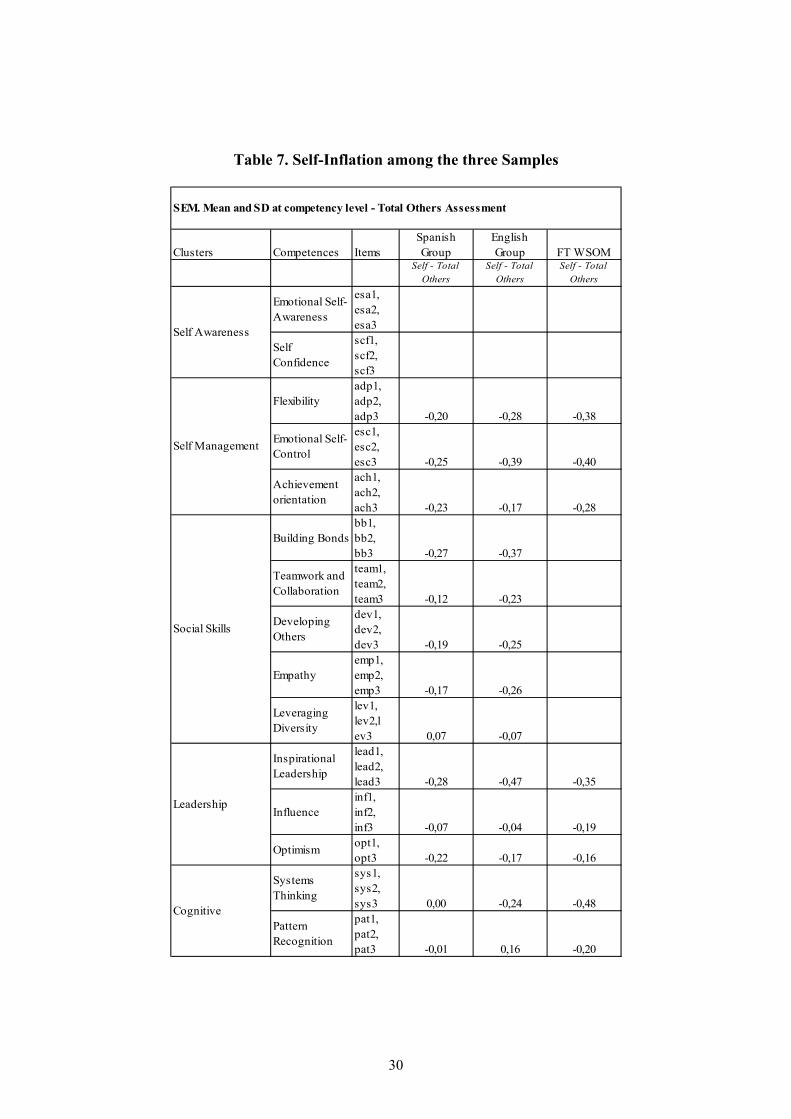
requirement of configural invariance with Emotional Self-Awareness having a higher mean in the English group (mean: 4.34; SD: 0.05) than in the WSOM one (mean: 4.26; SD: 0.04) and Self confidence showing an opposite pattern (English Group: mean=4.22; SD=0.04, Spanish Group: mean=4.32, SD=0.03). Again, this reinforces the idea of the students of the two groups conceptualizing these two competencies in different ways. The Self-Management cluster shows a tendency in all competencies (Flexibility, Emotional Self-Control, and Achievement Orientation) of being scored higher and with less variability by the WSOM sample than by the ESADE English one. The Social Skills cluster does not even meet the criteria of Configural Invariance, because of this fact competencies’ means cannot be compared. Self versus Others’ Scores The self assessment version of the questionnaire was used to calculate a self inflation score to capture differences between the three samples of our study (self scores minus average others’ scores). Unfortunately, this difference score can also be interpreted as the degree of critically observing others-- not only inflated self-assessment. That is, the difference can increase when others’ routinely observe a person with more critical eyes, and therefore, lower their assessment of the frequency with which the person shows the behaviour assessed in the item. Only comparable competencies in the SEM analysis were used in this section (Table 7). Participants in the three samples tend to be rated higher by others than by themselves. The FT ESADE Spanish sample has more adjusted profiles at competency levels than ESADE English and WSOM. The WSOM sample is the one that shows greater “Self – Total Others” gaps at competency level. This suggests that the WSOM sample either shows a tendency toward greater self-inflation, or more critical assessments of their behaviour by others, or both. Both tendencies could be interpreted as reflecting
29
cultural differences of the North American and Asian samples at WSOM and the Spanish, Latin American, and European samples at ESADE.
30
Table 7. Self-Inflation among the three Samples
Clusters Competences ItemsSpanish Group
English Group FT WSOM
Self - Total Others
Self - Total Others
Self - Total Others
Emotional Self-Awareness
esa1, esa2, esa3
Self Confidence
scf1, scf2, scf3
Flexibilityadp1, adp2, adp3 -0,20 -0,28 -0,38
Emotional Self-Control
esc1, esc2, esc3 -0,25 -0,39 -0,40
Achievement orientation
ach1, ach2, ach3 -0,23 -0,17 -0,28
Building Bondsbb1, bb2, bb3 -0,27 -0,37
Teamwork and Collaboration
team1, team2, team3 -0,12 -0,23
Developing Others
dev1, dev2, dev3 -0,19 -0,25
Empathyemp1, emp2, emp3 -0,17 -0,26
Leveraging Diversity
lev1, lev2,l ev3 0,07 -0,07
Inspirational Leadership
lead1, lead2, lead3 -0,28 -0,47 -0,35
Influenceinf1, inf2, inf3 -0,07 -0,04 -0,19
Optimism opt1, opt3 -0,22 -0,17 -0,16
Systems Thinking
sys1, sys2, sys3 0,00 -0,24 -0,48
Pattern Recognition
pat1, pat2, pat3 -0,01 0,16 -0,20
SEM. Mean and SD at competency level - Total Others Assessment
Cognitive
Self Awareness
Self Management
Social Skills
Leadership
31
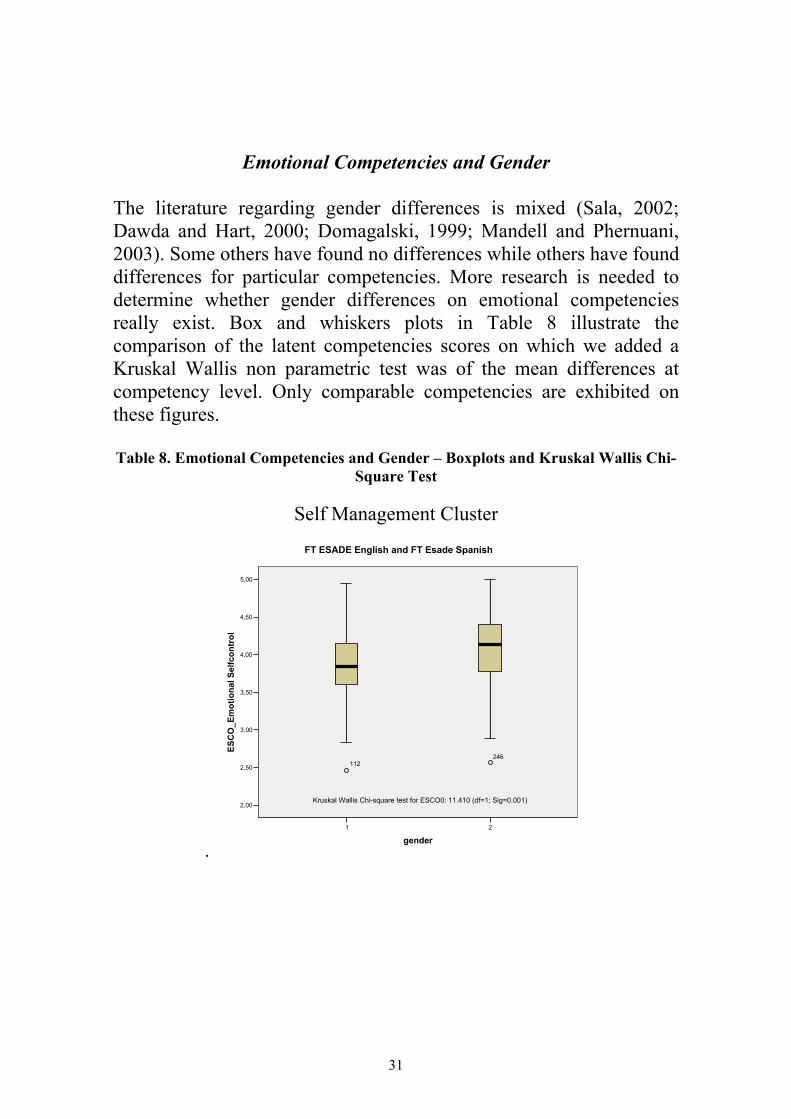
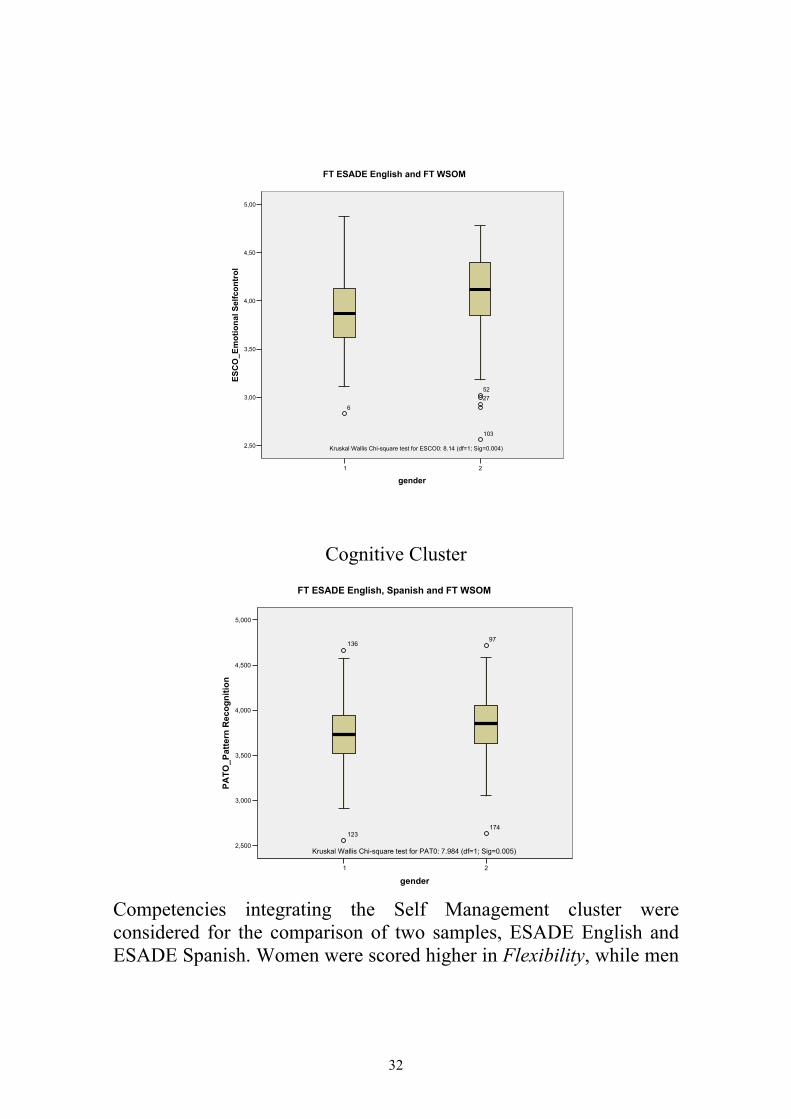
Emotional Competencies and Gender The literature regarding gender differences is mixed (Sala, 2002; Dawda and Hart, 2000; Domagalski, 1999; Mandell and Phernuani, 2003). Some others have found no differences while others have found differences for particular competencies. More research is needed to determine whether gender differences on emotional competencies really exist. Box and whiskers plots in Table 8 illustrate the comparison of the latent competencies scores on which we added a Kruskal Wallis non parametric test was of the mean differences at competency level. Only comparable competencies are exhibited on these figures. Table 8. Emotional Competencies and Gender – Boxplots and Kruskal Wallis Chi-
Square Test
Self Management Cluster
. 21
gender
5,00
4,50
4,00
3,50
3,00
2,50
2,00
ESC
O_E
mot
iona
l Sel
fcon
trol
246112
FT ESADE English and FT Esade Spanish
Kruskal Wallis Chi-square test for ESCO0: 11.410 (df=1; Sig=0.001)
32
21
gender
5,00
4,50
4,00
3,50
3,00
2,50
ESC
O_E
mot
iona
l Sel
fcon
trol
5227
103
6
Kruskal Wallis Chi-square test for ESCO0: 8.14 (df=1; Sig=0.004)
FT ESADE English and FT WSOM
Cognitive Cluster
21
gender
5,000
4,500
4,000
3,500
3,000
2,500
PATO
_Pat
tern
Rec
ogni
tion
97
174
136
123
Kruskal Wallis Chi-square test for PAT0: 7.984 (df=1; Sig=0.005)
FT ESADE English, Spanish and FT WSOM
Competencies integrating the Self Management cluster were considered for the comparison of two samples, ESADE English and ESADE Spanish. Women were scored higher in Flexibility, while men
33
were scored higher in Emotional Self-Control and Achievement Orientation (statistical difference running Kruskal Wallis test was found only for Emotional Self-Control at 0.001 significance level). Comparing the ESADE English group and the FT WSOM, women were scored higher only in Flexibility. Again, only Emotional Self-control shows a statistical difference (chi-square: 8.14; sig.: 0.004). In the Social Skills cluster, the ESADE English and the ESADE Spanish samples may be considered together to analyse gender differences. Men were scored higher in Building Bonds and Teamwork and Collaboration. On the contrary, women have higher scores in Developing Others, Empathy and Leveraging Diversity. All three groups can be compared on the Leadership cluster. However differences were only found significant in the comparison between ESADE’s English group and WSOM. Women were scored higher in Inspirational Leadership, while men do so in Optimism and Influence. The Cognitive cluster admits also comparison across the three groups of our study. In both competencies, Systems Thinking and Pattern Recognition, men were scored higher than women. A significant statistical difference was found for Pattern Recognition with a Kruskal Wallis Chi square test of 7.984 (sig.: 0.005; see Table 8).
Emotional Competencies and Age The hypothesis of Emotional Intelligence increasing with age, claimed by many authors (e.g. Goleman, 1995, Salovey and Mayer, 1999; Boyatzis and Sala, 2004), is not corroborated in this study. It may be due to the reduced age range in our sample.
34
Interpretation and Conclusions ECI-U as an instrument measuring emotional intelligence competencies is used among groups of different cultural backgrounds. The complex analyses conducted suggested that the use of the test among various cultural groups is statistically and theoretically supported, but not for all of the clusters of competencies. Selected competencies revealed a problem with comparability which may have arisen from translation problems, cultural interpretation of the behaviour being assessed, cultural appropriateness (i.e., degrees of good versus bad) of the behaviour being shown, or a meaningful difference in the frequency of using these competencies in different cultures. The analyses attempted to clarify which of these likely culprits reduced the comparability of each competency in question. Comparison across groups is feasible between the two ESADE samples for all empirical clusters but one, self-awareness, while between ESADE’s English group and WSOM comparison is feasible in all clusters but two, self-awareness and social skills. Following a traditional ANOVA or t-tests, we would have compared the three samples without any restriction, ignoring that some competencies were not equally conceptualized by the respondents. The results of Test 1 (ESADE’s English and Spanish versions) and Test 2 (ESADE’s English group and WSOM) confirm the partial consistency of the theoretical clusters2 and lead us to think that there are no problems of translation that could interfere in the comparison, except for the Self awareness cluster. Even in that case, we may think that there is a different kind of problem. Competencies in this cluster can present a special difficulty to observers because most items refer to inner feelings. The cultures reflected by the North American and Asian sample from WSOM and the Spanish, European and Latin American samples at ESADE may show consistent differences in 2 Research shows that actual appearance of the competencies and clusters may be different than theoretical ones (Boyatzis and Sala, 2004).
35
willingness to reveal, or express, such emotional self-awareness. Even if shown, if there are cultural differences in the perceived appropriateness of revealing such emotions (i.e., differences in cultural norms), then confessing such emotions may prove embarrassing. In such cases, a respondent may answer untruthfully or be swayed in their judgement. The comparative analysis confirms the robustness of the clusters of leadership, which includes Inspirational leadership, Optimism and Influence, and Cognitive, including Systems thinking and Pattern recognition. They are fully comparable and show no significant differences between the three samples. The Leadership cluster could be seen as the most “up-beat,” positive and energetic of the competencies assessed. In this sense, it is remarkable that there was such consistency cross the cultural groups. Common perceptions and stereotypes available in the media suggest differences would have been dramatic on this set of competencies. The Cognitive cluster of competencies uses items assessing the expression of a person’s thoughts. The fact that such different cultures revealed similar patterns of such expression is impressive. At the same time, the expression of such thoughts and analysis are less laden with emotional cues and meaning. The latter could make them easier to “read” cross cultures. The fact that configural invariance is not met for the other clusters when comparing the ESADE’s English group with WSOM may be because the cultures or life experiences of those in each group are so different as to render the meaning of the constructs different. This may also be the case because the construct does not exist for a given group, such as in the social skill cluster on WSOM. Nevertheless, the issue may arise where groups interpret words written in the same language in different ways. For example, as a result of educational differences between groups which could be possible in multicultural samples with people coming from US, Asia, Europe responding to the English version of the questionnaire, and people coming from Spain and Latin America responding to the Spanish version. As this type of
36
equivalence holds in the two ESADE’s groups it could not be concluded that there are problems in translating the questionnaire. In order to have a better understanding of the fact that the social skills cluster shows no consistency for the WSOM sample, we combined the competencies of social skills and leadership clusters to apply a single group CFA which do not reject the underlying factorial structure. This could mean that while ESADE’s respondents distinguish between acting as a leader and working or relating with others, WSOM respondents do not, seeing both roles directly linked. That is, they may see far more convergence among the theoretical clustering of Relationship management than the empirical clusters separating the two (Boyatzis and Sala, 2004). Competencies that were ruled out because of their very poor consistency in the empirical model, such as initiative, organizational awareness, communication, conflict management, and change catalyst, have in common that the items or behavioural indicators are worded in terms more easily observed in professional settings. In fact, a majority of respondents of the ECI-U in the two samples came from personal relationships which could have contaminated the reliability of the judgements. Overall, this analysis supports the use of 360° format questionnaires across cultures. But, there are certain fields of human behaviour (in this case, competencies) that are problematic for a variety of reasons. It is hoped that further research can assess the relative impact of each of the possible sources of lower comparability. The result could be reliable measures of important competencies that affect work performance, and more qualitative measures for those competencies that require more contextual interpretation.
37
References Austin, E. J. (2004) “An investigation of the relationship between trait emotional intelligence and emotional task performance,” Personality and Individual Differences, 36: 1855-1864. Batista-Foguet, J. M.; Saris, W. E. (1997) “Tests of stability in attitude research,” Quality & Quantity, 31, 269-285. Beauducel, A.; Wittmann, W. W (2005) “Simulation Study on Fit Indexes in CFA Based on Data with Slightly Distorted Simple,” Structural Equation Modelling, 12(1): 41-75. Bentler, P. M. (1990) “Comparative fit indexes in structural modelling,” Psychological Bulletin, 107, 238-246. Boyatzis, R. E. (1982) The Competent Manager. A Model for Effective Performance. John Wiley and Sons. Boyatzis, R. E. (1994) “Stimulating self-directed learning through the Managerial Assessment and Development Course,” Journal of Management Education, 18(3). Boyatzis, R. E.; Baker, A.; Leonard, D.; Rhee, K.; Thompson, L. (1995) “Will it make a difference?: Assessing a value-based, outcome oriented, competency-based professional program.” In: Boyatzis, R. E.; Cowen, S. S.; Kolb, D. A. (ed.) Innovating in Professional Education: Steps on a journey from teaching to learning. San Francisco: Jossey-Bass. Boyatzis, R. E.; Batista-Foguet, J. M.; Serlavós, R. (2005) Which is the Underlying Model and the Appropriate Analysis Strategy for Assessing Emotional Intelligence Competencies. Paper presented at the First EASR Conference. Barcelona, 18-22 July.
38
Boyatzis, R. E.; Sala, F. (2004) “Assessing Emotional Intelligence Competencies.” Forthcoming in: Geher, G. The Measurement of Emotional Intelligence. Hauppauge, NY, Novas Science Publishers. Boyatzis, R. E.; Goleman, D.; Rhee, K (2000) “Clustering Competence Emotional Intelligence: Insights from the Emotional Competence Inventory (ECI).” In: Bar-On, R.; Parker, J. D. Handbook of Emotional Intelligence. San Francisco, Jossey-Bass. Chapter 16: 343-362. Browne, M. W.; Cudek, R. (1993) “Alternative ways of assessing model fit,” Sociological Methods and Research, 21, 230-258. Byrne, B. M.; Shavelson, R. J.; Muthén, B. (1989) “Testing for the equivalence of factor covariance and mean structures: the issue of partial measurement invariance,” Psychological Bulletin, 105, 456-466. Cheung, G. W.; Rensvold, R. B. (2002) “Evaluating goodness-of-fit indexes for testing measurement invariance,” Structural Equation Modelling, 9, 233-255. Corten, I. W.; Saris, W. E.; Coenders, G.; van der Veld, W.; Aalberts, C. E.; Kornelis, C. (2002) “Fit of Different Models for Multitrait-Multimethod Experiments,” Structural Equation Modelling, 9: 213-232. Dawda, D.; Hart, S. D. (2000) “Assessing emotional intelligence: reliability and validity of the Bar-On Emotional Quotient Inventory (EQ-i) in university students,” Personality and Individual Differences 28: 797-812.
39
Day, A. L.; Carroll, S. A. (2004) “Using an ability-based measure of emotional intelligence to predict individual performance, group performance, and group citizenship behaviours,” Personality and Individual Differences, 36: 1443-1458. Domagalski, T. A. (1999) “Emotion in Organizations: Main Currents,” Human Relations, 52(6): 833-852. Dulewicz, V.; Higgs, M. (2000) “Emotional Intelligence: A Review and Evaluation Study,” Journal of Managerial Psychology 15(4): 341-372. Du Toit, M.; Du Toit, S. (2001) Interactive LISREL, User’s Guide. Chicago, IL: Scientific Software International. Goleman, D. (1998) La práctica de la inteligencia emocional. Kairós. Goleman, D. (2001) “An EI-Based Theory of Performance”. Cherniss, C.; Goleman, D. The Emotionally Intelligent Workplace. San Francisco, Jossey-Bass. Goleman, D.; Boyatzis, R. E.; McKee, A. (2002) El líder resonante crea más. Plaza & Janés. (Special edition for ESADE Association.) Hu, L.; Bentler; P. M. (1998) “Fit indices in structure modelling: Sensitivity to underparameterized model specification.” Psychological Methods, 3, 424-453. Little, T. D. (1997) “Mean and covariance structure (MACS) analyses of cross-cultural data: practical and theoretical issues,” Multivariate Behavioural Research, 32, 53-76. Mandell, B.; Phernuani, S. (2003) “Relationship between emotional intelligence and transformational leadership style: A gender comparison,” Journal of Business and Psychology, 17(3).
40
Mayer, J. D.; Caruso, D. R.; Salovey, P. (1999) “Emotional Intelligence meets traditional standards for an intelligence,” Intelligence, 27(4): 267-298. Meredith, W. (1993): “Measurement invariance, factor analysis and factorial invariance,” Psychometrika, 58, 525-543. Mullen, Michael R. (1995) “Determining measurement equivalence in cross-national research,” Journal of International Business Studies, 26(3): 573-96. Raykov, T.; Penev, S. (1998) “Nested Covariance Structure Models: Non-centrality and Power of Restriction Test”, Structural Equation Modelling, 5, 229-246. Reise, S. P.; Widaman, K. F.; Pugh, R. H. (1993) “Confirmatory factor analysis and item Response theory: two approaches for exploring measurement invariance,” Psychological Bulletin, 114, 552-566. Riordan, C. M.; Vandenberg, R. J. (1994) “A central question in cross-cultural research: do employees of different cultures interpret work-related measures in an equivalent manner?,” Journal of Management, 20, 643-671. Sala, F. (2002) Emotional Competence Inventory (ECI). Technical Manual. Downloaded from www.eiconsortium.org, Hay Group. McClelland Center for Research and Innovation. Satorra, A. (2000) “Scaled and Adjusted Restricted Tests in Multi-Sample Analysis of Moment Structures.” In: Heijmans, D. D. H.; Pollock, D. S. G.; Satorra, A. (eds.) Innovations in Multivariate Statistical Analysis: A Festschrift for Heinz Neudecker. Dordrecht: Kluwer Academic Publishers, pp. 233-247.
41
Satorra, A.; Bentler, P. (2001) “A scaled difference chi-square test statistic for moment structure analysis,” Psychometrika, 66, 507-514. Spencer, L. M. J.; Spencer, S. M. (1993) Competence at Work: Models for Superior Performance. New York, John Wiley & Sons. Steenkamp, J. E. M.; Baumgartner, H. (1998) “Assessing measurement invariance in cross-national consumer research,” Journal of Consumer Research, 25, 78-90. Steiger, J. H. (1990) “Structural Model Evaluation and Modifications: An interval estimation approach,” Multivariate Behavioral Research, 25, 173-180. Vanderberg, R. J.; Lance, C. E. (2000) “A review and synthesis of the measurement invariance literature: Suggestions, practices, and recommendations for organizational research,” Organizational Research Methods, 3(1): 4-69.