SPECTRUM Fruit Wastes Contain Mango kernels, banana peels ...

GHANAAssessing Economic Bene!ts:
The Case of Banana, Mango, and Rice
March 2009


GHANAAssessing Economic Bene!ts:
The Case of Banana, Mango, and Rice
March 2009
!is publication was produced to contribute to the on-going dialogue on evidence-based policy making as promoted by the Ministry of Trade and Industry and the Ministry of Food and Agriculture. It was prepared by USAID’s Trade and Investment Program for a Competitive Export Economy (TIPCEE).
!is report was prepared by the consultant Brent Bartlett. !e author’s views expressed in this publication do not necessarily reflect the views of United States Agency for Inter-national Development or the United States Government.
!is document was developed with support from the United States Agency for Interna-tional Development (USAID)’s Trade and Investment Program for a Competitive Export Economy (TIPCEE). Contract No. GS 23F 9800H, Task Order 641-M-00-05-00037.
For electronic copies, contact:USAID/TIPCEE: [email protected]
iii
V. RiceA. Benefit EstimateB. CompetitivenessC. Volume PotentialD. Timing of BenefitE. PriceF. Ghana Value-AddedG. Ghanaians Benefited
VI. !ree-Product ComparisonsA. Economic Benefits per AcreB. Other Considerations in
Assessing Benefits
VII. Other Policy Considerations
VIII. Conclusions
Appendix
Executive Summary
I. Introduction
II. Defining Economic BenefitA. Direct Economic BenefitsB. Indirect Economic BenefitsC. !e Common Yardstick for
Product Comparisons: Per-Acre Analysis
D. Other Considerations in Assessing Benefits
III. Bananas A. Benefit Estimate
B. CompetitivenessC. Timing of BenefitsD. Volume PotentialE. PriceF. Ghanaian Value-AddedG. Ghanaians Benefited
IV. MangosA. Benefit EstimateB. CompetitivenessC. Timing of BenefitsD. Volume PotentialE. PriceF. Ghana Value-AddedG. Ghanaians Benefited
TABLE OF CONTENTS

iv
Figure Title
1 Economic Benefit by Crop Budget: Banana, Mango, Rice
II-1 Direct Benefits: Schematic Example II-2 Direct and Indirect Benefits: Schematic Example II-3 Direct and Indirect Benefits: Schematic Example with Two TurnoversII-4 Indirect Benefits: Another Look at the Arithmetic II-5 Indirect Benefits: Probable Range of Economic Multiplier
III-1 Bananas: Potential Economic Benefit III-2 Bananas: Elements of a Crop Budget III-3 Bananas: Exports to the European Market: Ghana’s Potential III-4 Bananas: Suitability Factors by Region
IV-1 Mangos: Potential Economic Benefit IV-2 Mangos: Yield per Tree IV-3 Mangos: Cash Outlays per Year IV-4 Mangos: Direct Economic Benefits over Time IV-5 Mangos: Assumed Share by Destination in Profit Calculation
V-1 Rice: Potential Economic Benefit V-2 Rice: Reported Cost Elements per RegionV-3 Rice: Yield per Hectare V-4 Rice: Yield Di"erences Among !ree Crop Techniques and LocationsV-5 Rice: Person-Days by Region
VI-1 Economic Benefit by Crop Budget: Banana, Mango, Rice VI-2 Economic Benefit Depends on Yield and Price VI-3 Summary of Attributes
A-1 Economic Benefit Comparison per Acre: !ree Products and Twelve Crop BudgetsA-2 Example of a Crop Budget: MangoA-3 Example of a Crop Budget: Rice
LIST OF FIGURES

v

vi

1
EXECUTIVE SUMMARY
Assessing Economic Bene!t: The Case of Banana, Mango, and Rice
!e objective of this study was to identify, and where possible quantify, the economic benefits arising from expanded banana, mango, and rice sectors in Ghana. !ese eco-nomic benefits can be measured in terms of monetary value, in number of people (ad-ditional employment and additional dependents supported), and in less quantifiable aspects, such as strengthening Ghana’s internal economic linkages and enhancing the country’s commercial reputation.
!is study also illustrates the important role of evidence-based policy making in govern-ment decisions regarding where best to apply limited economic resources. In this case, support for banana, mango, and rice production can each produce positive economic benefits for the Ghanaian economy and the Ghanaian people, but the techniques de-scribed in this paper can provide better information regarding which of these three sectors would generate the most benefit given the physical, technological, and commercial cir-cumstances of each product. With such results, policy support — constrained by limited resources — can be more e"ective.
Direct economic benefits are those expenditures made in the production of the commod-ity in question — bananas, mangos, or rice — for Ghanaian labor or for inputs produced in Ghana. !e Ghanaian workers and companies receiving such payments will, in turn, spend a portion of these proceeds on other goods and services in Ghana, thus giving rise to indirect economic benefits. Often indirect benefits exceed direct benefits as increased expenditures lead to increased incomes, which in turn lead to yet higher expenditures elsewhere in the economy.
Figure 1 presents one estimate of the direct and indirect economic benefits from a single planted acre, after the initial start-up investment phase, derived from nine rice crop bud-

2
gets from three Ghanaian regions, two crop budgets for mangos in Ghana, and a com-posite crop budget for bananas based on international experience likely most applicable to large-scale banana production in Ghana. For any given acre on which bananas, man-gos, and rice can all be grown and sold commercially and competitively, bananas produce the largest economic benefits to Ghana, mangos the next largest, with rice producing the least benefits.
Comparing the potential economic benefit from these three commodities is complicated by several important di"erences among the three crops, including whether the crops can be competitively produced in Ghana, the timing of economic benefit arising from the sec-tor’s expenditures after the initial investment, the potential volume of crop production, the future price of the product, the share of value-added inputs from Ghanaian labor and investment, and other, less quantifiable economic benefits. !is report will review these factors for each of the three products.
Other policy factors may weigh heavily in determining where economic-development resources are best devoted, but estimating total economic benefit (direct plus indirect) of
6,000
5,000
4,000
3,000
Wor
awor
a
Dek
por
Afp
afu
Line
so
Kik
am
Kpa
tili
Din
goni
Gol
inga
Beta
Alp
ha
Kobi
na
Ano
krom
Rice
Direct Indirect
Rice Rice
Figure 1. Economic Bene!t by Crop Budget: Banana, Mango, Rice
Rice
Volta RegionWestern Region
Northern Region
Rice Rice Rice Rice Rice BananaMangoMango
2,000
1,000
0
Eco
nom
ic B
ene!
t (c
edis
per
acr
e)

3
potential increases in agricultural commodities is a key element in evidence-based deci-sion making.
I. Introduction
!e objective of this report was to identify, and where possible quantify, the economic benefits arising from an expanded horticultural sector in Ghana, with particular reference to bananas, mangos and rice. !ese economic benefits can be measured in terms of value, in terms of people (additional employment and additional dependents supported), and in terms of stronger political, social, and economic structures. Moreover, the techniques illustrated here can play a key role in evidence-based economic policymaking.
Selection of three products. !e economic-benefit techniques employed in this paper are applicable to any good or service that is produced for sale, either domestically or for export. !e three horticultural products examined here — bananas, mangos, and rice — were chosen for several reasons. First, bananas and mangos are non-traditional sectors for Ghana and the role of domestic rice in Ghana’s food supply is not as prominent as it once was, thus suggesting each of these products could play a larger, more beneficial role in Ghana’s agricultural economy.
Indeed, each has already shown some potential for a larger contribution to Ghana’s economy. In the case of bananas, two enterprises — Volta River Estates Limited and Golden Exotics — began operations in Ghana, growing bananas for export to the Euro-pean market, producing foreign exchange, revenues, and employment where none existed before. Exports to the EU rose from near zero in the mid 1990s to nearly 5,000 metric tons in 2008.
Similarly, Ghanaian mango production and exports to the European market have grown considerably; Ghana exported 1,071 MT of mangos in 2007, nearly all to the European Union, and the Ghanaian mango industry has identified 6,000 MT as its near-term ex-port target. !is production growth is, as discussed below, in many ways “in the pipeline” because the mango trees to support this increased production already exist and are at the front end of a rising yield curve, supporting credible projections of rising exports.
Ghana’s rice production has not shown significant increases, but unlike commercial banana and mango production, rice production in Ghana has a long history. Like many similarly situated developing countries, Ghana has the theoretic potential for expanded yield and acreage, leading to important increases in production of this key staple food crop.

4
Rice is a di"erent agricultural product from bananas and mangos, and therefore useful in il-lustrating many of the concepts in this study. For example, Ghana is a net rice importer, and therefore expanded rice production does not provide economic benefits arising from export earnings, although there can perhaps be some savings in foreign exchange to the extent (perhaps very limited extent, as discussed below) that increased rice production can substi-tute for imports. Moreover, rice farms typically have less of a distinction between labor and ownership than do mango and banana export enterprises, and thus the distinction between economic benefits from “wages” and “profits” is somewhat blurred. Whereas mangos and ba-nanas have demonstrated their potential for growth by their recent increases in export earn-ings, Ghana’s rice production has been somewhat stagnant, although the potential for growth exists. Finally, as will be discussed in Section VII below, acreage in Ghana is often suitable for competitive, commercial rice production but not for either mango or banana production — an important consideration when comparing economic benefits among the three products.
As a final point, these three products sometimes compete for the same input factors — the most important such factor being land. A quantitative economic benefit analysis for each product is thus important for determining which product can produce the greatest benefit for Ghana from such land.
Evidence-based policy making. !e economic-benefit measurement techniques present-ed in this study are an important part of economic policy-making process. Policymaking that is “evidence-based” can be distinguished from policy decisions based on, for ex-ample, economic theories adopted without benefit of data from the actual circumstances of the sector of the economy at issue. Indeed, reliance on actual data from the field is the core element of the economic-benefit approach used in this paper.
Ghana’s Ministry of Food and Agriculture has adopted the concept of evidence-based policy making. For example, in the discussion of e"ective policy implementation and monitoring, MOFA’s August 2007 Food and Agriculture Sector Development Policy (FASDEP II) calls for a “[c]onsultative evidence-based revision process coherent with na-tional policies” associated with “[i]mproved data collection and analysis” leading to “[b]eneficiary assessment of implementation….”1
Evidence-based policymaking that depends on the type of economic-benefit estimates presented in this study can also help facilitate e"ective implementation of the chosen
1Ghana Ministry of Food and Agriculture, Food and Agriculture Sector Development Policy (FASDEP II), August 2007, Objective 6, page 67.

5
economic policy because the analysis focuses on the benefits specific to the Ghanaian populations and regions subject to the policy. In this case, the analysis largely focuses on the benefits to banana, mango, and rice workers, their families, and the economies in the communities in which they live and work. !is can boost the level of stakeholder acceptance for the ultimate policy arising from the analysis, thus increasing the policy’s prospects for success.2 !e methodology employed in this report made use of this poten-tial strength of evidence-based policymaking by conducting seminars during the research phase wherein Ghanaian experts and stakeholders for these three products were given the opportunity to comment on interim results and provide key data and insights to improve the accuracy of the final results.
Finally, evidence-based economic policymaking using the economic-benefit methodology employed here can also help examine the potential economic benefits from strengthen-ing linkages to other sectors beyond bananas, mangos, and rice. As discussed below, the economic-benefit methodology captures the benefits to, in this case, Ghana’s packaging industry and transportation sector, and thus can be an element in the proper formula-tion of, for example, an agricultural-demand-led industrialization (ADLI) strategy based on linkages between agricultural and non-agricultural sectors.3 !is methodology helps quantify those linkages.
II. De!ning Economic Bene!t
Economic benefit as defined for this paper includes direct and indirect benefits, which are quantifiable, and other economic benefits that are di#cult to quantify but no less real. !is section discusses the nature of these quantifiable benefits, which are estimated for bananas, mangos, and rice in the subsequent sections of this paper.
A. Direct Economic Bene!ts
In simple terms, when a horticulture producer spends $100, the direct benefit to the Ghanaian economy is (a) the amount paid to labor plus (b) the portion of purchased
2For a discussion of this phenomenon, see Catherine Hine, Oxfam, “Evidence-Based Advocacy in Develop-ment Practice Experiences from HelpAge International in Eastern Europe and Central Asia,” February 2008. www.comminit.com/en/node/277865.3See discussion of such ADLI linkages in Food Agriculture Organization, World Agriculture: Towards 2010, Chapter 29, and Vicente Ferrer, World Bank Institute, “Agriculture Led Industrial Development,”(2002), www.worldbank.org/etools/docs/library/88685/Et_1002/ferrer.pdf.

6
goods and services that represents Ghanaian value-added (which excludes any imported goods purchased). !is concept is illustrated in Figure II-1. !e rationale behind this conventional economic approach to quantifying economic benefits is that (a) laborers (broadly defined as including managers) receiving income consider the entirety of the income as an increase in their economic well-being and (b) the value-added portion of purchases represents (ultimately) newly generated wealth by labor and capital (investors). Value not “added” in Ghana, such as imports, benefit economic actors other than those in Ghana (mostly foreign workers and foreign investors).
Such direct economic benefits are therefore estimated by examining the cost structure of the sector in question. In horticulture the needed production-cost structures are reported in crop budgets, which typically provide the amount of input (e.g., kilograms of seeds per hectare, or person-days per hectare) and the unit cost of that input (e.g., 2 cedis per kilogram of seed, or 2 cedis per person-day). Costs related to activities away from the farm, particularly transport, also need to be included and are often found separately from crop budgets.
Value-added from input goods and services. Determining the portion of goods and services (as opposed to labor) that is value-added within Ghana is the trickiest part of the calculation of direct benefit. For example, fruit-packing material (boxes) manufactured in Ghana may contain a large portion of Ghanaian value-added, yet if the paper fiber is imported then the value of the paper fiber is not included in the direct benefit to the Ghanaian economy from the expenditures by the horticulture sector in question. Con-
Goods and Services
Total direct bene!ts from sector’s expenditures on:
Ghana Value Added
Labor$30
40 Imported
30
$70
Figure 1I-1. Direct Bene!ts: Schematic Example
Product Producer
Direct bene!ts from sectoral expenditures can be divided into payments for labor (top path) and purchases of goods and services inputs (bottom path).
Although the entire labor payment bene!ts Ghana, only that portion of the goods and services inputs that are value-added in Ghana are counted as bene!tting the Ghanaian economy. These bene!ts are shown here by check-marks.
Labor 30
Goods and services 40
Combined 70
Direct Beneftis

7
versely, the farm gate cost of what appears to be a wholly imported product — such as an agrichemical made in Europe — might contain a significant portion of Ghanaian value-added related to the marketing, packaging, and transport activities that occur within Ghana (from port to farm) and are included in this farm gate cost.
B. Indirect Economic Bene!ts
Indirect economic benefits are those benefits that arise from expenditures by the laborers and suppliers who are the beneficiaries of the direct benefits, as described in the previ-ous section. Schematically, these indirect benefits are shown in Figure II-2. As with the expenditures that give rise to direct benefits, the expenditures that give rise to indirect benefits must also be made within the Ghanaian economy (rather than for imports), and include only Ghana’s value-added portion of those expenditures.
For example, when a horticulture-farm worker who is the direct beneficiary of horti-culture-sector expenditures uses his or her income to purchase additional food from
Goods and Services
Goods and Services
Labor, Goods and Services
Labor
$70
+
30
40
Figure 1I-2. Direct and Indirect Bene!ts: Schematic Example
Product Producer
Indirect bene!ts arise from the subsequent purchases by the sector’s laborers (top path) and suppliers of goods and services (bottom path).
In both cases, it is only the portion that is value-added in Ghana that is counted as bene!tting the Ghanaian economy.
Note that labor typically buys goods and services (food, clothing, personal services), whereas suppliers (bottom path) purchase labor (their own employees) as well as further inputs of goods and services.
Direct Beneftis Indirect Beneftis
Turnover
Ghana Value Added
Ghana Value Added
Ghana Value Added
Imported
Imported
Imported
30
3
10
$30
40
27
30
Total direct bene!ts from sector’s expenditures on:Labor 30
Goods and services 40
Combined 70
Direct and Indirect 70
27
30
57
127

8
local farmers, this local farmer’s income4 constitutes an indirect benefit to the Ghanaian economy. !is benefit is indicated by the top pathway in Figure II-2. What makes this benefit “indirect” is that the expenditure was not made by the horticulture sector per se, but by a worker who received the funds from the horticulture sector. !is subsequent expenditure by the horticulture worker is called a “turnover” of the money involved in these transactions.
Similarly, another channel of indirect benefit stems from expenditures by the horticulture sector’s domestic suppliers of goods and services on these suppliers’ workers and upstream suppliers, as shown by bottom path in Figure II-2. For example, if the horticulture sector spends $7,000 on a pesticide application by an agrochemical-service provider, $3,000 of that amount might be accounted for by the cost of imported chemicals,5 which are not part of Ghana’s value-added economy, with the remaining $4,000 arising from the internal transportation of the chemicals, repackaging, sales, and the physical application itself — thus $4,000 in Ghanaian value-added.
Figure II-3 illustrates the concept of indirect benefits from subsequent, recurring turnovers initially sparked by the horticulture-sector’s expenditures. Just as Figure II-2, above, iden-tified the first level of indirect benefits to the economy from purchases made by horticul-ture workers and suppliers, Figure II-3 shows how this same money continues to circulate in the economy through second-level expenditures by the first-level workers and compa-nies. As always, only the portion the expenditures associated with Ghana’s value-added can be counted as benefits at that same level,6 and all expenditures on labor are counted as Ghana’s value-added, and thus benefits to the Ghanaian economy.
As is clear from Figure II-3, the economic benefits from the initial, direct horticulture-sector expenditures tend to multiply into indirect benefits as subsequent turnovers are generated. !is is known as the multiplier e!ect. In the example in Figure II-3, in which only two turnovers are considered, the multiplier is 1.71 because (as is shown in the lower right corner) the horticulture-sector’s initial $100 expenditure generated $171 in direct and indirect benefits after two subsequent turnovers.
4Typically, local food crops are almost entirely Ghanaian value-added. To the extent the local farmer uses imported inputs such as agrochemicals, the value of these inputs must be subtracted from calculation of indirect bene!ts. See Technical Note A.5These numbers are illustrative and depend on the cost structure and import-dependence of the service provider.6See Technical Note B.

9
!is concept is so important to understanding the total economic benefit that arises from initial expenditures by any sector that it is worthwhile to consider another arithmetic example of how subsequent turnovers generate additional indirect benefits, depending on the share the each expenditure that is associated with value-added in Ghana.
Figure II-4 assumes that $100 is spent and is entirely a direct benefit. Half of this $100 (including, for example, people who sell food to horticulture workers) is assumed to have been Ghanaian value-added. !us, at this first level of turnover there is another $50 of
Goods and Services
Labor, Goods and Services
Labor, Goods and ServicesLabor
$70
+ +
=
30
40
Figure 1I-3. Direct Bene!ts: Schematic Example with Two Turnovers
Product Producer
Direct Beneftis Indirect Beneftis
Turnover Turnover 2 *
Ghana Value Added
Ghana Value Added
Ghana Value Added
Imported
Imported
Imported
30
3
10
$30
40
27
30
Labor, Goods and Services
Labor, Goods and Services
27
30
*Continued
Ghana Value Added
Ghana Value Added ...
...
Imported
Imported
3
10
24
20
Total direct bene!ts from sector’s expenditures on:Labor 30
Goods and services 40
Combined 70
Direct and Indirect 70
27
30
57
127
24
20
44
$171
Figure 1I-4. Indirect Bene!ts: Another Look at the Arithmetic
Turnover
1 2 3 4 5Share of Ghana value-added (for example) 50% 50% 50% 50% 50%
Bene!t from turnover 50.000 25.000 12.500 6.250 3.125
Cumulative indirect bene!t 75.000 87.500 93.750 96.875

10
indirect benefits. !e same logic applies to the next turnover, when this $50 is spent on another productive activity (labor, goods, and/or services) that is also 50 percent Ghana-ian value-added, thus generating another $25 (50 percent of $50) in indirect benefits, resulting in $75 of total cumulative indirect benefits after two turnovers. As can be seen on Figure II-4, after five turnovers, more than $96 in indirect benefits are generated — nearly a doubling of total benefits from the sector’s initial expenditures.
!is arithmetic shows that the ultimate magnitude of the multiplier e!ect of indirect benefits depends on (a) the number of turnovers and (b) the average share of Ghana’s value-added at each turnover. !e more turnovers that occur in one year and the greater the share of expenditures accounted for Ghana’s value-added production, the higher the multiplier. Figure II-5 shows this relationship: the x-axis at bottom gives various levels of average Ghanaian value-added for turnover transactions, with the height of the lines showing the resulting magnitude of the total multiplier e"ect under two scenarios: after five turnovers (lower line) and after an infinity of turnovers (upper line).
For example, if there is zero Ghanaian value-added in subsequent purchases (say, if the first round of money spent on inputs is entirely on the purchase of an import) then indirect benefits do not exist, so the multiplier equals 1.0 (in other words, direct ben-efits multiplied by 1.0 equals total benefits — the same number — implying no indirect benefits). If the average Ghanaian value-added share is 70 percent, then after five turn-overs the multiplier is about 2.8, and after an infinity of turnovers the multiplier would approach (but never reach) 3.4. To reiterate, this would mean total (direct plus indirect) economic benefits would be 2.8 (or eventually 3.4 times) the level of direct economic benefits generated by the sector.
!is graphic provides an important insight to estimating the indirect economic benefits from an expanded horticulture sector in Ghana. Note that regardless of the number of turnovers considered, the probable range of multipliers is in the 1.5 to 3.0 range for average value-added shares in the most likely 30-percent to 70-percent span. It is unlikely in any open economy that is integrated with a larger surrounding economy to have value-added rates much in excess of 70 percent (because of the presence of im-ports), and it is di#cult to sustain a viable economy by producing less than 30 percent of value-added of a broad range of expenditures. For a reality check, it is useful to note that the value of Ghana’s imports are approximately half the level of Ghana’s gross do-mestic product (GDP), implying a domestic value-added share of about two-thirds of total domestic purchases (GDP divided by GDP plus imports), suggesting that Ghana’s economic multiplier as a whole lies within the probable range shown in Figure II-5.

11
(Specific estimates for the banana, mango, and rice sectors are addressed in the next sections).
Separate average economic-benefit multipliers were derived for labor expenditures and for other inputs of goods and services. !ese variables were derived from discussions with ex-ecutives of Ghana’s horticulture producers in 2007 and early 2008, and further reviewed during roundtable discussions with knowledgeable o#cials and researchers in January 2007 and April 2008 in Accra.7 !e discussions focused on the nature of expenditures in rural areas, and the conclusions were supported by literature on Ghana’s rural economy, some of which is noted below.
Based on this process, it is estimated that the average share of domestic value-added aris-ing from direct labor expenditures was (a conservative) 50 percent. !is means that no more than 50 percent of labor’s subsequent expenditures were on Ghanaian value-added goods, services, or labor.8 !ose familiar with local economies of Ghana’s agricultural regions believe that this is a low-end estimate given the few opportunities for import
Mul
tipl
ier
Domestic-Expenditure Share
Figure 1I-5. Indirect Bene!ts: Probable Range of Economic Multiplier
5.0
0% 10% 20%
Probable Range
In!nite Turnovers
FiveTurnovers
30% 40% 50% 60% 70% 80% 90% 100%
4.0
3.0
2.0
1.0
4.5
3.5
2.5
1.5
0.5
0
7See Technical Note B.8See Technical Note D.

12
purchases and the high degree of self-su#ciency in local foodstu"s. !us the implied eco-nomic multiplier after five turnovers is 1.97, meaning that indirect benefits would nearly double the direct benefits.
!e share expenditures by other agricultural-input providers (goods and services such as packaging and agrochemical providers) of Ghanaian value-added products and labor is less than that for farm workers, with 30 percent considered to be a reasonable conserva-tive average, resulting in a 1.43 average economic multiplier.9 Given the pattern of ex-penditures by the agricultural sector, the weighted average of these two multipliers equals 1.8, which is on the conservative end of the probable 1.5 to 3.0 multiplier discussed in the previous section.
Such an economic benefit multiplier can be considered to be conservative when compared to independent research on the economic benefits of Kenya’s horticulture-export sector:
Although less visible, it is likely that the indirect bene!ts associated with hor-ticultural exports [from Kenya] are greater than the direct bene!ts. First, the multiplier effect of injecting US$46 million annually into the rural sector gener-ates bene!ts for other households and sectors that produce goods purchased by export producers.10
!is conclusion implies an economic benefit multiplier in excess of 2.0 for the Kenyan horticulture-export sector. As another point of reference, the U.S. Department of Agri-culture’s Economic Research Service’s economic-benefit calculator, when provided with economic variables that attempt to mimic Ghana’s fact pattern in a U.S. economic con-text, gives a multiplier of 2.3.
C. The Common Yardstick for Product Comparisons: Per-Acre Analysis
When making comparisons of the economic benefit arising from di"erent sectors — here, bananas, mangos, and rice — it is useful to use a common “yardstick” for com-parison among the products. In particular, simply comparing “total industry benefit” is misleading because the industries are likely to di"er in current size as well as potential size over time, and have di"ering policy requirements for growth. Typically, the most
9See Technical Note E.10Nicholas Minot and Margaret Ngigi, “Are Horticultural Exports a Replicable Success Story? Evidence from Kenya and Cote d’Ivoire,” (December 2003) p. 39.

13
useful yardstick to use for comparing the economic benefits of di"erent industries is the scarce resource that is common to the industries yet can be a!ected by policy. All resources are scarce in the economic sense, but the scarce resource that is important here would be the one that is crucial for production and the acquisition of which is hindered by more than what may be considered the usual workings of the marketplace (i.e., not just expensive).
In the case of Ghanaian agricultural policy, the scarce resource that meets this definition is land.11 On its face, Ghana seems to have an enormous amount of land. Yet of Ghana’s 23 million hectares, less than 11 million hectares are arable and less than 40,000 hect-ares are irrigated, according to the Food and Agriculture Organization. !is is not just an issue of market-based scarcity: at its base, the challenge for optimal use of Ghana’s land arises from the country’s unclear and often unenforceable property rights over any given potential agricultural tract. Although a full treatment of the land issue is beyond the scope of this paper, the existence of the problem is clear and helps define the best yardstick for comparing economic benefits across agricultural products. !e di#culty of acquiring land in Ghana for agricultural purposes was widely cited by interviewees, is ac-knowledged in government documents,12 and is cited in literature by foreign investment advisors13 and academic researchers.14
!e question, therefore, is for a given acre of land that is available for cultivation for all three crops, which crop produces the highest economic benefit for Ghana?
D. Other Considerations in Assessing Bene!ts
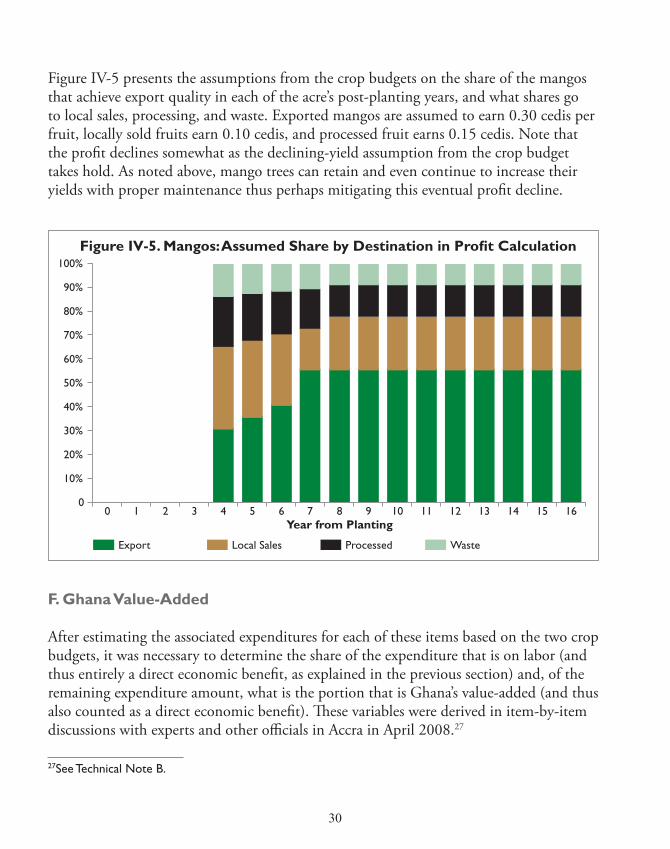
!e economic benefit numbers generated by the analysis discussed in the previous sec-tion must be assessed in light of several other considerations regarding the products in question, namely: the competitiveness of the industry; the timing of economic benefits subsequent to the establishment of the crop; the suitable acreage that can be planted with the crop; the yield that can be achieved for the crop (acreage times yield resulting in
11In a country where land was abundant and people were limited, the appropriate yardstick for analysis might be economic-bene!ts generated per person to assess the best application of people’s labor across various industries. 12Ministry of Food and Agriculture, “Food and Agriculture Sector Development Policy (FASDEP)” September 2002, p. 14. MOFA identi!es what it calls the “absence of a land use policy” (p.14) for agriculture and a “dif!culty in acquiring agricultural land” (p. 13). 13Global Advice (a investment consultancy based in Denmark), “Ghana Country Pro!le 2005.”14Dirk Willem te Velde, Overseas Development Institute, “Foreign Direct Investment for Development: Policy Challenges for Sub-Saharan African Countries” (2001), p.11.
14
total output volume); the price of the crop (which can change over time and a"ect total economic benefits); and the share of the crop’s cost structure that is attributable to Gha-naian value-added (the higher the share, the greater the economic benefit).
Competitiveness. An industry can generate economic benefits only if it remains com-mercially competitive over the long run. For example, industry A might have higher per-acre expenditures on domestic labor and materials than industry B, but if the revenue in industry A is less than these total costs over the long run (implying losses rather than profits), the industry will eventually fail. Nor can a government provide subsidies to help industry A overcome this problem, since the amount of the subsidy must be subtracted from the industry’s benefit calculation because the subsidies must be financed through taxing other sectors (reducing their economic benefit). !erefore: long-term profitability of an industry is a necessary condition for positive economic benefits, regardless of the arithmetic described above.
Timing. Once new investment in the expansion of an industry has been made, the flow of benefits from that industry is not necessarily the same from year to year. Industries that require larger up-front investments generate a initial “bump” in economic benefits, which then settle-down to a more continuous annual flow associated with the harvest and sale of the crop. By contrast, an industry like mangos requires less of a relative up-front investment (generating less in purchases from the Ghanaian economy), and provide little economic benefit until around the fourth year of production when yields begin to reach their mature levels. Rice tends to produce a more even stream of annual benefits from the start, as will be detailed below. Moreover, over time there can be improvements in cultivated acreage, yields, price, and the portion that is Ghana’s value-added. !us, when comparing economic benefits among various industries it is important to specify the timeframe under consideration, and to look forward.
Volume Potential. !e magnitude of economic benefit is tied to the level of the indus-try’s production. In the case of agricultural goods, production is, in turn, tied to the number of acres under cultivation and the average yield of those acres.
!us, total product acreage is a key variable in the total (as opposed to per-acre) econom-ic benefit that an industry can generate. !e economic benefit of a product for which the number of cultivated acres is changeable should be therefore analyzed over a range of potential acreage levels, particularly if government policy a"ects the growth of acreage available to the product in question. As discussed below, the range of potential acreage levels is very di"erent among the three products examined here.
15
Changes in the yield per acre (metric tons per acre) also a"ect the magnitude of econom-ic benefit in two ways. First, higher yields can mean greater profit per acre by increasing output per unit of land-area input. Second, achieving higher yields often requires changes in the combination of production inputs such as labor, machinery, irrigation, fertilizer — collectively known as the technology of the production. Such di"erent patterns of expen-ditures on labor and Ghanaian value-added input goods mean di"erent levels of eco-nomic benefit for the surrounding Ghanaian economy, as discussed above. It is important to note that these two factors — profits from greater yields and the technology fostering these greater yields — might work in opposite directions.
For example, a farmer might divert his expenditures from three local Ghanaian labor-ers to a single imported piece of capital equipment that performs the same task slightly better, thus reducing the economic benefit for Ghanaian labor yet, through higher profits from the more e#cient application of equipment, greater economic benefits for the farmer. Whether one factor is higher or lower than the other factor depends on the cir-cumstances. Finally, yield can di"er greatly depending on the location of the crop within Ghana (for these three products, this is most true for rice).
Price. An economic-benefit analysis undertaken for the purpose of supporting evidence-based policymaking should take into account possible changes in the output price of the industry’s product over the longer term. As discussed above, economic-benefit analyses of agricultural products begin with a crop budget. !e economic benefit that arises from the “profit” accruing to Ghanaians is proportionate to the price the crop enjoys. It is pru-dent to consider likely swings in the product price of the good in question in the coming years. Failure to consider this point has, on occasion, led to policy support for products whose markets have become saturated, while policy support has been withheld from product areas with more favourable price outlooks.
Ghana Value-added. As discussed above, a key variable in determining total economic benefit from a given industry is the share of the industry’s cost structure that goes for expenditures on the Ghanaian value-added portion of input products. !is is a variable that is changeable over time, and a variable that government policy can a"ect, for better or worse. In the case of bananas, mangos, and rice, perhaps the foremost input for which the Ghanaian value-added portion can grow over time is packaging, as discussed below.
Ghanaians Benefited. Economic benefit also can be measured in terms of the number people benefited, rather than in terms of money. Ghanaians directly employed by the sector are of course beneficiaries and the number of these individuals is somewhat easy

16
to estimate from any crop budget that contains labor information, such as person-days per input activity (e.g., “seeding — 5 person-days”). !e economic dependents of these laborers — spouses, children, parents — also benefit from the laborers’ employment and can be estimated from typical worker-dependent ratios in the region at issue. !e indirect benefits discussed above in Section II-B (benefits from industry purchases of upstream goods and services) also benefit people, although estimates of these numbers become increasingly tenuous as the further upstream (the more “turnovers”) one examines. Nonetheless, these upstream workers and their dependents benefit from the increased economic activity.
It is important to note that the number of people benefiting is not the same thing as counting the number of jobs generated by the sector. For the direct beneficiaries (here: banana, mango, and rice workers), it is quite likely in an economy with significant rural unemployment that these workers who benefit represent workers with “new jobs.” Yet true, complete “unemployment” is rare in Ghana’s rural areas because nearly all adults must undertake some form of economic activity to survive and contribute to the family. !us, the “new job” that expanded banana, mango, or rice production generates is, for many individuals, an economic activity in addition to other, less-formal economic work that may or may not be replaced by the new employment. Nonetheless, these Ghana-ians are certainly beneficiaries of the new employment opportunities. In addition, many if not most, of the Ghanaians who are counted as benefiting indirectly (from the sec-tor’s upstream expenditures on inputs) may simply earn more income rather than have a new job, although many new jobs may be generated. Finally, the number of dependents counted in this estimate does not represent “new jobs.”
Each of these economic benefit considerations is related to the others. In simple terms, these interrelationships can be summarized as follows. Competitiveness means that rev-enues must exceed total costs over the long run. Revenues equal total volume times price, and volume equals acreage times yield per acre. And direct economic benefits accrue from the portion of revenue that is attributable to Ghana’s value-added portion of the product’s cost structure. Finally, all of these variables can evolve over time.
III. Bananas
Although Ghana has long produced bananas for domestic and regional consumption, the bananas discussed here are international-grade bananas produced on a large scale for export, almost entirely to the European Market. For commercial success, such production requires large, contiguous tracts of plantation land, an organized, dedicated workforce,

17
and a formal relationship with a multinational fruit company that can provide technical and marketing support, as well as perhaps capital.
Two banana companies provided confidential cost information as a basis for this analy-sis. One of the companies currently operates in Ghana, and the other is one of the four major banana multinationals. Because the two companies maintain their cost informa-tion in di"erent formats using di"erent cost categories, it was necessary to synthesize the information into a uniform set of cost categories, and then assign average costs to these synthesized categories based on the two companies’ cost data.
A. Bene!t Estimate
Each acre of Ghanaian banana production is estimated to generate 3,240 cedis of annual direct economic benefit after the initial start-up investment is completed, with indirect benefits adding another 2,590 cedis per acre.15 Given an average yield of approximately 16 metric tons per acre, the total economic benefit potential for a range of potential output levels by the Ghanaian banana sector is shown in Figure III-1. !e likelihood of reaching these volume levels is discussed in the next section on Ghana’s banana competi-tiveness and in section III-D on potential volume levels. Figure III-2 shows the major
Mill
ions
of C
edis
per
Yea
r
Annual Harvest for Export (Thousands of MTs)
Figure III-1. Bananas: Potential Economic Bene!t
10 50 100 150 200 250 300
Indirect Bene!tsFirst year from investment
Indirect Bene!tsEach year from production
Direct Bene!tsFirst year from investment
Direct Bene!tsEach year from production
350
250
150
300
200
100
50
0
15Reported in crop budgets as metric tons per hectare, the standard area unit in the banana industry. Acre is used in this report for consistency between all crops.

18
cost categories from a banana crop budget that gives rise to these benefit estimates.
B. Competitiveness
!e European Union (EU) is a potentially large market for bananas grown in Ghana. Prior to 2006, such exports were restricted by the EU Banana Re-gime, which placed restrictive quotas on the volume of bananas that could be imported from African-Caribbean-Pacific (ACP) countries without being subject to a prohibitive tari", while exports from non-ACP Latin American countries enjoyed a much larger quota and constituted more than 80 percent of EU imports. !us, the major multinational banana companies selling into the EU — Chiquita, Dole, Del Monte, and Fy"es — did not develop Africa as a major source for their banana supplies.
Ghana has demonstrated its ability to compete in the European banana market through exports from the country’s two existing banana-export compa-nies, Volta River Estates Ltd and Golden Exotics. Figure III-3 shows that Ghana remains a small player in the EU market, but that its position vis-à-vis comparable suppliers suggests a significant margin for competitive growth. Ghana exported more than 34 thousand metric tons of bananas to the European Union in 2007, with export volumes continuing to rise.
Aside from this demonstrated export capability, a detailed assessment of Ghana’s ba-nana-export potential concluded that Ghana meets all of the requirements necessary to produce an international-grade banana. Such a competitive ability is a prerequisite to generating sustained economic benefits, as explained above. Importantly, this assessment provided important information regarding which acres are particularly suitable for banana production. As a threshold matter, bananas for export must be grown within 150 kilome-ters of a port to achieve cost-competitiveness for transport. !e study then considered a variety of other factors to help identify those acres in Ghana suitable for production, as shown in Figure III-4 banana suitability factors by region.
Figure III-2. Bananas: Elements of a Crop Budget
Phase Input
Init
ial I
nves
tmen
t
Hec
tare
Var
iabl
e
abcdefgh
Soil prepPlantingIrrigationInfrastructureEquipmentBring to bearingProject supervisionMisc.
Pro
duct
ion
ijklm
Farm maintainanceWater managementDisease controlFarm administrationReinvestment
MT
Var
iabl
e
nopqrstu
HarvestingPacking laborKD boxPalletizationPacking - otherTransport to wharfWharf loadPort cold storage
v Fixed costs

19
For purposes of this report, this table is given only as an example of factors that consti-tute a complete competitiveness analysis. Moreover, the suitability of a particular site requires site-specific analysis by investors. Such site-specific analysis should account for all
Mill
ions
per
Yea
rFigure III-3. Bananas
Exports to the European Market: Ghana’s Potential
Thousands of Metric TonsSource: Eurosat 2007
10 50 100 150 200 250 300
Ghana’s potential foreign exchange earnings
Ivory Coast Banana
Exports to EU
1/10th of “Big Three” Latin
American exporters’
shipments to EU
$350
$250
$150
$300
$200
$100
$50
$0
Figure III-4. Bananas: Suitability Factors by Region
Criterion Unit SustainabilityGreater Accra Region
Southern Volta
Region
Eastern Region
Central Region
Afram Plains
District
Elevation Meters 20 to 75
Rainfall Millimeters per month 150 to 180
Temperature Degrees centigrade 25 to 30
Wind velocity
Maximum kilometers per hour 10
Sunshine Minimum hours per day 4
Slope Percentage rise 0 to 1
Relief Flat
Distance to closest port
Maximum kilometers to port 150
Suitable Suitable in some locations Seasonally unsuitable (monthly rainfall can fall below monthly minimum)

20
factors and be undertaken with local input and cooperation. In addition, analyses should recognize trade-o"s among factors for optimal banana production.
Ghana enjoys several key attributes that point towards a large potential for a Ghanaian banana sector. !is potential is likely to be realized in a certain form of industry structure in which there is a division of responsibility (and rewards) between multinational banana companies and domestic Ghanaian interests.
Changes in the EU Banana Regime, which currently places a $176 tari" per metric ton on most bananas from Latin America and removes previous limits on imports from Africa, is the major force behind Ghana’s potential as a major banana exporter. Moreover, there could be some shipping-cost advantages vis-à-vis shipments from Latin America to the EU (although this may depend on improvements in Ghana’s own port costs) and, in some cases, a more stable and responsible political and social environment in Ghana than in the traditional banana-exporting countries.
Although the Ghana’s potential for growing bananas for large-scale export is beyond the scope of this report, it should be noted that Ghana has two key physical features that, from the perspective of a multinational banana company, are attractive relative to the traditional banana-export countries of Latin America. First, banana production in Latin America is plagued with black sigatoka disease, which is far less prevalent in Ghana. !is means a significant cost savings for the producer.
Second, Ghana does not su"er from the devastating hurricanes as do the eastern regions of Latin American production. Unusually bad weather over the past decade in those regions is not believed to be a temporary phenomenon, and the multinational banana companies have curtailed production in many areas there as a result. Although the Octo-ber 2002 wind storm that devastated VREL’s crop looms large in the experience of Gha-na’s small banana industry, the episode was in fact (typical of Ghana’s wind storms) highly localized and did not even reach all of VREL’s five plantations, which are located in close proximity. !is stands is sharp contrast to the vast areas vulnerable to a single hurricane in Latin America. Moreover, the 2002 storm experience resulted in the development of sev-eral countermeasures now being deployed by Ghana’s industry, and scientists interviewed at the University of Ghana said more could be done in this regard as research continues.
In contrast to the two companies currently producing bananas in Ghana, significant expansionary investment and/or sales arrangements could originate from one of the four major multinational banana companies. For Ghana, the key missing factor is expertise,

21
but Ghana is strengthening its banana knowledge base each year with its existing produc-tion and could leverage future activities in Ghana by major banana multinationals to improve its indigenous knowledge further.
!e benefits of a multinational’s presence in the Ghanaian banana sector cannot be over-stated: these companies can bring changes in technology, can improve Ghana’s human capital through employment and training, and can provide a ready market in developed-countries for Ghana’s production.
C. Timing of Bene!ts
Economic benefits arise over time from the annual expenditures that the banana sector is making as well as the flow of profits arising from the sale of the resulting bananas. For bananas in particular, there are more significant upfront investment costs, followed by a flow of smaller production costs.
Investment costs. Key investment items are irrigation, pack houses, and cabling (the lat-ter two being infrastructure and equipment).
Irrigation. As discussed in detail in the research paper on the suitable areas of Ghana for commercial horticulture production,16 Ghana possesses all of the natural physical characteristics for commercial horticulture production with the exception of adequate, consistent rainfall. !us, irrigation is an important investment component, perhaps constituting a quarter of non-land investment. Much of the physical irrigation equip-ment may be imported, whereas the construction of the system is high in domestic value-added.
Pack houses. Bananas are separated from bunches, washed, checked for quality, and packed in boxes in pack houses located on the horticulture farm. Much of the physical construction of pack houses is based on domestic building materials and thus consti-tutes largely Ghanaian value-added.
Cabling. Bananas are brought to the pack houses on cabling systems that extend throughout the horticulture farm. Much of the physical inputs to this system are im-ported, whereas the installation is domestic-value-added.
16Steve Duadze, “The National Banana Plan: Report on the Mapping of Agro-Ecological Variables in Part of Southern Ghana,” 2007. See also Figure III-4.

22
Each of the investment-cost variables is on a per-hectare basis, meaning that the costs vary in relation to the physical area of the farm, rather than the volume of bananas grown or harvested. !us, the investment costs depend little on productivity of hectares (al-though productivity obviously depends on adequate investment per hectare).
Production Costs. Cost items i though v shown in Figure III-2, above, are for the produc-tion phase after the investment has been made. Note that cost items i though m vary by area and not by the volume of bananas grown or harvested, whereas cost items n though u vary by harvest volume. Item v is a single fixed-cost amount that is necessary to operate a horti-culture production company in Ghana and contains all of the volume-independent over-head costs. Together, these include all the costs necessary to deliver the banana to shipside.17
D. Volume Potential
!e actual economic benefits will depend heavily on the scale of the banana-export sector created. As a starting point, Figure III-3, above, shows the amount of foreign exchange that would be earned by the Ghanaian economy at various levels of exports, assuming an average unit value of banana exports at $300 per metric ton (MT). !e two volume levels in Figure III-3 provide some context for Ghana’s longer-run potential to supply the European market. First, the Cote d’Ivoire ships more than 200,000 MTs of bananas to the European Union each year. !us, if Ghana simply matches its neighbor’s export levels, Ghana will be only two-thirds the way along the range of hypothetical exports on this chart, and this range is used throughout this report.
!e second indictor on this chart is the amount Ghana could export — more than 260,000 MTs — if only 1/10th of Latin American banana exports to the European Union were supplied by Ghana instead. !is is not implausible: Chiquita has stated that it intends to shift about 20 percent of the company’s sourcing from Latin America to Africa over the next five years.
Such volumes are the result of the acreage bananas cover multiplied by the average yield from these acres, as discussed in the next two sections. !en the percentage of this total
17It is possible that Ghana’s banana sector could undertake its own investments (and thus expenditures) for the transport of bananas to the European market after the fruits reach shipside. This is unlikely in the near future for Ghana because of the scale and diversity of export necessary to be competitive in these commercial functions. See the research report, Brent Bartlett, “Policies Affecting the Development of Ghana’s Banana-Export Sector,” December 2006, section III.F regarding the “division of responsibility” strategy being pursued by the banana multinationals.

23
production that is suitable for export is considered. With these hypothetical export sce-narios in mind, this report estimates the direct and indirect economic benefits that would arise from this range of possible Ghanaian exports.
Acreage. !ere is another issue related to land that must be taken into account: com-mercially viable banana production for the international market requires large contigu-ous tracts of land and, of course, that land must be suitable for banana production. !e land-acquisition strategies of the two existing Ghanaian banana companies are not easily reproducible on an unlimited scale for additional banana-production. VERL obtained five geographically separate parcels through negotiations with a chief whom the company believes is particularly responsible and authoritative. Golden Exotics signed a lease agree-ment with the Irrigation Development Authority — thereby minimizing the need for agreements with local authorities — for 1,760 hectares in the Kong Irrigation Project in February 2005. !e experience in the pineapple sector suggests that land acquisition for production is di#cult, time-consuming, but nonetheless do-able: new parcels are con-stantly acquired, albeit in a patchwork fashion. (!e apparent reluctance of the multina-tional banana companies to replicate immediately their Latin American plantations on a vast scale in Ghana may be a favorable factor in this regard.)
Yield. Once the acreage is known, total volume defined by yield was set at 40 metric tons (MT) per hectare for purposes of this report. Although this level of productivity can be considered somewhat ambitious from the standpoint of production e#ciency — levels often average lower in newer production areas — the arithmetic of estimat-ing economic benefits implies that a higher productivity (MT/hectare) assumption provides a more conservative benefits estimate. !is perhaps counter-intuitive notion arises from the fact that benefits arise from expenditures by the horticulture company on inputs from the local economy: the more expenditures required, the greater the benefit calculation for each unit of volume. !is dynamic should not be misinterpreted as an argument for planned ine#ciency: higher productivity leads to higher volume (more multinational purchases, more investment, and so on), which generates more benefits in total. Lower productivity depresses output volume and therefore reduces total benefits.
E. Price
Bananas have a lower price volatility than most other commodities that enter interna-tional trade. In large part, this is due to the wide variation of geographic supply and their year-round growing pattern. !ere is little if any seasonal variation in banana prices

24
entering the European Union. In recent years, banana import prices to European Union have fluctuated in the range of $500 to $800 per metric ton, with perhaps half of this price representing the export value earned by the supplier country. For purposes of this study, the average unit value (AUV) for Ghana’s exports is assumed to be $300 per metric ton.
A key factor that cannot be assessed in this study is the nature of the contractual arrange-ment between the domestic Ghanaian banana producer/investor and the multinational banana company that is responsible for marketing and distribution. !e pricing element of such contracts can be complex — in part, to ensure that domestic production main-tains a sustainable profit despite international price volatility — and thus the actual price (and thus revenue and profit) received by Ghanaian interests depends on the nature of that contractual relationship.
F. Ghanaian Value-Added
After estimating the associated expenditures for production and investment based on the cost data, it was necessary to determine the share of the expenditure that is on labor (and thus entirely a direct economic benefit, as explained in the previous section) and, of the remaining expenditure amount, what is the portion that is Ghana’s value-added (and thus also counted as a direct economic benefit). !ese variables were derived in item-by-item discussions with executives of horticulture producers in January 2007, and further re-viewed during a roundtable discussion of knowledgeable industry executives, government o#cials, and other researchers on January 25, 2007 in Accra.
G. Ghanaians Bene!ted
It is possible to estimate the employment that would be generated by an expanded ba-nana-export sector. !e implied direct employment in banana production can be calcu-lated for the range of hypothetical banana exports up to 300,000 MT per year, at which point direct employment would reach 12,000 people. Because of the indirect economic benefits, however, another 8,000 jobs (or their full-time equivalent or a higher number of part-time jobs) could be generated, resulting in more than 20,000 total new jobs.18
18Chiquita provided its own estimates of employment effects at the May 22, 2007 Ghana Investors Conference in Accra. Chiquita’s direct employment numbers were slightly lower but the total employment numbers were slightly higher, although direct comparisons are dif!cult because of possible differing assumptions regarding labor productivity rates.

25
Based on interviews with executives of Ghana’s two operating banana producers in Janu-ary 2007 and a follow-up roundtable discussion, it is estimated that each worker employed in the formal sector in the rural banana-producing regions supports six dependents, not including the worker. !is level of dependents may be reached quickly if it includes a spouse, two parents, and three children, before considering any grandparents, additional children, adult siblings and cousins, or other family members or social dependents.
IV. Mangos
Ghana has only recently been encouraging the development of its existing mango trees for the production of export-grade mangos, mostly to the European market. Unlike banana production, mango production can be undertaken on a relatively small scale with fewer workers and less investment. Production is seasonal, with harvests in the spring and fall.
Two mango crop budgets were used as a basis for this analysis. Both crop budgets envi-sion a commercial-scale mango farm operation, one at 40 trees per acre and one at 60 trees per acre.19 Because these two crop budgets di"ered somewhat in their cost and output assumptions, it was necessary to synthesize20 the information into a uniform set of cost items, and then assign costs to these synthesized items based on the two companies’ cost and output data.
A. Bene!t Estimate
Each acre of Ghanaian mango production is estimated to generate around 1,075 cedis of annual direct economic benefit after the initial start-up investment is completed and the trees reach maturity after year four. Indirect benefits add another 793 cedis per acre, for a total of 1,868 cedis.
Given an average yield of 4.0 metric tons per acre, and assuming Ghana had 10,000 of acres under mango cultivation and one-half of those are export-grade (see discussion
19For ease of identi!cation, these two crop budgets are referred to in subsequent footnotes as “Alpha-40” and “Beta-60,” respectively. See Appendix Table A-2 for an example of a mango crop budget.20This synthesis was not always simply an average of the two budgets’ reported values; in some cases greater weight was given to one budget due to the overall context in which the value of the line-item was reported. For example, crop budget Alpha-40 assumed the soil enjoyed no nitrogen de!ciency, and therefore no NPK fertilizer was used in the crop budget. The economic- bene!t calculation throughout this report assumes NPK fertilizer is used uniformly.

26
below), the annual average economic benefit in the dozen years (after planting) from year 5 through year 16 would be 18.68 million cedis. !is is shown for a range of potential output levels by the Ghanaian mango sector in Figure IV-1. !e likelihood of reaching these volume levels is discussed in the next section on Ghana’s mango competitiveness and in section IV-D on potential volume levels.
B. Competitiveness
Ghana has proven itself to be competitive in the international mango market, particularly in the European Union. !e EU mango imports have reached more than 200,000 metric tons annually, after growing at double-digit annual percent rates in recent years. Ghana’s contribution to this total has grown from near zero to more than 1,000 metric tons, with the likelihood of further growth, perhaps to 10,000 MT in the coming years. Like bananas, mango production for export is best placed near the ports in the south. !e Integrated Tamale Fruit Company in Northern Ghana produces export-grade mangos, however, and further development is possible as transportation networks improve.
C. Timing of bene!ts
!e timing of cost outlays and production yield is an important feature for estimating the economic benefit from mango production. !e elements of a mango’s crop budget are
Mill
ions
of C
edis
per
Yea
r
Exports in Metric Tons (One-Half of Production)
Figure IV-1. Mangos: Potential Economic Bene!t
1,000 5,000 10,000 15,000 20,000
Indirect Bene!ts
Direct Bene!ts
18
16
14
12
10
8
6
4
2
0

27
shown in Table A-2 of the Appendix. As shown in Figure IV-2, mangos begin producing fruit four years after tree planting, and then yields rise markedly before peaking. Some well-maintained mango trees can continue to increase their yields without exhibiting the yield decline shown in Figure IV-2, but other trees may succumb to old-age, disease, or accident, thus pulling down the average as time goes on.
!is yield-curve profile is important for the timing of both cost-expenditures and in-come-earnings (the profit portion of economic benefits). As shown in Figure IV-3, in the first few years expenditures are lower because the plant needs to be maintained, but there is no harvesting. Moreover, also seen in Figure IV-3, there is an uneven pattern to expen-ditures on tools and consumables because these have an average useful life of multiple years (depending on the type of product). !is uneven pattern of sectoral expenditures leads to a similarly uneven pattern of economic benefits, as shown in Figure IV-4 with respect to direct benefits.
D. Volume Potential
!e actual economic benefits to Ghana will depend on the scale of the mango-export sector created. For context, Ghana exported 1,071 MT of mangos in 2007, nearly all to the European Union, and the Ghanaian mango industry has identified 6,000 MT as its near-term target for export. !e European Union imported more than 211,000 MT of
Man
gos
per T
ree
Year
Figure IV-2. Mangos: Yield per Tree
0 3 6 9 12 15 18 21 24 27 30
300
250
200
150
100
50
0
Source: See Appendix Table A-2

28
Year from Planting
900
800
700
600
500
400
300
200
100
Maintenance: Materials
Maintenance: Labor
Harvesting: Labor
Tools and consumables
Figure IV-3. Mangos: Cash Outlays per Year
00 62 8 124 10 141 73 9 135 11 15 16
Ced
is p
er A
cre
Ced
is p
er A
cre
Year from Planting*Includes tools and consumables.
Figure IV-4. Mangos: Direct Economic Bene!ts Over Time
0 1 2 3 4 5 6 7 8 9 10 11 12 13 14 15 16
Pro!t
Materials*
Labor
0
1,250
1,000
750
500
250
1,500

29
mangos from all sources in 2007,21 implying a Ghanaian market share of less than 0.5 percent, although because of the seasonality of mango production, Ghana’s e"ective share of the EU market is higher in those months in which Ghana’s mangos are harvested. In 2007, the EU imported 14,706 MT from the Cote d’Ivoire, 4,317 from Mali, and 3,191 from Burkina Faso.22
Other reference points exist for what is possible for Ghana’s mango export levels in the near term. Ongoing crop mapping by USAID’s TIPCEE program estimates that there are more than 10,40023 acres under mango cultivation, much of which has been created in recent years and has yet to reach full yield levels (see discussion of yield timing, below). !e amount of fruit that such acreage would produce depends on the yields that can be obtained, particularly for fruit of export quality. !e FAO puts Ghana’s yield for 2006 at 4.5 MT/acre for all mangos (domestic plus export),24 and the crop budgets used for this report imply yields in the 3.0 to 5.0 MT/acre range.25 !us, a reasonable 4.0 MT/acre yield would imply production of more than 40,000 MT. Much of this would not be export-grade quality, however.
Assuming one-half of this production can reach export quality, however, 20,000 MT could be available for export, which would put Ghana above the Cote d’Ivoire’s 14,700 MT and below Peru’s 36,700 MT for exports to the EU for 2007.26 !is 20,000 MT figure is thus used as the high end on which to base the estimates, as shown above.
E. Price
Another component of direct economic benefit is the residual profit the farm owner earns, assuming such owner is Ghanaian. Unlike the two cost components (labor and materials) of direct benefits, this profit component depends on the price of the mangos sold, which in turn depends on the destination market: exported mangos earn far more then mangos sold domestically, either as fresh fruit or for processing.
21Eurostat Extra-EU27 trade for mangos, mangosteens, and guavas. 22Eurostat Extra-EU27 trade for mangos, mangosteens, and guavas. 23More than 6,400 acres have been mapped af!rmatively as under mango cultivation. Prior to this mapping exercise, FAO listed Ghana in 2006 as having 1,572 acres (reported as 636 hectares) of land under cultivation for mangos, mangosteens, and guavas.24FAO stat for mangos, mangosteens, and guavas.25Average for years 4 through 13, after planting, of the yield cycle.26Eurostat Extra-EU27 trade for mangos, mangosteens, and guavas.
30
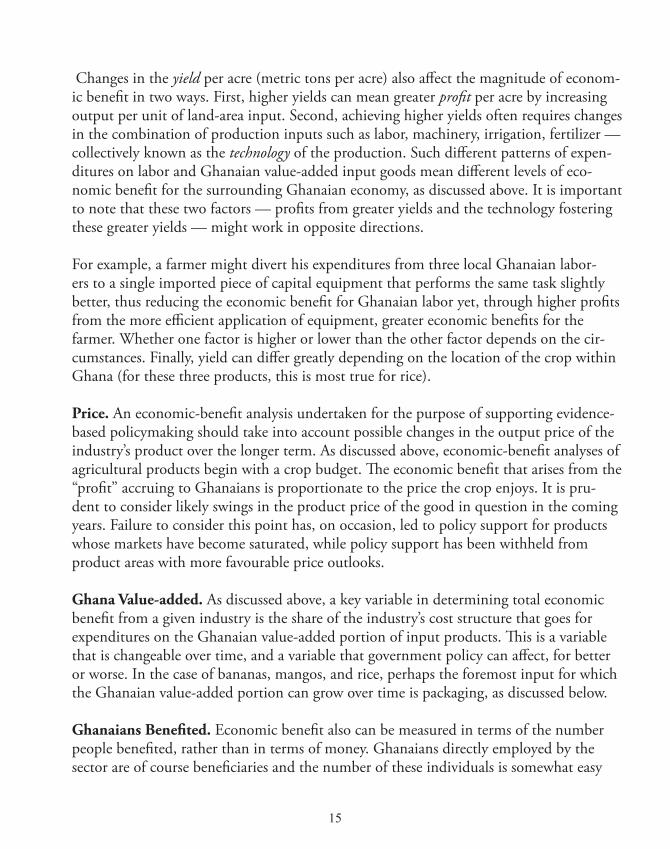
Figure IV-5 presents the assumptions from the crop budgets on the share of the mangos that achieve export quality in each of the acre’s post-planting years, and what shares go to local sales, processing, and waste. Exported mangos are assumed to earn 0.30 cedis per fruit, locally sold fruits earn 0.10 cedis, and processed fruit earns 0.15 cedis. Note that the profit declines somewhat as the declining-yield assumption from the crop budget takes hold. As noted above, mango trees can retain and even continue to increase their yields with proper maintenance thus perhaps mitigating this eventual profit decline.
F. Ghana Value-Added
After estimating the associated expenditures for each of these items based on the two crop budgets, it was necessary to determine the share of the expenditure that is on labor (and thus entirely a direct economic benefit, as explained in the previous section) and, of the remaining expenditure amount, what is the portion that is Ghana’s value-added (and thus also counted as a direct economic benefit). !ese variables were derived in item-by-item discussions with experts and other o#cials in Accra in April 2008.27
27See Technical Note B.
Year from Planting
100%
80%
90%
70%
60%
50%
40%
30%
20%
10%
Export Local Sales Processed Waste
Figure IV-5. Mangos: Assumed Share by Destination in Pro!t Calculation
00 62 8 124 10 141 73 9 135 11 15 16

31
!e bulk of the benefit emerges from expenditures on labor because nearly all of the expenditures for materials (including tools and consumables) are on imported goods, Ghana’s value-added portion of which is the mark-up from the import price. Such a mark-up represents the value-added from internal transportation, marketing, and retail packaging, as well as profit. Moreover, mango production is more labor-intensive than material-intensive, as can be seen in Figure IV-3 above.
G. Ghanaians Bene!ted
Mango production di"ers from banana production in that the employment created is not as structured, and therefore comparing numbers of “jobs” between the two sec-tors would be misleading. Moreover, the level of labor activity di"ers over time as the mango orchard matures, as illustrated in Figure IV-3, above (note in particular the vari-ance over time of the two labor-cost components in the middle of the graph). Taking year four as an example, however, crop budgets suggest that there are 52 person-days of employment per acre. As noted above, TIPCEE estimates that there are more than 10,400 acres under mango cultivation, thus suggesting 540,000 person-days of employ-ment created per year. At a 250-day work year, this would be more than 2,100 direct full-time jobs.
Assuming the number of dependents supported is the same ratio to full-time employ-ment as determined for the banana sector (see discussion in section III-G, above), this would imply nearly 13,000 dependents would benefit and perhaps another 1,400 jobs created indirectly as a result of the direct mango employment.
V. Rice
For Ghana, rice di"ers significantly from bananas and mangos because it is largely a do-mestically consumed crop, and the country’s output has been stable relative to that of the two export fruits. International trade does play a role, however: an expanded rice sector could substitute for rice imports.
For purposes of this study nine rice crop budgets from several areas of Ghana were obtained from the Ministry of Food and Agriculture.28 !e expenditures in money and manpower, and the resulting yield and price di"er significantly by rice-farm location within Ghana, and by type of crop technology used.
28See Appendix Table A-3 for an example of a rice crop budget.

32
A. Bene!t Estimate
Figure V-1 presents the estimated direct and indirect economic benefit from rice pro-duction in these nine regions as a whole, assuming the total area under rice cultivation expands by 2,000 hectares per year, proportional to where it is currently located. Much depends on the location and nature of technology used, as will be discussed below. Per-acre total economic benefits range from under 300 cedis to more than 1,300 cedis across the nine crop budgets. In all cases, the per-acre benefits are significantly lower than those of bananas or mangos.
For a more accurate sense of the potential for expanded economic benefits from rice production, further data need to be developed regarding the availability and suitability of land for rice crops vis-à-vis other crops, taking into account the use of various technolo-gies (e.g., machinery vs. labor-intensive) by location. Until such an accounting is under-taken in Ghana, these results remain suggestive at best.
B. Competitiveness
Ghana’s competitiveness among international suppliers of rice must be viewed from a di"erent perspective from those used to consider Ghana’s competitiveness in bananas or mangos. !ere are several reasons for this.
Mill
ions
of C
edis
per
Yea
r
Figure V-1. Rice: Potential Economic Bene!t(assuming 2,000 hectares added per year)
10 50 100 150 200 250 300
Indirectbene!t
Directbene!t
250
150
300
200
100
50
0

33
First, Ghana is a net rice importer, rather than an exporter as in the case of bananas and mangos. !e point of competition to assess Ghana’s rice-supply competitiveness is there-fore within Ghana where imported rice is sold in competition with domestically pro-duced rice. (By contrast, the point of competition to be assessed for bananas and mangos is the European market.) !e point of competition between foreign and Ghanaian rice is not at Ghana’s border, but in the many local markets where foreign and domestic rice is sold or could be sold in competition. In practice, looking at local-market competitiveness rather than border-competitiveness is important because the further north (away from the port) the rice market is, the more that transportation costs favor domestic rice. Simi-larly, the more quality-conscience urban rice markets are closer to the ports, and therefore domestic rice — which is, on average, of lower quality than imported rice — faces sti"er competition closer to the southern urban centers.
As the Ghana Rice Inter-Professional Body summarized the issue:
The Northern Region possess[es] the greatest potential for the development of the rice farming in Ghana….
Unfortunately, the parboiled rice is not consumed in the big urban centres of the southern part of the country where households feed on imported rice. In the present state of things, any signi!cant increase of the rice production in the North would lead to marketing problems as past experiences [demonstrate].29
Second, Ghana’s rice production comes from a much wider range of production technol-ogies and input costs than does banana or mango production for international markets. Key factors di"erentiating rice-production technologies include the degree irrigation, the application of capital vs. labor, highland vs. lowland locales, and north vs. south. By contrast, banana and mango production for the international market is an increasingly standardized procedure, in large part driven by the fruits’ exposure to the demands and technological opportunities of the international marketplace.
As shown in Figures V-2 through V-5, the expenditures in money and manpower, and the resulting yield and price, di"er significantly by rice-farm location within Ghana, and by type of crop technology used. Figures V-2 and V-3 are based on the nine crop budgets used in this report to estimate economic benefits. As for location, the limited data suggest that rice farms in the north are less productive, but it is not at all clear that this outcome is an unavoidable
29Olivier Maes (Project Coordinator) “Ghana Rice Inter-Professional Body” (October 2005) p. 2.

34
Golinga Dingoni Kpatill Kobina Anokrom
Lineso Afpafu Dekpor WoraworaKikam
2.5
3.0
2.0
1.5
Figure V-3. Rice: Yield per Hectare
1.0
0.5
0
Met
ric
Tons
per
Acr
e
Northern Region Western Region Volta Region
Golinga Dingoni Kpatill Kobina Anokrom
Lineso Afpafu Dekpor WoraworaKikam
1,300
1,100
900
700
Figure V-2. Rice: Reported Cost Elements per Region
500
100
300
-100
Ced
is p
er H
ecta
re
Northern Region Western Region Volta Region
Seed Agrochem Equipment Machinery Labor (reported) Net Income
Off scale

35
result of location. Rather, the widespread lack of irrigation technology in the drier areas reduces both outputs (low yields) and inputs (farmers will rationally refrain from applying labor or material inputs when insu#cient rainfall would make such applications futile. Figure V-4 illuminates the role of technology by comparing productivity under di"erent methods.30
Figure V-5 presents the di"erences in the person-days that are associated with the same hectare of production in the nine locations examined. Such di"erences drive the di"erences in productivity outcomes, yet they also create di"erences in the number of Ghanaians who enjoy economic ben-efits from rice production, as discussed below.
30The three crop budgets obtained for this comparison did not allow for a suf!cient comparison of eco-nomic bene!ts by region, so the nine crop budgets discussed above were used.
Figure V-4. Rice: Yield Differences Among Three Crop
Techniques and Locations
Irrigated Coastal Savanna
Valley Bottom Forest
Upland Northern Savanna
2.5
3.0
2.0
1.5
1.0
0.5
0
Met
ric
Tons
per
Hec
tare
Source: Ministry of Food and Agriculture
Golinga Dingoni Kpatill Kobina Anokrom
Lineso Afpafu Dekpor WoraworaKikam
2.5
3.0
2.0
1.5
Figure V-5. Person-Days by Region
1.0
0.5
0
Pers
on-D
ays
per
Hec
tare
Northern Region Western Region Volta Region

36
!ird, a higher proportion of the costs of Ghanaian rice production is priced in cedis than is the case for bananas and mangos, which have higher costs for imported agrochemicals, packaging, and capital equipment. !us, other things remaining equal, the exchange rate between the cedi and foreign currencies plays a larger role than it does for bananas and mangos. If the cedi weakens against key foreign currencies, those products that depend on imported inputs (here, bananas and mangos) face relatively higher costs. On the other hand, those products that depend more on export markets than domestic sales (here, banana and mangos) or compete with priced imports whose prices are raised by the falling cedi (here, rice, particularly in the south) enjoy higher cedi-denominated revenues. On balance, therefore, mangos and bananas would likely to face relatively higher input costs (relative to the change faced by rice) by a falling cedi, yet all three products would benefit from rising sales prices and competitiveness.
Once these analytical di"erences between rice on the one hand and bananas/mangos on the other are recognized, the question is whether rice is indeed competitive with import-ed rice31 at higher volume levels.
C. Volume Potential
!e rice production has been fairly constant over the past decade, with the acreage under cultivation and the yield varying somewhat from year to year depending upon the weath-er, but neither rising significantly. According to FAO data, Ghana devoted 125,000 of its 11 million arabable hectares to rice in 2006, down from more than 135,000 hectares in 2001, while average yields tend to be in the 2.0 MT per hectare range, depending largely upon annual rainfall, particularly in the north. As shown in Figure V-3, above, yields dif-fer greatly depending upon location.
!e potential for Ghana to significantly increase its rice output depends heavily on two factors. First, substantial yield and cultivation increases depend to a great extent on the level of future policy resources devoted to the Ghana’s rice sector. Perhaps to a lesser ex-tent, significant increases in farm gate prices (discussed below) would likely attract greater e"orts from Ghanaian farmers to boost yields and cultivation. Such farm gate price in-creases could come as a result of rising international prices or improvements in Ghanaian rice’s ability to compete on quality terms with imported rice, as discussed above.
31A more detailed study of rice competitiveness would consider Ghanaian rice’s competitiveness with other foodstuffs, such as wheat grain, as well as with foreign rice.

37
D. Timing of Bene!t
Rice production and harvest has a much “flatter” timing profile than do bananas and mangos. Typically, rice production can begin in the first season and continue at a fairly constant level in subsequent years. !us timing is not a significant issue for rice.
E. Price
!e important point at which to measure the price of rice for purposes of measuring eco-nomic benefit is the farm gate. !ese prices vary widely in Ghana: the crop budgets pro-vided in 2007 indicate 0.24 cedis per kilogram in Golinga in the Northern Region to 0.43 cedis in Afpafu in the Volta Region — a figure more than 80 percent higher in the Volta Region. Two key factors appear to drive this di"erence. First, there is location: rice prices in the north are uniformly lower than those in the south, most likely driven by di"erences in income levels (demand-competitiveness) in the two areas. Second, there is likely to be a sig-nificant quality di"erence among the rice products in the various locations, with northern rice being of lower quality whereas rice in the south is seeking to compete with imports.
Yet another price consideration that might be crucial for estimating the benefits from expanding Ghana’s rice industry is the product’s long-term international product price, which influences the price of Ghana’s domestic rice through competition with imports. Although the international rice prices peaked in May 2008 at multiples of their longer-term historical levels and have declined substantially since that time, they remain well above historical levels (more than 40 percent higher in early 2009 compared to the begin-ning of 2008), and the International Rice Research Institute projects that price volatility will continue for the years to come.32
F. Ghana Value-Added
After estimating the associated expenditures for each of rice’s inputs based on the nine regional crop budgets, it was necessary to determine the share of the expenditure that is on labor (and thus entirely a direct economic benefit) and, of the remaining expenditure amount, what is the portion that is Ghana’s value-added (and thus also counted as a direct economic benefit). !ese variables were derived in item-by-item discussions with experts and other o#cials in Accra in April 2008 as well as from averages derived from the nine crop budgets themselves.
32International Rice Research Institute, Rice Today, January-March 2009, pp 11-12.

38
It is important to recognize that rice can be grown under a much wider variety of crop techniques than can bananas or mangos and therefore the capital-labor mix for any given level of output also may vary considerably depending on the crop technique, which in turn is often dependent on location and environmental factors such as rainfall.
Note, too, that the crop technique appears to be the most mechanized in the Dekpor area, resulting in the highest revenue per acre (the total height of the bar, which equals yield times price). !is translates into the highest economic benefit among the nine crop budgets because of the high yields achieved. Such mechanization in Dekpor results in low labor uti-lization per hectare. Although this implies a higher level of economic e#ciency (in theory, allowing the unused labor to be applied to other, higher-valued uses), it also means that the direct economic benefit as measured by employment is low relative to other regions.
G. Ghanaians Bene!ted
Like mangos, rice in Ghana is not produced through the creation of full-time, structured employment. Complicating estimates of potential economic benefits in terms of Ghana is the fact that per-hectare person-days for the nine crop budgets (as shown in Figure V-5) vary from 21 to 140. !us, any estimate of the number of persons benefiting from rice production in Ghana would require more detailed information regarding the relative rice output of the regions represented by these crop budgets, as well as di"erences in the number of dependents by region. Nonetheless, it is notable that mango production’s 52 person-day of annual activity is roughly in the middle of the spread of the annual person-day estimates for rice.
VI. Three-Product Comparisons
For each of these three Ghanaian products — bananas, mangos, and rice — there is the potential to generate significant, additional economic benefits for Ghana. Given lim-ited public-policy resources to support the development of these sectors, it is useful to compare the results among the three products. !is begins with a per-acre comparison, as done in section VI-A below, but must also include other important considerations, as discussed briefly in section VI-B.
A. Economic Bene!ts per Acre
It is useful for policy purposes to compare the economic benefit generated for each of the three products on a per-acre basis, particularly in the Ghanaian context in which land

39
is the crucial scarce resource. Figure VI-1 summarizes the per-acre33 direct and indirect economic benefits arising from each of the three products, based on the crop budgets available for each. For each product, the benefits are calculated after that product’s initial investment period.
Assume these are only three industries. In the simplest terms, the economic-benefit analysis shows that on acreage where all three products can be grown competitively, the crop that will produce the greatest economic benefit for Ghana is bananas. Where either mangos or rice can be grown competitively, mangos will produce greater economic ben-efits than rice.
33As the product-speci!c discussions above make clear, data are often reported on a per-hectare (rather than per-acre) basis. For comparison purposes, this section (as well as Table A-1 in the Appendix) presents the economic bene!t outcomes on a per-acre basis.
6,000
5,000
4,000
3,000
Wor
awor
a
Dek
por
Afp
afu
Line
so
Kik
am
Kpa
tili
Din
goni
Gol
inga
Beta
Alp
ha
Kobi
na
Ano
krom
Rice
Direct Indirect
Rice Rice
Figure VI-1. Economic Bene!t by Crop Budget: Banana, Mango, Rice
Rice
Volta RegionWestern Region
Northern Region
Rice Rice Rice Rice Rice BananaMangoMango
2,000
1,000
0
Eco
nom
ic B
ene!
t (c
edis
per
acr
e)

40
As discussed above, however, this conclusion is not the same as saying “Ghana should produce bananas to the exclusion of mangos or rice.” !e economic-benefit analysis described in Section II is very location-specific. In the extreme, it would be applied on an acre-by-acre basis within Ghana, with any one of the three products potentially showing the most economic benefit for that piece of land.
In particular, the analysis suggests the following process for optimizing Ghana’s economic benefit from these three products. First, find places where bananas can be produced on a commercially competitive basis. Generally speaking, these locations will be larger, contig-uous tracts of suitable land in the south. Investment in banana production in these areas can grow a great deal before reaching the point where the international market would be saturated by Ghana’s output.
Second, land not suitable for commercially viable banana production but suitable for viable for mango production would generate economic benefits from such production, more so than rice. Largely because of transportation costs to and from Ghana’s ports, these locations are more likely to be in the south. (Reinforcing this conclusion is the fact that the south is also where rice production would find greater competition from imported rice, reducing rice’s commercial viability and economic benefits arising from profits.) Note, however, that limits on European mango demand imply limits on the number of acres in Ghana that can produce commercially viable mangos — after a certain point, additional mango production will depress prices on all mangos from all acres.
Third, land that is not suitable for commercially viable banana or mango produc-tion, but is suitable for commercially viable rice production, can best generate eco-nomic benefits through rice cultivation. Such land is likely to be in the north, where banana and mango production is not viable in most cases, or in parts of the south on land that is not suitable for banana or mango production. In the case of bananas, a key factor will be the ability to plant large, contiguous tracts, whereas in mango production a key factor will be the limits imposed by international market satura-tion.
B. Other Considerations in Assessing Bene!ts
When making these per-acre economic-benefit comparisons for policy purposes, it is important to not lose sight of the other considerations that bear on these product com-parisons.

41
Competitiveness. Each of these three products has demonstrated its commercial compet-itiveness to di"erent degrees and in di"erent ways. Ghana has shown its ability to serve the European banana market with one mass-market producer and one fair trade pro-ducer, but has not yet broken through to the scale necessary to be a top tier banana sup-plier. Relative to the volume potentials envisioned by this paper, mangos have most fully demonstrated their commercial potential. Rice remains problematic: on the one hand, there is no geographical or environmental obstacle to Ghana increasing rice production significantly (albeit water is an issue), yet despite public policy support, the country’s rice yields and output have remained well below their theoretical potential, and there is the question of quality competitiveness with imports.
Timing of Benefits. Unlike bananas and rice, mangos require several years for trees to reach their full yield potential, and thus generate the economic benefits arising from prof-its. Bananas, meanwhile, require a larger up-front, one-time investment relative to those required for mangos or rice.
Volume. Each product’s crop yield and acreage planted are changeable as a result of policy e"orts. !us sound decision-making must take into account the possibility that these variables will move over time, and consider the consequences of these movements for the economic benefit of the product.
Price. Unlike volume, price is less a"ected by policy e"orts, and therefore more policy attention must be given to potential movements in the products’ output price as a result of external forces. For bananas, for example, the key factor is likely to be the course of the EU banana-import regime, its a"ect on specific supplier export prices, and where Ghana sits among these price di"erentials. By contrast, for mangos seasonal pricing patterns in Europe are important, and for rice the important question is the longer-term trend in international prices a"ecting Ghana’s imports.
Ghana Value-Added. !e share of investment and production costs that are attributable to value-added inputs produced in Ghana is a key factor in determining total economic benefits. Such Ghanaian value-added can be increased with the proper set of public-policy initiatives that provide support to commercially competitive Ghanaian suppliers. Packag-ing and transport are two areas for consideration for the three products examined here.
To reiterate: prices, acreage, and yield are critical in determining economic benefits. !e size of the circles in Figure VI-2 represents the total economic benefit illustrated by the vertical bars in Figure VI-1. Each crop’s assumed price per metric ton is represented by

42
its circle’s height on the y-axis, with the metric tons per acre represented by the distance the circle is positioned to the right along the x-axis. As can been seen, crops with better yields tend to produce more economic benefits (a larger circle) despite rough similarity of per-ton pricing among crops.
Moreover, even within a given crop type — particularly for rice — there may be signifi-cant di"erences in production expenditures — and thus the level of economic benefits — between di"erent locations and among various types of production technologies. !ese di"erences highlight the importance of careful data collection and dissemination for accurate evidence-based decision-making.
Indeed, comparison of economic benefits as in Figure VI-1 is only a starting point for sound policy decision-making and, unless other key factors are considered, can be mis-leading. For example, to achieve this benefit-per-acre, the acreage required for banana cultivation must be very large and contiguous relative to the much smaller farms that can achieve high rice and mango yields per acre. Moreover, location is a critical factor when comparing potential economic benefits: for a crop to sustainably produce economic ben-efits it must be competitive, and some soil types (for example) might strongly favor one
Farm
gate
Pri
ce(c
edis
per
met
ric
ton)
Yield (metric tons per acre)
Figure VI-2. Economic Bene!t Depends on Yield and Price: Banana, Mango, Rice
0 2
Rice Mango
Banana
4 6 8 10 12 14 16 18 20
500878
929
1,3291,761
1,976
5,828
837606291284
265
610
250
150
300
350
400
450
200
100
50
0
43
crop over another. Figure VI-3 summarizes these key considerations as discussed in the product-specific sections of this paper.
!us, it is important to recognize that the kinds of economic-benefit comparisons shown in Figure VI-1 assume crop budgets for locations that are already deemed most suitable to the crop in question. Evidence-based decision-making must account for these loca-tional di!erences when considering competing economic policies that favor one crop over another.
VII. Other Policy Considerations
Expanded production from these three products would also generate economic benefits that are not covered be the quantification exercise presented in this paper. In particular,
Table VI-3. Summary of Attributes
Bananas Mangoes Rice
Competitiveness
Ghana meets suitability factors for international production. Has emergent export industry.
Ghana meets suitability factors for international production. Has emergent export industry.
Import competition an issue, mostly in south and urban areas.
Timing of Bene!t
Sizeable initial investments, then continuous bene!t "ow.
Signi!cant bene!ts begin around fourth year after crop establishment.
Fairly continuous bene!t stream.
Volu
me
Pote
ntia
l
Acreage
Requires large, continuous tracts of land for commerical viability.
Tracts for mango production are available in Ghana. Limits imposed by international demand.
Widespread availability.
YieldOnce international production standards reached, yield static.
Yield improvement is focus of overall volume increases.
Key area for improvement.
Price
Typically negotiated in contract with multinational fruit distribution company.
Seasonality of mango consumption in Europe, as well as of production among other exporters, is an issue.
International rice prices are off of 2008 high, but remain above historical levels are expected remain volatile.
Ghanaian Value Added
Increased domestic production of packing materials best opportunity.
Increased domestic production of packing materials best opportunity.
Little opportunity for increasing Ghana’s valued-added share of inputs.

44
such expansion would strengthen economic linkages to surrounding (input) sectors and increase their e#ciency through boosted scale economies; in the case of bananas and man-gos, enhance Ghana’s commercial reputation abroad; promote parallel development goals, such as economic diversification and rural development; and attract additional foreign direct investment.
Linkages and scale economies. Particularly for expanded bananas and mangos, expand-ed outputs would generate indirect benefits to sectors supplying inputs. !ese benefits constitute structure development linkages that can attract investment to these upstream sectors. In addition to providing additional demand for upstream products (such as packaging), the additional volume of output from these upstream suppliers translates into enhanced economies of scale as fixed overhead costs are spread across more output, thus lowering costs. Moreover, a broader customer base reduces the commercial risk faced by these suppliers, thus attracting investment. Such longer-run development benefits are not just theoretical. Latin American horticultural exports have grown substantial ancillary industries to their core fruit production, including box making, agrochemical services, horticultural research, and other professional services.
A major 27-country study showed that at levels of development similar to that of Ghana, the multiplier e"ect of agricultural activity is mainly through expenditures on labor (the top pathway in Figure II-2, above), but as development proceeds, there is a shift as the sector’s purchase of upstream goods and services — which have a rising domestic value-added component — begins to overtake the benefits of expenditures by labor households:
The results of the study con!rm agriculture’s strong backward links to non-agri-cultural production activities at low levels of development. Also, at low levels of development the rural household income multiplier (i.e. the effect of increases in rural household income on the demand for non-agricultural consumption goods) is the dominant one, while during the development process, the backward agricultur-al input output multiplier becomes dominant, i.e. the demand for agricultural inputs, including agricultural services and credit, is expanding. The !ndings indicate that the rural household multiplier declines with development as one would expect.34
!e reason one would expect the “rural household multiplier” to decline with develop-ment is that as agricultural workers’ incomes rise they can purchase a broader array of goods from further afield (namely from outside the country), thus moderating the mul-
34Food and Agriculture Organization, “World Agriculture: Towards 2010,” 1995, section 7.5 p. 5.

45
tiplier e"ect of benefits to the local economy. On the other hand, as it develops, the local economy can provide more agricultural inputs, such as packaging materials and services that heretofore were more likely to have been imported.
In addition, enhanced technical knowledge for horticultural productivity tends to spread to surrounding agricultural sectors, as shown in a study of Kenya’s horticulture-export sector:
…the skills and institutional development stimulated by [Kenya’s] horticultural export sector also serve to development [SIC] the domestic horticultural market. Given the fact that 96 percent of fruit and vegetable production is consumed do-mestically, even small improvements in yield, post-harvest methods, and marketing ef!ciency in the domestic supply chain could have bene!ts to the economy that are large relative to the direct bene!ts of horticultural exports.35
A more straightforward economy-of-scale benefit is widely seen in international transpor-tation. For example, non-banana horticultural exports have grown from Central America in part because the pre-existing banana-transport pathways had occasional excess carriage capacity, thus presenting very low marginal transport costs for other products, and lower overall average transport costs for all products. For Ghana, the situation has heretofore been the mirror-image, with established pineapple logistics setting the stage for more e#cient banana exports; nonetheless, expanded banana and mango transport will reduce transport costs for all other horticultural products.
In sum, many of the longer-run economic benefits to surrounding industries will arise from, but are often not reflected in, the value of the transactions captured in the econom-ic-benefit calculations in the previous sections.
Ghana’s commercial reputation. Evidence from recent decades strongly suggests that national success in one horticulture export will facilitate the growth of other horticultural exports from Ghana. In part, this beneficial e"ect is an outgrowth of simply economies of scale, as discussed in the previous section. Two other dynamics are at play, however. First, the major transnational horticultural companies will, other things remaining equal (and within the objective of supply diversification), prefer to expand supply relations with established producers that have proven their reliability. An concrete example in the case of Ghana is Golden Exotic’s straddle across the pineapple and banana sectors.
35Nicholas Minot and Margaret Ngigi, “Are Horticultural Exports a Replicable Success Story? Evidence from Kenya and Cote d’Ivoire,” December 2003. p. 39.

46
Second, at the level of consumer preference, the “name brand” of the supplying country can become a key factor in national competitiveness. As discussed in detail in a recent study,36 consumers — particularly in Europe — are increasingly sensitive to the labor and environmental conditions under which their fruit and vegetables are grown. If posi-tive, familiar experience with one product from a supplying country carries over to other products produced by that country. Because increased banana and mango exports from Ghana will likely entail high standards of quality control backed by the correspondent multinational specializing in tropical fruit, Ghana’s other exports will likely benefit from a strong Ghanaian-fruit reputation.
Development goals. It is possible that longer-term, less quantifiable benefits to economic development will eventually outweigh the near-term direct and indirect economic ben-efits quantified in the first part of this paper. In particular, the likely benefits generated by an expanded horticulture sector closely track Ghana’s Growth and Poverty Reduction Strategy (GPRS II) goals. A pillar of this strategy is to promote “agriculture as [a] basis for economic growth and structural transformation” (p. 23) and to do so with “expanded diversification of competitive crop exports” (p. 24). In addition, the benefits identified above disproportionately flow to rural areas rather than to Ghana’s urban centers, thus boosting rural wealth and relieving urban population pressures. Indeed, for Ghana’s large self-su#cient farm population, “o" farm” employment has been shown to be an impor-tant factor in “on farm” productivity because such “o" farm” employment provides capi-tal for “on-farm” improvements. As one study of Ghana’s agricultural economy noted:
Farm households’ resource endowment positively and signi!cantly determines irrigation adoption….off-farm participation [has a] positive effect on irrigation de-cision…. That is the positive relationship between irrigation and off-farm participa-tion, in spite of the fact that both are undertaken during the same season, the dry season, implies that they are complimentary activities.37
Finally, a growing horticulture-export sector with ties to major multinationals also strengthens the formal economy and resulting tax base.
36Brent Bartlett, “Policies Affecting the Development of Ghana’s Banana-Export Sector,” December 2006, particularly sections I.D.1 and III.F regarding consumer perceptions of banana quality by country of pro-duction. 37Tsegaye Yilma, Ernst Berg and Thomas Berger, “Prospects and Challenges of Agricultural Technology-Market Linkage under Liberalisation in Ghana: Evidence from a Micro-data” (2004) p. 25.

47
Foreign direct investment. An increase in foreign direct investment (FDI) is an important element in Ghana’s development objectives. !e economic-development literature, some of which is specific to Ghana, is nearly unanimous in the conclusion that FDI is valuable as a capital inflow to the economy and, perhaps more importantly, as a source of foreign technical and commercial expertise.38 As explained below, researchers who have questioned the mag-nitude of FDI-related expertise-inflow into developing countries typically cite unfavorable circumstances that are unlikely to prevail in the case of the Ghanaian bananas and mangos.
!e mechanism by which resources would be generated for banana investment in Ghana is likely to be a combination of (a) FDI by horticulture multinationals or third-country investors and (b) domestic investment by Ghanaians in Ghana, based on the prospec-tive inflow of revenue from fruit exports. Indeed the banana multinationals are likely to pursue a “division of rewards and responsibilities”39 with domestic-investment partners in Ghana, rather than undertaking large FDI projects themselves.
VIII. Conclusions
Aside from the particular benefit estimates for each of the three products covered in this paper, there are seven conclusions that can be drawn from the economic-benefit method-ology discussed here:
38Lawrence Arbenser, “A General Equilibrium Analysis of the Impact of Inward FDI on Ghana: The Role of Complementary Policies.” Arbenser notes that “The need for external capital in"ow to !nance the cur-rent account de!cit of developing countries cannot be over-emphasized.” (p. 1). “This paper revealed that a policy that ensures [an] increase in FDI in"ow and which reduce tariff levels are complementary policies that enhance household welfare in Ghana. It also established that [the] positive welfare impact is induced by the income effect [i.e., increased incomes rather than simply the decreased consumer prices which one would expect from tariff reductions].” (p. 21, emphasis added).39See research report, Brent Bartlett, “Policies Affecting the Development of Ghana’s Banana-Export Sector,” December 2006, section III.F regarding the “division of responsibility” strategy being pursued by the banana multinationals.

48
and thus the per-acre comparisons).
e.g., increase Ghanaian value-added for inputs).
export products, would support Ghana’s longer-term development objectives.

49
Note A. Type of economic benefit model employed.
Further information on building economic benefit models for agricultural exports can be found at U.S. Department of Agriculture, Economic Research Service (ERS), “Agri-cultural Trade Multipliers: ERS Estimates -- Methodology.” (www.ers.usda.gov/ Data/ TradeMultiplier/ ERSestimates.aspx.)
Of the models discussed in the ERS materials, the benefit model used here is of the “partially closed” variety, as opposed to being “open.” So-called “open” model multipliers calculate the value of the exported product plus the value of the activity in supporting sectors (indirect e"ects), such as inputs, processing, distribution, and other services. “Par-tially closed” models assess the direct and indirect e"ects of exports, as well as the labor-cost induced personal income and spending associated with new and sustained activities arising from the application of new resources.
Multipliers using these methodologies assume that the only limit on the output of an economy is a lack of markets for its production. As explained in Note C, “Economic ben-efits arising from land acquisition” and Note E, “Elasticity of supply for labor and input goods and services,” the fact pattern for expanded agricultural production in Ghana is consistent with this assumption; that is, product production would bring to bear under-utilized national resources. In the case of rice, perhaps much of the potential increase in production would come from boosting yields rather than from increased acreage.
When comparing the ERS methodology with that employed here, two particulars re-garding Ghana were taken into account. First, a higher proportion of direct inputs were imported by Ghana’s horticulture sector relative to the U.S. agriculture sector, thus reduc-ing the economic-benefit multiplier in the case of Ghana. Second, such multipliers can be
APPENDIX TECHNICAL NOTES

50
measured, as the ERS documents explain, “either at the producer level (which includes just the activity embodied in the commodity as it leaves the farm gate or manufacturer’s door) or at the port level (which includes shipping, handling, and storage charges in addition to the farm or manufacturing sector’s value).” Because of the availability of good in-country transportation data in the case of Ghanaian exports, the results here are port-level benefits for bananas and mangos, and at the farm gate for rice, which is not generally exported.
Note B. Estimating variables outside of available cost data and verifying cost data.
To develop a more accurate set of input variables for the benefit model used in this report roundtable discussions were held at the TIPCEE o#ces in January 2007, and in April and August 2008. In attendance were representatives from Ghanaian producers for the three products, suppliers to Ghana’s producers, other horticultural exporters, as well as experts on the Ghanaian economy from the Ministry of Trade and Industry, !e Ministry of Food and Agriculture (Horticulture Export Industry Initiative), the Ghana Export Promotion Council, the World Bank, USAID, and TIPCEE. During these ses-sions, the values of the variables used in the models were presented for comment. For certain data less available from documentary evidence, particularly the expenditure pat-terns and support of employee dependents in various regions in Ghana, the participants were asked for estimates based on their personal expertise and experience. !ere was a close consensus among the participants on these variables, and they were incorporated into the models.
Note C. Economic benefits arising from land acquisition.
Estimating the economic benefits arising from land-acquisition expenditures is di#-cult and potentially misleading. First, proceeds from land transfers and leases are typi-cally considered to be “economic rents” and not truly representing “value-added” to the economy. !is is because, unlike a workers’ labor or an agrochemical used on a farm, the land existed prior to cost-expenditure, in this case the purchase or lease. Second, for potential Ghanaian farms where the investor has always owned the land, it is di#cult to distinguish what the investor might consider to be “profits” from for example, banana production and the “shadow rent” that the investor is earning from the land’s use in the banana-production operation (although such an accounting would need be undertaken for a clear understanding of the actual returns to investment). In any case, the amount of the land cost to each sector depends on the opportunity cost (i.e., potential valuable alternative uses) of the land in question. If there is a higher value alternative use, then the purchase or lease payments from a horticulture sector would be high but simply be

51
replacing payments by other sectors, thus not representing additional value-added. If there is little alternative use, then the payments would be minimal but still not represent additional value-added.
Note D. Marginal propensity to consume.
!is assumes the marginal propensity to consume is 1.0 and thus that the marginal propensity to save is 0.0. In the local Ghanaian economy “savings” appears to be largely in the form of investment in physical assets, such as simple irrigation structures, and thus can be treated as the functional equivalent of “expenditures” for purposes of calculating indirect benefits.
Note E. Elasticity of supply for labor and input goods and services.
!e cost structure approach assumes that a specific sector has access to labor and input goods and services that will not increase in price as a result of the entry of each sector’s own demand for the product. In technical terms, this means that these resources are cur-rently unemployed (or largely under-employed), the supply elasticity is extremely high, and that the use of these resources in the sector is not simply the result of the sector “bid-ding away” the workers and other inputs from other sectors. During the interviews and roundtable discussions undertaken as part of the research for this report (See Note B), this assumption was supported by the factual situation described. In particular, employ-ees are either not being attracted from other non-household employment or whatever productive activity was being undertaken by the employee is being fulfilled by others who were previously under-employed. In the rice sector, additional rice output is likely to come from expanded activity from current growers. Similarly, there does not appear to be a long-term supply constraint on other inputs.
Note F. Occurrence of value-added and the level of trade.
Where this “value-added” occurs within the Ghanaian economy is not relevant; that is, it need not occur at the “level of trade” of the turnover level being considered. For example, the use of domestically produced fuels by an agrochemical supplier would count the value of processing occurring in Ghana as “Ghanaian value-added,” but would not count the eventual import of the petroleum, despite the fact that both components may be associated with production activity that is several transactions, or “levels of trade” away from the activities of the agrochemical processor itself. Among the reasons that this use of “value-added” is important to recognize is that the calculations here di"er from those that

52
are used to calculate liabilities under a value-added tax (VAT). In a VAT, only the value-added associated with the taxpayers’ own activity (level of trade) is considered.
!e economic benefit estimates in this report were based on crop budgets provided for each of the three products. Table A-1 of this Appendix summarizes the key data from these crop budgets and the estimated direct and indirect economic benefits for each. Table A-2 is a sample crop budget for Ghanaian mango production and Table A-3 is one of the nine crop budgets provided for Ghana’s rice sector. Figure III-2 in the main text of this report presents the elements of a banana crop budget. Note that these crop budgets were collected and reported at di"erent times and on somewhat di"erent measurement bases (e.g., hectares vs. acres) and therefore some adjustments to the date were necessary for meaningful comparisons across product types. For example, note that the crop budget for rice is reported in cedis prior to the redenomination of the currency.

53
SAMPLE CROP BUDGETS
!ree sample tables are on the following pages.

54
Per
Acr
eD
irec
t B
ene!
tIn
dire
ct B
ene!
t
Pric
eYi
eld
Reve
nue
Labo
r B
ene!
tM
ater
ials
Cos
t
Gha
na
Valu
e-A
dded
Sh
are1
Mat
eria
ls
Ben
e!t
Pro
!t3
Ben
e!t
Tota
lLa
bor-
Pr
o!t
Mul
tiplie
r2
Mat
eria
ls M
ultip
lier2
Tota
lG
rand
To
tal
40%
ab
cd
ef
g=e*
fh=
c-d-
ej=
d+g+
hk
mn=
f(d,h
,g,j,
k,m
)p=
j+n
Bana
naN
ote
4, 6
300
16.2
4,
856
Not
e 7
Not
e 7
3,23
81.
82,
590
5,82
8M
ango
A
lpha
Not
e 5
250
4.5
1,12
5 96
81.
941.
4379
31,
761
Man
goBe
taN
ote
522
45.
5 1,
229
1,18
31.
941.
4379
31,
976
Rice
Gol
inga
Not
e 4
238
0.6
146
5151
33%
1744
112
2.77
1.65
179
291
Rice
Din
goni
Not
e 4
238
0.6
146
2055
36%
2071
111
2.77
1.65
174
284
Rice
Kpat
iliN
ote
426
20.
6 14
7 38
6637
%24
4310
62.
771.
6515
926
5Ri
ceKi
kam
Not
e 4
298
1.4
430
150
9440
%38
185
373
2.31
1.65
464
837
Rice
Kobi
na A
nokr
omN
ote
435
71.
3 45
5 13
474
40%
3024
841
12.
311.
6551
992
9Ri
ceLi
neso
Not
e 4
333
1.0
337
163
9836
%35
7627
42.
311.
6533
661
0Ri
ceA
fpaf
uN
ote
442
91.
1 45
2 13
895
40
%38
219
395
2.31
1.43
484
878
Rice
Dek
por
Not
e 4
298
2.5
759
152
226
30%
6838
160
12.
311.
4372
81,
329
Rice
Wor
awor
aN
ote
427
41.
3 35
4 16
411
129
%32
7927
52.
311.
4333
160
6
1. S
ee d
iscus
sion
in S
ectio
n II
rega
rdin
g va
lue-
adde
d m
etho
dolo
gy.
2. S
ee d
iscus
sion
in S
ectio
n II
rega
rdin
g m
ultip
liers
for
indi
rect
ben
e!t.
3. I
nclu
des
impl
icit
wag
e am
ong
wor
ker-
owne
rs, a
nd th
eref
ore
num
bers
may
not
be
com
para
ble
acro
ss s
ampl
es. A
ssum
es p
ro!t
s ar
e ea
rned
by
Gha
naia
ns a
nd a
re e
xpen
ded
in G
hana
in !
rst
inst
ance
.4.
Rep
orte
d on
per
hec
tare
bas
is.5.
Rep
orte
d on
per
acr
e ba
sis; s
ee ta
ble
belo
w fo
r m
arke
t-de
stin
atio
n as
sum
ptio
ns fo
r m
ango
pri
ce.
Stan
dalo
ne r
epor
t use
s 4.
0 yi
eld,
whi
ch is
con
serv
ativ
e an
d co
nfor
ms
to F
AO
sta
tistic
s; cr
op
budg
ets
are
likel
y to
be
stat
e of
art
for
grow
th.
6. P
rice
con
form
s to
200
7 re
port
; dep
ends
on
natu
re o
f res
pons
ibili
ty-s
hari
ng c
ontr
act w
ith in
tern
atio
nal t
radi
ng c
ompa
ny; o
rigi
nal b
anan
a re
port
was
not
don
e on
per
-are
a ba
sis.
7. C
alcu
latio
ns b
ased
on
com
pany
pro
prie
tary
info
rmat
ion
on c
ost s
truc
ture
. $3
0 m
illio
n of
dire
ct b
ene!
t bas
ed o
n 15
0,00
0 M
T of
exp
ort a
t yie
ld s
how
n he
re im
plie
s 9
,266
.25
acre
s, or
3
,237
.56
per
acre
Not
e: A
ll be
ne!t
s ar
e ta
ken
for
year
of m
atur
e pr
oduc
tion
and
excl
ude
one-
time
inve
stm
ent b
ene!
ts, d
epen
ding
on
time
hori
zon,
this
crea
tes
a bi
as a
gain
st b
anan
as a
nd, t
o a
less
er e
xten
t, m
ango
s.
Not
e: B
eta
loca
l pri
ce r
e"ec
ts m
ix o
f loc
al s
ales
and
pro
cess
ing.
Man
go m
arke
t-des
tinat
ion
assu
mpt
ions
(ced
is pe
r kg)
.
A
lpha
Bet
aEx
port
%
60%
55
%
Expo
rt P
rice
0.35
0.
300
Dom
estic
Pric
e 0.
10
0.13
0
per
kg0.
25
0.22
35
Per
MT
250
223.
5
Tabl
e A
-1. E
cono
mic
Ben
e!t
Com
pari
son
Per
Acr
e: T
hree
Pro
duct
s an
d Tw
elve
Cro
p B
udge
ts

55
Ex
amp
le o
f a
Cro
p B
ud
get
: M
ang
oT
able
A-2
8 M
AN
GO
MA
INT
EN
AN
CE
CO
ST
S P
ER
AC
RE
PE
R Y
EA
R A
FT
ER
YE
AR
4
Data
to
be f
ille
d o
ut
per
orc
hard
!
Num
ber
of tr
ees p
er
acre
40
Age o
rchard
/ y
ear
after
pla
nting
7
Num
ber
of seasons in the y
ear
2
Acti
vit
yU
nit
# o
f
Ap
plicati
on
s
Qty
per
ap
pl.
Un
it P
rice (
¢)
To
tal co
st
(¢)
A.
Weed
co
ntr
ol
Herb
icid
eH
erb
icid
e n
eed
# o
f ap
pl. p
er
year
Co
st
per
litr
eTo
tal
Herb
icid
e -
Gly
phosate
1 lt
43
560
Gly
phosate
3 lt per
appl.
45
20
Rin
g w
eedin
g &
herb
icid
e a
ppl.
man d
ay
45
360
4 x
5 m
an d
ays
Su
b T
ota
l120
B.
Fert
ilis
ati
on
Fert
ilis
er
Qty
. o
f fe
rtilis
er
per
tree
# o
f ap
pl. p
er
seaso
nC
ost
per
un
it
NP
Kn/a
00
0.0
0N
o N
PK
on a
ssum
ption that soil
has n
o n
itro
gen d
eficie
ncy
Folia
r ca, boro
n, P
&K
fert
iliser
1 lt
40.1
03.2
1M
angoB
oost
2,5
ml
23.2
Pota
ssiu
m n
itra
te25 k
g2
424
192
Pota
s. nitra
te100g
1 (
for
flow
er
induction)
24
Fert
iliser
applic
ation
man d
ay
40.8
03
10
50 tre
es p
er
man p
er
day
4
Su
b T
ota
l203
C.
Dis
ease C
on
tro
lF
un
gic
ide
Qty
. o
f fu
ng
icid
e p
er
tree
# o
f ap
pl. p
er
seaso
nC
ost
per
kg
Conta
ct fu
ngic
ide F
ungura
nkg
12
2.0
05.4
130
Fungura
n5g
3 (
betw
een flo
wer&
fruitset)
5.4
Syste
m fungic
ide M
ancozeb
kg
12
2.0
04.5
108
Mancozeb
5g
3 (
betw
een flo
wer&
fruitset)
4.5
Spra
yin
gm
an d
ay
12
0.8
03
29
50 tre
es p
er
man p
er
day
6
Su
b T
ota
l266
D.
Pest
Co
ntr
ol
Pesti
cid
eQ
ty. o
f p
esti
cid
e p
er
tree
# o
f ap
pl. p
er
seaso
nC
ost
per
un
it
Sto
ne w
eevil
insecticid
e
lt2
0.3
510
7H
ocklic
om
bi
8,7
5m
l1 (
when fru
it is g
olfball
siz
e)
10
Spra
yin
g w
eevil
insecticid
em
an d
ay
20.8
35
50 tre
es p
er
man p
er
day
1
Fru
it fly
tra
ppin
g
sensus tra
p1
15
5F
ruit fly
tra
p4 p
er
acre
0.5
5
Su
b T
ota
l17
E.
Pru
nin
gP
run
ing
# o
f ap
pl. p
er
seaso
n
Pru
nin
g tre
es
man d
ay
61.0
318
40 tre
es p
er
man p
er
day
3
Su
b T
ota
l18
H.
Harv
esti
ng
Year
aft
er
est.
Yie
ld e
sti
mate
per
tree p
er
year
Year
aft
er
est.
Yie
ld p
er
tree
Year
aft
er
est.
Yie
ld p
er
tree
Harv
esting fru
its
100 fru
its
276
0.1
015
440
18
209
27
132
Carr
yin
g fru
its
100 fru
its
276
0.1
523
5130
19
198
28
125
Su
b T
ota
l38
6174
20
188
29
119
I.F
ixed
In
pu
ts7
191
21
179
30
113
Tools
& c
onsum
able
s
8 types
11
56
56
8209
22
170
Su
b T
ota
l56
9226
23
162
TO
TA
L P
ER
AC
RE
718
10 -
15
243
24
153
16
231
25
146
PR
OD
UC
TIO
N C
OS
TS
/KG
RE
VE
NU
E A
SS
UM
PT
ION
S17
220
26
139
Tota
l C
ost (¢
)718
Exp
ort
sale
(60%
)L
ocal sale
s (
40%
)
Tota
l Y
ield
/Tre
e (
kg) *
191
Quantity
4,5
84
Quantity
3,0
56
To
ols
an
d C
on
su
mab
les
Co
st
Qty
W
ear
per
year
Co
st
per
year
Avera
ge W
eig
ht/F
ruit (
kg)
0.5
Price/K
g0.3
5P
rice/K
g0.1
00
i. M
achete
- s
lashin
g
5.0
250%
5
To
tal Y
ield
/Acre
(kg
)7,6
40
Valu
e (
¢)
1,6
04
Valu
e (
¢)
306
ii. B
oots
7.5
450%
15
To
tal C
ost
/Kg
(¢)
0.0
940
To
tal V
alu
e(¢
)1,9
10
iii. N
ose m
ask
0.5
650%
1.5
* F
ill in the y
ield
per
tree c
orr
espondin
g w
ith
To
tal C
ost
(¢)
718
iv. P
lastic g
loves
22
50%
2
the a
ge o
f th
e o
rchard
(see n
ext page)
Pro
fit
(¢)
1,1
92
v. G
oggle
s
5.2
250%
5.2
Assum
ptions:
Gro
ss M
arg
in62%
vi. F
irst A
id b
ox
10
125%
2.5
1. 6 tre
es s
pra
yed w
ith 1
knapsack (
2,5
lt per
tree)
Note
s:
vii.
Secate
ur/
pic
kin
g p
ole
4.0
550%
10
2. 1 m
an s
pra
ys 5
0 tre
es in 1
day (
6 p
er
hour)
Only
pre
ventive IP
M s
pra
yin
g inclu
ded
viii
. H
arv
esting c
rate
s
7.5
10
20%
15
3. 1 m
an p
runes 4
0 tre
es in 1
day (
5 p
er
hour)
Cura
tive s
pra
yin
g to b
e inclu
ded in o
per.
expenses
To
tal
56.2
Tabl
e A
-2. E
xam
ple
of a
Cro
p B
udge
t: M
ango

56
Example of Crop Budget: Rice Table A-3
2.10 Cost and Benefit of Paddy Cultivation
Region: Volta
Site - 1 AkpafuUnit per ha
Unit Family Labour Hired Labour Total
Unit Cost (¢) M F M F Amount (¢)
Labour
Nursery preparation/broadcasting
Land preparation ha 615,000 2 1,230,000
Sowing seed ha 300,000 1 300,000
Weeding ha 100,000 5 500,000
Application of fertilzier ha 60,000 1 60,000
Pest and disease control
Cutting/harvesting ha 180,000 5 900,000
Threshing and Cleaning ha 30,000 5 150,000
Transport 175,000 1 175,000
Carting by head load 90,000 1 90,000
3,405,000
Unit Unit Requirement Total
kg/ha Cost (¢) Amount (¢)
2.Materials
Seed kg 5,000 70 350,000
Fertilizers :
Sulfate of ammonia kg 3,600 125 450,000
NPK 15-15-15 kg 4,000 250 1,000,000
Herbicides : Caliherb Lits 65,000 7 455,000
roundup Lits 55,000 8 440,000
Pesticides :
Fungicides :
Tools and equipment Hoe 45,000 2 90,000
Cutlass 35,000 2 70,000
Farm Machinery
Land Preparation
Threshing
Drying
Transportation
Miscellaneous l.s.
2,855,000
(1) Production 2,604 kg
(2) Farm Gate Price 4,286
(3) Gross Income 11,160,744
(4) Production Cost 6,260,000
Labour wage 3,405,000
Materials 2,855,000
(5) Net Income ¢ 4,900,744
Total for Materials (2)
Requirement
(m.d)Input
Total Labour (1)
Input
Table A-3. Example of a Crop Budget: Rice