Assessing Corruption with Big Data - bbvaresearch.com · "Mensalao" scandal 2013 popular protests...
25
Assessing Corruption with Big Data March 2018
Transcript of Assessing Corruption with Big Data - bbvaresearch.com · "Mensalao" scandal 2013 popular protests...
Assessing Corruption
with Big Data
March 2018

Assessing Corruption with Big Data
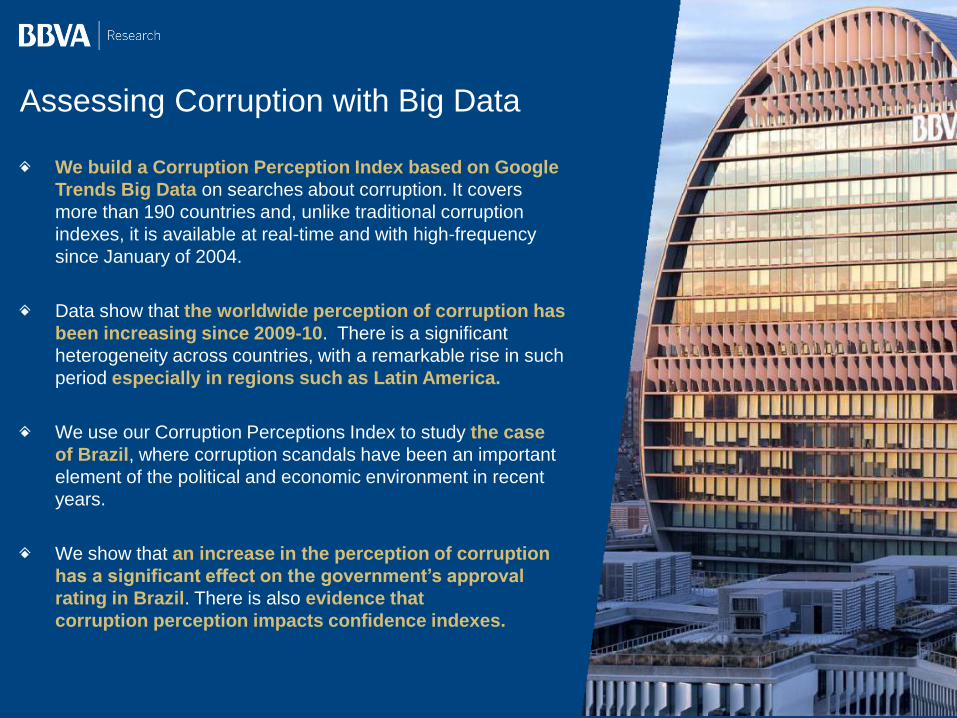
Assessing Corruption with Big Data
We build a Corruption Perception Index based on Google
Trends Big Data on searches about corruption. It covers
more than 190 countries and, unlike traditional corruption
indexes, it is available at real-time and with high-frequency
since January of 2004.
Data show that the worldwide perception of corruption has
been increasing since 2009-10. There is a significant
heterogeneity across countries, with a remarkable rise in such
period especially in regions such as Latin America.
We use our Corruption Perceptions Index to study the case
of Brazil, where corruption scandals have been an important
element of the political and economic environment in recent
years.
We show that an increase in the perception of corruption
has a significant effect on the government’s approval
rating in Brazil. There is also evidence that
corruption perception impacts confidence indexes.

Assessing Corruption with Big Data
3
Measuring
corruption

Assessing Corruption with Big Data
How do we build a Corruption Perception Index based
on Google Trends Big Data?
4
Searching for the topic “Corruption” at Google Trends (trends.google.com):
by searching for the topic rather than for the term “corruption” we make sure to take
into account web searches including not only the exact term “corruption” but also
the word “corruption” in other languages as well as misspellings and synonyms
Defining the time range to extend from January 2004 until now
Selecting the category “Law & Government” since our focus is on the misuse
of public resources
We first look at worldwide searches about the topic “corruption” and compare results
for 191 countries. We then look at searches about “corruption” in Brazil,
which will be our case study
Google Trends provides relative rather than absolute data : “Numbers represent
search interest relative to the highest point on the chart for the given region and time.
A value of 100 is the peak popularity for the term. A value of 50 means that the term
is half as popular. A score of 0 means there was not enough data for this term”

Assessing Corruption with Big Data
5
We build a Corruption Perception Index based on Google Trends to have a real-time,
high frequency (monthly) indicator reflecting how people perceive corruption. Our
indicator unveils some new features of corruption perception and allows for innovative
analysis related to the issue.
Most other corruption perception indexes are released with some delay, at annual
frequency. On top of that, some of them do not exactly build on people’s perception
on corruption but rather on the opinion of experts or other, more structural, indicators
In this sense, our index is more perceptional, more news-sensitive and potentially
more volatile. We see it more suited to gauge effects of corruption on government
approval ratings, confidence, electoral results, etc.
Other corruption perception indexes, such as the most traditional one developed
by Transparency International, are more structural, thus more suited to analysis
of impact of corruption on inequality, development levels, etc.
Why do we build a Corruption Perception Index based
on Google Trends Big Data?

Assessing Corruption with Big Data
6
In this case, we look at worldwide searches
including the topic “corruption”
Results show that the searches on “corruption” are becoming
more and more common in comparison to other searches,
suggesting an increasing concern worldwide about the issue 6
Corruption perception index, worldwide (Index varying from 0 to 100)
Source: BBVA Research based on data from Google Trends
The worldwide perception of corruption has been
increasing since 2009-10
30
40
50
60
70
80
90
100
Ja
n-0
4
May-
04
Sep
-04
Ja
n-0
5
May-0
5
Sep
-05
Ja
n-0
6
May-0
6
Sep
-06
Jan-0
7
May-
07
Sep
-07
Ja
n-0
8
May-0
8
Sep
-08
Jan-0
9
May-
09
Sep
-09
Ja
n-1
0
May-1
0
Sep
-10
Ja
n-1
1
May-1
1
Sep
-11
Ja
n-1
2
May-1
2
Sep
-12
Ja
n-1
3
May-1
3
Sep
-13
Jan-1
4
May-
14
Sep
-14
Ja
n-1
5
May-1
5
Sep
-15
Jan-1
6
May-
16
Sep
-16
Ja
n-1
7
May-1
7
Sep
-17
Ja
n-1
8
Corruption perception index Trend

Assessing Corruption with Big Data
7
For a group of selected countries, we compare the
frequency of searches on “corruption” in 2017
to the searches in 2012
Heterogeneity is significant. In regions such as Latin America
there has been an important increase in the corruption
perception, according to our index 7
There exists an important heterogeneity across countries; the increase
of the corruption perception in Latin America is particularly remarkable
Change in the corruption perception between 2017 and 2012, selected countries (%)
Source: BBVA Research based on data from Google Trends
-60
-30
0
30
60
90
120
Ca
nad
a
Ge
rma
ny
Fin
lan
d
Ja
pa
n
US
Sw
ed
en
UK
Ita
ly
Fra
nce
Ind
ia
Eg
yp
t
Ind
on
esia
Po
lan
d
Ru
ssia
S.
Afr
ica
Slo
va
kia
Ch
ina
Me
xic
o
Arg
entina
Ch
ile
Bra
zil
Uru
gu
ay
Pe
ru
Co
lom
bia

Assessing Corruption with Big Data
Corruption perception is in general higher in less developed countries
8
When looking at worldwide searches
on “corruption”, Google Trends also provides data
on the relative frequency of searches by country…
… which allows us to compare the perception of corruption
for 191 countries. Results are unsurprising: in general,
the perception of corruption is higher in less developed countries 8
Source: BBVA Research based on data from Google Trends.
Corruption perception index by country, 2017 (darker tones indicate higher perception of corruption)

Assessing Corruption with Big Data
9
We rank countries according to our index
and then compare to the corruption
perception ranking released by
Transparency International
Although different, the two rankings
are positively correlated
In some cases, such as in UK, US,
Hong Kong, Indonesia, South Africa, etc.
The perception of corruption based on web
searches is higher than the Transparency
International’ index suggests. Taking
comments on page 5 into account,
in these places corruption is relatively more
perceptional than structural
On the other hand, in China, Argentina,
Uzbekistan, etc. corruption seems to be
relatively more structural than perceptional
Source: BBVA Research based on data from Google Trends; Transparency international
Our corruption perception index compared to the one by Transparency
International: positively correlated, but different by construction
Rankings of corruption perception, 2016 (higher position in the rankings represent higher corruption perception)
0
30
60
90
120
150
180
0 30 60 90 120 150 180Rankin
g -
BB
VA
Researc
h b
ased o
n G
oogle
Tre
nds
Ranking - Transparency International
correlation: 0.43
Uzbekistan
China
Brazil
Hong Kong
Indonesia
US
Peru
Germany
Colombia
Mexico
Argentina
Chile
UK
Denmark Russia
South Africa

Assessing Corruption with Big Data
10
Assessing the
impact of corruption
in Brazil
Assessing Corruption with Big Data
11
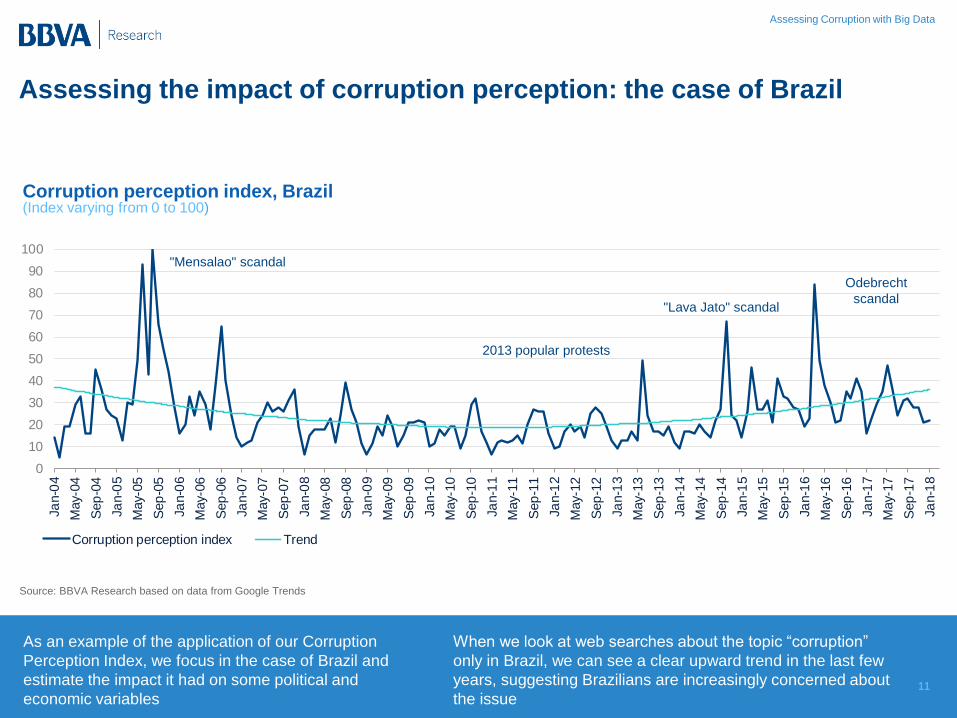
As an example of the application of our Corruption
Perception Index, we focus in the case of Brazil and
estimate the impact it had on some political and
economic variables
When we look at web searches about the topic “corruption”
only in Brazil, we can see a clear upward trend in the last few
years, suggesting Brazilians are increasingly concerned about
the issue 11
Assessing the impact of corruption perception: the case of Brazil
Corruption perception index, Brazil (Index varying from 0 to 100)
Source: BBVA Research based on data from Google Trends
0
10
20
30
40
50
60
70
80
90
100
Ja
n-0
4
May-0
4
Sep
-04
Ja
n-0
5
May-0
5
Sep
-05
Ja
n-0
6
May-0
6
Sep
-06
Ja
n-0
7
May-0
7
Sep
-07
Ja
n-0
8
May-0
8
Sep
-08
Ja
n-0
9
May-0
9
Sep
-09
Ja
n-1
0
May-1
0
Sep
-10
Ja
n-1
1
May-
11
Sep
-11
Jan-1
2
May-1
2
Sep
-12
Ja
n-1
3
May-1
3
Sep
-13
Ja
n-1
4
May-
14
Sep
-14
Jan-1
5
May-
15
Sep
-15
Jan-1
6
May-1
6
Sep
-16
Ja
n-1
7
May-
17
Sep
-17
Ja
n-1
8
Corruption perception index Trend
"Mensalao" scandal
2013 popular protests
"Lava Jato" scandal
Odebrecht
scandal

Assessing Corruption with Big Data
The Corruption Perception Index for Brazil is negatively correlated with
government approval ratings in the country
12
A higher perception of corruption could be causing a
drop in government approval ratings
The correlation between the two variables (-0.40)
reinforce this claim
12
Source: BBVA Research based on data from Google Trends; CNI
Corruption perception index and government approval ratings in Brazil (Indexes varying from 0 to 100)
0
10
20
30
40
50
60
70
80
90
100
Ja
n-0
4
Oct-
04
Jul-05
Apr-
06
Ja
n-0
7
Oct-
07
Ju
l-08
Apr-
09
Jan-1
0
Oct-
10
Ju
l-11
Apr-
12
Ja
n-1
3
Oct-
13
Jul-14
Apr-
15
Ja
n-1
6
Oct-
16
Ju
l-17
Government approval rating Corruption perception index
correlation: -0.40
Assessing Corruption with Big Data
13
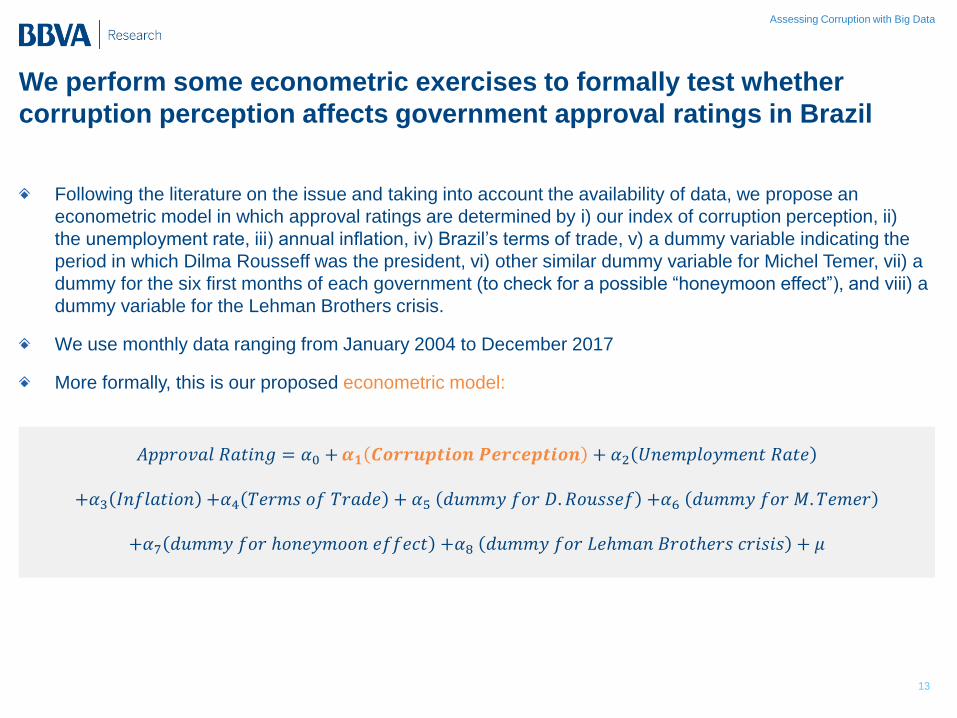
𝐴𝑝𝑝𝑟𝑜𝑣𝑎𝑙 𝑅𝑎𝑡𝑖𝑛𝑔 = 𝛼0 + 𝜶𝟏 𝑪𝒐𝒓𝒓𝒖𝒑𝒕𝒊𝒐𝒏 𝑷𝒆𝒓𝒄𝒆𝒑𝒕𝒊𝒐𝒏 + 𝛼2 𝑈𝑛𝑒𝑚𝑝𝑙𝑜𝑦𝑚𝑒𝑛𝑡 𝑅𝑎𝑡𝑒
+𝛼3 𝐼𝑛𝑓𝑙𝑎𝑡𝑖𝑜𝑛 +𝛼4 𝑇𝑒𝑟𝑚𝑠 𝑜𝑓 𝑇𝑟𝑎𝑑𝑒 + 𝛼5 𝑑𝑢𝑚𝑚𝑦 𝑓𝑜𝑟 𝐷. 𝑅𝑜𝑢𝑠𝑠𝑒𝑓 +𝛼6 𝑑𝑢𝑚𝑚𝑦 𝑓𝑜𝑟 𝑀. 𝑇𝑒𝑚𝑒𝑟
+𝛼7 𝑑𝑢𝑚𝑚𝑦 𝑓𝑜𝑟 ℎ𝑜𝑛𝑒𝑦𝑚𝑜𝑜𝑛 𝑒𝑓𝑓𝑒𝑐𝑡 +𝛼8 𝑑𝑢𝑚𝑚𝑦 𝑓𝑜𝑟 𝐿𝑒ℎ𝑚𝑎𝑛 𝐵𝑟𝑜𝑡ℎ𝑒𝑟𝑠 𝑐𝑟𝑖𝑠𝑖𝑠 + 𝜇
Following the literature on the issue and taking into account the availability of data, we propose an
econometric model in which approval ratings are determined by i) our index of corruption perception, ii)
the unemployment rate, iii) annual inflation, iv) Brazil’s terms of trade, v) a dummy variable indicating the
period in which Dilma Rousseff was the president, vi) other similar dummy variable for Michel Temer, vii) a
dummy for the six first months of each government (to check for a possible “honeymoon effect”), and viii) a
dummy variable for the Lehman Brothers crisis.
We use monthly data ranging from January 2004 to December 2017
More formally, this is our proposed econometric model:
We perform some econometric exercises to formally test whether
corruption perception affects government approval ratings in Brazil

Assessing Corruption with Big Data
The results support the claim that corruption perception negatively
affects approval ratings in Brazil
14
OLS estimation results:
“approval ratings” model
(independent variables) (associated coefficients)
Corruption Perception -0.13 ***
Unemployment -1.56 ***
Inflation -1.20 **
Terms of Trade 1.18 ***
Rousseff -31.2 ***
Temer -52.1 ***
Honeymoon effect 6.31 ***
LB crisis 18.5 ***
*** Significant at 1%. ** Significant at 5%. * Significant at 10%. Sample size: 168 months (Jan 2004 to Dec 2017). R2=0.86. Source: BBVA Research.
The coefficient associated to the corruption
perception index is negative and statistically
significant, supporting the claim that corruption
perception negatively affects approval ratings
The coefficients of other variables are also
significant and in line with expectations:
• Higher unemployment and higher inflation both drive
approval ratings down;
• Higher terms of trade (which reflect a better external
environment) drive approval ratings up;
• There is a negative effect related to the governments
of Rousseff and mainly of Temer (in comparison to the
government of Lula);
• There exists a honeymoon effect: approval ratings are
higher during the first six months of each government;
• The Lehman Brothers crisis had a positive effect on
approval ratings, in line with findings for other countries
showing that approval ratings increase during adverse
periods (war, external crisis, etc.)
More details, including additional estimations,
in the Annex

Assessing Corruption with Big Data
On top of political consequences, corruption perception could also have
an economic effect; we test its impact on confidence indicators
15
In theory, higher corruption perception could have a
negative effect on both producer and consumer
confidence indexes
We test that using two models, one with consumer confidence and
other with producer confidence as dependent variable (we keep the
same independent variables used in the model for approval ratings) 15
Source: BBVA Research based on data from Google Trends; Producer confidence index: FGV; Consumer confidence index: FECOMERCIO
Corruption perception index and consumer confidence (CPI ranges from 0 to 100; confidence ranges from 0 to 200)
Corruption perception index and producer confidence (CPI ranges from 0 to 100; confidence ranges from 0 to 200)
0
10
20
30
40
50
60
70
80
90
100
80
90
100
110
120
130
140
150
160
170
180
Ja
n-0
4
Oct-
04
Ju
l-05
Apr-
06
Ja
n-0
7
Oct-
07
Jul-08
Apr-
09
Ja
n-1
0
Oct-
10
Ju
l-11
Apr-
12
Ja
n-1
3
Oct-
13
Jul-14
Apr-
15
Ja
n-1
6
Oct-
16
Ju
l-17
Consumer confidence (lhs)
Corruption perception index (rhs)
correlation -0.47
0
10
20
30
40
50
60
70
80
90
100
60
70
80
90
100
110
120
Ja
n-0
4
Oct
-04
Jul-05
Apr-
06
Ja
n-0
7
Oct-
07
Jul-08
Apr-
09
Ja
n-1
0
Oct
-10
Jul-11
Apr-
12
Ja
n-1
3
Oct-
13
Ju
l-14
Apr-
15
Ja
n-1
6
Oct
-16
Jul-17
Producer confidence (lhs)
Corruption perception index (rhs)
correlation -0.24
Assessing Corruption with Big Data
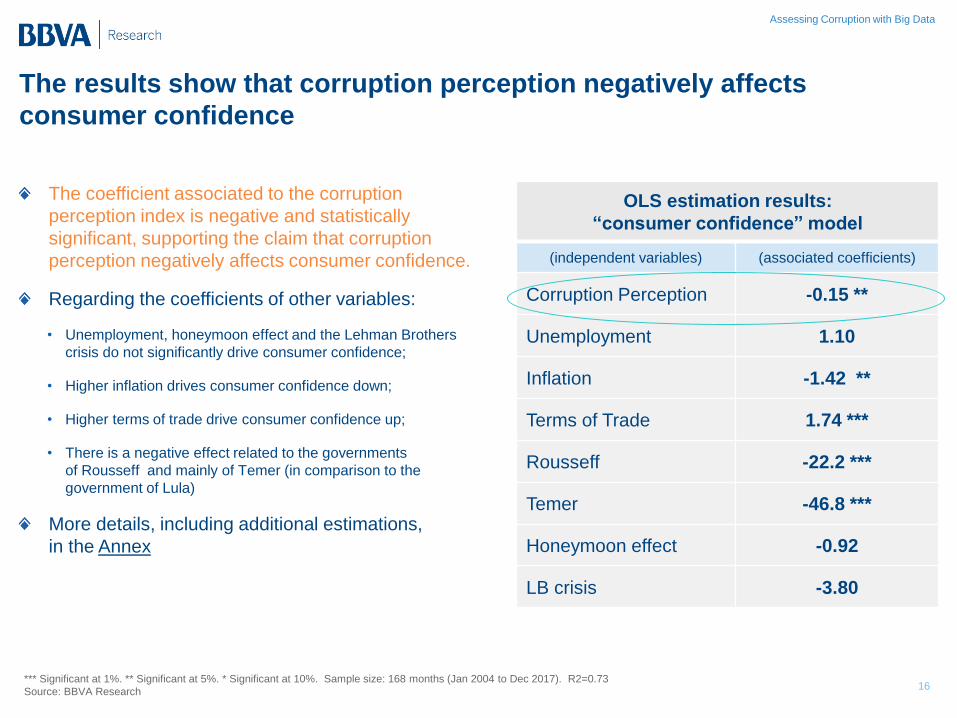
The results show that corruption perception negatively affects
consumer confidence
16
The coefficient associated to the corruption
perception index is negative and statistically
significant, supporting the claim that corruption
perception negatively affects consumer confidence.
Regarding the coefficients of other variables:
• Unemployment, honeymoon effect and the Lehman Brothers
crisis do not significantly drive consumer confidence;
• Higher inflation drives consumer confidence down;
• Higher terms of trade drive consumer confidence up;
• There is a negative effect related to the governments
of Rousseff and mainly of Temer (in comparison to the
government of Lula)
More details, including additional estimations,
in the Annex
OLS estimation results:
“consumer confidence” model
(independent variables) (associated coefficients)
Corruption Perception -0.15 **
Unemployment 1.10
Inflation -1.42 **
Terms of Trade 1.74 ***
Rousseff -22.2 ***
Temer -46.8 ***
Honeymoon effect -0.92
LB crisis -3.80
*** Significant at 1%. ** Significant at 5%. * Significant at 10%. Sample size: 168 months (Jan 2004 to Dec 2017). R2=0.73
Source: BBVA Research

Assessing Corruption with Big Data
There exists also evidence on a negative effect of corruption perception
on producer confidence
17
The coefficient associated to the corruption
perception index is negative and statistically
significant, supporting the claim that corruption
perception negatively affects producer confidence.
Regarding the coefficients of other variables:
• higher unemployment drives producer confidence up (maybe not surprisingly given that producers can benefit from less tight labor markets);
• higher inflation drives consumer confidence down;
• higher terms of trade drive producer confidence up;
• there is a negative effect related to the governments of Rousseff and mainly of Temer (in comparison to the government of Lula);
• honeymoon effect is not significant;
• the Lehman Brothers crisis had a negative effect on producer confidence
More details, including additional estimations,
in the Annex
OLS estimation results:
“producer confidence” model
(independent variables) (associated coefficients)
Corruption Perception -0.07 **
Unemployment 1.82 ***
Inflation -1.60 ***
Terms of Trade 0.88 ***
Rousseff -12.7 ***
Temer -29.2 ***
Honeymoon effect 1.16
LB crisis -22.3 ***
*** Significant at 1%. ** Significant at 5%. * Significant at 10%. Sample size: 168 months (Jan 2004 to Dec 2017). R2=0.81. Source: BBVA Research .

Assessing Corruption with Big Data
18
Although we are focusing in only one of
the many channels through which corruption
can affect some variables, our results show that
corruption does have an immediate and
negative political and economic impact
in Brazil
The coefficients associated with corruption
perception in approval ratings, consumer
confidence and producer confidence models
are consistent with (average) elasticities
of -0.21, -0.04 and -0.02 respectively (*)
At the beginning of 2016, for example, the
perception of corruption increased around
340%. According to our results, that reduced
approval ratings by 50%, consumer confidence
by 14% and producer confidence by 7%
(*) Based on the coefficients of OLS regressions as well as on the coefficients of IV-GMM regressions displayed in the Annex
Source: BBVA Research.
Final comments on the impact of corruption perception in Brazil
Impact of a 10% increase in corruption perception on approval ratings, consumer and producer confidence (*) (%)
-1.6
-1.4
-1.2
-1.0
-0.8
-0.6
-0.4
-0.2
0.0
Approval rating Consumerconfidence
Producer confidence
Assessing Corruption with Big Data
Assessing Corruption with Big Data
We build a Corruption Perception Index based on Google
Trends Big Data on searches about corruption. It covers
more than 190 countries and, unlike traditional corruption
indexes, it is available at real-time and with high-frequency
since January of 2004.
Data show that the worldwide perception of corruption has
been increasing since 2009-10. There is a significant
heterogeneity across countries, with a remarkable rise in such
period especially in regions such as Latin America.
We use our Corruption Perceptions Index to study the case
of Brazil, where corruption scandals have been an important
element of the political and economic environment in recent
years.
We show that an increase in the perception of corruption
has a significant effect on the government’s approval
rating in Brazil. There is also evidence that
corruption perception impacts confidence indexes.

Assessing Corruption with Big Data
20
Annex

Assessing Corruption with Big Data
21
Corruption perception index, Brazil and worldwide (Indexes varying from 0 to 100)
Source: BBVA Research based on data from Google Trends
Worldwide corruption perception impacts
the corruption perception in Brazil
(formal econometric tests support this claim)
and is not impacted by government approval
ratings and confidence indicators in Brazil.
Thus, it should be a valid instrumental variable
(IV)
We also use the lags of corruption
perception in Brazil as IVs
We reestimate previously proposed
models using IV-GMM
In fact, to address potential problems
due to residuals’ heteroscedasticity or
serial correlation, we use the Newey-West’
heteroscedasticity and autocorrelation
consistent (HAC) estimator
In our model, the corruption perception variable could be endogenous,
so we use worldwide corruption perception as instrumental variable
25.0
32.5
40.0
47.5
55.0
62.5
70.0
77.5
85.0
92.5
100.0
0.0
10.0
20.0
30.0
40.0
50.0
60.0
70.0
80.0
90.0
100.0
Ja
n-0
4
Ja
n-0
5
Ja
n-0
6
Ja
n-0
7
Ja
n-0
8
Ja
n-0
9
Ja
n-1
0
Ja
n-1
1
Ja
n-1
2
Ja
n-1
3
Ja
n-1
4
Ja
n-1
5
Ja
n-1
6
Ja
n-1
7
Ja
n-1
8
Corruption perception index - Brazil
Corruption perception index - Worldwide
correlation 0.35
Assessing Corruption with Big Data
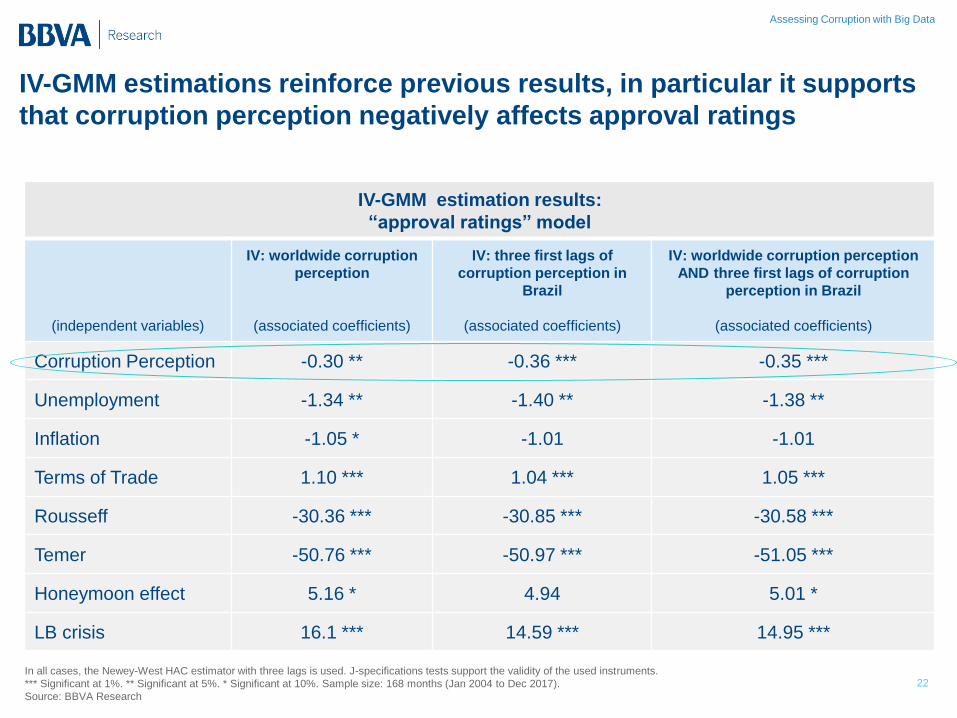
22 In all cases, the Newey-West HAC estimator with three lags is used. J-specifications tests support the validity of the used instruments.
*** Significant at 1%. ** Significant at 5%. * Significant at 10%. Sample size: 168 months (Jan 2004 to Dec 2017).
Source: BBVA Research
IV-GMM estimation results:
“approval ratings” model
(independent variables)
IV: worldwide corruption
perception
(associated coefficients)
IV: three first lags of
corruption perception in
Brazil
(associated coefficients)
IV: worldwide corruption perception
AND three first lags of corruption
perception in Brazil
(associated coefficients)
Corruption Perception -0.30 ** -0.36 *** -0.35 ***
Unemployment -1.34 ** -1.40 ** -1.38 **
Inflation -1.05 * -1.01 -1.01
Terms of Trade 1.10 *** 1.04 *** 1.05 ***
Rousseff -30.36 *** -30.85 *** -30.58 ***
Temer -50.76 *** -50.97 *** -51.05 ***
Honeymoon effect 5.16 * 4.94 5.01 *
LB crisis 16.1 *** 14.59 *** 14.95 ***
IV-GMM estimations reinforce previous results, in particular it supports
that corruption perception negatively affects approval ratings

Assessing Corruption with Big Data
IV-GMM estimations in general support the claim that corruption
perception negatively impacts consumer confidence
23
IV-GMM estimation results:
“consumer confidence” model
(independent variables)
IV: worldwide corruption
perception
(associated coefficients)
IV: three first lags of
corruption perception in
Brazil
(associated coefficients)
IV: worldwide corruption perception
AND three first lags of corruption
perception in Brazil
(associated coefficients)
Corruption Perception -0.07 -0.39 ** -0.32 **
Unemployment 1.00 1.69 1.21
Inflation -1.48 -1.29 -1.59
Terms of Trade 1.77 *** 1.65 *** 1.66 ***
Rousseff -22.63 *** -20.04 *** -18.44 ***
Temer -47.33 *** -45.49 *** -44.18 ***
Honeymoon effect -0.45 -2.97 -3.12
LB crisis -2.83 -6.78 * -4.57
In all cases, the Newey-West HAC estimator with three lags is used. J-specification tests support the validity of the used instruments.
*** Significant at 1%. ** Significant at 5%. * Significant at 10%. Sample size: 168 months (Jan 2004 to Dec 2017).
Source: BBVA Research
Assessing Corruption with Big Data
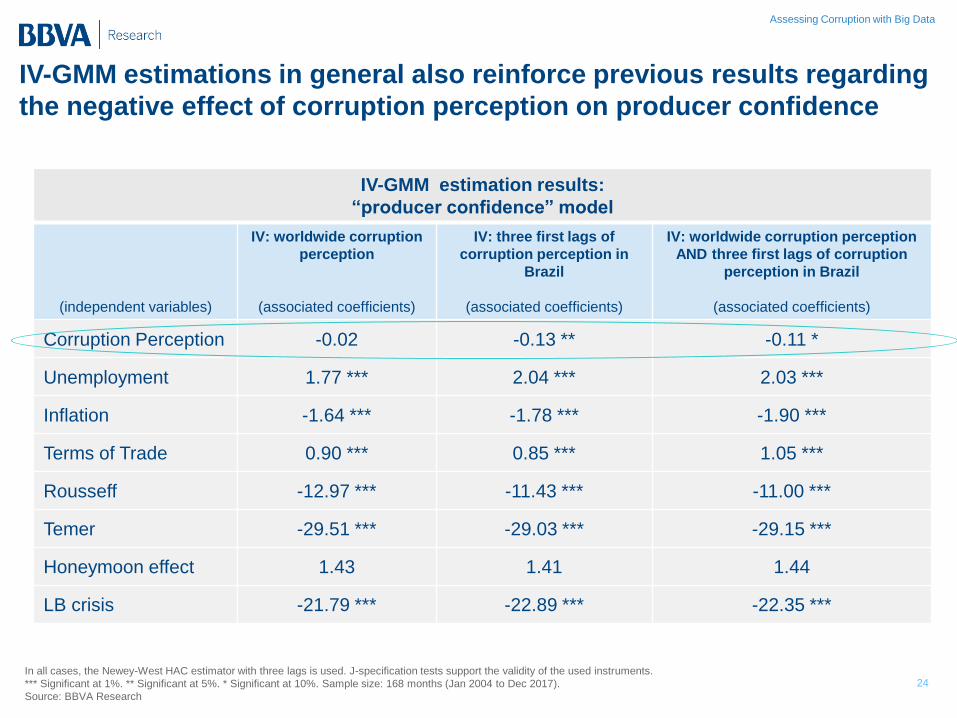
IV-GMM estimations in general also reinforce previous results regarding
the negative effect of corruption perception on producer confidence
24
IV-GMM estimation results:
“producer confidence” model
(independent variables)
IV: worldwide corruption
perception
(associated coefficients)
IV: three first lags of
corruption perception in
Brazil
(associated coefficients)
IV: worldwide corruption perception
AND three first lags of corruption
perception in Brazil
(associated coefficients)
Corruption Perception -0.02 -0.13 ** -0.11 *
Unemployment 1.77 *** 2.04 *** 2.03 ***
Inflation -1.64 *** -1.78 *** -1.90 ***
Terms of Trade 0.90 *** 0.85 *** 1.05 ***
Rousseff -12.97 *** -11.43 *** -11.00 ***
Temer -29.51 *** -29.03 *** -29.15 ***
Honeymoon effect 1.43 1.41 1.44
LB crisis -21.79 *** -22.89 *** -22.35 ***
In all cases, the Newey-West HAC estimator with three lags is used. J-specification tests support the validity of the used instruments.
*** Significant at 1%. ** Significant at 5%. * Significant at 10%. Sample size: 168 months (Jan 2004 to Dec 2017).
Source: BBVA Research

Assessing Corruption with Big Data
This report has been produced by the South America Unit
BBVA-Research Jorge Sicilia Serrano
Enestor Dos Santos
Macroeconomic analysis
Rafael Doménech
Global Economic Situations
Miguel Jiménez
Global Financial Markets
Sonsoles Castillo
Long-Term Global Modelling and Analysis
Julián Cubero
Innovation and Processes
Oscar de las Peñas
Financial Systems and Regulation
Santiago Fernández de Lis
Digital Regulation and Trends
Álvaro Martín
Regulation
Ana Rubio
Financial Systems
Olga Cerqueira
Spain and Portugal
Miguel Cardoso
United States
Nathaniel Karp
Mexico
Carlos Serrano
Turkey, China and Big Data
Álvaro Ortiz
Turkey
Álvaro Ortiz
Asia
Le Xia
South America
Juan Manuel Ruiz
Argentina
Gloria Sorensen
Chile
Jorge Selaive
Colombia
Juana Téllez
Peru
Hugo Perea
Venezuela
Julio Pineda