Assessing Connectivity in UK’s Air Transport Market · Assessing Connectivity in UK’s Air...
93
Prepared for Gatwick Airport Limited Prepared by InterVISTAS Consulting Ltd. 17 July 2013 Assessing Connectivity in UK’s Air Transport Market Issues in the debate on London air transport capacity FINAL REPORT
-
Upload
nguyendieu -
Category
Documents
-
view
221 -
download
1
Transcript of Assessing Connectivity in UK’s Air Transport Market · Assessing Connectivity in UK’s Air...

Prepared for Gatwick Airport Limited
Prepared by InterVISTAS Consulting Ltd.
17 July 2013
Assessing Connectivity
in UK’s Air Transport Market
Issues in the debate on London air transport capacity
FINAL REPORT

Assessing Connectivity in the UK’s Air Transport Market
17 July 2013
i
Contents
Executive Summary................................................................................................................. iii
1 Introduction: The Airports Commission Issue of Connectivity .............................. 1
2 The London Aviation Market ...................................................................................... 4
2.1 The London Airports ..................................................................................................... 4 2.2 The Combined London Aviation Market and Comparators .......................................... 6 2.3 The Near-London Catchment Area .............................................................................. 8 2.4 British Airways’ Use of BMI’s Slots:
What Does it Say about Heathrow’s Connectivity Gap? ............................................ 10 2.5 Number of Non-stop Destinations:
Is there a Domestic UK Connectivity Gap for the London Airports? ........................... 12 2.6 Sources of Connections at Heathrow: The Vast Majority are Within-Alliance ............ 15 2.7 Key Conclusions on the London Air Market ............................................................... 17
3 Comparison of London to Other Markets with Multiple Airports .......................... 18
3.1 There are Many Cases of Major Cities With Multiple Gateway or Hub Airports ......... 18 3.2 Airlines Find it Effective to Have Multiple Hub Operations,
Even When These Airports are Close to Each Other ................................................. 24 3.3 Proximate Gateway Airports Can Coexist .................................................................. 25 3.4 Case Study: The Emergence of Multiple Gateway Airports at Moscow ..................... 26 3.5 Key Conclusions on Multiple Airport Cities ................................................................. 29
4 Connectivity: Why it Matters and How it Should be Measured ............................. 30
4.1 Connectivity is not the Same as Connecting Traffic. .................................................. 30 4.2 Connectivity and the Economy ................................................................................... 31 4.3 Defining and Measuring Connectivity ......................................................................... 35 4.4 Connectivity and Affordability ..................................................................................... 39 4.5 Key Conclusions on Connectivity and Why it Matters ................................................ 39
5 Limits to the Returns from Increased Connectivity at a Single Airport ................ 41
5.1 Introduction: The Benefits of Flight Connectivity at a Single Airport are not Limitless................................................................................... 41
5.2 The S-Curve Effect: Diminishing Returns to Flight Frequency ................................... 42 5.3 Diminishing Returns to Destinations in a Region ....................................................... 43 5.4 Supply Side Limits to Connectivity: Why Mega-Hubs in
West London or the Thames Estuary are not the Answer .......................................... 44 5.5 Key Conclusions on Diminishing Returns to the
Value of Connectivity at a Single Airport .................................................................... 45
6 Ensuring Robustness in the Face of Dynamic Market Conditions ........................ 47
6.1 Airline Business Models are Evolving ........................................................................ 47 6.2 Evolution of the LCC Model........................................................................................ 48 6.3 Changing Alliances .................................................................................................... 51 6.4 Conclusions ................................................................................................................ 53

Assessing Connectivity in the UK’s Air Transport Market
17 July 2013
ii
7 A Demonstration of National Incremental Connectivity Benefits of Dual Gateway Airports: The Fallacy of One Hub or None ...................................... 54
7.1 Introduction ................................................................................................................ 54 7.2 Traffic Impacts of Alternative Capacity Options at Heathrow and Gatwick ................ 55 7.3 Implications for Connectivity....................................................................................... 58 7.4 Conclusions ................................................................................................................ 59
8 The Importance of Competition and the Price of Air Access in Connectivity ...... 61
8.1 Introduction ................................................................................................................ 61 8.2 The Dramatic Impact of Competition .......................................................................... 61 8.3 Airport Competition .................................................................................................... 64 8.4 Empirical Evidence on Airport Competition Dynamics ............................................... 65 8.5 Airport Competition in the London Market .................................................................. 68 8.6 The Airline Competition Link to Airport Competition ................................................... 70 8.7 Enhancing Competition in the London Market: The Case of Moscow ....................... 71 8.8 Conclusions Regarding Competition .......................................................................... 72
9 Overall Conclusions and Next Steps ....................................................................... 73
9.1 Next Steps .................................................................................................................. 76
Appendix A: Responding to the “One Hub or None” Claims .............................................. 77
Appendix B: List of Abbreviations ........................................................................................ 84
Appendix C: List of Airport Codes ........................................................................................ 85

Assessing Connectivity in the UK’s Air Transport Market
17 July 2013
iii
Executive Summary
Airports Commission. The Airports Commission (the “Commission”) is examining the need for additional UK airport capacity. One of the key issues identified by the Commission is that of connectivity. In regards to connectivity, the Commission’s enquiry aims to address the following questions:
How should connectivity be defined? How does the aviation connectivity of the UK contributes to the economy of the country? What are the drivers of connectivity? How well connected is the UK to the world and how does it perform in comparison to other
European countries?
This study. InterVISTAS Consulting Ltd. was commissioned by Gatwick Airport Limited (GAL) to undertake a study of the issues around air connectivity and their implications for choices to be made by the Commission for the development of airport capacity in the London market. This report provides our findings on the issues. Key results of this study are summarised below.
The London air market. London is the largest international air market in the world, as measured by the total number of passengers or the number of international passengers. The combined passenger traffic at the five main London airports significantly exceeds that of any other city in the world (the next largest is New York, followed by Atlanta, Tokyo, Paris and Beijing). The combined total of the top three airports (Heathrow, Gatwick and Stansted) is still larger than New York. The vast majority of London’s traffic (approximately 87%) is origin-destination traffic.
Defining and measuring connectivity. Air transport connectivity is important for the UK economy. We emphasise that connectivity and connections mean different things. “Connectivity” is about UK access to the rest of the world. “Connections” deal with airlines’ supply side issues of flowing traffic in a network, including non-UK traffic. It is our view that there is no one single measure of connectivity and, rather, a number of alternatives should be considered. Connectivity measures should incorporate both supply-side (i.e., airline traffic and profit analysis of connections) and demand-side factors (linkages to world population, economic activity and trade and price of air services). When evaluating connectivity, analysis should not be confined only to air transport connections. Ground transport to London airports are also a means of connectivity. Southampton, for example, is not connected to any London airports by airline services, although it is connected by road and rail links, but is connected by air service to Amsterdam and Paris. This is not unlike the case of Rotterdam being connected to Heathrow (LHR) and London City (LCY) but not (by air) to Amsterdam. Similar examples exist for Paris CDG airport. The lack of air links to short haul domestic destinations well served by road and rail does not necessarily imply a connectivity gap to these communities for London airports.
London is the largest air market in the world with a small proportion of connecting traffic.

Assessing Connectivity in the UK’s Air Transport Market
17 July 2013
iv
Connectivity depends not merely on the number of cities and routes. The price of air services is of critical importance. Assessing connectivity should not be a matter of only counting routes and flight frequencies. The effectiveness of aviation access depends on the price of air service. Competition between airports and airlines is critical to achieving effective connectivity. Connectivity at high fares is of lower national value than
connectivity at competitive fares enabled by competition between airlines and airports. It is important that any additional airport infrastructure in London enhances rather than undermines the competitive dynamics of the UK aviation market. Competition will ensure route development best meets the needs of the market and fosters competitive pricing due to airport and airline competition. This can only be achieved by allowing other airports to compete on a level playing field with London’s dominant airport, Heathrow. Runway capacity decisions that merely strengthen a dominant carrier and its alliances, and a dominant airport, are not necessarily the best choice for achieving the maximum benefits from aviation connectivity.
Diminishing returns to connectivity at any single airport. While global connectivity is very important to the nation, there are diminishing returns to the connectivity benefits that can be achieved from any single airport. This is due to demand-side factors such as the S-curve effect of additional flight frequency and to the diminishing marginal connectivity impact of adding new routes to a particular region. It is also due to supply-side factors around the logistics of operating a single airport. As airports expand, taxi times increase and airline operating costs and capital productivity decline. As well, an airport’s mission can limit its practical capacity. Intercontinental gateways such as Dubai can achieve very high passenger volumes for a given runway configuration by focussing largely on ultra-high capacity aircraft. But such aircraft are not suitable for short to medium haul markets. An airport whose mission includes both intercontinental and regional access will be more limited in the passenger volumes that can be achieved within a given runway configuration.
The UK’s airport capacity solution needs to be robust to the evolution of the aviation industry. The aviation industry is constantly changing and evolving. Deciding London’s future airport capacity based on the current status quo risks limiting London’s future traffic development and the benefits to consumers. In this report, a number of emerging industry trends have been identified such as long haul Low Cost Carriers (LCCs), partnerships between LCCs and network carriers, and the constant evolution of airline alliances. All of these trends could substantially change the aviation industry structure and future infrastructure requirements. Furthermore, there may be other unanticipated trends and other events that will also impact on the aviation industry.
The important consideration is that the chosen airport infrastructure solution is one that is robust and flexible to future changes in the industry and in aviation demand. This robustness comes about not just from increased capacity but also by fostering competition. These competition dynamics will lead to competitive pricing, will spur innovation and will ensure that
Competition between airports and airlines is critical to achieving effective connectivity.
Runway capacity decisions that merely strengthen a dominant carrier and its alliances, and a dominant airport, are not necessarily the best choice for achieving the maximum benefits from aviation connectivity.
Deciding London’s future airport capacity based on the current status quo risks limiting London’s future traffic development and the benefits to consumers.

Assessing Connectivity in the UK’s Air Transport Market
17 July 2013
v
London’s airports can respond to changing market conditions, maximising benefits for consumers and ultimately the wider society.
Other major cities support multiple, competing gateway airports – so can London.1 Some have argued that it is not possible to have two or more competing gateway airports in a given region. We disagree. First, we document that several other large global markets such as New York and Tokyo that support competing global gateway or hub airports. Second, using airline route and network analysis tools, the report demonstrates that it is possible to achieve similar connectivity benefits with a two gateway airport system in a market the size of London than with traffic concentrated at a single airport. Furthermore, an additional runway at Gatwick also has the substantial benefit of enhancing the competition dynamics of the London market.
1 In this report, we use the term gateway airport to refer to large airports (over 20 million passengers per annum) with considerable international connectivity, which serve predominately origin-destination (O/D) traffic, although with some connecting traffic. This is different to a hub airport where connecting traffic is a far greater share of passenger traffic. For example, Atlanta and Dubai are hub airports whereas Heathrow and Gatwick are gateway airports.
It is possible to achieve connectivity benefits with a two gateway system with the substantial benefit of enhancing airport competition.
Assessing Connectivity in the UK’s Air Transport Market
17 July 2013
1
1 Introduction: The Airports Commission Issue of Connectivity
The Airports Commission (the “Commission”) is examining the need for additional UK airport capacity and will be developing recommendations to government as to how this can be met in the short, medium and long term. One of the key issues identified by the Commission is that of connectivity. In regards to connectivity, the Commission’s enquiry aims to address the following questions:
How should connectivity be defined? How does the aviation connectivity of the UK contributes to the economy of the country? What are the drivers of connectivity? How well connected is the UK to the world and how does it perform in comparison to other
European countries?
InterVISTAS Consulting Ltd. was commissioned by Gatwick Airport Limited (GAL) to undertake a study of the issues around air connectivity and their implications for choices to be made by the Commission for the development of airport capacity in the London market. This report provides our findings on the issues. Our report is also accompanied by a separate report modelling alternative scenarios for capacity development at Heathrow and Gatwick (London Airport Capacity QSI Scenario Analysis). Key results of this study are summarised here.
The report covers the following topics:
Chapter 2 provides an overview of the London commercial air transport market. It demonstrates that London is the largest international air market in the world, as measured by the number of passengers, most of it origin/destination (O/D) traffic, and one of the top airports in the world as measured by the number of destinations connected. This chapter also examines British Airways use of BMI’s slot which indicates that the need for connection to BRIC countries may be overstated. Analysis is also provided which shows that much of the connecting activity at Heathrow is within-alliance, and that rather than being a big neutral connecting gateway, Heathrow is a dominated hub that largely facilitates connections within the dominant carrier’s alliance.
Chapter 2 also examines domestic connectivity and need to consider ground transport to London airports as part of this connectivity. Southampton, for example, is not connected to any London airports by airline services, although it is connected by road and rail links, but is connected by air service to Amsterdam and Paris. This is not unlike the case of Rotterdam being connected to Heathrow (LHR) and London City (LCY) but not to Amsterdam (by air). Similarly, Dinard, France is connected by air to London but not to Paris. The lack of air links to short haul domestic destinations well served by road and rail does not necessarily imply a connectivity gap to these communities for London airports.
Chapter 3 examines other cities with multiple gateway airport systems, such as New York, Tokyo and Moscow. These examples illustrate why a similar situation could develop in London and also shows the dynamics process by which multiplier airports can develop.

Assessing Connectivity in the UK’s Air Transport Market
17 July 2013
2
Chapter 4 discusses why air connectivity is important for the UK economy and different ways to measure it. We emphasise that connectivity and connections mean different things. “Connectivity” is about UK access to the rest of the world. “Connections” deal with airlines supply side issues of flowing traffic in a network, including non-UK traffic. It is our view that there is no one single measure of connectivity and, rather, that a number of alternatives should be considered. Connectivity measures should incorporate both supply-side (i.e., airline traffic and profit analysis of connections) and demand-side factors (linkages to world population, economic activity and trade). Finally, the chapter points out that assessing connectivity should not be a matter of only counting routes and flight frequencies. Effectiveness of aviation access depends on the price of air service. Competition between airports and airlines is critical to achieving effective connectivity.
Chapter 5 argues that while global connectivity is very important to the nation, there are diminishing returns to the connectivity benefits that can be achieved from any single airport. This is due to demand-side factors such as the S-curve effect of additional flight frequency and to the diminishing marginal connectivity impact of adding new routes to a particular region. It is also due to supply-side factors around the logistics of operating a single airport. As airports expand, taxi times increase and airline operating costs and capital productivity decline. The chapter also discusses why an airport’s mission can limit its practical capacity. Intercontinental gateways such as Dubai can achieve very high passenger volumes for a given runway configuration by focussing largely on ultra-high capacity aircraft. But such aircraft are not suitable for short to medium haul markets. An airport whose mission includes both intercontinental and regional access will be more limited in the passenger volumes that can be achieved within a given runway configuration.
Chapter 6 discusses emerging trends in the aviation industry which have implications for the development of airport capacity. These include the development of low cost long-haul, connections between low cost carriers and network carriers and the constant flux in airline alliances and partnerships. The key message from this chapter is the aviation industry is constantly changing and evolving. Deciding London’s future airport capacity based on the current status quo risks limiting London’s future traffic development and the benefits to consumers. Consideration has to be given to airport capacity solutions that are robust and flexible to future changes in the industry and aviation demand.
Chapter 7 provides an analytical basis for the arguments in Chapters 5 and 6. Some have argued that it is not possible to have two or more competing airline hub operations in a given region. We demonstrate that it is possible to achieve similar connectivity benefits with a two gateway airport system in a market the size of London than with capacity largely concentrated at a single airport. Our discussion uses the results from a network modelling exercise documented in a separate report (London Airport Capacity QSI Scenario Analysis).
Chapter 8 returns to the issue of the price of air services as a critical factor in connectivity. It discusses the importance of ensuring that any additional airport infrastructure in London enhances rather than undermines the competitive dynamics of the UK aviation market. Competition will ensure route development best meets the needs of the market and fosters competitive pricing due to airport and airline competition. This can only be achieved by allowing other airports to compete on a level playing field with London’s dominant airport, Heathrow. Runway capacity decisions that merely strengthen a dominant carrier and its alliance, and a dominant airport, are not necessarily the best choice for achieving the maximum benefits from aviation connectivity.

Assessing Connectivity in the UK’s Air Transport Market
17 July 2013
3
Chapter 9 concludes the evidence in this report. It strongly supports the case for runway capacity expansion at Gatwick, ensuring that the UK has effective and affordable connectivity.
Finally, the report includes an appendix which addresses some of the issues raised in a report titled One Hub or None: the case for a single UK hub airport released by Heathrow Airport in November 2012. Many of the issues are discussed in our main report. The appendix pulls together a concise point-by-point response.

Assessing Connectivity in the UK’s Air Transport Market
17 July 2013
4
2 The London Aviation Market
2.1 The London Airports
London is the largest aviation market in the world based on the number of passengers. International and domestic passengers travelling to, from or via London use a system of airports consisting of six main airports that offer scheduled passenger service. The six airports in the London area include Heathrow (LHR), Gatwick (LGW), Stansted (STN), Luton (LTN), London City (LCY) and Southend (SEN). On a combined basis, the six airports handle roughly 135 million passengers per year. All six airports offer domestic and international passenger service. Figure 2-1 provides data on passengers and aircraft movements for the main London airports.
Figure 2-1 Summary statistics for the London airports 2012
Source: UK Civil Aviation Authority data; InterVISTAS analysis.
2 Totals include scheduled and charter terminal passengers. Source: UK Civil Aviation Authority, “UK Airport Statistics: 2012 - Table 9.0 Terminal and Transit Passengers 2012”, p. 1.
3 Totals include scheduled and charter aircraft movements. Source: UK Civil Aviation Authority, “UK Airport Statistics: 2012 - Table 3.1 Aircraft Movements 2012”, p. 1.
4 Luton, London City and Southend have relatively short runways.
Airport Annual number of
passengers
(millions)2
Annual number of
aircraft movements3
Number of passengers per
aircraft movement
Number of runways
Heathrow 70.0 471,791 148 2 (independent)
Gatwick 34.2 240,494 142 1
Stansted 17.5 132,920 132 1
Luton 9.6 75,783 127 1
London City 3.0 69,902 43 1
Southend 0.6 8,086 74 1
Total 134.9 998,976 135 74

Assessing Connectivity in the UK’s Air Transport Market
17 July 2013
5
2.1.1 Heathrow
Heathrow ranked 3rd among world airports (behind Atlanta and Beijing) based on the total number of annual enplaned/deplaned passengers in 2011. In terms of international passengers, it is the busiest in the world, handling more international passengers than any other airport.
Heathrow is the largest airport in the London area with roughly 70 million annual passengers or 52% of total air passenger traffic in London based on 2012. It is the only airport in the London area which has two full-length runways. Heathrow is an international hub serving 150 non-stop destinations worldwide.5 Approximately a quarter (27%) of passengers at Heathrow are transferring between flights at the airport, which means that the vast majority of travellers are origin-destination passengers.
Heathrow currently operates at 98% capacity, as the annual capacity of the airport is limited to 480,000 flights. Currently, Heathrow has two independent full-length runways.
The airport is connected to central London via a rail link, which means passengers can get from Paddington Station to Heathrow in about 15 minutes. The airport is directly connected to the M4, with a nearby interchange to the M25. Its location in close proximity to the centre of a large metropolitan city also means that the airport has a high noise impact on surrounding communities. An expansion of the airport would increase noise exposure for the communities that currently fall within its noise foot print and may potentially expose new communities that were previously unaffected by airport operations to noise disturbance. Residents of North-West London and North London would likely be among the new communities that could experience increased noise levels, if a third runway is built at Heathrow. Residents of West London are currently exposed to noise from the airport; however, an expansion of Heathrow would dramatically increase the level of noise exposure for those communities.
2.1.2 Gatwick
Gatwick ranks 37th among world airports based on the number of passengers transported annually. Gatwick is the second largest airport in the London area, offering both domestic and international service and accounting for 25% of London’s overall passenger traffic. In December 2009, Gatwick was sold by the British Airports Authority (BAA) to Global Infrastructure Partners as a result of a divestiture order by the UK Competition Commission which compelled BAA to sell three of its seven airports (Gatwick, Edinburgh and Stansted) in order to enhance competition between airports.
Gatwick primarily offers point-to-point service (about 8% of passenger traffic at Gatwick are transfers). Unlike Heathrow, Gatwick also serves low cost carriers (LCCs) and is a major base for easyJet, Europe’s second largest LCC. Survey data collected by BAA and the UK Civil Aviation Authority indicates that Gatwick is the most popular airport substitute for Heathrow, followed by Stansted and Luton. Gatwick has scheduled intercontinental service to the United States, China, Russia, the Caribbean, Dubai, Indonesia, Iraq, Turkey and Vietnam.
5 Official Airline Guide (OAG) data for 2012.

Assessing Connectivity in the UK’s Air Transport Market
17 July 2013
6
Unlike Heathrow whose flight path crosses highly populated central London, Gatwick is located in a less densely populated area, 47.5 km south of Central London. The airport has a much lower noise impact on surrounding communities and its expansion would only marginally increase such impact.
Gatwick is connected by rail to Central London, with 30-minute journey times. Gatwick is directly served by the M23 with nearby interchange with the M25.
2.1.3 Stansted
Stansted is the third largest airport in the London area, accounting for 13% of London’s total traffic or about 18 million passengers annually. In January 2013, Stansted was sold by Heathrow Airport Holdings (formerly BAA) to Manchester Airports Group as part of the UK Competition Commission’s divestiture order issued in 2009.
Stansted's is a base for the largest European low cost carrier, Ryanair. Currently, the airport does not have scheduled air service outside of Europe. Stansted has rail service to Central London, with journey times of 45-60 minutes. It is located close to the M11.
2.1.4 Luton
Luton is the fourth largest airport in the London area with a 7% share of London's total passenger traffic. Luton offers both domestic and international passenger service, primarily focusing on short- and medium-haul service. The airport is used as a base by low-cost carriers Ryanair and easyJet.
2.1.5 London City and Southend
London City and Southend collectively account for 3% of London's total passenger traffic. The two airports offer regional scheduled passenger service, primarily to destinations in continental Europe. British Airways also operates an all-business Airbus 318 service from London City to New York. London City is served by the Docklands Light Rail line.
Southend is a base for easyJet which offers service to destinations in Europe.
2.2 The Combined London Aviation Market and Comparators
Based on passenger volumes, London is the largest aviation market in the word. According to Airports Council International (ACI), in 2011 London handled roughly 133 million passengers, comprising about 2.5% of global passenger traffic. The next largest city airport markets are New York (106 million passengers), Tokyo (91 million), Paris (88 million) and Beijing (81 million). Ninth ranked Dallas, with two airports, two hubs and two large hub carriers, has less than half the passenger traffic of London. London is one of only two cities in the world which handle more than 100 million passengers. New York is the other, with 78% of the total traffic of London. London’s top three airports (Heathrow, Gatwick and Stansted) handled more traffic that than the New York airports (122 million).

Assessing Connectivity in the UK’s Air Transport Market
17 July 2013
7
London’s large size is even more impressive considering that only 13% of this traffic is connecting traffic.6 The vast majority of London’s passenger traffic (approximately 87%) is origin-destination traffic.
Figure 2-2 depicts total traffic for major multi-airport markets and select single-airport markets.
Figure 2-2 Total Passenger Traffic for Select Multi-airport and Single-airport Cities 20117
Source: ACI, 2011 World Airport Traffic Report.
6 Source: PaxIS data.
7 Note that the data in Figure 2-2 is for 2011, while the data in Figure 2-1 is for 2012.
0
20
40
60
80
100
120
140
Lo
nd
on
Ne
w Y
ork
To
kyo
Pa
ris
Be
ijin
g
Lo
s A
ng
ele
s
Sh
an
gh
ai
Da
lla
s
Sa
n F
ran
cis
co
Se
ou
l
Ho
us
ton
Os
ak
a
Atl
an
ta
Jak
art
a
Du
ba
i
Am
ste
rdam
Ma
dri
d
Pa
ss
en
ge
rs (
mil
lio
ns
)
52%LHR
25%LGW
14%STN
7%LTN
2%LCY
Single-Airport MarketsMulti-Airport Markets
45%JFK
32%EWR
23%LGA
69%HND
31%NRT
69%CDG
31%ORY
97%PEK
3%NAY
82%LAX
1%SNA
6%ONT
56%PVG
44%SHA
88%DFW
12%DAL
70%SFO
16%OAK
14%SJC
66%ICN
34%GMP
80%IAH
20%HOU
51%KIX
49%ITM

Assessing Connectivity in the UK’s Air Transport Market
17 July 2013
8
2.3 The Near-London Catchment Area
The UK has a compact territory, which in turn means that a large proportion of its population lives within driving or rail transportation range from the airports located in the London area. Figure 2-3 shows the population in various driving ranges from the London airports.
Figure 2-3 Driving Range and UK Population Access to LHR and LGW 2004
Driving Range
LHR
(% of UK pop.)
LGW
(% of UK pop.)
2 hours 25 million (42%)
20 million (33%)
3 hours 36 million (60%)
32 million (54%)
4 hours 50 million (84%)
47 million (79%)
Source: Microsoft MapPoint, based on 2004 population data.
Gatwick and Heathrow have similar catchment areas based on different driving ranges. Approximately 36 million people, or 60% of the UK population, live within a three-hour driving range from Heathrow, and only a slightly smaller amount (32 million) is within three-hours driving time of Gatwick. Stansted, Luton and London City have similar catchment areas for Heathrow and Gatwick. Even though Gatwick is located to the south of London’s city centre, its driving time catchment area is similar to that of Heathrow.
Figure 2-4 illustrates different catchment areas for five London airports (Heathrow, Gatwick, Stansted, Luton and London City). The black line delineates a two-hour driving range, the bright blue line marks a three-hour driving range and the light blue line indicates a four-hour driving range from a given airport.
As can be seen, the London airports provide good connectivity/access to a wide range of markets in the UK via highway (bus and car) and rail connections. In fact, when determining connectivity of a given airport one must be careful not to restrict the assessment of connectivity only to air routes. We return to this topic in Section 3.

Assessing Connectivity in the UK’s Air Transport Market
17 July 2013
9
Figure 2-4 Geographic Catchment Areas for Select Airports in the London Area (2-hour, 3-hour and 4-hour driving range) 2004
Heathrow Gatwick
Stansted Luton
London City
Source: Microsoft MapPoint, based on 2004 population data.
Assessing Connectivity in the UK’s Air Transport Market
17 July 2013
10
2.4 British Airways’ Use of BMI’s Slots: What Does it Say about Heathrow’s Connectivity Gap?
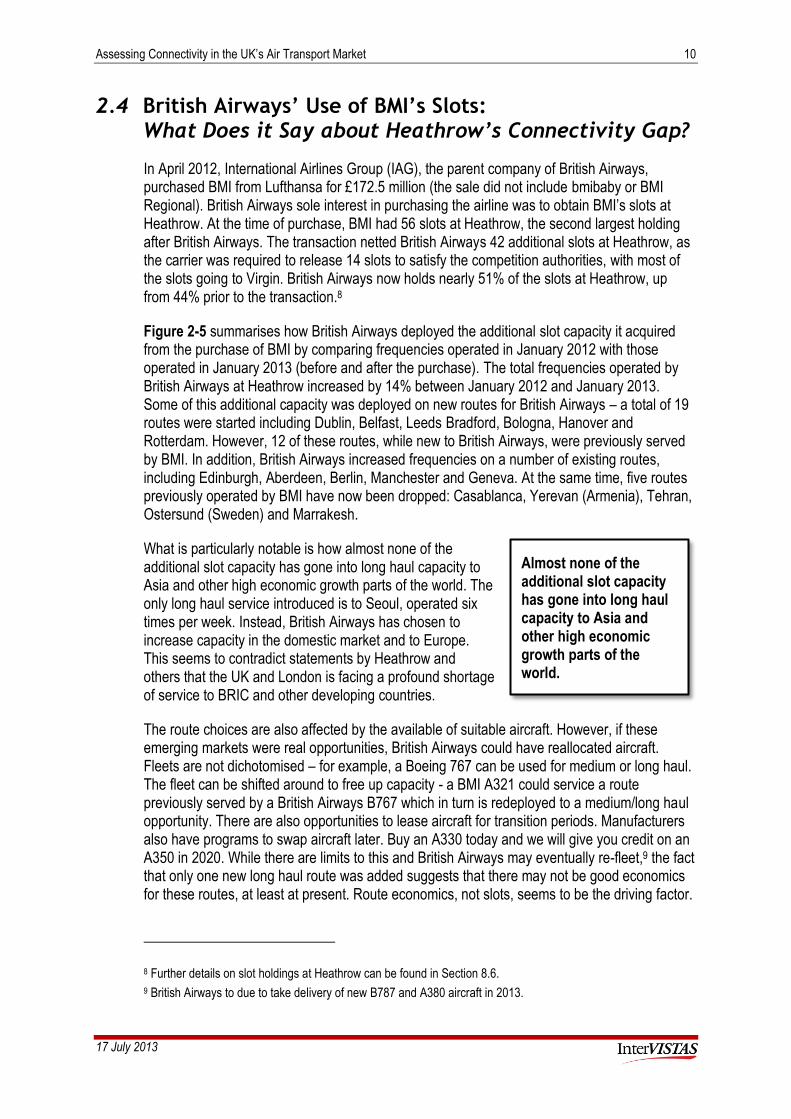
In April 2012, International Airlines Group (IAG), the parent company of British Airways, purchased BMI from Lufthansa for £172.5 million (the sale did not include bmibaby or BMI Regional). British Airways sole interest in purchasing the airline was to obtain BMI’s slots at Heathrow. At the time of purchase, BMI had 56 slots at Heathrow, the second largest holding after British Airways. The transaction netted British Airways 42 additional slots at Heathrow, as the carrier was required to release 14 slots to satisfy the competition authorities, with most of the slots going to Virgin. British Airways now holds nearly 51% of the slots at Heathrow, up from 44% prior to the transaction.8
Figure 2-5 summarises how British Airways deployed the additional slot capacity it acquired from the purchase of BMI by comparing frequencies operated in January 2012 with those operated in January 2013 (before and after the purchase). The total frequencies operated by British Airways at Heathrow increased by 14% between January 2012 and January 2013. Some of this additional capacity was deployed on new routes for British Airways – a total of 19 routes were started including Dublin, Belfast, Leeds Bradford, Bologna, Hanover and Rotterdam. However, 12 of these routes, while new to British Airways, were previously served by BMI. In addition, British Airways increased frequencies on a number of existing routes, including Edinburgh, Aberdeen, Berlin, Manchester and Geneva. At the same time, five routes previously operated by BMI have now been dropped: Casablanca, Yerevan (Armenia), Tehran, Ostersund (Sweden) and Marrakesh.
What is particularly notable is how almost none of the additional slot capacity has gone into long haul capacity to Asia and other high economic growth parts of the world. The only long haul service introduced is to Seoul, operated six times per week. Instead, British Airways has chosen to increase capacity in the domestic market and to Europe. This seems to contradict statements by Heathrow and others that the UK and London is facing a profound shortage of service to BRIC and other developing countries.
The route choices are also affected by the available of suitable aircraft. However, if these emerging markets were real opportunities, British Airways could have reallocated aircraft. Fleets are not dichotomised – for example, a Boeing 767 can be used for medium or long haul. The fleet can be shifted around to free up capacity - a BMI A321 could service a route previously served by a British Airways B767 which in turn is redeployed to a medium/long haul opportunity. There are also opportunities to lease aircraft for transition periods. Manufacturers also have programs to swap aircraft later. Buy an A330 today and we will give you credit on an A350 in 2020. While there are limits to this and British Airways may eventually re-fleet,9 the fact that only one new long haul route was added suggests that there may not be good economics for these routes, at least at present. Route economics, not slots, seems to be the driving factor.
8 Further details on slot holdings at Heathrow can be found in Section 8.6.
9 British Airways to due to take delivery of new B787 and A380 aircraft in 2013.
Almost none of the additional slot capacity has gone into long haul capacity to Asia and other high economic growth parts of the world.
Assessing Connectivity in the UK’s Air Transport Market
17 July 2013
11
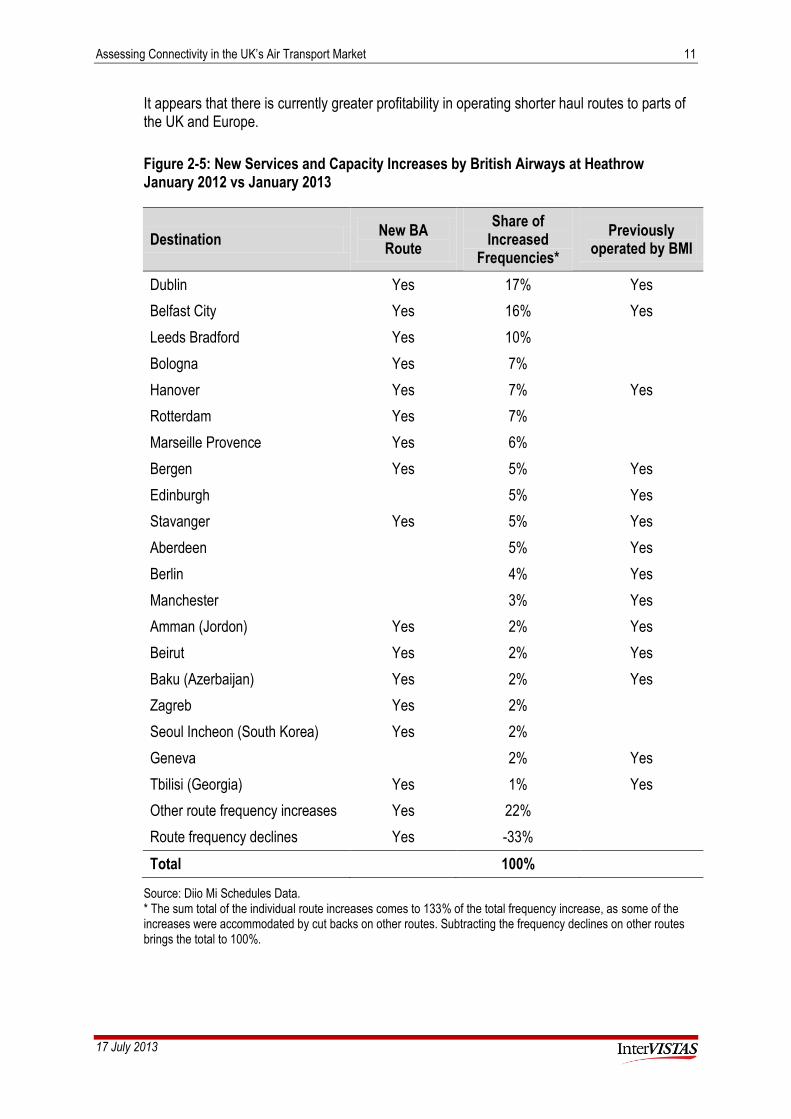
It appears that there is currently greater profitability in operating shorter haul routes to parts of the UK and Europe.
Figure 2-5: New Services and Capacity Increases by British Airways at Heathrow January 2012 vs January 2013
Destination New BA Route
Share of Increased
Frequencies*
Previously operated by BMI
Dublin Yes 17% Yes
Belfast City Yes 16% Yes
Leeds Bradford Yes 10%
Bologna Yes 7%
Hanover Yes 7% Yes
Rotterdam Yes 7%
Marseille Provence Yes 6%
Bergen Yes 5% Yes
Edinburgh
5% Yes
Stavanger Yes 5% Yes
Aberdeen
5% Yes
Berlin
4% Yes
Manchester
3% Yes
Amman (Jordon) Yes 2% Yes
Beirut Yes 2% Yes
Baku (Azerbaijan) Yes 2% Yes
Zagreb Yes 2%
Seoul Incheon (South Korea) Yes 2%
Geneva
2% Yes
Tbilisi (Georgia) Yes 1% Yes
Other route frequency increases Yes 22%
Route frequency declines Yes -33%
Total 100%
Source: Diio Mi Schedules Data. * The sum total of the individual route increases comes to 133% of the total frequency increase, as some of the increases were accommodated by cut backs on other routes. Subtracting the frequency declines on other routes brings the total to 100%.

Assessing Connectivity in the UK’s Air Transport Market
17 July 2013
12
Thus, the picture of connectivity is more complex than some have made out. While undoubtedly, over time, there will be strongly growing demand for service to Asia, South America and elsewhere, there is also a need to accommodate demand for travel to many other parts of the world. Developing airport capacity at the London airports is not simply a matter of enabling a handful of routes to BRIC countries but rather allowing a complex set of connectivity needs to be met. This requires not just capacity but also effective competition conditions ensuring that airlines and airports are fully and cost-effectively responsive to market demand.
2.5 Number of Non-stop Destinations: Is there a Domestic UK Connectivity Gap for the London Airports?
Figure 2-5 provides a summary of non-stop destinations served by the airports of a number of select international airports. Based on the number of non-stop destinations served, Frankfurt ranks number one with 292 destinations, followed by Amsterdam with 261 destinations and Paris with 249 destinations. Gatwick ranks fourth with 213 destinations ahead of Heathrow with 174 destinations.10
Figure 2-5 Number of Non-stop Destinations Served by Select Major Airports 2012
Source: Diio Mi Schedules Data.
10 Gatwick serves more routes than any other UK airport. The route numbers for all airports includes all scheduled and charter air services operated with 10 or more outbound frequencies in 2012.
Domestic IntercontinentalOther
InternationalGrand Total
FRA Frankfurt Germany Europe 16 141 135 292
AMS Amsterdam Netherlands Europe 0 153 108 261
CDG Paris Frace Europe 17 100 132 249
LGW London Gatwick United Kingdom Europe 12 141 60 213
PEK Beijing China Asia 114 48 48 210
DXB Dubai UAE Middle East 1 44 149 194
JFK New York United States North America 71 8 100 179
LHR London Heathrow United Kingdom Europe 8 68 98 174
EWR New York/Newark United States North America 87 16 65 168
LAX Los Angeles United States North America 99 24 39 162
PVG Shanghai (Pudong) China Asia 80 50 31 161
ICN Incheon South Korea Asia 3 101 42 146
MIA Miami United States North America 54 6 77 137
NRT Narita Japan Asia 13 41 50 104
SHA Shanghai (Hongqiao) China Asia 72 5 0 77
Number of Non-Stop Destinations in 2012Origin
AirportCity Name Origin Country Continent
Developing airport capacity at the London airports is not simply a matter of enabling a handful of routes to BRIC countries but rather allowing a complex set of connectivity needs to be met.

Assessing Connectivity in the UK’s Air Transport Market
17 July 2013
13
Figure 2-5 also shows the domestic routes operated from each airport. As can be seen, Heathrow operates fewer domestic routes than Gatwick and fewer than Frankfurt and Paris. This has led to concerns that domestic connectivity is being squeezed out due to lack of capacity in London. There may be an element of truth to this. Short-haul domestic routes operated by smaller aircraft are likely to be less profitable than long haul routes operated by wide body aircraft.
However, it is interesting to note that both British Airways and Virgin have chosen to expand domestic capacity following British Airways’ acquisition of BMI (see the previous section). It appears that rather long haul capacity squeezing out domestic capacity, domestic traffic is being increasingly accommodated within the existing slot constraints at Heathrow.
When considering domestic connectivity, the approach of merely counting the number of non-stop routes, however, disregards the role of ground transport access to London airport connectivity. Road and rail connections provide connectivity and for many travellers this may potentially be better connectivity to the world (via a non-stop flight from a London airport in a low cost seat) than a connecting service via AMS or CDG in a small aircraft, with a long connection and at a higher price.
A resident of Southampton, UK, travelling to Beijing, China, may find it more attractive to drive to a London airport and catch a direct flight from, for example, Gatwick to Beijing rather than flying from Southampton to CDG or AMS in a small aircraft then making a connection to Beijing. Under the first option (drive to a London airport), it would take the traveller approximately 2 hours to reach Gatwick by car or train and 1 hour of waiting time at the airport (Gatwick) before the traveller can catch a direct flight to Beijing. Under the second option (fly to and connect at AMS or CDG), the traveller would spend 30 minutes driving to the airport in Southampton, 1 hour at that airport, another 1 hour to reach CDG or AMS by air, and an additional 1 hour 30 minutes of connection time before the traveller can embark on a direct flight to Beijing. Thus, other things being equal, ground access to a London airport can be as good or even a better alternative to a connecting flight via Paris or Amsterdam (3 hours versus 3.5 hours before the traveller can catch a direct flight to China). The important point being made is that the lack of a non-stop flight from Southampton to a London airport does not necessarily mean that there is a connectivity gap for the London airports.
Another way to look at this issue is from an airline route planner’s point of view. The Quality of Service Index (QSI) is widely used in the airline industry for assessing the relative quality of different service options. For example, a connecting flight will show a lower QSI value compared to a non-stop flight. The QSI values are based on analysis of historical data. The QSI methodology provides a framework for quantifying and comparing qualitative aspects of air travel – such as the quality or convenience of service.11 In doing so, QSI aims to quantify consumer behaviour by quantifying and ranking the relative attractiveness of different service options.
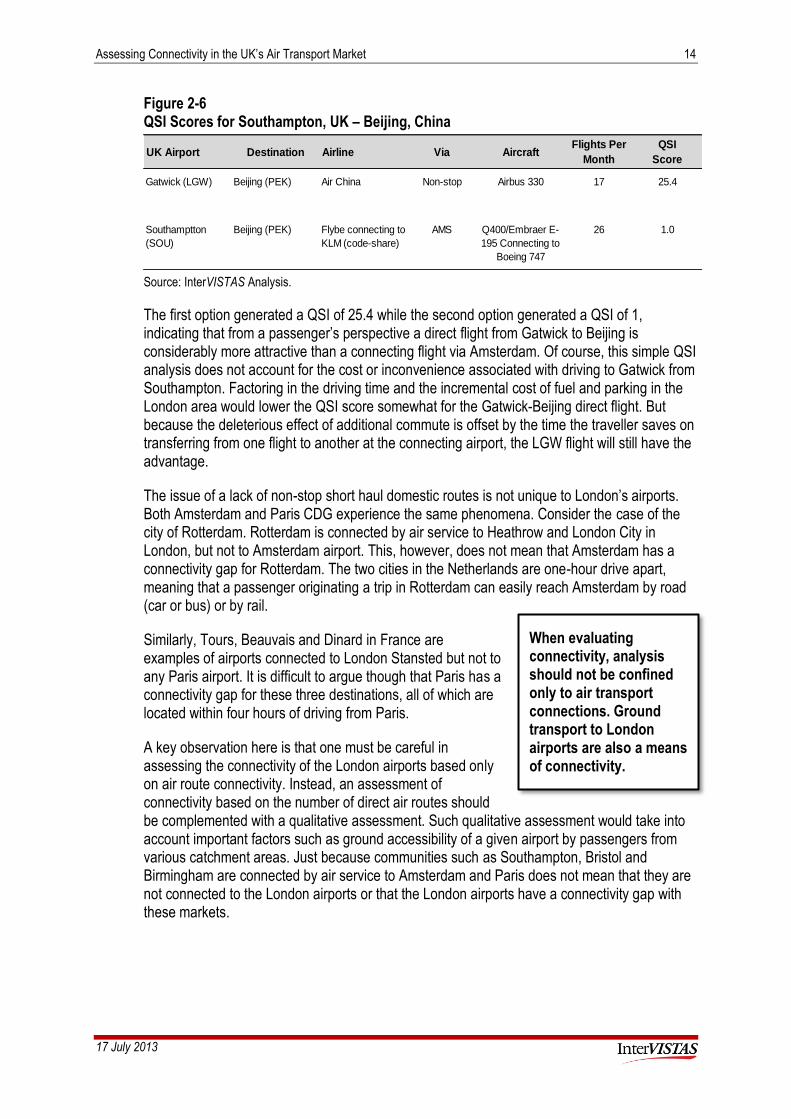
Figure 2-6 below provides an example of the QSI scores for two travel options from Southampton, UK, to Beijing, China: (1) a direct flight from Gatwick to Beijing, assuming the passenger would use ground transportation to access Gatwick, and (2) a connecting flight from Southampton to Beijing via Amsterdam.
11 The QSI methodology is discussed in more detail in the InterVISTAS report London Airport Capacity QSI Scenario Analysis.
Assessing Connectivity in the UK’s Air Transport Market
17 July 2013
14
Figure 2-6 QSI Scores for Southampton, UK – Beijing, China
Source: InterVISTAS Analysis.
The first option generated a QSI of 25.4 while the second option generated a QSI of 1, indicating that from a passenger’s perspective a direct flight from Gatwick to Beijing is considerably more attractive than a connecting flight via Amsterdam. Of course, this simple QSI analysis does not account for the cost or inconvenience associated with driving to Gatwick from Southampton. Factoring in the driving time and the incremental cost of fuel and parking in the London area would lower the QSI score somewhat for the Gatwick-Beijing direct flight. But because the deleterious effect of additional commute is offset by the time the traveller saves on transferring from one flight to another at the connecting airport, the LGW flight will still have the advantage.
The issue of a lack of non-stop short haul domestic routes is not unique to London’s airports. Both Amsterdam and Paris CDG experience the same phenomena. Consider the case of the city of Rotterdam. Rotterdam is connected by air service to Heathrow and London City in London, but not to Amsterdam airport. This, however, does not mean that Amsterdam has a connectivity gap for Rotterdam. The two cities in the Netherlands are one-hour drive apart, meaning that a passenger originating a trip in Rotterdam can easily reach Amsterdam by road (car or bus) or by rail.
Similarly, Tours, Beauvais and Dinard in France are examples of airports connected to London Stansted but not to any Paris airport. It is difficult to argue though that Paris has a connectivity gap for these three destinations, all of which are located within four hours of driving from Paris.
A key observation here is that one must be careful in assessing the connectivity of the London airports based only on air route connectivity. Instead, an assessment of connectivity based on the number of direct air routes should be complemented with a qualitative assessment. Such qualitative assessment would take into account important factors such as ground accessibility of a given airport by passengers from various catchment areas. Just because communities such as Southampton, Bristol and Birmingham are connected by air service to Amsterdam and Paris does not mean that they are not connected to the London airports or that the London airports have a connectivity gap with these markets.
UK Airport Destination Airline Via AircraftFlights Per
Month
QSI
Score
Gatwick (LGW) Beijing (PEK) Air China Non-stop Airbus 330 17 25.4
Southamptton
(SOU)
Beijing (PEK) Flybe connecting to
KLM (code-share)
AMS Q400/Embraer E-
195 Connecting to
Boeing 747
26 1.0
When evaluating connectivity, analysis should not be confined only to air transport connections. Ground transport to London airports are also a means of connectivity.

Assessing Connectivity in the UK’s Air Transport Market
17 July 2013
15
2.6 Sources of Connections at Heathrow: The Vast Majority are Within-Alliance
Heathrow is dominated by one major carrier and its alliance partners. Figure 2-7 breaks down the types of passenger connections at Heathrow. The data shows that:
there were 19 million passengers making connections at Heathrow in 2012;
73% of these are connections between oneworld carriers.
This data is somewhat distorted, however, due to the acquisition of BMI by British Airways during 2012. To minimise this distortion, Figure 2-8 removes the 0.8 million connections to/from BMI. This results in the oneworld connection ratio to climb to 76%. An additional 6% of connections are within either the Star Alliance or the Skyteam alliance.
Thus, the vast majority of connections at Heathrow (82%) are within-alliance and most of those are for the oneworld alliance. Heathrow is not a big neutral connecting gateway. It is a dominated hub that largely facilitates connections within the dominant carrier’s alliance.
76% of connections at Heathrow are within oneworld.
82% of connections are within-alliance.

Assessing Connectivity in the UK’s Air Transport Market
17 July 2013
16
Figure 2-7 Sources of Connecting Traffic at Heathrow 2012
Connecting Airline Pair Passengers %
Oneworld - oneworld 13,934,492 73%
Non-aligned network - non-aligned network 1,140,276 6%
Non-aligned network - oneworld 1,045,808 5%
Star - Star 1,018,224 5%
Oneworld - Star 801,494 4%
Non-aligned network - Star 753,738 4%
Oneworld - SkyTeam 99,056 1%
SkyTeam - SkyTeam 92,784 0%
Non-aligned network - SkyTeam 79,550 0%
SkyTeam – Star 71,586 0%
Other 4,202 0%
Grand Total of LHR Connecting Traffic 19,041,210 100%
Source: DIIO FMg Database.
Figure 2-8 Sources of Connecting Traffic at Heathrow 2012 (BMI removed from data)
Connecting Airline Pair Passengers %
Oneworld - oneworld 13,934,492 76%
Non-aligned network - non-aligned network 1,018,224 6%
Non-aligned network - oneworld 893,984 5%
Star - Star 801,494 4%
Oneworld - Star 776,982 4%
Non-aligned network - Star 463,450 3%
Oneworld - SkyTeam 99,056 1%
SkyTeam - SkyTeam 92,784 1%
Non-aligned network - SkyTeam 71,586 0%
SkyTeam – Star 66,420 0%
Other 4,198 0%
Grand Total of LHR Connecting Traffic 18,222,670 100%
BMI (removed if either segment to/from LHR is BMI)
818,540 4%
Source: DIIO FMg Database.

Assessing Connectivity in the UK’s Air Transport Market
17 July 2013
17
2.7 Key Conclusions on the London Air Market
Several key conclusions about the London aviation market can be made:
London is the largest aviation market in the world based on the total number of passengers.
London is also the largest international aviation market in the world based on the number of international passengers.
Although Heathrow handles double the passenger traffic of Gatwick, the latter serves more destinations than Heathrow (213 vs 174).
The driving time catchment area sizes of the London airports are similar.
British Airways’ use of BMI’s slots indicates that the need for service to BRIC countries is mis-stated and that the need for air traffic development is far more complex.
The London airports provide global connectivity and air access to a large portion of the UK population via road and rail. Even though there are no non-stop flights from London airports to near-London communities such as Southampton, Birmingham, etc., that does not mean that there is a connectivity gap for the London airports. Roughly 60% of the UK population is within three hours driving time of the London airports, and 80% is within four hours.
o We see this at other airports. E.g., Rotterdam, which has airline service to London, is not connected by air service to Amsterdam airport, although it is via ground transportation. Similarly communities such as Beauvais Dinard and Tours France are connected to London but not to Paris by air service. They are connected by rail and road ground transport.
At Heathrow, 76% of passenger connections are between the oneworld alliance carriers. Heathrow is not a big neutral connecting gateway. It is a dominated hub that largely facilitates connections within the dominant carrier’s alliance.
Heathrow is not a big neutral connecting gateway. It is a dominated hub that largely facilitates connections within the dominant carrier’s alliance.

Assessing Connectivity in the UK’s Air Transport Market
17 July 2013
18
3 Comparison of London to Other Markets with Multiple Airports
3.1 There are Many Cases of Major Cities With Multiple Gateway or Hub Airports
This chapter demonstrates that there are many cities, many of which are smaller than London, which successfully support multiple gateway airports.
Figure 3-1 through Figure 3-3 provide maps of cities with multiple gateway or hub airports.12 The maps also indicate the market share of each carrier based on its annual capacity in 2011. For example, the largest carrier at New York JFK is Jet Blue with a 24% share of seat capacity at that airport, at LaGuardia it is Delta with 20% and at Newark it is United/Continental with 53%.
Dallas has two airports: Dallas-Fort Worth International (DFW) and Dallas Love Field (DAL). At DFW, the largest carrier (measured by seats flown) is American Airlines, with a 72% share of seats. The largest carrier at DAL is Southwest, with a 96% share. This example is one of an airport utilised by a legacy network carrier competing with an airport utilised by a low cost carrier.
Other examples exist of competing airports, each with legacy network carriers. A good example is New York, where United/Continental operates a global hub from Newark, while American, Delta and other carriers operate out of JFK.
Paris is an interesting example of a city with multiple airports, with the same hub carrier operating from both. Capacity is not constrained at Paris CDG, and thus the operation of multiple airports in the same city is a matter of business choice, not scarcity of airport capacity.
12 In this report, we use the term gateway airport to refer to large airports (over 20 million passengers per annum) with considerable international connectivity, which serve predominately origin-destination (O/D) traffic, although with some connecting traffic. This is different to a hub airport where connecting traffic is a far greater share of passenger traffic. For example, Atlanta and Dubai are hub airports whereas Heathrow and Gatwick are gateway airports.

Assessing Connectivity in the UK’s Air Transport Market
17 July 2013
19
Figure 3-1 Select Multi-airport Cities North America 2011
Source: InterVISTAS analysis based on DIIO 2011 data.

Assessing Connectivity in the UK’s Air Transport Market
17 July 2013
20
Figure 3-2 Select Multi-Airport Cities Europe, Africa and the Middle East 2011
Source: InterVISTAS analysis based on DIIO 2011 data.

Assessing Connectivity in the UK’s Air Transport Market
17 July 2013
21
Figure 3-3 Select Multi-airport Cities Asia and Oceania 2011
Source: InterVISTAS analysis based on DIIO 2011 data.
Assessing Connectivity in the UK’s Air Transport Market
17 July 2013
22
Some multiple airport cities have airports that serve different roles, such as an intercontinental network carrier operation at one airport and a low cost carrier domestic operation at another airport. But in some of these cases it is anticipated that those roles may change in the near future. Houston has a major international airport (IAH) and a secondary airport (HOU) that has been traditionally used by a low cost carrier for domestic operations. Houston is now starting to develop HOU for international service, which will compete with overlapping international services at IAH, changing the dynamic of hub competition between the two airports (and between the carriers). Seoul retained its old airport at Gimpo (GMP) for domestic service and relied on Incheon International Airport (ICN) to provide a hub for Korean Air’s international service. However, GMP is already used for international service to major regional destinations in Asia including China, Japan and Taiwan. It is expected that the airport will continue its growth of international service. Bangkok’s Don Muang is another example of a second airport, which has developed service to proximate international destinations in Malaysia, Indonesia, as well as to Hong Kong and Seoul.
Some multiple airport cities have airports that serve near identical roles. In these cases, the carriers at these airports are directly competing with each other. An example is New York, where both Newark and JFK are intercontinental gateway airports. Newark has one major carrier (United/Continental), plus service from many of its Star alliance carriers. JFK, on the other hand, supports major intercontinental operations for more than one carrier/alliance group: American/oneworld and Delta/Skyteam. Figure 3-4 provides a list of select multiple-airport cities. It also lists the airlines using those cities/airports as a hub for their operations.

Assessing Connectivity in the UK’s Air Transport Market
17 July 2013
23
Figure 3-4 Select Cities that Support Multiple Gateway Airports
City Airport(s) # of Major Airlines Major Airline(s)
New York City JFK (international and domestic) EWR (international and domestic) LGA (domestic only + Canada)
3
1
1
American Airlines Delta Air Lines JetBlue Airways United/Continental Delta Air Lines
Chicago ORD
(international and domestic) MDW
(international and domestic)
2
1
American Airlines United/Continental Southwest Airlines
Tokyo HND Domestic
(international and domestic) NRT International
(international and domestic)
5
6
Japan Airlines All Nippon Airlines Skymark Airlines Air Do Skynet Asia Airways
AirAsia Japan All Nippon Airways Delta Air Lines
Japan Airlines Jetstar Japan
United/Continental
Shanghai SHA
(international and domestic) PVG
(international and domestic)
4
5
China Eastern Airlines Juneyao Airlines Shanghai Airlines Spring Airlines Air China China Eastern Airlines Juneyao Airlines Shanghai Airlines Spring Airlines
Seoul ICN
(international and domestic) GMP
(international and domestic)
4
2
Asiana Airlines Eastar Jet Jeju Air Korean Air
Asiana Airlines
Korean Airlines
Taiwan TPE
(international and domestic) KHH
(international and domestic) TSA
(international and domestic)
3
1
4
China Airlines EVA Air TansAsia Airways
China Airlines Mandarin Airlines Transasia Airways Far Eastern Air UNI Air

Assessing Connectivity in the UK’s Air Transport Market
17 July 2013
24
These examples illustrate that it is quite common for large cities to be successfully served by multiple airports. It is entirely appropriate that the same should occur in London, given that it is the largest city market in the world, as described in Chapter 2. Given the population size and the pace of economic growth in China, it is likely that London will be surpassed by Shanghai at some point in the future. However, even now it is a market that is effectively served by two major airports with overlapping hub carriers.
3.2 Airlines Find it Effective to Have Multiple Hub Operations, Even When These Airports are Close to Each Other
Large network carriers commonly operate multiple hubs to provide wider geographical coverage.13 With the emergence of global airline alliances (Star Alliance, Skyteam and oneworld), hubs have become a focal point as alliances compete for markets. Multiple hub operations by alliances “enables some reorganisation of operations so that (…) cities are served as spokes only from the nearest hub in the alliance and by reducing duplication, redistribute aircraft to add new destinations,”14 which is a main focus of hubs. Several carriers have maintained multiple proximate hub operations. Examples are Lufthansa with hub operations in Frankfurt and Munich, Air France/KLM with hub operations in Paris and Amsterdam, and Northwest (now Delta), with hub operations in Minneapolis-St. Paul and Detroit.15
Lufthansa, a member of the Star Alliance, has shown that multiple hub operations can work under certain conditions. The airline currently maintains hubs in both Frankfurt and Munich, two cities that are geographically close (the two airports are 390 km apart by road). Munich works as a second hub because: (1) while the cities are close, they do have different catchment areas for local traffic; (2) Munich has Italian routes that Frankfurt does not serve, which further adds to the differentiation of service at the two airports; and (3) the schedules at Frankfurt and Munich do not compete with each other, they seem to be designed to work together.16 Lufthansa’s example is indicative of certain factors for a successful dual hub: first, the hubs should not compete for the same local traffic; second, they should have different route domains; and finally, they should focus on working together rather than having competing schedules.
Other instances when multiple hubs may be an ideal choice are when there is “hub-bypassing, strategic positioning, capacity restrictions at the principal hub, complexity costs of giga-hubs, bilateral restrictions and better aircraft utilisation (…)”17. In a number of cases, having multiple hubs may outweigh the costs involved.
13 Tretheway, M., and Oum, T. (1992), Airline Economics: Foundations for Strategy and Policy (Vancouver: Centre for Transportation Studies, 1992), p. 73.
14 Dennis, N. (2001), “Developments of Hubbing at European Airports”, Air & Space Europe 1/2 (3), p. 53.
15 Fu, X., Homsombat, W., and Oum, T. (2011), “Airport-airline vertical relationships, their effects and regulatory policy implications”, Journal of Air Transport Management 17, p. 350.
16 Supra note 8, p. 53.
17 Airneth (2005), “Strategies of multi-hub airlines and the implications for national aviation policies”, Airneth workshop report (The Hague: Airneth, 2005), para. 2.4.

Assessing Connectivity in the UK’s Air Transport Market
17 July 2013
25
3.3 Proximate Gateway Airports Can Coexist
A key factor for the development of a successful gateway airport is the presence of a large close-in local origin and destination market. Such a large close-in catchment area ensures high-yield travel demand essential for building the airport network.18 Other important factors that facilitate airport growth are availability of peak-hour capacity to facilitate a flight wave-system for the hub airline, affiliation of the hub airline with a global airline alliance, availability of air traffic rights to facilitate greater market access, minimized connection times, one-terminal concept, competitive visit costs, good accessibility of the airport by land transportation, possibilities for growth and expansion, and airport amenities.19
A few theoretical studies have suggested that a single-hub system is optimal because multi-hub systems reduce economies of density and add complexity costs. In addition, the claim is made, rightly or wrongly, that one big hub provides better connectivity and attracts more passengers than two smaller hubs of half the size. This view has been supported by a few empirical studies that point to de-hubbing strategies by select European carriers (Barcelona by Iberia, Gatwick by British Airways and Milan by Alitalia).
However, in practice multi-hub systems are a growing phenomenon. A given carrier may operate multiple hubs at different cities suggesting that there are limits to economies of traffic density. E.g., International Airlines Group operates major hubs at both London Heathrow and at Madrid, and Lufthansa operates multiple hubs at Frankfurt, Munich and, to a lesser extent, Dusseldorf, plus the hubs of subsidiaries Swiss International (Zurich) and Austrian (Vienna). Multiple hubs are especially prevalent in the U.S. and Australia where most carriers operate multiple hubs. Multi-hub systems are also observed at a number of airports within the same city. At Chicago in the U.S., both United/Continental and American operate hubs at O’Hare while Southwest operates Midway as its largest focus airport.
A body of literature is emerging to explain the observed development of multi-hub systems with the following reasons often being cited: increased spatial coverage and market access; growing air travel demand; convenient frequencies; capacity shortages at primary hubs; strategic behaviour at single hub airports to deter entry by rival carriers; better aircraft utilization; bilateral restrictions on access to primary hubs; limits to economies of traffic density, and political pressure from unions.20 In regards to multiple gateway airports in London, Doganis (2002)
offered one hypothetical scenario involving the transfer of an alliance grouping such as the Star alliance to Cliffe airport from Heathrow. 21 The author cites two main reasons for Cliffe to be an attractive site for another alliance: (1) the airport would create a large amount of capacity quickly for the alliance group moving in, and (2) Cliffe would not face heavy competition from
18 Burghouwt, G. (2013), “Airport Capacity Expansion Strategies in the Era of Airline Multi-hub Networks”, Discussion paper No. 2013-5, Roundtable on Expanding Airport Capacity under Constraints in Large Urban Areas, February 2013, p. 10.
19 Ibid., p. 10, citing Bootsma (1997).
20 Ibid., pp. 10-12.
21 Doganis, R. (2002), “Future of Hubbing in London”, Rigas Doganis & Associates, p. 16. Cliffe in Kent, to the East of London, was identified by the UK government as a potential location for new airport in 2002. However, the idea was dropped in the 2003 “The Future of Air Transport” white paper due to concerns about cost and suitability of the location.

Assessing Connectivity in the UK’s Air Transport Market
17 July 2013
26
low-cost carriers, at least in the short run.22 Doganis suggests that the Star Alliance would be the first choice for transferring its flights, as at the time, BMI was a member of the Star Alliance. BMI has since then merged into British Airways, moving the slots once held by Star to the oneworld alliance. Nevertheless, the original argument of an alliance setting up a gateway at a different airport may still be viable, as Heathrow is constrained and the demand for air services is growing.
3.4 Case Study: The Emergence of Multiple Gateway Airports at Moscow
For many cities, the multiple airport system has evolved gradually as air traffic levels have grown. In some cases, the cities were initially served by a single major airport but additional airports emerged as the volume of traffic and the number of carriers grew. In other cases, a change in government policy was required to allow multiple airports to develop. Historical examples include:
Newark International Airport in New York, which has become a major international gateway, alongside JFK International, despite being an airport with limited scheduled services and very little international service back in the 1980s.
Haneda Airport in Tokyo was originally restricted to domestic traffic due to government policy. Since this policy was removed, Haneda Airport has now operating as an intercontinental gateway alongside Narita Airport.
Another recent example is the development of Domodedovo International Airport (DME) in Moscow over the last decade or so. In 2000, state-run Sheremetyevo International Airport (SVO) was the dominant airport serving the Russian capital, accounting for 70% of all airline seat capacity to/from Moscow. By comparison, DME, which is privately operated, accounted for 14% of seat capacity and Moscow’s third airport, Vnukovo (VKO), accounted for 16%.23
Throughout the 2000s, the operator of DME upgraded the airport, adding space and modern amenities that resulted in many airlines moving their services from over-crowded and dated SVO. As shown in Figure 3-5, traffic at DME grew rapidly with the airport overtaking SVO by 2008. In 2012, DME accounted for 44% of seats capacity in the Moscow market, compared with 41% for SVO. By 2012, DME hosted 46 more airlines than it did in 2000, while SVO lost 24 airlines, dropping from 65 to 41 in that period (see Figure 3-6).
22 Ibid., p. 16.
23 Domodedovo was privatised in 1996 and is operated by the East Line Group on a 75 year lease. However, the runways remain under state control.

Assessing Connectivity in the UK’s Air Transport Market
17 July 2013
27
Figure 3-5 Airline Seat Capacity at the Moscow Airports 2000-2012
Source: Official Airline Guide (OAG) Schedules.
Figure 3-6 Number of Airlines Operating at Domodedovo and Sheremetyevo 2000 and 2012
Source: Official Airline Guide (OAG) Schedules.
0
2
4
6
8
10
12
14
16
18
2000 2001 2002 2003 2004 2005 2006 2007 2008 2009 2010 2011 2012
An
nu
al
Se
ats
(M
illi
on
s)
Domodedovo (DME)
Sheremetyevo (SVO)
Vnukovo (VKO)
2000 2012

Assessing Connectivity in the UK’s Air Transport Market
17 July 2013
28
As importantly, major shifts occurred with the airline alliances. Aeroflot elected to stay at SVO, and its SkyTeam partners did for the most part as well, but the majority of carriers from Star Alliance and oneworld moved to DME, in order to maintain alliance connectivity (see Figure 3-7).
Figure 3-7 Alliance Shifts at Domodedovo and Sheremetyevo 2000 and 2012
Source: Official Airline Guide (OAG) Schedules.
This migration from SVO to DME did not happen overnight as illustrated in the timeline in Figure 3-8. Some airlines performed surveys and assessments to determine if moving to DME would be beneficial. For some, the prospect of an improved customer experience prompted the move. SVO had become too congested and outdated to handle their passengers’ needs.
Figure 3-8 Alliance Airlines Moving to Domodedovo 2000-2012
2000 2012
2001 2002 2003 2004 2005 2006 2007 2008 2009 2010 2011 2012
Moved from SVO to DME Initiated service at DME
LufthansaBritish Airways,
Vietnam Airlines,EgyptAir
Brussels
Royal Jordanian
Iberia,Thai Airways
TAP PortugalUnited Airlines
Cathay Pacific
Air Berlinbmi
Austrian Airlines,Japan Airlines
Assessing Connectivity in the UK’s Air Transport Market
17 July 2013
29
3.5 Key Conclusions on Multiple Airport Cities
Several key conclusions about multiple airport cities can be made:
There are many examples of cities around the world with multiple airports. In some cases, the different airports serve different roles (such as Chicago O’Hare as the intercontinental gateway and Midway as the domestic low cost carrier hub). In some cases different airports serve identical roles, with vigorous competition between the airlines (such as New York JFK and Newark).
The development of multiple airport systems has been an evolutionary process, the result of changes in the aviation market (passenger demand and air carrier strategy) and, in some cases, government policy.
The example of Moscow shows how market conditions can change dramatically as a result of airport and airline dynamics.

Assessing Connectivity in the UK’s Air Transport Market
17 July 2013
30
4 Connectivity: Why it Matters and How it Should be Measured
4.1 Connectivity is not the Same as Connecting Traffic.
Air connectivity is about ensuring the UK is effectively and affordably connected to the rest of the world.
Connectivity should not be confused with connecting traffic.
Connectivity is fundamentally about UK access to global markets and regions. Connectivity enhances the productivity of the UK economy and the size of its economy.24 Connectivity deals with traffic of UK residents to the rest of the world and vice versa. It is a primary enabler of national economic activity.
Connecting traffic is that which connects through UK airports on way to their final destination. Domestic connecting traffic (i.e., traffic originating in the UK and destined outside the UK), is fundamentally a part of national connectivity. International connecting traffic involves non-UK residents merely transiting the UK en route somewhere else. It can create some value for the UK through the UK jobs required to service this traffic, although for this to be net gain, it requires that these services can be provided at a mark-up above variable cost. There is also value in that connecting traffic may build volumes on a route to/from the UK to enable additional destinations, use of larger aircraft with lower costs per passenger, and/or higher frequency of service.
Connectivity is not simply a matter of the number of routes or number of frequencies operated from an airport or country. It also involves the price of access. A country or region that has expensive connections to other parts of the world will be a less desirable place to do business and will have lower national productivity than a country with affordable access to a broad range of markets, especially the fastest growing markets. It will be a lower cost location to do business and its businesses will achieve higher productivity.
Ensuring that the UK is effectively and affordably connected to world markets and destinations should be the focus of the Airport Commission’s analysis. Analysis of connectivity is more vital than assessing how to maximise the size of a mega-hub for a dominant carrier and its alliances with large flows of international connecting passengers.
24 InterVISTAS Consulting Inc., Measuring the economic rate of return on investment in aviation, December 2006. Report prepared for the International Air Transport Association.
Connectivity is not simply a matter of the number of routes or number of frequencies operated from an airport or country. It also involves the price of access.

Assessing Connectivity in the UK’s Air Transport Market
17 July 2013
31
4.2 Connectivity and the Economy
The development of air connectivity is important for the UK economy as a whole, not just the aviation industry. Air travel (like most forms of transportation) is a derived demand. For the most part, people travel to fulfil some other need: to conduct business, facilitate trade, enjoy a holiday or visit friends and family. This is even more apparent when considering air cargo. Goods are flown to markets to be sold or to be used as inputs into other production processes. In economic terms, air travel is a factor of production for another activity – a means to an end. In order for these other needs to be met effectively, air travel should be convenient, available and affordable.
In other words, aviation connectivity facilitates the growth and development of many other sectors of the economy. This economic enabling role of air transport connectivity is sometimes referred to as the catalytic impacts or wider economic benefits of aviation. There are a number of ways in which aviation connectivity can contribute to the wide economy. These include:
trade in services;
trade in goods;
tourism;
business investment and innovation; and
enabling broad national economic productivity.
The relationship between aviation connectivity and these catalytic impacts is complex. For example, just as air connectivity can facilitate trade in services, trade in services increases the demand for air travel. The relationship is likely two-way – there needs to be an underlying demand for air travel to support aviation connectivity, while at the same time, connectivity helps stimulate trade, tourism, investment and productivity, etc. While air connectivity alone is not sufficient for trade, tourism, investment and productivity, it is a significant contributor. As described in our discussion below, there is compelling evidence of aviation connectivity generating these catalytic impacts.
4.2.1 Trade in Services
Air travel plays an important role in facilitating sales, business development and servicing clients. Arguably some of this can be replaced by teleconferencing technology, however, the impact of this technology on demand for air travel is unclear at this stage, although there is some evidence that its impact is neutral or possibly even positive (i.e., teleconferencing is increasing the demand for air travel).25
Empirical research has concluded that air services have influence and help develop increased trade in services and related employment. For example, a study commissioned by IATA surveyed 625 businesses in five countries (China, Chile, the United States, the Czech Republic
25 E.g., Choo and Mokhtarian (2007), Telecommunications and travel demand and supply: Aggregate structural equation models for the U.S.
Assessing Connectivity in the UK’s Air Transport Market
17 July 2013
32
and France), and found that 25% of sales were dependent on good air transport links.26 This percentage rose to 40% for high tech companies.
A study by Irwin and Kasarda (1991) examined the relationship between the structure of airline networks and employment growth at 104 metropolitan areas in the United States.27 Using data for a 30-year period, the researchers showed that expansion of the airline network serving a region had a significant positive impact on employment in that region. The effect was particularly significant in the service sector. Firms such as management consulting, finance and accounting locate in areas that minimize constraints to contact and maximize access to geographically-dispersed and national markets. Furthermore, analysis was conducted (using non-recursive models) which confirmed that increases in the airline network were a cause, rather than a consequence, of employment growth in both service and manufacturing sectors.
In a similar study, Brueckner (2002) examined the impact of air service on employment in the U.S. The author regressed employment in 94 metropolitan areas in the U.S. against a number of factors including measures of air service.28 The analysis found that a 10 percent increase in passenger enplanements in a metropolitan area led to approximately a 1 percent increase in service-related industry employment. Frequent service to a variety of destinations, reflected in the high levels of passenger enplanements, was found to both attract new firms to a metro area and stimulate employment at established enterprises.
4.2.2 Trade in Goods
Although air cargo accounts for 0.5% of the volume of global trade shipments, it accounts for over 35% of the trade value, meaning that air cargo is high value, often times perishable or time-sensitive.29 Air transport not only supports the export of UK goods to overseas markets but also supplies parts and machinery necessary for production processes in the UK.
Academic literature also supports the role of aviation in the trade of goods. Cech (2004) used a cross-section statistical comparison method to investigate how air cargo services affect local economies, including:
1. the attractiveness of an area for the creation of new jobs and retention of existing jobs (measured by employment);
2. the impact on economic growth (measured by earnings); and 3. the impact on added value created by employees and subsequent improvement of
efficiency and competitiveness (measured by earnings per employee).30
The author grouped 125 U.S. counties with similar population sizes into seven groups depending on the number of airports to which they connected, the volume of cargo handled
26 Airline Network Benefits, IATA Economic Briefing No. 3, 2006.
27 Irwin, M. and Kasarda, J. (1991), “Air Passenger Linkages and Employment Growth in U.S. Metropolitan Areas,” American Sociological Review, Vol. 56, No. 4, August 1991.
28 Brueckner, J. (2002), “Airline Traffic and Urban Economic Development.”, Urban Studies, Vol. 40, No. 8, July 2003.
29 Air Transport Action Group (ATAG), “Aviation Benefits Beyond Borders”, March 2012.
30 Cech P. (2004), “The Catalytic Effect of the Accessibility to Air Cargo Services,” TIACA Graduate Research Paper Competition.

Assessing Connectivity in the UK’s Air Transport Market
17 July 2013
33
and the frequency of flight service. The author concluded that there is a positive catalytic effect related to accessibility to air cargo services. More specifically, the catalytic effect can lead to an increase in the number of jobs as well as improve regional productivity and increase employee earnings. The transportation sector is most influenced by the accessibility of air cargo services. However, construction, retail and wholesale trade industries are also positively influenced.
4.2.3 Tourism
Air service can facilitate the arrival of larger numbers of tourists to a region or country. The spending of these tourists can support a wide range of tourism-related businesses: hotels, restaurants, theatres, car rentals, etc. For the UK, air services are essential to attracting tourists from more distant parts of the world including the Americas and Asia, as well as many parts of Europe. Tourism from emerging economies such as China and India is still developing, and countries around the world are attempting to establish themselves as the attractive tourism destinations for these outbound markets. The UK’s historical and cultural attractions place it in a strong position to compete for these tourists, but affordable and accessible air service is a critical requirement. This is not to say that the focus should be purely on emerging markets. Established source markets such as the U.S., France and Germany contribute large numbers of tourists and are expected to still be growth markets.
Of course, air services also facilitate outbound tourism, which can be viewed as having a negative effect on balance of trade. However, even outbound tourism involves spending in the home economy, on airlines, travel agents, taxis, pre-travel retail, etc. In any case, it is not necessarily the case that money spent by UK tourists flying abroad would be spent within the home economy if there were no air service (e.g., it may be spent on products produced overseas with only a small value-added contribution for the UK economy).
4.2.4 Business Investment and Innovation
A key factor many companies take into account when making decisions about the location of offices, manufacturing plants or warehouses is the availability of international air services.
A study commissioned by IATA surveyed 625 businesses in five countries (China, Chile, United States, Czech Republic and France), and found that 63% of firms stated that air transport was vital or very important to investment decisions, while a further 24% said it was somewhat important. 31 On average, 18% of firms reported that the lack of good air transport links had affected their past investment decisions, while 30% of Chinese firms reported they had changed investment decisions because of constraints on air services.
A study by York Aviation investigating the factors that affect individual company location decisions in Europe found that proximity to a major airport was the fourth most important factor when deciding the country of location of the European Headquarters of companies. Proximity to a major airport was the most important factor when deciding the region of location within the country.32
31 Airline Network Benefits, IATA Economic Briefing No. 3, 2006.
32 The Social and Economic Impacts of Airports in Europe, York Aviation, January 2004.

Assessing Connectivity in the UK’s Air Transport Market
17 July 2013
34
An academic research paper published in 2008 analyzed the relationship between availability of international air services and the location of a large firm’s headquarters across major European urban areas.33 The research found the supply of non-stop intercontinental flights was a significant factor in determining headquarter locations (along with other economic, business, labour and tax factors). Empirical research by the authors indicated that a 10% increase in supply of intercontinental air service was associated with a 4% increase in the number of large firm headquarters located in the corresponding urban area.
4.2.5 Long-Term Productivity Impacts
Air connectivity promotes better connections with the global economy, allowing better access to new markets, contributes to a faster and more reliable supply chain and facilitates economies of agglomeration – specialised businesses clustering in the UK (high tech, finance, etc.). In many ways, the long-term productivity benefits are the aggregate net effect of the previous catalytic impacts (trade, investment, business location, etc.). For example, greater trade allows businesses to benefit from economies of scale and greater specialisation as they sell to a larger market. Investment decisions (expanding operations, developing new operations, introducing new technologies) will also have the effect of improving the productivity of UK workers.
Research has been conducted to capture this productivity impact. A 2006 study by InterVISTAS Consulting Inc., commissioned by IATA, used data on 48 countries (including the UK) over nine years to examine the relationship between air connectivity (a measure of international air service) and GDP productivity growth (measured as GDP per labour hour). The research found that a 1% increase in a nation’s air connectivity increased GDP per labour hour by 0.007%.34 While the impact appears small, it can compound over time and result in a significant boost for economic growth.35
It should be noted that while the productivity effects of air connectivity are significant, there are considerably smaller that the Information and Communications Technology (ICT). For example, one study estimated that each 10% increase in ICT investment lead to 0.5-1.2% increase in productivity between 1981 and 2000.36 This is not surprising as investment in ICT over the last 20-30 years has increased dramatically, and it is generally widely recognised that ICT has been the one of the largest drivers of productivity growth in the last quarter-century, and particularly the last decade.
33 Bel, G. and Fageda, X. (2008), “Getting There Fast: Globalization, Intercontinental Flights and Location of Headquarters”, Journal of Economic Geography, Vol. 8, No. 4.
34 InterVISTAS Consulting Inc., “Measuring the Economic Rate of Return on Investment in Aviation”, December 2006.
35 The analysis controlled for other factors that contribute to productivity, including capital spending, research and development spending and education. The analysis also used country specific dummies to capture any remaining structural reasons for productivity differences between countries.
36 Estimated from findings in the following study: Whatever Happened to U.S.-Canada Economic Growth and Productivity Performance in the Information Age?, T.M. Harchaoui and F. Tarkhani, Statistics Canada Research Paper #11F0027MIE-25, November 2004.

Assessing Connectivity in the UK’s Air Transport Market
17 July 2013
35
4.3 Defining and Measuring Connectivity
Given the importance of connectivity, a key question is: how do we measure connectivity? Are there metrics for connectivity which capture its importance and role in the UK economy?
Our view is that, given the multiple way connectivity benefits the UK economy, it is not possible to have one single measure of connectivity that captures all aspects of its contribution to the economy. Simple measures such as number of destinations served (or number of destinations served daily), total frequency and total seats operated remain useful measures to understand the scale of connectivity and provide comparison with other major airports.
However, it should be recognised that connectivity has both supply and demand elements:
Supply Side Carriers can achieve higher traffic levels on any given route if there are connections from other routes operated by itself, its alliance partner, and/or other unaligned carriers. This might result in low costs (economies of route density), although such economies have diminishing returns and at some level of connectivity there may be little or no further benefit.
Demand Side Consumers and the regional/national economy derive benefits from higher levels of connectivity. However, there are many dimensions to connectivity, each of which drive different levels of benefits: how many and which cities are connected, the frequency of service, the competitive choice of access, and the price of access. The latter two points are especially important and easily overlooked. Connectivity via a single monopoly carrier (or alliance) only at high fares results in lower consumer benefits than connectivity to the same points by competing carriers
The supply side approach assesses the scope of access between an individual airport or country and the global air transport network, population and or global economy. One available measure of connectivity is the IATA Connectivity Index which measures the number of frequencies and available seats to a particular destination. It weights the number of available seats by the size of the destination airport. This weighting reflects both the size and of the destination and the potential for convenient onward connections. Thus, the index recognises that connections to major global gateways provide greater global connectivity than connections to the same number of spoke ends. The connectivity indicator is therefore calculated as:
Number of destinations x Frequency x Seats per flight Weighted by the size of the destination airport
Divided by a scalar factor of 1000
A higher figure for the connectivity indicator denotes a greater degree of access to the global air transport network. The weight of the destination airport is based on the relative size of that airport measured by its total capacity as a share of the capacity of the largest airport in the world. In our case, Atlanta was used as a benchmark to measure the relative sizes of other airports. The absolute value of the connectivity index has no real meaning; it is the relative value of various connectivity options that are of interest.

Assessing Connectivity in the UK’s Air Transport Market
17 July 2013
36
The IATA Connectivity Index has been used in this report to provide a preliminary analysis of the connectivity position of London’s airports relative to other parts of the world. As noted previously, this is only one measure of connectivity, and other measures will be needed to provide a complete assessment of connectivity. Nevertheless, it does provide a starting point for the connectivity discussion.
Figure 3-1 summarizes IATA connectivity indices for select airports in Europe, North America and Asia. Figure 3-2 provides details on the number of non-stop destinations and total seat operated capacity at those airports.
Figure 3-1 IATA Connectivity Index for Select Airports 2012
Source: InterVISTAS analysis based on DIIO data.
297.0
230.4
203.2 203.2 199.1
174.9
156.4
144.5136.6
126.8
59.4
38.7
17.2
0
50
100
150
200
250
300
350
LHR ATL JFK FRA CDG NRT AMS EWR HND LGA LGW ORY STN
Co
nn
ec
tivit
y I
nd
ex
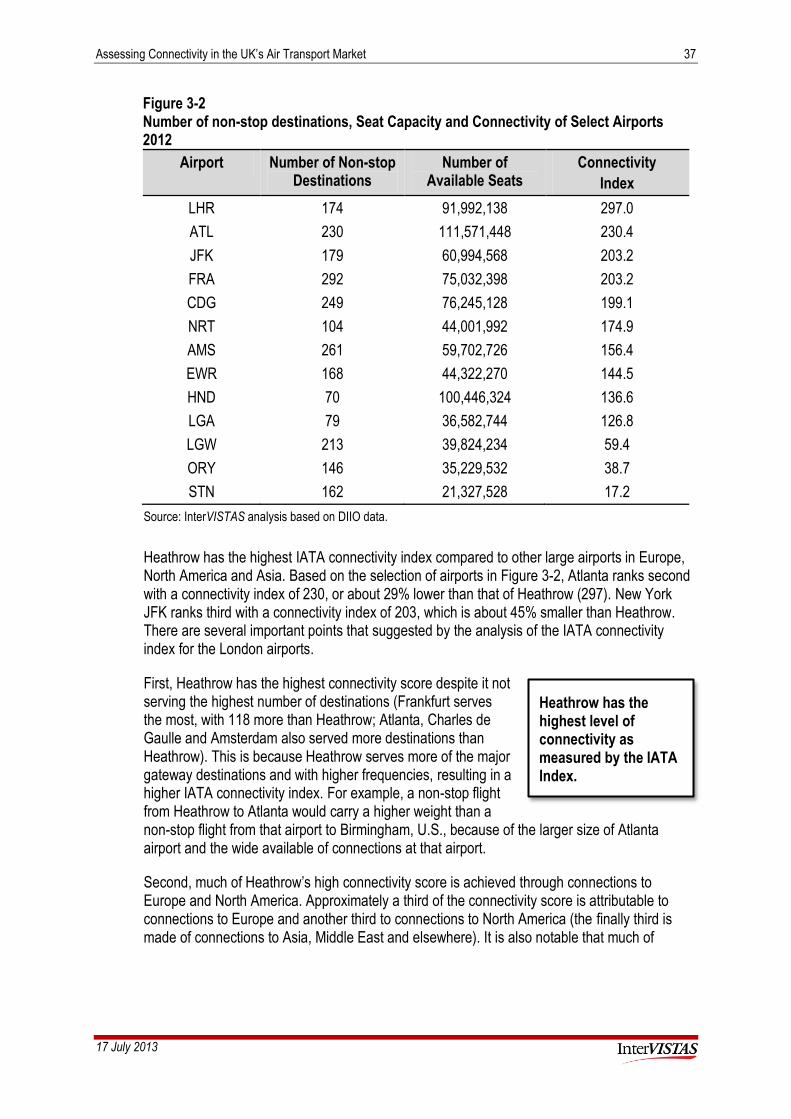
Assessing Connectivity in the UK’s Air Transport Market
17 July 2013
37
Figure 3-2 Number of non-stop destinations, Seat Capacity and Connectivity of Select Airports 2012
Airport Number of Non-stop Destinations
Number of Available Seats
Connectivity
Index
LHR 174 91,992,138 297.0
ATL 230 111,571,448 230.4
JFK 179 60,994,568 203.2
FRA 292 75,032,398 203.2
CDG 249 76,245,128 199.1
NRT 104 44,001,992 174.9
AMS 261 59,702,726 156.4
EWR 168 44,322,270 144.5
HND 70 100,446,324 136.6
LGA 79 36,582,744 126.8
LGW 213 39,824,234 59.4
ORY 146 35,229,532 38.7
STN 162 21,327,528 17.2
Source: InterVISTAS analysis based on DIIO data.
Heathrow has the highest IATA connectivity index compared to other large airports in Europe, North America and Asia. Based on the selection of airports in Figure 3-2, Atlanta ranks second with a connectivity index of 230, or about 29% lower than that of Heathrow (297). New York JFK ranks third with a connectivity index of 203, which is about 45% smaller than Heathrow. There are several important points that suggested by the analysis of the IATA connectivity index for the London airports.
First, Heathrow has the highest connectivity score despite it not serving the highest number of destinations (Frankfurt serves the most, with 118 more than Heathrow; Atlanta, Charles de Gaulle and Amsterdam also served more destinations than Heathrow). This is because Heathrow serves more of the major gateway destinations and with higher frequencies, resulting in a higher IATA connectivity index. For example, a non-stop flight from Heathrow to Atlanta would carry a higher weight than a non-stop flight from that airport to Birmingham, U.S., because of the larger size of Atlanta airport and the wide available of connections at that airport.
Second, much of Heathrow’s high connectivity score is achieved through connections to Europe and North America. Approximately a third of the connectivity score is attributable to connections to Europe and another third to connections to North America (the finally third is made of connections to Asia, Middle East and elsewhere). It is also notable that much of
Heathrow has the highest level of connectivity as measured by the IATA Index.

Assessing Connectivity in the UK’s Air Transport Market
17 July 2013
38
Heathrow connectivity is to major hubs in the rest of the world – approximately 56% of 2012 seat capacity at Heathrow was to/from major hubs.37 By comparison, only 18% of Gatwick’s seat capacity was to hub airports.
Third, contrary to Heathrow’s arguments, connectivity indices for airports located in multi-airport cities clearly show that secondary airports can develop into viable international hubs with high degrees of connectivity. One may consider the cases of New York City and Tokyo as examples. New York JFK and EWR have connectivity indices of respectively 203 and 145, or a ratio of 1.4. Tokyo’s NRT and HND have a similar ratio – 1.3 based connectivity indices of 175 and 137, respectively. London’s annual passenger traffic exceeds those of Tokyo and New York City; the traffic level is arguably sufficient to support two viable international gateway airports in London, each with good connectivity. Currently, the ratio of connectivity between Heathrow and Gatwick is 2.3, marking a significant connectivity gap for Gatwick compared to second largest airports in Tokyo and New York City. Expanding capacity at Gatwick by building a second runway would result in improved connectivity ratio between Heathrow and Gatwick and bring it more in line with other cities that support multiple gateway airports.
Finally, the IATA index does not show a connectivity gap for Heathrow compared to other major airports in Europe. Not only is Heathrow better connected compared to other airports in multi-airport markets, but its connectivity indicator exceeds the nearest best-connected airport in Europe (CDG) by about 50%. As stated before, other connectivity measures are required to provide a complete picture of the connectivity offered by the UK airports. However, the IATA index does appear to contradict the claim put forth by some that London generally, and Heathrow in particular, is poorly connected.
Figure 4-3 presents the growth in the IATA connectivity index for London’s three largest airports between 2004 and 2012. Over the last eight years, the main London airports improved their respective connectivity indicators by 25-29%. All three airports have contributed to large improvements in the UK’s connectivity, despite (or perhaps because of) the absence of a mega-hub serving London.
Figure 4-3 IATA Connectivity Index for London’s Three Main Airports 2004-2012
Airport Connectivity Index 2004
Connectivity Index 2012
% Change
Heathrow (LHR) 231.4 297.0 28%
Gatwick (LGW) 47.7 59.4 25%
Stansted (STN) 13.3 17.2 29%
Source: InterVISTAS analysis based on DIIO data.
37 Source: Source: Diio Mi Schedules Data. The airport served with the most seat capacity from Heathrow is New York JFK, followed by Dubai, Dublin, Singapore, Frankfurt, Hong Kong, Amsterdam, Newark, Madrid and Paris CDG.

Assessing Connectivity in the UK’s Air Transport Market
17 July 2013
39
The demand side measures of connectivity can be achieved by adapting the IATA connectivity index described above. The IATA index weights the destinations by the size of the airport (in terms of passengers). However, that weighting can be changed to include trade, tourism, GDP, etc., such that it also encapsulates the relationship between various economic factors and connectivity. The range of factors that could be used to weight the destination include:
population;
GDP and projected growth in GDP;
export trade (goods and services) and projected growth in trade;
tourism from the source market and projected growth in tourism; and
measures of the preference of outbound tourists – location of ethnic populations for visiting friends and relatives (VFR) traffic and rankings of preferred vacation destinations for UK tourists.
The alternative approaches to computing weights for connectivity indices enumerated above could provide a more holistic picture of an airport’s current or projected connectivity by linking it to broader economic and demographic trends. While it is preferable to develop an index based on regional GDP growth projections or some measure of development in trade and commerce between different regions, finding data on GDP or trade patterns at city level is challenging.
One final comment is made. A significant limitation of the IATA index (and the proposed demand side indexes) is that it does not weight connectivity scores by price of access. This would be difficult for global benchmarking of connectivity due to the large data requirements to obtain average fares by routes.
The development of demand side connectivity indexes and the possible inclusion of prices are areas worthy of additional research. This will be explored further in later submissions to the Commission.
4.4 Connectivity and Affordability
Connectivity is not just about availability, but also about affordability. High connectivity at high prices by a single airport dominated by one carrier and its alliances may have a lower national value than connectivity with competitive price offerings. Any analysis of connectivity needs to give consideration to options which enhance the competitive dynamics of the UK aviation market – this competition will ensure route development best meets the needs of the market and foster competitive pricing due to airport and airline competition. Options which only enhance the scope of some airlines will ultimately be detrimental to the wider UK economy.
Chapter 6 further discusses the important role of airport competition and access affordability as a goal for air access.
4.5 Key Conclusions on Connectivity and Why it Matters
Connectivity should not be confused with connecting traffic.
o Connectivity is fundamentally about UK access to global markets and regions.

Assessing Connectivity in the UK’s Air Transport Market
17 July 2013
40
Connectivity deals with traffic of UK residents to the rest of the world and vice versa.
Connectivity enhances the productivity and size of the UK economy.
o Connecting traffic is that which connects through UK airports on way to their final destination.
International connecting traffic involves non-UK residents merely transiting the UK en-route somewhere else.
This can create some value for the UK through the UK jobs required to service this traffic, and through building volumes to/from the UK to enable additional destinations, use of larger aircraft with lower costs per passenger, and/or higher frequency of service.
Connectivity is not simply a matter of the number of routes or the number of frequencies operated from an airport or country. It also involves the price of access.
o Ensuring that the UK is effectively and affordably connected to world markets and destinations should be the focus of the Commission's analysis.
o Connectivity assessment must recognise the critical roles of price and competition.
High priority should be given to capacity development scenarios which enhance competition.
Capacity development that is likely to reinforce the position of a dominant carrier and its alliance partners would not be welfare enhancing.
There are a number of ways in which aviation connectivity contributes to the wider economy. These include trade in services, trade in goods; tourism; business investment and innovation; and national productivity.
The relationship between aviation connectivity and these catalytic impacts is complex. The relationship is likely two-way, but there is evidence of aviation connectivity generating these catalytic impacts.
There is no one single measure of aviation connectivity. It is strongly recommended that multiple measures be used, including both supply side and demand side measures of the value of connectivity, and incorporating price.
The IATA Connectivity Index is one index of could be of use. It does not merely count routes, it also weights access by flight frequency and importance of the destinations.

Assessing Connectivity in the UK’s Air Transport Market
17 July 2013
41
5 Limits to the Returns from Increased Connectivity at a Single Airport
5.1 Introduction: The Benefits of Flight Connectivity at a Single Airport are not Limitless
The economic benefits of air connectivity described in Chapter 4 are widely recognised by economists and policy makers. However, one of the key factors in the debate about where to invest and construct additional runway capacity in the London region is where the UK can reap the greatest economic benefits from an increase in connectivity. As an example, Heathrow Airport recently released a report titled “One hub or none: the case for a single UK hub airport.”38 The claims of this study are that only one hub can provide flights to long haul destinations, only Heathrow can provide connection opportunities and there are economic benefits of concentrating connectivity at a single airport. The essence of this argument is that benefits of flight connectivity are limitless and thus they should be focused at a single point.
This report rejects this claim. There are both supply and demand reasons why the gains from connectivity at a single airport are not limitless. In the parlance of economics, there are diminishing returns to connectivity at any single airport. Perhaps there are benefits of increasing capacity at Heathrow, but these may be modest given its already extensive global connectivity. LHR is already among the best connected international airports in the world. It has even greater connectivity than a count of routes would suggest, due to having 60% of the UK population within three hours driving time, and a full 80% within four hours.
This chapter describes the supply and demand side reasons that there is a limit to connectivity benefits from a single airport. Appendix A provides a detailed critique of the arguments made by Heathrow in its report “One hub or none: the case for a single UK hub airport”, as it contains a great number of inaccuracies, omissions and spurious arguments.
As noted before, connectivity is not one-dimensional. In particular, we need to distinguish between two scenarios with equal connectivity in terms of flights and destinations:
connectivity with high air fares, and
connectivity with lower air fares.
Clearly these two scenarios would produce different benefits to the UK. The implications are that any assessment of the connectivity benefits of adding runway capacity at Heathrow versus adding capacity at another airport will need to recognise both the diminishing returns to connectivity benefits at LHR and whether the existing globally high level of connectivity at LHR
38 Heathrow Airport Limited, One hub or none: the case for a single UK hub airport, November 2012.
There are both supply and demand reasons why the gains from connectivity at a single airport are not limitless.
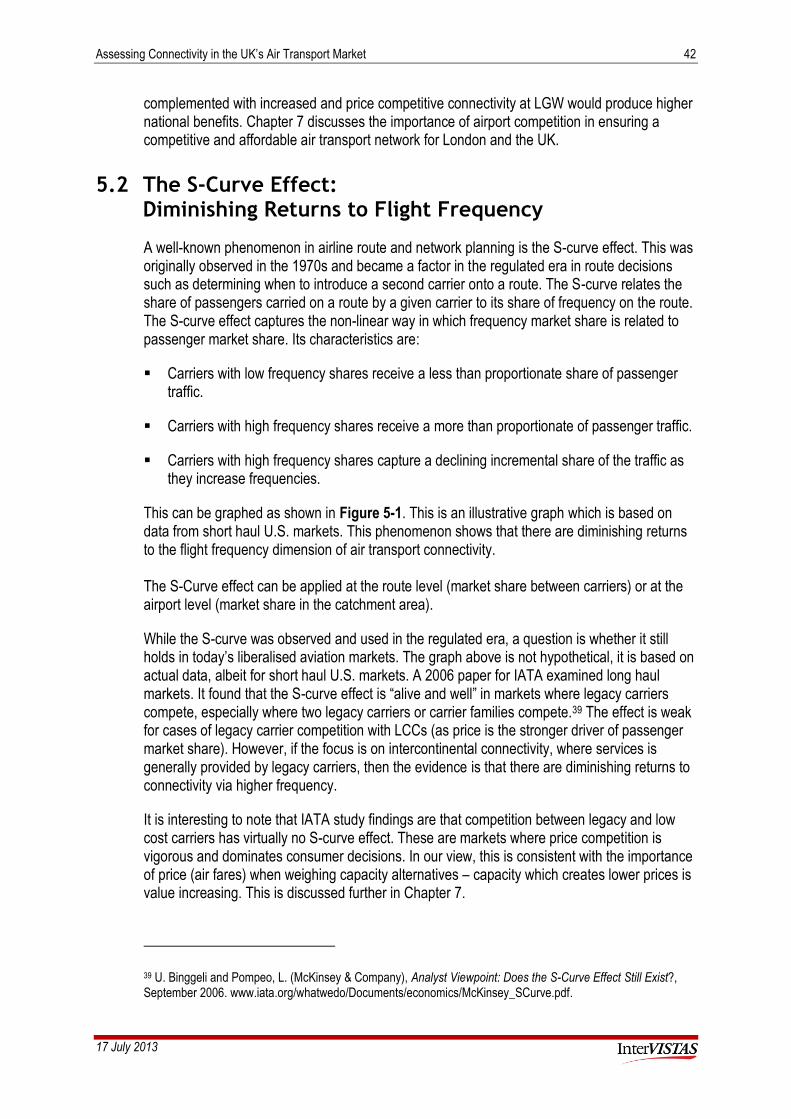
Assessing Connectivity in the UK’s Air Transport Market
17 July 2013
42
complemented with increased and price competitive connectivity at LGW would produce higher national benefits. Chapter 7 discusses the importance of airport competition in ensuring a competitive and affordable air transport network for London and the UK.
5.2 The S-Curve Effect: Diminishing Returns to Flight Frequency
A well-known phenomenon in airline route and network planning is the S-curve effect. This was originally observed in the 1970s and became a factor in the regulated era in route decisions such as determining when to introduce a second carrier onto a route. The S-curve relates the share of passengers carried on a route by a given carrier to its share of frequency on the route. The S-curve effect captures the non-linear way in which frequency market share is related to passenger market share. Its characteristics are:
Carriers with low frequency shares receive a less than proportionate share of passenger traffic.
Carriers with high frequency shares receive a more than proportionate of passenger traffic.
Carriers with high frequency shares capture a declining incremental share of the traffic as they increase frequencies.
This can be graphed as shown in Figure 5-1. This is an illustrative graph which is based on data from short haul U.S. markets. This phenomenon shows that there are diminishing returns to the flight frequency dimension of air transport connectivity. The S-Curve effect can be applied at the route level (market share between carriers) or at the airport level (market share in the catchment area).
While the S-curve was observed and used in the regulated era, a question is whether it still holds in today’s liberalised aviation markets. The graph above is not hypothetical, it is based on actual data, albeit for short haul U.S. markets. A 2006 paper for IATA examined long haul markets. It found that the S-curve effect is “alive and well” in markets where legacy carriers compete, especially where two legacy carriers or carrier families compete.39 The effect is weak for cases of legacy carrier competition with LCCs (as price is the stronger driver of passenger market share). However, if the focus is on intercontinental connectivity, where services is generally provided by legacy carriers, then the evidence is that there are diminishing returns to connectivity via higher frequency.
It is interesting to note that IATA study findings are that competition between legacy and low cost carriers has virtually no S-curve effect. These are markets where price competition is vigorous and dominates consumer decisions. In our view, this is consistent with the importance of price (air fares) when weighing capacity alternatives – capacity which creates lower prices is value increasing. This is discussed further in Chapter 7.
39 U. Binggeli and Pompeo, L. (McKinsey & Company), Analyst Viewpoint: Does the S-Curve Effect Still Exist?, September 2006. www.iata.org/whatwedo/Documents/economics/McKinsey_SCurve.pdf.
Assessing Connectivity in the UK’s Air Transport Market
17 July 2013
43
Figure 5-1 The S-curve effect: Passenger Share vs. Frequency Share US Short Haul Routes
Source: Analysis by InterVISTAS Consulting.
5.3 Diminishing Returns to Destinations in a Region
Another claim that is sometimes made is that focusing airport capacity at a single airport allows a greater range of cities to be served. We do not dispute this claim. However, we observe that here too there can be diminishing returns to connectivity.
Consider the example of service from London to the Pearl River Delta of Southeastern China. The first nonstop service to this region was to Hong Kong (HKG), and it created significant connectivity benefits for the UK (and for the Pearl River Delta). This route provided access not only to Hong Kong, but via ground transport and connecting flights to the entire Pearl River Delta and even to other parts of China. Later, as markets grew and were liberalised, London was connected to Guangzhou (CAN), another city in the region. This increased London’s connectivity, with a higher quality service to those residents in Guangzhou in particular.
However, while the connectivity benefit increased, it did not double. Guangzhou already had some connectivity to London via ground transport and connecting flights from HKG. The diminished returns become even more apparent when a third city in the region is considered, such as Macau, Shenzhen or Zhuhai. Again, there is an increase in connectivity benefit but the incremental value is smaller than the first or the second destinations served.
There are of course other benefits of adding destinations in a region from London. Doing so enables competing gateways to the Pearl River Delta, with different airlines competing from each gateway: Cathay Pacific’s gateway at HKG versus China Southern’s at CAN. But this is a

Assessing Connectivity in the UK’s Air Transport Market
17 July 2013
44
price competition benefit, not destination connectivity per se. The corollary of this is that connecting Hong Kong, for example, to two London airports, has an incremental connectivity benefit, but not as large as the first London airport connected to HKG. But there is an important price and service competition benefit by having competition for Pearl River Delta access from two airports in London.
This effect of diminishing returns to destination connectivity is true even if the airports are not within driving distance. Consider connecting London to Beijing (PEK) or Xian airports (XIY). There is high initial value to connecting the first of these, perhaps PEK. XIY benefits from this first stage of connectivity via connecting air services from PEK. Development of non-stop air service from London to XIY results in an increment to connectivity from London, and an increase in benefits driven by air service connectivity, yet the national benefit does not double.
5.4 Supply Side Limits to Connectivity: Why Mega-Hubs in West London or the Thames Estuary are not the Answer
There are also supply side limits to connectivity. This means that there are increasing costs of supplying connectivity. Here, we focus on the runway capacity of an airport. As more runways are added, capacity increases, but somewhat less than proportionately. At some point increases in capacity by adding runways create operational issues for both the airport and the airlines that may make capacity beyond a certain level uneconomic.
Currently, the busiest commercial airport in the world is Atlanta (ATL). In 2012, it handled 95 million passengers via 930,000 aircraft movements per year.40. This implies that, in round numbers, ATL operates with an average of 100 enplaned/deplaned passengers per movement, or assuming an 80% average load factor, 125 seats per aircraft. ATL is configured with a 2-2-1 runway system, meaning that there are three independent parallel runway sets, capable of simultaneous takeoffs and/or landings, with two of these consisting of a pair of closely spaced runways. The latter allow, for example, one aircraft to position itself while another is taking off, or one to land while another is position for takeoff. Presumably, ATL can increase its capacity somewhat by moving to a 2-2-2 configuration.
A number of airports are planning for eventual capacity in the range of 150 million annual passengers, and Beijing has indicated an ambitious plan for one of its airports to reach 200 million passengers. A question is whether such traffic levels are practical, not merely from a point of view of airport and air navigation operations, but also in terms of whether airlines would find it economical to operate from such a station.
Airport planners indicate that capacities of 150 to 200 million or beyond are feasible. Additional independent runway sets would be required. There are complications with managing 4 or 5 independent arrival/departure streams, but with effecting planning, systems and training, operations should be feasible.
40 Atlanta Airport Operating Statistics: http://www.atlanta-airport.com/Airport/ATL/operation_statistics.aspx.
Assessing Connectivity in the UK’s Air Transport Market
17 July 2013
45
We do not question the conceptual feasibility of such operations, but we do question whether they would be economical for airlines. Even with a three independent runway system, typically at least one of the outer runways will require taxiing aircraft to cross at least one or a pair of active runways, resulting in longer taxi times due both to distance and pauses while traffic clears before crossing active runways. With four sets of independent runways, taxiing becomes much longer, with more delays and a greater share of movements will be affected by runway crossings. Some traffic may need to cross between four and six active runways. There are also airspace complications. For example, an approaching aircraft on a middle set of runways that needs to abort a landing may need to fly a considerable distance before it can make a turn and blend back into the approach pattern.
Such operations will increase airline costs, potentially considerably, and reduce aircraft productivity. This means that a given fleet of aircraft will be able to complete fewer flights per day, increasing the number of aircraft needed to operate a given schedule. Thus airlines will face not only the costs of longer flight/taxi times but also greater capital costs. An increase fleet requirement of perhaps 8 additional aircraft on a 150 aircraft fleet can add in the range of £800 million to £2 billion in airline capital investment, depending on the aircraft purchased. With operating costs of £7,500 per hour, an increase of 10–15 minutes in additional flight or taxi times would increase costs per flight by £1,500 to £1,875, or a total of £1.5 to almost £2 million per day for a schedule of 1000 flights. This is £550 to £685 million per annum in additional costs for the carrier. Air carrier operating and capital costs are not the only costs that must be considered. Passengers will face additional travel time costs. If 150 million annual passengers have their travel times increased by 10 to 15 minutes each, then with a travel time value of £30 per hour, annual passenger time costs would increase by £900 million.
Some may argue that passenger volumes of 150 to 200 million annual passengers can be achieved by utilising larger size aircraft. Indeed we accept that a hub such as some of the emerging Middle East airports, where there is a very low proportion of narrow body aircraft, may be able to achieve high annual passenger volumes by utilising almost exclusively very high capacity aircraft. But if the gateway role of the airport includes not only intercontinental destinations but also continental and regional destinations, then average aircraft sizes are likely to be what we observe at the currently global leader, ATL, or at emerging markets such as we see in Istanbul where the airport mission includes a large number of destinations that are only economic with narrow body or smaller aircraft.
In summary, our caution is that a) airports with more than three independent runway sets might be economically unattractive to airlines (and passengers) and uncompetitive, and b) regardless of the number of independent runways, postulating major increases in average aircraft size may undermine connectivity objectives if the “connectivity gap” includes regional and continental destinations.
5.5 Key Conclusions on Diminishing Returns to the Value of Connectivity at a Single Airport
While initially there are increasing network connectivity economies at a given airport, eventually there are diminishing returns to connectivity.
A widely known example of this is the S-Curve effect, which shows that at some point, further increases in flight frequency produce diminishing returns to an airline.

Assessing Connectivity in the UK’s Air Transport Market
17 July 2013
46
There are also diminishing returns to adding destinations to a region.
o The initial routes to a region are typically to the highest population and economic activity centres. Additional routes will be to smaller economies.
o Further, initial routes to a region provide access via regional connecting services to other cities in the region. The eventual development of non-stop service to these other cities will increase connectivity benefits, but not proportionately.
There are supply side diminishing returns to connectivity. The largest airports in the world are currently under 100 million annual passengers and 1 million aircraft movements.
o Increasing an airport’s capacity will either require dramatic increases in aircraft size, undermining the regional hub role of an airport in favour of specialisation only in long-haul intercontinental service (e.g., Dubai);
o or it will require adding additional sets of independent runways, which greatly lengthen taxi times and diminish aircraft productivity and economics for air carriers.
o In particular, the concept of a single gigantic airport for the London region is operationally and economically problematic, if not today then certainly for the air traffic of 2030 and beyond.

Assessing Connectivity in the UK’s Air Transport Market
17 July 2013
47
6 Ensuring Robustness in the Face of Dynamic Market Conditions
6.1 Airline Business Models are Evolving
The rationale behind a third (or even forth) runway for Heathrow is that Heathrow will continue as the dominant network hub for the UK, serving network carriers and facilitating connecting traffic. At the same time, Gatwick and Stansted are assumed to accommodate largely point-to-point traffic carried by LCCs, charter airlines and some network carriers. There are a number of problems with this rationale. As already discussed in this report, the London market has a relatively small proportion of transferring traffic and this is not expected to increase, particularly as London is an inconvenient connecting point for many traffic flows (e.g., Europe-Asia). More fundamentally, it is assumed that aviation market and airlines business model of today will still apply in 2030 and even in 2050. In other words, the UK and London aviation market will be the same but bigger. However, this assumption is fundamentally flawed – there is already emerging trends in the industry which bring into question some the assumptions about future airport capacity requirements, which are outlined in sections 6.2 and 6.3.
That the aviation industry is continually evolving is no surprise when one considers the historically changes it has undergone, for example:
The arrival of the Boeing 747 in the 1970s which substantially reduced airline unit costs and contributed to air travel becoming a “mass market”.
The advent of vacation charter airlines offering cheaper overseas vacations and circumventing restrictive bilaterals.
Deregulation of air markets in North America, Europe and elsewhere leading to lower fares, greater consumer choice and the bankruptcy of some established airlines.
The development of airline alliance groups (and prior to that, codeshare agreements) as a means of expanding network reach.
The transformative impact of Low Cost Carriers (LCCs) across the globe and their impact on legacy /network carriers.
The emergence of the mega-hub carriers in the Middle East and Turkey.
Assessing Connectivity in the UK’s Air Transport Market
17 July 2013
48
6.2 Evolution of the LCC Model
The original LCC model focused on cost reduction in order to implement a price leadership strategy on the markets they serve. These low costs are achieved by utilising generally young fleet of homogenous aircraft (normally A320 or B737 models) with high density seating, operating to secondary airports in order to reduce airport fees and delays. Services were operated on a point-to-point basis (connecting traffic was not facilitated) and high aircraft utilisation was achieved by having aircraft turnarounds at airports and by operating short and medium haul routes.
Some LCCs still adhere to this model, such as Ryanair in Europe and Spirit and Allegiant Air in the United States.41 These types of carrier have sometimes been characterised as ultra-low cost carriers due to very low unit costs and simplicity of operation. They are also characterised by the high volume of ancillary revenues they generate (e.g., hold baggage fees, seat selection, boarding pass printing, on-board services and sales, etc.).42
Other LCCs have diverged from this model significantly. Some are making major changes in their business models to increase the percentage of traffic travelling on premium fares. Recognising that these features will add complexity and, in turn, costs, their hope is that the additional costs of complexity will be lower than the additional benefits of higher yield derived from the transportation of higher percentage of premium traffic. Examples of carriers in this category include Southwest and JetBlue in the U.S. and easyJet in Europe. This latter type of LCC are also seeking to attract a greater proportion of business travellers.43
Other LCCs are changing their business models to include the establishment of subsidiaries to fly smaller aircraft, exemplified by the decision of Westjet in Canada to operate the Dash-8 Q-400 turboprop aircraft. Similarly, JetBlue operates both A320 and Embraer regional jets.
The sections below discuss other ways in which the LCC business model is changing: long haul services and connecting traffic.
6.2.1 Long Haul Services
It has long been questioned whether LCCs could provide sustainable services in intercontinental markets. These suppositions were made on the basis that LCCs were able to achieve high utilization rates in their short and medium haul markets through their primarily point-to-point services, extremely fast turn-arounds, little to no catering and in-flight services. Intercontinental services require much greater turn-around times due to the length of flights that, in turn, required for example, more catering services as well as the passage of passengers through immigrations and customs. Moreover, intercontinental services require the transportation of connecting passengers to make them economically viable, as well as high yield business/premium cabins.
41 Even here there are differences. For example, Ryanair operates a very modern fleet in order to reduce fuel costs, while Allegiant operates much older MD-80 aircraft which have lower capital costs.
42 This is increasingly true of other types of LCCs and network carriers.
43 At the same time, many network carriers are adapting the business practices of LCCs, such as charging for checked baggage. For example, British Airways now offers hand luggage only fare for short haul flights from Gatwick.

Assessing Connectivity in the UK’s Air Transport Market
17 July 2013
49
Gradually, though, LCCs are attempting long haul services. Recent examples include Air Asia X, a subsidiary of the low cost carrier Air Asia, and Jetstar, the low cost subsidiary of Qantas Airways, based in Australia. From its base in Kuala Lumpur, Air Asia X has operated services to London, Paris, Melbourne, Christchurch (New Zealand) and various points in China, some with flying times in excess of 10 hours.44 The carrier has dropped the services to London and Paris citing high taxes and weak demand (the services ran from March 2009 to April 2012), but still operates long haul service within Australasia. Jetstar is operating long haul services of up to 10 hours from Australia to Hawaii, Japan and other points in Asia. Philippine LCC, Cebu Pacific has also indicated that it operates services to the Middle East, Europe and the United States using A330-300 aircraft starting in 2013.45 Singapore Airlines has established an LCC subsidiary, Scoot, aimed towards low-cost long-haul flying.
Closer to home, Europe’s third largest LCC, Norwegian Air Shuttle, has ordered eight B787s and has announced that it will start service from Copenhagen and Stockholm to Fort Lauderdale, beginning in November 2013.46 (Norwegian is the third largest carrier at Gatwick).
It remains to be seen how successful and how large long-haul LCC operations can become, but it is clear that there is a growing interest in entering the long haul, particularly as new opportunities in short haul dry up, and this will have major impact on the operation of airline businesses.
6.2.2 Connecting Traffic
Traditionally, LCCs have not facilitated connecting traffic, whether between its own services or with other carriers, due to the significant operating and IT costs involved. Many carriers still adhere to this approach, such as Ryanair, easyJet and Allegiant. Others, such as Southwest Airlines and JetBlue do facilitate connections within their own networks.
More recently, though, there is an increasing use of interline and codeshare agreements between low cost carriers and long-haul network airlines. This is becoming an increasingly important area of growth in the aviation market. Carriers such as WestJet in Canada, JetBlue in the U.S., and Virgin Australia and Jetstar in Australia have entered into codeshare and interline agreements with network carriers:
JetBlue has agreements (interline or codeshare) with 24 carriers including Aer Lingus, Air China, American Airlines, El Al, Emirates, Japan Airlines, Lufthansa and Turkish Airlines.47
44 The flight time to London from Kuala Lumpur is approximately 13 hours, while the flight time to Christchurch is approximately 11 hours.
45 http://www.cebupacificair.com/pages/PressReleases.aspx?pid=845.
46 http://worldairlinenews.com/2013/03/14/norwegian-is-coming-to-fort-lauderdalehollywood/.
47 http://www.jetblue.com/airline-partners/.
There is a growing interest from LCCs in entering the long haul, particularly as new opportunities in short haul dry up.
There is an increasing use of interline and codeshare agreements between low cost carriers and long-haul network airlines.
Assessing Connectivity in the UK’s Air Transport Market
17 July 2013
50
Canadian LCC, WestJet has codeshare agreement with eight airlines (including American Airlines, Air France, British Airways, China Eastern, Delta and Korean Air) and interline agreements with another 25 airlines.
Jetstar codeshares not only with its parent company, Qantas, but also Japan Airlines and American Airlines (and interlines with 25 other airlines).
Virgin Australia has codeshare agreements with Etihad covering over 50 routes and with Singapore Airlines on over 75 routes.
These arrangements enhance the profitability and network reach of the carriers without major changes to their business models, and enhance the connecting options of customers. Etihad Airways, which is not part of any airline alliance, reports that 19% of its revenues in 2012 originated from airline partnerships.48 Virgin Australia reported that the agreement with Etihad had double the number of passengers going onto Virgin’s network in 2011, albeit from a low base.49
6.2.3 Possible Implications for Gatwick
It is very unlikely that there will not be changes to the LCC business model that will impact the London airports. LCCs in the UK and Europe have achieved impressive growth over the last decade but the opportunities for growth in the short haul market are diminishing and the traditional market is fairly mature. Already, easyJet is operating into the medium haul market outside Europe, such as Moscow, Tel Aviv and Sharm El Sheikh. It is increasingly likely that European LCCs will seek out opportunities outside Europe, especially as the EU signs more open skies agreement with outside countries. Eventually, this may require these airlines to invest in long haul aircraft or, alternatively, new long haul LCCs may be set up.50
Norwegian Air Shuttle is embarking on long haul services using B787s. It is very conceivable that such services will be operating from Gatwick by 2030. This could occur in a number of ways, for example:
Norwegian could be operating some of its B787s from Gatwick to North America and Asia (it already has a base at Gatwick).
An existing LCC such as easyJet could purchase A330 or A350 aircraft and operate service to North America, the Caribbean, Africa or Asia. Although no UK based LCC has yet indicated an interest in long haul traffic.
A new LCC could be established at Gatwick based around a long haul business model.
Equally, by 2030, LCCs may be have established codesharing or similar partnerships with long haul carriers, similar to those established in Asia and North America. While currently no UK-based LCC has expressed an interest in such a venture, the successes achieved elsewhere
48 http://centreforaviation.com/analysis/japan-airlines-and-jetstar-japan-embrace-lcc-hybridity-codesharing---and-reap-rewards-99499.
49 Ibid.
50 Ryanair CEO, Michael O’Leary has indicated an interest in setting up a long haul LCC separate to Ryanair.

Assessing Connectivity in the UK’s Air Transport Market
17 July 2013
51
may persuade some LCCs to export this opportunity.51 This new model of connecting traffic is unlikely to emerge at Heathrow, even with runway expansion. The higher costs, operational restrictions and the dominance by certain carriers are likely to make Heathrow unattractive to most low cost carriers. Therefore, the emerging model of connecting model will be best facilitated by expansion at other airports that have a history of low cost carrier operations, and which are not dominated by a single carrier and its alliances.
While these scenarios may seem inconceivable at the moment, consider that the idea of LCCs taking part in codeshare agreements would have seemed far fetched 10 years ago. Consider also the alternative if UK LCCs do not pursue these types of strategy. These LCCs will be restricted to seeking out growth in the point-to-point markets largely within Europe (plus some parts of Central Asia and North Africa). As time goes on, these markets will be more and more saturated, and their ability to stimulate demand will become much more limited. Facing stagnation, the carrier will only be able to achieve growth by competing market share from other carriers, weakening profitability.
6.3 Changing Alliances
Approximately 60% of global passenger traffic is carried on one of the three major airlines alliances: Star Alliance, oneworld or SkyTeam. 52 For Heathrow, this proportion is likely even higher. The current membership of the alliances is provided in Figure 6-1. Notable airlines that have not joined an alliance include the Virgin group of airlines, Emirates and Etihad. No LCCs have joined an alliance, with the possible exception of Air Berlin, which joined in oneworld in 2012, although this carrier has many characteristics of a network carrier. 53
It should be noted that these alliances are in a constant state of flux and could be quite different in the future. For example, the U.S. carrier mergers have seen Continental leave SkyTeam in 2009 (as did Copa Airlines) ahead of its merger with United. US Airways will leave Star Alliance following the completed merger with American Airlines. It remains to be seen whether Delta’s alliance with Virgin Atlantic with result in Virgin joining SkyTeam.54
The previous section provided examples of alliance and non-alliance carriers forming partnerships with LCCs. Equally, partnerships between network carriers, both within and outside alliances, are subject to change. A recent and prominent example is the partnership between Qantas and Emirates. Starting in April 2013, Qantas flights to Europe (and some other parts of the world) will stopover at Dubai and the two carriers will codeshare over large parts of each other’s networks. It brings to an end a nearly 20 year old partnership with British Airways which connected passengers between London and Australia over Singapore. The partnership may have future implications for Qantas’ membership of oneworld, especially given the entry of Qatar Airways into that alliance.
51 EasyJet does have an arrangement with Emirates allowing Emirates Skywards members to redeem their points with easyJet.
52 Source: CAPA, Centre for Aviation.
53 Air Berlin used to operate an LCC business model, but more recently has taken on characteristics of a network airline, such as facilitating connections and operating a wider range of aircraft types.
54 http://www.virgin-atlantic.com/gb/en/travel-information/customer-service/latest-news/strategic-alliance-with-delta-airlines.html.

Assessing Connectivity in the UK’s Air Transport Market
17 July 2013
52
Figure 6-1 Airline Alliance Members May 2013
Adria Airways
Aegean Airlines
Air Canada
Air China
Air New Zealand
ANA
Asiana Airlines
Austrian
AviancaTaca
Blue1
Brussels Airlines
Copa Airlines
Croatia Airlines
Egyptair
Ethiopian Airlines
LOT Polish Airlines
Lufthansa
Scandinavian Airlines
Singapore Airlines
South African Airways
Swiss
TAM Airways
TAP Portugal
Thai
Turkish Airlines
United
US Airways
Aeroflot
AerolineasArgentinas
Aeromexico
Air Europa
Air France
Alitalia
China Airlines
China Eastern
China Southern
Czech Airlines
Delta Air Lines
Kenya Airways
KLM
Korean Air
MEA
Saudia
TAROM
Vietnam Airlines
XiamenAir
Air Berlin
American Airlines
British Airways
Cathay Pacific
Finnair
Iberia
Japan Airlines
LAN Airlines
Qantas
Qatar Airways*
Royal Jordanian
S7 Airlines
Source: Airline alliance websites. * Announced 9th October 2012.
Assessing Connectivity in the UK’s Air Transport Market
17 July 2013
53
Another example is the commercial agreement between the Air France/KLM group, Air Berlin and Etihad, announced in November 2012.55 The agreement includes code-sharing between the Air France/KLM and Air Berlin on some European routes (Etihad has a 29.2% holding in Air Berlin) and a strategic partnership between Air France/KLM and Etihad involving code-sharing across their respective networks and eventual integration of frequent flyer programs. This agreement overlaps with two alliances - Air France/KLM is an anchor airline in SkyTeam and Air Berlin is a member of oneworld.
These recent partnerships involving Emirates and Etihad show that some carriers are choosing to benefit from the connectivity offered by Middle Eastern carriers rather than fight these carriers head on. This could result in a greater shift of connecting activity towards the Middle East and away from Europe (and away from Asian hubs such as Singapore).
As these examples illustrate, airline alliances, partnerships and joint ventures are constantly changing. The airline relationships that contribute to the UK connectivity today may be quite different in 10-20 years.
6.4 Conclusions
The key point in this chapter is the aviation industry is constantly changing and evolving. Deciding London’s future airport capacity based on the current status quo risks limiting London’s future traffic development and the benefits to consumers. In this chapter, a number of industry trends were identified that could substantially change the aviation industry structure and future infrastructure requirements. However, we acknowledge that there may be other unanticipated trends and other events that will impact on the aviation industry.
The important consideration is that the chosen airport infrastructure solution is one that is robust and flexible to future changes in the industry and in aviation demand. This robustness comes about not just from increased capacity but also by fostering competition. These competition dynamics will lead to competitive pricing, will spur innovation and will ensure that London’s airports can respond to changing market conditions, maximising benefits for consumers and ultimately the wider society.
The next chapter illustrates the robustness of Gatwick’s proposal to a variety of possible future scenarios. Whether there is a move of airline alliances to Gatwick or the development of LCC connectivity and long haul routes, a second runway at Gatwick ensures that high levels of connectivity can be achieved for London and the UK.
55 http://centreforaviation.com/analysis/etihad-ties-up-with-air-france-klm-next-qatar-oneworld-and-the-aviation-world-turns-on-its-head-84721.
Some carriers are choosing to benefit from the connectivity offered by Middle Eastern carriers rather than fight it.
Deciding London’s future airport capacity based on the current status quo risks limiting London’s future traffic development and the benefits to consumers.

Assessing Connectivity in the UK’s Air Transport Market
17 July 2013
54
7 A Demonstration of National Incremental Connectivity Benefits of Dual Gateway Airports: The Fallacy of One Hub or None
7.1 Introduction
The arguments in the previous chapters are largely conceptual, although based on fundamental economic and airport operating principles. We now turn to a practical examination of the issues.
In a separate report (London Airport Capacity QSI Scenario Analysis), we utilised airline route planning software to evaluate three main scenarios:56
1) Scenario 1 - Third Heathrow Runway This scenario assumes the construction of a third runway at Heathrow, with no development at Gatwick. In this scenario we assume that network carriers of all alliances (and non-aligned carriers) will have greater scheduling flexibility at Heathrow than at present, and the ability to add new destinations and increase frequencies on existing routes at Heathrow, resulting in improved connectivity for passengers travelling to, from and via Heathrow.
2) Scenario 2 – Gatwick Alliance Gateway This scenario envisions the development of a second runway at Gatwick, with no change in runway infrastructure at Heathrow. In addition, with continuation of the capacity constraint of only two runways at Heathrow, by the year 2030 the scenario assumes a corresponding shift of a major alliance’s London operations from Heathrow to Gatwick.57 The scenario further assumes that the alliance shift results in some improvement in available capacity at Heathrow, allowing some new entrants to Heathrow under slot allocation rules which give preference to entrants, and those incumbent carriers that remain at Heathrow could expand their operations there somewhat, including enabling carriers currently with split Heathrow/Gatwick operations to consolidate at one of the airports.
3) Scenario 3 – Gatwick Independent Gateway This scenario also involves the construction of a second runway at Gatwick, with no new runway at Heathrow. However, this scenario assumes no wholesale transfer of an alliance’s operation from Heathrow to Gatwick. It is assumed that carriers at Gatwick partner to facilitate passenger connectivity, particularly between LCCs and network carriers, and that some LCCs start to operate long haul services (See Chapter 6 for more discussion on evolving LCC business models).
In addition to the scenarios outlined, a “base case” has also been modelled assuming that no runway capacity is added to any London airport, to act as a baseline for comparison. The
56 We used Sabre Technology’s Planet route evaluation system. This is a widely used route evaluation package.
57 This is similar to the analysis described in Chapter 4 of the Airport Commission’s Discussion Paper 4, Airport Operating Models.

Assessing Connectivity in the UK’s Air Transport Market
17 July 2013
55
scenarios are reasoned outcomes of future traffic development under different capacity increases. They have been developed using plausible and realistic assumptions for building flight connectivity, although our modelling does not necessarily represent an optimized network or schedule. That would require additional analysis which could show even greater gains in connecting traffic in this scenario.
Given the timeline required to approve and build a new runway at any London airport, any analysis of subsequent traffic impacts must be placed in a future context. Therefore, the analysis in the study has been conducted based on air service scenarios set in the year 2030. Given the timeline considered (17 years from now), assumptions have necessarily been made regarding future market growth, air service supply, and even airline business models. These assumptions are detailed in the separate report.
7.2 Traffic Impacts of Alternative Capacity Options at Heathrow and Gatwick
This section provides a summary of the model results from the two scenarios. Full details of the results are provided in the separate report. The forecast traffic in each scenario is summarised in Figure 7-1. These match the air traffic forecasts produced by SH&E on behalf of GAL.
When constrained (in the base case), Heathrow and Gatwick are forecast to serve approximately 120 million annual passengers (combined) by 2030 in the absence of any runway development at either airport. By comparison, with a third runway at Heathrow it is forecast that the two airports combined will serve 142 million passengers; with a second runway at Gatwick (either with or without an alliance transfer), a total of 137 million passengers are forecast to use the two airports. The difference between the 137 and 142 million passengers (a 3% gap) is a function of the analysis being set in 2030, during the spooling phase shortly after a new Gatwick runway would open. The expectation is that airlines would continue to add service at Gatwick in the years following, and that this differential in total Heathrow+ Gatwick traffic would decline (or reverse) in subsequent years.
Figure 7-1: 2030 Heathrow and Gatwick Traffic Forecasts (Millions)
LGW R2 - Indep

Assessing Connectivity in the UK’s Air Transport Market
17 July 2013
56
Under each scenario, the forecast proportion of local (London origin/destination) and connecting traffic differs, primarily as a result of the degree of connectivity generated by the incremental flights. The results are summarised in Figure 7-2.
Under the base case scenario (no capacity increase), 31% of Heathrow’s traffic is forecast to be connecting passengers in 2030, while 69% are forecast to be London O/D travellers. By comparison, just 4% of Gatwick’s passengers are forecast to be connecting in the base case.
In Scenario 1 (Third Heathrow Runway), the third runway at Heathrow results in new flights and improved connectivity, resulting in an increase in the proportion of connecting passengers at the airport, to 34%. With no change in runway capacity at Gatwick, connecting traffic is expected to mirror the base case at 4%.
In Scenario 2 (Gatwick Alliance Gateway), the additional runway capacity at Gatwick and the vacated slots at Heathrow resulting from the alliance move to LGW provide the opportunity to improve connectivity at both airports. At Heathrow, connecting passengers are forecast to make up 39% of the total (higher than resulting from a third runway at Heathrow), while Gatwick is forecast to increase its proportion of connecting passengers to 21%. In Scenario 3, (Gatwick Independent Gateway), Gatwick’s proportion of connecting traffic is forecast to be 17%, a significant increase relative to the base case. The figure is lower than in Scenario 2, as it lacks the level of service co-ordination that would arise from an alliance move to Gatwick.
Figure 7-2: 2030 Forecast Local and Connecting Traffic

Assessing Connectivity in the UK’s Air Transport Market
17 July 2013
57
In summary, the key findings of this analysis are:
The second runway at Gatwick results in similar levels of traffic for combined Heathrow+ Gatwick as the third runway at Heathrow would. The analysis first projected unconstrained demand for air travel, but then constrained the forecast to the likely seat capacity at Heathrow and Gatwick in 2030, aligning it with the forecast produced by SH&E. The Gatwick Alliance Gateway scenario is forecast to result in highest combined traffic (unconstrained) for the two primary London airports, a result of having two effective gateways which can better compete for connecting traffic. This is followed by the Gatwick Independent Gateway scenario, which is also forecast to result in higher combined traffic (unconstrained) than building a third runway at Heathrow.
However, sufficient airport capacity will not exist in 2030 to meet unconstrained demand. After incorporating traffic spill to account for the capacity constraint, the three scenarios result in similar combined traffic volumes. (Total 142 million for a third runway at Heathrow, vs. 137 million for a second runway at Gatwick).
The difference between the 137 and 142 million passengers (a 3% gap) is a function of the analysis being set in 2030, during the ramping phase shortly after a new Gatwick runway would open. Forecasts produced by SH&E for the period after 2030 up to 2050 indicate that airlines would continue to add service at Gatwick in the years following, and that a second runway at Gatwick would result in higher combined traffic volumes than a third runway at Heathrow.
Both Gatwick runway two scenarios results in greater levels of connecting traffic for the combined Heathrow Gatwick market. In the Gatwick Alliance Gateway scenario especially, the additional runway capacity at Gatwick and the vacated slots at Heathrow provide the opportunity to improve the connecting product at both airports.
In addition, as will be discussed in the next chapter, the scenario with a second runway at Gatwick produces a large price competition benefit for London and the UK. Heathrow is already dominated by a one airline which currently holds rights to 50.6% of Heathrow slots, and including its alliance partners has access to 60.5%. If additional runway capacity is created at Heathrow, normal slot allocation rules will result in the dominant carrier and its alliances getting access to the largest block of the new Heathrow slots. The scenario with an additional LHR runway is thus likely to increase dominance at Heathrow, and hence for London airports in general (as in this scenario the other airports have no increase in capacity).
In contrast, under the scenarios with a second runway at Gatwick provides not only a greater increase in connecting traffic across London airports, but it also stimulates airport competition.

Assessing Connectivity in the UK’s Air Transport Market
17 July 2013
58
7.3 Implications for Connectivity
Section 4.3 examined the connectivity of Heathrow and Gatwick using the IATA Connectivity Index. This connectivity index can be applied to the result of the QSI modelling to provide an indicator of the possible connectivity impacts in 2030.58 The results are provided in Figure 7-3.
The absolute value of the connectivity index has no real meaning; it is the relative value of various connectivity options that are of interest. As described in Section 4.3, Heathrow has a much higher connectivity index than Gatwick, due largely to the strength of its connections to hubs in Europe, Middle East and North America.
As can be seen, the greatest connectivity growth achieved by 2030 is with a second runway at Gatwick in combination with an alliance move to Gatwick. This is projected to increase the combined (Heathrow + Gatwick) IATA index by 22%, higher than the increase with a third runway at Heathrow. A second runway at Gatwick with no alliance produces a slightly lower connectivity increase (16%), although difference between the scenarios is small. Thus, the analysis indicates that a second runway at Gatwick can offer similar levels of connectivity to a third runway at Heathrow. In fact, preliminary research indicates that the connectivity improvement is even greater with a second runway at Gatwick after 2030, as traffic at that airport develops even further (additional details will be provided in later submissions).
Figure 7-3: IATA Connectivity Index for the 2030 Scenarios
Current (2012)
LHR R3 R2 LGW - Alliance
R2 LGW - Independent
Heathrow 297 356 282 302
Gatwick 59 64 151 112
Total 356 421 (+18%)
434 (+22%)
414 (+16%)
58 The destinations are weighted by their traffic size using in 2012 volumes. The picture will likely be different in 2030, but it is very difficult to obtain air traffic forecasts for 2030 for all the destination airports. Some experimentation was conducted using regional growth rate forecasts produced by Boeing and Airbus (e.g., for Asia, Europe, North America, etc.), which were applied to each airport in the respective regions. The results suggested that while the absolute connectivity scores changed, the relative difference between the options remained the same: LGW R2 - Alliance still had the highest connectivity increase and LGW R2 – Independent had the lowest.

Assessing Connectivity in the UK’s Air Transport Market
17 July 2013
59
7.4 Conclusions
This chapter examines three scenarios for capacity development in the London market with very different results:
Scenario 1: Third Heathrow Runway
Gatwick and then Stansted become capacity constrained.
No hub carrier emerges at these two airports, instead service is similar to present – point to point within Europe with some charter traffic.
The dominant carrier and alliance at Heathrow grows the most.
Limited airport competition, undermining the policy of breaking up BAA to foster airport competition.
Only a modest increase in total London connecting traffic.
Scenario 2: Gatwick Alliance Gateway
A group of alliance carriers move from Heathrow to Gatwick.
The dominant carrier at Heathrow is able to expand, using some of the slots freed up by an alliance move to Gatwick.
Greater level and proportion of connecting traffic at London airports.
Competing carrier alliances at competing airports.
Scenario 3: Gatwick Independent Gateway
Gatwick LCCs and other carriers begin offering connecting itineraries within their own networks. This is already common among LCCs outside of Europe (Southwest Airlines, WestJet, JetBlue, etc.).
Gatwick LCCs will begin offering connecting itineraries to/from other airlines. This is increasingly common among LCCs outside of Europe (See Chapter 6), and examples of external cooperation among European LCCs are emerging (e.g., easyJet has partnered with Emirates to accept Skywards Miles bookings on easyJet flights).
LCCs will offer long haul services to/from Gatwick. Long haul LCC flights are increasing around the world, and one Gatwick-based LCC, Norwegian, is launching long haul services this year.
Gatwick is able to compete with Heathrow acting as platform for innovative airline businesses.
Greater level and proportion of connecting traffic at London airports.

Assessing Connectivity in the UK’s Air Transport Market
17 July 2013
60
These results confirm the key propositions of this report, that there are diminishing returns to connectivity and that airport competition can emerge in London’s enormous market. The Heathrow runway scenario actually produces a smaller increase in connecting traffic than some Gatwick runway scenarios. It can be concluded that there is little or no connectivity gap associated with a second runway at Gatwick, while at the same time this option provides the benefit of greater competition, greater robustness, better noise impacts, etc.
It may be hard for some to envision Gatwick becoming major competing gateway for London, but it must be kept in mind that this scenario is some 17 years into the future, during which time there will be considerable changes to the aviation industry. There is historical precedent for airports merging as new major airports or gateways:
In the early 1980s, Newark had limited scheduled services and very little international service (at the time most international services operated from JFK). It largely acted as a hub for an early LCC, People Express. However, this changed with the start of services to London by Virgin Atlantic in 1984 and the merger of People Express and Continental Airlines in 1987. The airport went to become a major international gateway and airline hub.
Until 2007, Haneda Airport in Tokyo was operated as a domestic airport as dictated by government policy. The government removed the requirement to only operate domestic services and, following the building of an additional runway (completed in 2010), the airport has attracted significant volumes of international traffic (in 2012, it handled 7.9 million international passenger).59 The airport now serves as a domestic and international hub alongside Narita Airport, Tokyo’s main international hub.
In China, Guangzhou Baiyun International Airport was a limited domestic hub nearly 10 years ago, with almost no international traffic. Now it is emerging as an intercontinental gateway. Shenzhen International Airport is undergoing this transformation right now.
In Moscow, Domodedovo International Airport (DME), has grown rapidly over the last decade or so to become the largest airport serving the Russian capita overtaking Sheremetyevo International Airport (SVO).
Clearly, it is possible to have two airports competing as gateway airports, particularly in a market the size of London. The next chapter discusses the benefits of this airport competition for consumers and the economy.
59 Source: Tokyo International Airport Terminal.

Assessing Connectivity in the UK’s Air Transport Market
17 July 2013
61
8 The Importance of Competition and the Price of Air Access in Connectivity
8.1 Introduction
Until the late 1970s/early 1980s, much of the aviation industry (airlines, airports and air navigation) were government run as monopolies or private companies heavily regulated by governments (e.g., the U.S. airline industry). However, it became widely recognised that government control of the industry was not working. Competition was being severely hampered, resulting in inefficiencies, high prices and poor service quality for consumers. Recognising the potential benefits of greater competition, many governments started deregulating the aviation industry (along with other industries) in the late 1970s.
One of the earliest instances of liberalisation was the deregulation of the U.S. domestic air market in 1978. Prior to deregulation, pricing and route entry on domestic routes in the U.S. was tightly controlled by the government. Deregulation removed all of these controls and allowed market forces to determine service and price levels. The UK was also an early adaptor of deregulation with the privatisation of British Airways and British Airports Authority (BAA) in 1987. Deregulation has also been pursued within the European Union (EU) - between 1987 and 1993, the EU introduced three packages of reforms that almost fully deregulated the EU air market. Carriers from within the EU are now free to operate any route within the EU without restriction on price or capacity, including cabotage (i.e., domestic air travel within a member state), which has been permitted since 1997.
The UK further addressed the issue of competition by requiring BAA to divest itself of three airports: one of the competing Glasgow – Edinburg pair of airports, and two of the three London airports it operated. These divestitures were bold but difficult policy decisions. The willingness to make these decisions reflects the great importance government places on air transport competition in enabling economic prosperity and social connectivity.
8.2 The Dramatic Impact of Competition
The introduction of greater competition to aviation market substantially restructured the industry and brought about significant benefits for consumers. For example, a 2003 study by the European Union found that the liberalisation of the EU air market (the single aviation market) had resulted in the following:60
Increased route competition. Between 1992 (the year before the EU air market was fully liberalised) and 2000, the number of intra-EU routes served by more than two carriers increased by 256% while the number of domestic (within member state) routes with more than one carrier had increased by 88%.
60 European Union (2003), “European Experience of Air Transport Liberalisation,” Joint Presentation by the European Union and the European Civil Aviation Conference to the 5th Worldwide Air Transport Conference (ICAO).The analysis consisted of a before-and-after comparison of fare and traffic.
Assessing Connectivity in the UK’s Air Transport Market
17 July 2013
62
Reduced fares. In real terms (i.e., after adjusting for inflation) discount economy fares, which represent the vast majority of tickets purchased, declined 34% between 1992 and 2000. Over the same period, full economy fares declined 5% in real terms.
Increased routes and capacity. There was a strong rise in the number of city-pairs served and in overall capacity provided in the EU market. The total number of intra-EU city-pairs increased 74%, while the number of domestic city-pairs increased 12% between 1992 and 2000. Both the number of flights and seats operated increased by an even greater amount, indicating that overall capacity has increased substantially.
Considerable research has established that the introduction of greater competition through liberalisation/deregulation led, overall, to lower air fares and greater consumer choice (more routes, more carriers, greater frequencies).61 The lower air fares resulting from competition are particularly important as fares are an important driver of demand for air transport. Empirical research has found that there was a significant demand response to changes in air fares.62 The response to air fares depends on the market and trip purpose (leisure travellers are more price sensitive to fare changes than business travellers), but the elasticities have tended to range from -0.5 to -2.0, as shown in Figure 8-1. In other words, a 10% decline in air fares increases demand by 5-20%.
61 For example, see: D. Graham and P. Kaplan, “Efficiency and Competition in the Airline Industry” Bell Journal of Economics, 1983, Vol. 14, No.1, pp 118-138. “The Economic Impact of Air Service Liberalisation”, InterVISTAS-ga2, June 2006. UK CAA, “UK-India Air Services: A Case Study in Liberalization”, 22 November 2006. Piermartini, R. and Rousová, L. (World Trade Organization), “Liberalisation of Air Transport Services and Passenger Traffic”, Staff Working Paper, December 2008.
62 For example, see: Air Travel Demand Elasticities: Concepts, Issues and Measurement, D. Gillen, W.G. Morrison and C. Stewart, 2002. Estimating Air Travel Demand Elasticity, an IATA report produced by InterVISTAS in 2007.

Assessing Connectivity in the UK’s Air Transport Market
17 July 2013
63
Figure 8-1 Own-Price Elasticities of Demand (Gillen et al., 2002)
Reproduced from: Air Travel Demand Elasticities: Concepts, Issues and Measurement, D. Gillen, W.G. Morrison and C. Stewart, 2002.
Thus, competition in the aviation market can contribute to air service becoming more accessible and more affordable. As described in Chapter 4, this in turn can provide benefits to the wider economy (catalytic impacts):
Trade in Services. The trade in services is about people. Face-to-face meetings play a crucial role in making sales and delivering services. The ability to be at a client’s side rapidly and cost-effectively is important to many service industries. Much of the time, these functions cannot be replaced by teleconferencing or other forms of communication.
Trade in Goods. As noted previously, although air cargo accounts for 0.5% of the volume of global trade shipments, it accounts for over 35% by value, meaning that air cargo is high value, often times perishable or time-sensitive.63 Air transport not only supports the export of UK goods to overseas markets but also the supply of parts and machinery necessary for production processes in the UK.
Tourism. The majority of tourists from other countries arrive in the UK by air. Affordability of air travel service and air connectivity are two critical elements in attracting tourists.
Investment and Innovation. The contribution of affordable and accessible air connectivity may be less apparent than with trade and tourism. However, the research presented in Chapter 4 illustrates how connectivity contributes to investment and business location
63 Air Transport Action Group (ATAG), “Aviation Benefits Beyond Borders”, March 2012.
Long-haul international business:
Long-haul international leisure:
Long-haul domestic business:
Long-haul domestic leisure:
Short-haul business:
Short-haul leisure:
More Elastic Less Elastic
-2 -1.5 -1 -0.5 0
-0.475 -0.198
-0.265
-0.836
-0.56-1.7
-1.04
-1.15
-1.428
-1.104
-0.787-1.228
-0.7
-0.783 -0.595
-1.520
-1.288-1.743

Assessing Connectivity in the UK’s Air Transport Market
17 July 2013
64
decisions. Clearly, air transport is not the only factor affecting investment and business locations, but poor or high cost connectivity has a proven detrimental impact.
Long-Term Productivity. Again, the effect is less visible but there is research supporting the idea that aviation can contribute to the productivity of an economy.
8.3 Airport Competition
Prior to deregulation, airports were seen as, and generally operated as, monopoly providers of services to both airlines and passengers. Airports were not perceived as being subject to competitive forces. The commonly held view was that there was little an airport could do to increase demand for its services or divert demand from other airports.
However, as a result of deregulation, airlines have become much freer to operate out of any airport of their choosing. Deregulation was critical in the development of low cost carriers (LCCs), who often operate out of secondary airports with lower costs and no congestion, challenging the notion that airports were absolute monopolies.
Today, there are a number of ways in which airports can potentially compete with each other:64
Competition for a shared local market. Where airports are located in close proximity of each other, they compete for both passengers and air service. Many cities have two or more airports through which passengers can access air service. For example: Heathrow, Stansted, Gatwick, London City and Luton at London; Charles de Gaulle and Orly at Paris; JFK, Newark and LaGuardia at New York. In many cases, the airports do not all serve the same routes, however, there can be overlap between the airports. For example, four out of the five London airports mentioned have direct service to Paris (as of April 2013).
Competition for connecting traffic. Passengers (and sometimes airlines) can switch to alternative connecting hubs. For almost all connecting traffic there are alternative connecting points. A passenger travelling from Aberdeen to Rome can get there via London, Paris, Amsterdam, and so forth. Connecting traffic can easily shift from one airport to another if cheaper, faster and/or more convenient connections become available.
Competition for cargo traffic. Cargo is highly price sensitive and can switch to alternative routing or other modes. E.g., if cargo rates in Amsterdam are high, the cargo can be flown to Brussels and trucked to its final destination.
Destination competition. Airports have a role in competing for destination traffic, as they are part of the overall tourism package offered by a destination. The quality, cost and scope of service offered at an airport impacts on the overall attractiveness of a destination. As the scope and frequency of air service to and from an airport increases, so does the overall attractiveness of the destination served by the airport
The dynamics of airport competition are closely linked with those of airline competition. In a situation where two airports have overlapping catchment areas, the airlines at each of the airports will compete with each other for the same passengers. For example, easyJet at Gatwick competes with British Airways at Heathrow for some passengers in the London region on those routes that both carriers serve. However, these same airports will also compete with
64 Kincaid, I. and Tretheway, M., “Competition Between Airports: Occurrence and Strategy, in Airport Competition”, eds: Forsyth, Gillen, Ashgate publishing, 2010.

Assessing Connectivity in the UK’s Air Transport Market
17 July 2013
65
each other to attract new air services to their airports (or retain existing ones).65 For example, Heathrow and Gatwick will compete with each other for new long haul services from Asia.
This competition dynamic is good for consumers, providing a greater choice of routes and ensuring competitive prices (air fares). However, this competition is only truly effective if there is a reasonably level playing field between the competing airports. If one airport has a dominant position then the competition effects are weakened (this is discussed further below).
8.4 Empirical Evidence on Airport Competition Dynamics
A number of studies have examined various areas of airport competition dynamics and concludes with their implications for the London market.
8.4.1 Airport Choice Behaviour
A considerable body of research has examined the factors affecting airport choice in markets served by more than one airport. For example, the New York market, San Francisco/Oakland and the London market. This research has used forms of discrete choice models, where the passenger’s choice of airport is a function of factors such as distance to the airport, air fares, frequency, availability of direct service, etc. The models are estimated using either survey data (Stated Preference) or using actual passenger data (Reveled Preference). Examples of this research include:
Hess, S. and Polak, J.W. (2006), Airport, airline and access mode choice in the San Francisco Bay area, Papers in Regional Science, 85 (4), pp. 543 – 567.
Luken B. and Garrow, L. (2011), Multiairport Choice Models for the New York Metropolitan Area: Application Based on Ticketing Data, Transportation Research Record: Journal of the Transportation Research Board, Vol. 2206, pp. 24-31.
Hess, S. and Polak, J.W. (2006), Exploring the potential for cross-nesting structures in airport-choice analysis: A case-study of the Greater London area. Transportation Research Part E: Logistics and Transportation Review, 42 (2). pp. 63-81.
The CAA and NATS used a similar methodology in the Second Passenger Access Model (SPAM) UK air traffic forecasting model. A typical result from these types of studies is that passengers are willing to trade off air fare, frequency, access time and other factors in their selection of airport. This is evidence of airport competition in some markets with shared catchment areas. For example, airports (and the airlines they serve) can attract more passengers by lowering their fees.
65 This is illustrated by the amount of air service development work carried out by most airports, including global and regional Routes conferences attended by airports and airlines.

Assessing Connectivity in the UK’s Air Transport Market
17 July 2013
66
8.4.2 Hub Premium at Dominant Airports
There is considerable evidence (largely from the U.S.), that dominant airlines at hub airports are able to charge a “hub premium”, exploiting their market position. Following deregulation in 1978 in the U.S., hub and spoke networks emerged as the preferred network structure for U.S. carriers. Research on fare data found that fares were higher for trips that originated from concentrated hub airports. For example, a 1990 study by the U.S. General Accounting Office, found that yields were 27% higher at 15 hub airports dominated by one or two carrier than at airports with no significant airline concentration.66 However, some of these early findings were criticised for not controlling for other market characteristics that might explain why hubs would naturally have higher fares, such as traffic mix, carrier identify and unit-cost differences.
To address this, researchers began to estimate statistical regression models, which allowed for explanatory control variables that could separate out the effects of market characteristics from the hub dominance effect. While not the first researcher to undertake this type of analysis, Borenstein's 1989 paper is often cited.67 He found that a carrier with a 50% market share at both endpoints of a route sustained a fare, on average, 12% higher than a carrier with only a 10% market share at each endpoint. Similar research by Morrison and Winston found that a 33% hub premium estimated using the U.S. GAO methodology was reduced to between 4% and 10%.68 Therefore, despite refinements to the analysis, the research in the U.S. continued to find that there is a statistically significant effect of market concentration at hub airports on average air fares paid by consumers.
There has been far less research of the hub premium in Europe, due in part to the lack of available fare data. However, one study did find that European carriers charged significant premium for direct flight from their hubs.69 The magnitude of the premium was estimated to be 15% for carrier operating from their hubs compared with other carrier at the airport, controlling for other factors.
8.4.3 Impact of Competition on Fares
Related to the hub premium, researchers have also examined the extent to which competition dynamics at or near to an airport can impact on fare levels. Again, this research is from the U.S. and much of it deals with the impact of Low Cost Carrier (LCC) competition.
One of the most widely cited studies is Morrison (2001) which examined the impact of LCC entry (specifically entry by U.S. carrier Southwest Airlines, one earliest and most successful
66 U.S. General Accounting Office (1990), Airline Competition: Higher Fares and Reduced Competition at Concentrated Airports, 1990.
67 Borenstein, S. (1989), “Hubs and High Fares: Dominance and Market Power in the U.S. Airline Industry”, The RAND Journal of Economics Vol. 20, No. 3 (Autumn, 1989), pp. 344-365.
68 Morrison, S. and Winston, C., The Evolution of the Airline Industry, 1995.
69 Lijesen, M., Rietveld, P., and Nijkamp, P. (2001), “Hub premiums in European civil aviation”, Transport Policy, 8(3), 193-199.
There is considerable evidence that dominant airlines at hub airports are able to charge a “hub premium”, exploiting their market position.

Assessing Connectivity in the UK’s Air Transport Market
17 July 2013
67
LCCs), on other routes from the same airport (referred to as "potential competition") and on competing parallel routes from nearby airports (referred to as "adjacent competition").70 Using regression analysis to control for other factors, the authors found that LCC presence as a potential competition on a route reduced fares by an average of 46% and that LCC presence on a competing parallel route as an adjacent competitor reduced average fares by between 15% and 26%, depending on route characteristics. Thus, LCC competition from a nearby airport can act as a competitive constraint on air fares at another airport.
A study by NERA for BAA in 2006 found a similar effect in the London market.71 Their research found that air fares on routes at Heathrow and Gatwick were impacted by the amount of LCCs operations on those same routes. As the volume of LCC operations on a route increased, the average fares at Heathrow and Gatwick declined.
Chu et al. (2012) also examined airport competition, separating out the effect of LCC and non-LCC competition at U.S. airports.72 The authors used fare data for around 2,000 U.S. domestic routes for the period 2003-06, controlling for other factors that might affect fares using regression analysis. The analysis showed that increased competition in adjacent markets within multi-airport metropolitan areas (measures in terms of the Hirschman-Herfindahl Index)73 had a statistically significant impact on yields. In other words, competition from airlines at one airport could act as a competitive constraint (in terms of fare levels) on airlines at another adjacent airport. This effects was found for both LCC and non-LCC carriers, although there was evidence that LCC presence resulted in larger fare declines (the analysis only examined the impact of at-airport LCC competition and did not include variables related to LCC competition at adjacent airports).
8.4.4 Limitation of the existing studies
We note that the empirical research to date, presented above, has limitations for quantitatively assessing the likely effect of increasing airport competition in the London market. Firstly, most of it is based on the U.S. domestic market and its applicability to the UK is problematic. Data is available that could be used to estimate European and potential UK specific effects. Secondly, none of the research addresses the specific question relevant to this discussion – does multi-airport competition lead to lower fares than single-airport markets? The research has been more focussed on LCC competition rather than airport competition dynamics. Those studies that found a large price reducing effect of airport competition did not identify whether the source of the fare difference was an LCC-competition effect versus and airport-competition effect.
70 Morrison, S. (2001), “Actual, Adjacent and Potential Competition: Estimating the Full Effect of Southwest Airlines”, Journal of Transport Economics and Policy, Volume 35, Part 2, May 2001.
71 BAA Response to CAA Policy Issues Consultation Paper BAA/Q5/100, March 2006. www.caa.co.uk/docs/5/ergdocs/dec05/baa.pdf.
72 Chu, W., Windle, R.J., and Hofer, C. (2012), Route competition in multi-airport cities: an analysis of US air fares, Transportation Journal 3 (51), pp. 265-288.
73 Hirschman-Herfindahl Index (HHI) is a standard measure of the degree of competition in a market. In this case, the HHI was the sum of the squared market shares of each carrier that operates on the airport-to-airport route.
Competition from airlines at one airport can act as a competitive constraint on airlines at another adjacent airport.
Assessing Connectivity in the UK’s Air Transport Market
17 July 2013
68
These issues could be addressed with new, additional analysis. One option would be to use U.S. fare data to develop analysis to answer questions around airport competition. Another option would be to use fare data for the UK and rest of Europe to produce an answer more tailored to the London market.
8.4.5 Conclusions on hub competition and air fares
A number of conclusions can be drawn from the empirical research summarised above:
There is evidence that competition exists between airports in the same region.
However, the degree or effectiveness of this competition can be impacted by whether one of the airports and its carriers has a dominant position in the market (i.e., a large market share and access to a large share of slots at an airport).
Competition from airlines at one airport can act as a competitive constraint on air fares at an adjacent airport.
The implications for the Commission is that great consideration should be given to options which enhance the competitive dynamics of the UK aviation market – this competition will ensure route development best meets the needs of the market and foster competitive pricing due to airport and airline competition. Options which only enhance the competitive position of certain players will ultimately be detrimental to airport competition in London.
8.5 Airport Competition in the London Market
In March 2009, the UK Competition Commission (CC) ordered BAA to sell both Gatwick and Stansted (as well as either Edinburgh or Glasgow).74 Its reasoning for the break-up of the BAA London airports was that common ownership of the three London airports was preventing competition between them and was distorting capacity development. In the CC’s view, the break-up of BAA would bring about substantial benefits for passengers and airlines, possibly including lower prices, improved service levels and more efficient investment in response to customer needs. The break-up of the BAA London monopoly was completed in 2013 following the sale of Gatwick in December of 2009 and the sale of Stansted in January 2013.
However, the CC acknowledged that even with the break-up of BAA, competition in the London market would be constrained, noting:
“At Heathrow, the UK’s only hub airport, BAA [now Heathrow Airport Limited] will continue to have substantial market power even after it no longer owns either Gatwick or Stansted.”75
“Heathrow’s position as the only significant hub airport in the South-East, and indeed the UK, is itself a feature that restricts competition between airports.”76
74 Competition Commission News Release: BAA Ordered to Sell Three Airports, 19 March 2009.
75 Ibid., page 2.
76 Ibid., page 4.

Assessing Connectivity in the UK’s Air Transport Market
17 July 2013
69
“… the intensity of price competition may initially be limited by current capacity constraints and price controls…”77
The CC recognised that the sale of the BAA London airports was only the beginning of the process to introduce greater competition to the London airport market. It also pointed to the need for capacity development to enhance competition between the London airports.
Research undertaken by the CC supports the potential for airport competition and the link with airport capacity. The CC found a significant degree of competition between some non-BAA airports in the UK, such as:78
Birmingham International Airport and East Midlands Airport;
Belfast City Airport and Belfast International Airport;
Cardiff International Airport, Bristol International Airport and Exeter International Airport;
Liverpool John Lennon Airport, Manchester Airport and Leeds Bradford International Airport; and
London Luton Airport and Stansted, in the past when there was spare capacity at those airports.
The CC saw evidence of declining yields from airport charges at regional airports, switching of passengers between pairs of regional airports and some switching by airlines. It found evidence of competition between airports for new routes and competition on service. The CC also found that such competition was generally strongest between airports with spare capacity or capacity that can readily be expanded.
The CC conclusions regarding the continued market power of Heathrow and the need for additional capacity in the London market has clear implications for the Commission’s review. It is our opinion that adding additional capacity at Heathrow will only strengthen Heathrow’s market dominance and weaken the competitive constraints on the airport. It will ensure that Heathrow can continue to exploit its role as the UK’s only hub airport and bring a halt to the opening up of competition that the CC has started. However, adding capacity to another London airport, and Gatwick is the most obvious candidate, would enhance the competitive dynamics within London. The additional capacity would act to spur competition between both Heathrow and Gatwick (and other London airports) who would seek to attract new carriers and retain existing ones.
77 Ibid., page 4.
78 Competition Commission, BAA airports market investigation: A report on the supply of airport services by BAA in the UK, 19 March 2009.
Adding additional capacity at Heathrow will only strengthen Heathrow’s market dominance and halt to the opening up of competition that the Competition Commission has started

Assessing Connectivity in the UK’s Air Transport Market
17 July 2013
70
8.6 The Airline Competition Link to Airport Competition
There is also an airline competition link. LHR is currently dominated by one carrier and its alliance partners. Figure 8-2 shows the number of weekly air transport movements (slots) by top 10 carriers serving Heathrow airport, as well as percentages of total weekly air transport movements at Heathrow for the summer of 2013.
Figure 8-2 Slot Allocation at Heathrow based on the Number of Air Transport Movements per Week Summer 2013
Carrier Number of Slots % of Total Slots
1. British Airways 4,825 50.6%
2. Lufthansa 510 5.4%
3. Virgin Atlantic 494 5.2%
4. Aer Lingus 330 3.5%
5. SAS Scandinavian 272 2.9%
6. United Airlines 252 2.6%
7. American Airlines 210 2.2%
8. KLM/ Delta Airlines 196 2.1%
9. Air Canada / Iberia / Swiss 168 / 168 / 169 1.8% / 1.8% / 1.8%
10. Air France/ Delta Airlines 140 1.5%
11. Other carriers 1,797 18.9%
Total 9,530 100.0%
Source: Airport Coordination Limited, Heathrow Airport Summer 2013 Start of Season Report. Note: Percent values may not add to 100% due to rounding.
British Airways controls over 50% of slots at Heathrow, a number which increased substantially after the takeover of BMI by British Airways completed in April 2012. Prior to the takeover of BMI, British Airways accounted for 44% of slots at Heathrow, meaning that the takeover of BMI resulted in a net 7% increase in the number of slots controlled by British Airways. More importantly, the oneworld air carriers control 61% of slots at Heathrow.79 If a new runway is built at Heathrow, and if normal slot allocation rules are followed, then, after allocation of some slots to new entrant carriers, a proportionate share of the new slots would accrue to oneworld carriers. This would reinforce the share of the dominant carrier and its partners. This
79 Source: “Why Delta and Skyteam need the Virgin Atlantic partnership and Heathrow slots,” 10 December 2012, Skift.com. Underlying source of data is Airport Coordination Ltd.
British Airways controls over 50% of slots at Heathrow. Oneworld controls 61%.
Assessing Connectivity in the UK’s Air Transport Market
17 July 2013
71
seems to undermine the intent of the BAA divestiture policy, which was intended to increase competition in the London and UK air transport sector, not reinforce hub dominance.
8.7 Enhancing Competition in the London Market: The Case of Moscow
A recent decision by the UK CAA illustrates how competition between airports (and the airlines at those airports) can be enhanced. The current air service bilateral with Russia designates two UK carriers to operate service between London and Moscow. Prior to British Airways’ takeover of BMI, the two selected carriers were British Airway and BMI, both of which operated from Heathrow.80 Following the termination of BMI services by British Airways after the takeover, the UK CAA was required to make a new determination in 2012 on designated UK carriers.81 The CAA considered applications from three carriers:
British Airways, which already operated 21 flights per week to Moscow (Domodedovo International Airport);
Virgin Atlantic, proposing to operate 14 flights per week to Moscow from Heathrow.
EasyJet, proposing to operating 14 flights per week to Moscow from Gatwick.
The CAA’s final decision was to allow British Airways to maintain its services and to award the second designation to easyJet operating from Gatwick. In awarding the second designation to easyJet rather than Virgin, the UK CAA made clear that this was done on the basis of maximising the competition effects:
“The CAA considers that easyJet’s proposal, by introducing an innovative product into the market, has the potential to deliver the greatest dynamic fare benefits, in particular by encouraging the removal of fare restrictions applied by incumbent carriers. The CAA has attached significant weight to the expectation of dynamic fare benefits in reaching its decision.” 82
The CAA also recognised the strong competition potential between Gatwick and Heathrow:
… the CAA considers that Gatwick and Heathrow can be considered to be in the same market, and therefore that there will be competition between services from the two airports. The CAA recognised the validity of comparisons between the Moscow route and Tel Aviv where there was evidence that a service operated from another London airport had posed a competitive constraint on a BA Heathrow service.” 83
80 In addition, Aeroflot and Transaero Airlines were the designated Russian carriers.
81 UK CAA, “Decision on Scarce Capacity Allocation Certificates, SCAC1/12”, October 2012.
82 Ibid. Page 32.
83 Ibid. Page 32. Note: easyJet also operates a service to Tel Aviv from Luton Airport.
The CAA recognises the importance of airport competition.

Assessing Connectivity in the UK’s Air Transport Market
17 July 2013
72
This decision indicates that the CAA, like the CC, recognises the importance of airport competition in maximising social welfare.
8.8 Conclusions Regarding Competition
The UK government has historically and recently placed great weight on competition in the air transport sector. It privatised both the national airline and the airport system. More recently BAA was required to divest itself of LGW, STN and one of the Scottish airports in order to enhance competition in city markets with multiple airports.
Studies have shown that increased competition has created significant benefits for travellers in terms of lower fares, greater choice and increased quality of service (e.g., higher frequency). While much of the attention and research has been on the fare impacts of competition, it is also true that competition spurs innovation and ensures that there is a dynamic response to the changing needs of consumers.
Airports compete with each other in a number of dimensions, including competition for the shared local market, for connecting passengers, for air cargo traffic with destination competition.
There is also an airline competition link of the potential decision on adding airport capacity in London. Because one carrier and its alliance partners control 61% of the slots at LHR, adding capacity there could reinforce hub dominance rather than enhance competition. This would seem to counteract the previous decision of government to require airport divestiture in order to enhance airport and airline competition.
The recent CAA decision on the carrier designations of Moscow routes recognised the consumer benefits of airport competition, particularly between Gatwick and Heathrow.
There are a number of studies that have documented the fare increasing effect of hub dominance. Thus, any policy on adding airport capacity should be guided to choices which enhance competition rather than reinforce existing hub dominance.
Assessing Connectivity in the UK’s Air Transport Market
17 July 2013
73
9 Overall Conclusions and Next Steps
There are a number of key points that can be drawn from the analysis in this report:
Connectivity is Not the same as Connecting Traffic
Connectivity is fundamentally about UK access to markets and regions. Ensuring that the UK is effectively and affordably connected to world markets and destinations should be the focus of the Commission’s analysis. Connectivity should not be confused with connecting traffic. Analysis of connectivity is more vital than assessing how to maximise the size of a mega-hub for a dominant carrier and its alliances, with large flows of international connecting passengers.
Connectivity is not simply a matter of the number of routes or number of frequencies operated from an airport or country. It also involves the price of access. A country or region that has expensive connections to other parts of the world will be a less desirable place to do business and will have lower national productivity than a country with affordable access to a broad range of markets, especially the fastest growing markets.
Connectivity Contributes to the UK Economy
The development of air connectivity is important for the UK economy as a whole, not just the aviation industry. In economic terms, air travel is a factor of production for another activity – a means to an end. In order for these other needs to be met effectively, air travel should be convenient, available and affordable. In other words, aviation connectivity facilitates the growth and development of many other sectors of the economy. This sometimes referred to as catalytic impacts or wider economic benefits. There are a number of ways in which aviation connectivity can contribute to the wide economy. These include:
trade in services;
trade in goods;
tourism;
business investment and innovation; and
productivity.
Domestic Connectivity Requires Careful Evaluation
Much has been made of the idea that capacity constraints at Heathrow have squeezed out UK domestic routes. There may be some of truth to this. However, caution is urged in interpreting the limited domestic connections of Heathrow (and the other London airports). Connections to many points in the UK may not be viable for air carriers due to the short distances involved and the availability of effective alternatives (road and rail). In other words, some of the domestic connectivity is being provided by other modes which are more suited to the distances and passenger volumes involved. In fact, 60% of the UK population is within three hours driving time of London Airports and a full 80% within a four hour drive. Road and rail access to London airports may be a better form of connectivity for outlying communities than small aircraft and higher fare connecting flights to long haul services at CDG and AMS. Further, CDG and AMS themselves experience the same phenomena.

Assessing Connectivity in the UK’s Air Transport Market
17 July 2013
74
E.g., many of their outlying communities in northern France are connected to London, but not to CDG.
Heathrow may not be losing out to other European hubs any more than the European hubs are losing out to Heathrow in the other direction, and adding capacity at Heathrow will not necessarily result in service to Birmingham, Bristol, etc.
London is the World Largest Air Market
As documented in Chapter 2, the combined passenger traffic at the five main London airports significantly exceeds that of any other city in the world (the next largest is New York, followed by Atlanta, Tokyo, Paris and Beijing). The combined total of the top three airports (Heathrow, Gatwick and Stansted) is still larger than New York. Remarkably, the vast majority of this traffic (approximately 87%) is O/D traffic not connecting traffic.
Thus, the London market is capable of sustaining multiple airports and well positioned to support two or more gateway airports.
There are Limits to the Benefits of Connectivity at a Single Airport
There are both supply and demand reasons why the gains from connectivity at a single airport are not limitless. In the parlance of economics, there are diminishing returns to connectivity at any single airport. There are a number of reasons for this:
The S-curve effect. The S-curve effect is a well-established phenomenon, which has one of the characteristics that as carriers with high frequency shares capture a declining incremental share of the traffic as they increase frequencies.
Diminishing returns to destinations in a region. Once an airport starts serving a region of the world, service to additional destinations in that regions have a diminishing benefit to the economy.
Supply side limits to airport connectivity. The total capacity of an airport is limited by maximum aircraft size that can be support on the routes that it serves and the exponential increase in the complexity of operating an airport with a large number of runways.
The UK’s Airport Capacity Solution Needs to be Robust to the Evolution of the Aviation Industry
The aviation industry is constantly changing and evolving. Deciding London’s future airport capacity based on the current status quo risks limiting London’s future traffic development and the benefits to consumers. In this report, a number of emerging industry trends have been identified such as long haul Low Cost Carriers (LCCs), partnerships between LCCs and network carriers, and the constant evolution of airline alliances. All of these trends could substantially change the aviation industry structure and future infrastructure requirements. Furthermore, there may be other unanticipated trends and other events that will also impact on the aviation industry.
The important consideration is that the chosen airport infrastructure solution is one that is robust and flexible to future changes in the industry and in aviation demand. This robustness comes about not just from increased capacity but also by fostering competition.

Assessing Connectivity in the UK’s Air Transport Market
17 July 2013
75
These competition dynamics will lead to competitive pricing, will spur innovation and will ensure that London’s airports can respond to changing market conditions, maximising benefits for consumers and ultimately the wider society.
Airport Competition Driving More Affordable Air Transport Access is an Important Part of Connectivity
Great weight should be given to options which enhance the competitive dynamics of the UK aviation market – this competition will ensure route development best meets the needs of the market and foster competitive pricing due to airport and airline competition.
Options which only enhance the competitive position of certain players will ultimately be detrimental to airport competition in London. For example, there is considerable evidence (largely from the U.S.), that airlines at dominant hub airports are able to charge a “hub premium”, exploiting their market position. However, there is also evidence that these hub premiums can be reduced or eliminated by competition from other airports.
It is Possible to Sustain a Two Gateway Airport System in London
Analysis undertaken by InterVISTAS demonstrates that it is feasible for the London market to support two competing airport gateways. Heathrow and Gatwick operating as independent, competing gateway airports have the potential to offer similar levels of connectivity to a mega-hub at Heathrow and induce higher not lower levels of connecting traffic in the London market.
Expanding Capacity at Gatwick Rather than Heathrow Will Bring Greater Benefits for the UK Economy
An additional runway at Gatwick has the potential to offer similar connectivity benefits to that of another runway at Heathrow. However, it also has the substantial benefit of enhancing the competition dynamics of the London market.
The Competition Commission’s 2009 decision to break up the BAA monopoly of London airport was designed to enhanced competition in the London airport market. However, even with the break-up, the Competition Commission recognised that Heathrow would still have substantial market power and that capacity constraints were restricting the further development of competition in the London market.
While Important, Connectivity is Not the Only Evaluation Criteria
The assessment of capacity options by the Commission needs to make connectivity a key part of the evaluation criteria. And in evaluating connectivity, consideration should be given to economic benefits it provides, the limited to connectivity at one airport and the need for competitive and low cost connectivity.
However, other factors also need to be evaluated including local environment impacts, particularly noise, and other quality-of-life impacts. These issues are documented in separate report submitted by GAL.

Assessing Connectivity in the UK’s Air Transport Market
17 July 2013
76
9.1 Next Steps
This report provides analysis on a number of key issues relevant to enhancing the UK’s global air connectivity. However, there are a number of areas of further research which will be provided in future submissions to the Commission, including:
▪ Impact of Airport Competition. Most of the research cited in Chapter 8 is based on U.S. data. We intend to obtain data on the UK and Europe to further research and quantify the impact of airport competition.
▪ Measuring and Evaluating Connectivity. We will examine additional methods and measures of connectivity of possible value to this debate.
▪ Limits to Connectivity. We intend to conduct further empirical research on the limits to airport connectivity.
▪ Network Modeling of Future Runway Scenarios. The modeling described in Chapter 7 will be further enhanced and deepened to examine the connectivity implications of the runway options.

Assessing Connectivity in the UK’s Air Transport Market
17 July 2013
77
Appendix A: Responding to the “One Hub or None” Claims
In November 2012, Heathrow Airport Limited released a report titled “One Hub or None: The case for a single UK hub airport”. In the report it is argued that a dual hub or dual airport system is not feasible for the London market and therefore additional capacity should only be provided at Heathrow (or Heathrow should be replaced by a new hub airport).
The report contains a number of inaccuracies and omissions which are addressed below.
The Issue is Airport Capacity Not Hubs
The Heathrow report argues that the expansion of Heathrow is required to ensure that the UK has a hub airport to rival the likes of Paris, Amsterdam, Frankfurt or Dubai. However, the geographic location of London means that Heathrow never has been and will likely never be a traditional hub. Hub airports are characterised by a large proportion of connecting traffic in combination with origin/destination traffic, resulting in higher levels of air service than can be sustained just by origin/destination traffic. Currently, about one third of Heathrow’s passenger traffic is connecting traffic, which is considerably lower than classic hubs such as Atlanta, Dubai and Frankfurt, which have 50% or higher connecting traffic. Furthermore, current trends militate against Heathrow becoming a major hub in the future:
New aircraft “hub busting” aircraft technology, such as the Boeing 787 the Airbus A350, mean that more passengers will travel direct to their destinations without the need to transfer through hubs. This may reduce the availability of transfer traffic in Heathrow’s transfer strongholds such as Europe-North America. For example, a passenger in Hamburg might currently choose to connect at Heathrow in order to fly to Dallas. In the future, they might have access to direct services operated using B787s.
London is poorly positioned to compete for fast growing, emerging markets such as Europe-Asia, or Europe-Africa. Heathrow (or any other London airport) makes an unattractive connecting point for these traffic flows as it would require most passengers in Europe to travel in the wrong direction, greatly increasing travel times. These flows are better served by Frankfurt, Istanbul or Dubai.
London will always attract some connecting traffic due to the wide range of services offered and the need for domestic connections. However, it does not need a mega-hub in order to maintain high levels of connectivity. London is the largest air market in the world and an important global destination, which is best served a number of competing airports.
The Importance of Airport Competition is Ignored
As we have argued in this report, the development of a multiple gateway airport system serving London will enhance the competitive dynamics of the UK aviation market. This competition will ensure route development best meets the needs of the market and foster competitive pricing due to airport and airline competition. Capacity options that only enhance the hub dominance of Heathrow will ultimately be detrimental to airport competition in London.
The Competition Commission’s 2009 decision to break up the BAA monopoly of London airport was designed to enhanced competition in the London airport market. However, even with the

Assessing Connectivity in the UK’s Air Transport Market
17 July 2013
78
break-up, the Competition Commission recognised that Heathrow would still have substantial market power and that capacity constraints were restricting further development of competition in the London market.
The Description of Transfer Traffic in the London Market is Simplistic and Ignores Important Details
The Heathrow report argues that a two hub system would split the feed from short haul routes onto long haul routes weakening the financial position of some short haul routes and sustainability of marginal long haul routes. By the same logic, it would be more effective if there were only one carrier (or one alliance group) operated on these routes allowing them to consolidate traffic further. However, such an outcome would be considered anti-competitive and would be subject to review by competition authorities in many countries. For the most part, this does not happen and airlines are able to operate and compete effectively while splitting the traffic.
Consider that airlines mostly provide feed for their own services or those of their alliance or code-share partners. For example, before its takeover by British Airways in 2012, BMI was providing domestic and international feed traffic largely to its Star Alliance partners. Similarly, Virgin’s new UK domestic services will provide feed primarily to Virgin’s international services and provide very little to British Airways.
Ticket booking data shows that in 2012, 76% of connecting passengers at LHR were making oneworld to oneworld connections (British Airways is a member of the oneworld alliance) and another 6% were making other within-alliance connections (Star to Star or SkyTeam to SkyTeam).84 The vast majority of connections at Heathrow are within-alliance and most of those are for the oneworld alliance. Heathrow is not a big neutral connecting gateway. It is a dominated hub that largely facilitates connections within the dominant carrier’s alliance.
Gatwick developing as a gateway airport might see one or more alliances move operations to that airport. It is unlikely that an airline or alliance will split operations between the two airports. As a result, the airline economics of feed traffic will be largely unaffected. However, it will allow airlines to develop services at an airport not dominated by one carrier and one alliance. Furthermore, a second major gateway would increase competition for feed traffic, stimulating demand, lowering fares and providing greater passenger benefits.
It should also be noted that the nature of connecting operations are changing. There is an increasing use of interline and code-share agreements between low cost carriers and long-haul network airlines. This is becoming an increasingly important area of growth in the aviation market. Carriers such as WestJet in Canada, JetBlue in the U.S., and Virgin Australia and Jetstar in Australia have entered into codeshare and interline agreements with network carriers. For example, JetBlue has a codeshare with Lufthansa; Jetstar codeshares not only with its parent company, Qantas, but also with Japan Airlines and American Airlines (and interlines with 25 other airlines); Virgin Australia codeshares with Etihad. These arrangements enhance the profitability and network reach of the carriers without major changes to their business models, and enhance the connecting options for customers. Etihad Airways, which is not part
84 Diio FMg database for full year 2012. Connections involving BMI were removed from the analysis due to their takeover by British Airways.

Assessing Connectivity in the UK’s Air Transport Market
17 July 2013
79
of any airline alliance, reports that 19% of its revenues in 2012 originated from airline partnerships.85 Although there are no such partnerships planned at the moment, it is conceivable that the large network reach of easyJet (the UK’s largest carrier), would be very attractive to long haul carriers as a means of providing feed traffic.
Gatwick is also developing innovative approaches to supporting connecting traffic at its airport. In May 2013, Gatwick started a pilot of its Gatwick Connect transfer product. Gatwick Connect will offer an improved service to passengers already self-connecting, by re-locating the check-in element of the current process. Passengers can collect their bags in the arrivals baggage reclaim hall, before immediately, in the reclaim area itself, checking-in and/or dropping their bag for the next stage of their journey. Passengers then go landside, but straight to security, bypassing traditional check-in/bag drop. The Gatwick Connect proposition is based on the ‘ViaMilano’ product that is operated by Milan-Malpensa airport and complements Gatwick’s existing interline product, which handles 900,000 passengers per year.
The Issue of UK Domestic Connectivity is Mis-stated
It is argued that capacity constraints at Heathrow have squeezed out UK domestic routes. There is undoubtedly an element of truth to this. Short-haul domestic routes operated by smaller aircraft are likely to be less profitable than long haul routes operated by wide body aircraft. It is also argued that this has been to the benefit of hubs in mainland Europe which do have services to cities not served by London (e.g., Birmingham, Cardiff, Southampton, Liverpool, etc.).
However, caution is urged in interpreting the limited domestic connections of Heathrow. Connections to many points in the UK may not be viable for air carriers due to the short distances involved and the availability of effective alternatives (road and rail). In other words, some of the domestic connectivity is being provided by other modes which are more suited to the distances and passenger volumes involved. The same phenomenon occurs in the rest of Europe. For example, Paris CDG is not connected by air to some points in France (and even elsewhere in Europe) because this connectivity is provided by road and rail. However, these same points may have air service to London because air is the most suitable option.
Heathrow may not be losing out to other European hubs any more than the European hubs are losing out to Heathrow in the other direction, and adding capacity at Heathrow will not necessarily result in service to Birmingham, Bristol, etc.
Past History from Gatwick is Not a Guide to the Future
Heathrow’s report document previous failed attempts by British Airways to operate Gatwick as a second hub. We agree that a single airline or even a single alliance would be unlikely to make a success of split operation between two nearby airports. It is much more realistic to expect that certain airlines or possibly alliances would move wholesale to Gatwick. There is also the possibility of greater co-operation between LCCs and long-haul carriers to support connecting traffic as discussed above.
85 http://centreforaviation.com/analysis/japan-airlines-and-jetstar-japan-embrace-lcc-hybridity-codesharing---and-reap-rewards-99499.
Assessing Connectivity in the UK’s Air Transport Market
17 July 2013
80
The fact that airlines moved to Heathrow following EU-US Open Skies and are willing to pay large sums for slots at Heathrow is evidence of the market dominance that Heathrow enjoys. This dominance can be best addressed by allowing more effective competition from other London airports. In contrast, the fact that airlines could operate trans-Atlantic services from Gatwick demonstrates that such routes are viable – albeit potentially not with the same yield as those airlines can now secure at Heathrow.
There is historical precedent for airports emerging as new major airports or gateways:
Newark has become a major international gateway and airline hub despite being an airport with limited scheduled services and very little international service back in the 1980s.
Having started as a domestic airport, Haneda Airport in Tokyo is now operating as an intercontinental hub alongside Narita Airport.
In China, Guangzhou Baiyun International Airport was a limited domestic hub nearly 10 years ago, with almost no international traffic. Now it is emerging as an intercontinental gateway. Shenzhen International Airport is undergoing this transformation right now.
In less than a decade, Domodedovo International Airport has become the largest airport serving Moscow, starting from a point where it carried less than 15% of the traffic to/from Moscow.
New York is a Good Example of a Dual Airport System
We are puzzled as to why Heathrow points to New York to illustrate why a dual airport system will not work. It illustrates how it can work. JFK has become a major hub for the oneworld alliance, and to a lesser extent Skyteam, while Newark has become a Star Alliance hub (there is some overlap between the hubs; for example, Lufthansa, in the Star Alliance, flies to both airports). In addition, LCC JetBlue codeshares with both American and Lufthansa at JFK, an illustration of the LCC/network carrier connections that is emerging in the market.
Heathrow states that New York has three home carriers and the UK only has one.86 This ignores the fact that any EU carrier can operate from Heathrow to most destinations. The EU has signed a large number of “horizontal agreements” 87 or open skies bilaterals with other countries which remove restrictions on carrier nationality provided they are within the EU. By the time any additional capacity becomes operational at Gatwick, these agreements will be even more wide-spread. It is highly conceivable that once additional capacity becomes available at Gatwick that a new UK-based (or partially UK-based) carrier will develop, either as a subsidiary of another EU carrier or as an independent carrier. Virgin’s start-up of domestic services, partially in response to the loss of BMI’s domestic service at Heathrow, illustrates the responsive dynamics of the airline industry in the UK.
86 The one airline being British Airways. This ignores easyJet, which is a larger airline than British Airways in terms of passengers carried.
87 A horizontal agreement is an agreement negotiated by the European Commission on behalf of the Member States, in order to bring all existing bilateral air services agreements between Member States and a given third country in line with Community law.

Assessing Connectivity in the UK’s Air Transport Market
17 July 2013
81
The report also argues that New York is less well connected than Frankfurt or Atlanta due to its dual hub status. This is speculative at best. Market forces (and sometimes government policy) largely determine what routes and how many will be operated from an airport. The New York airports serve a different market to Atlanta and Frankfurt.
Furthermore, one reason New York may have low connectivity to certain parts of the world (e.g., South America and Asia), is its geographic location. Located on the North East of the country, it is poorly positioned to attract North American connecting traffic, most of which would have to backhaul through New York, and even connections from Europe are better served by Miami. Because of their geographic locations, San Francisco and Los Angeles act as the major gateways to Asia (collecting domestic feed from the East of the U.S.) and Dallas and Miami serve South America. Being located on the edge of a continent, London is similarly challenged to attract large volumes of connecting traffic to certain markets, such as Asia.
The Problems at Tokyo Were Due to Government Policy Not Dual Airports
The experience of Haneda and Narita Airports in Tokyo is also offered up as another example of the failure of dual hubs. However, the problems at these airports were caused by government policy not the dual hub model. The Japanese government forced one airport to serve only domestic traffic and the other to serve international traffic, meaning that domestic-international connections required the use of ground transport. As we state below, we do not view that air passenger connections facilitated by ground transport between two airports to be an effective business model. Now that the government has removed the restrictions on these airports, and Haneda has added a new runway, both airports are now offering competing international services.
Also, to state that Tokyo’s declining connectivity ranking among Asian airports is due to its dual airport status is disingenuous. Firstly, it was the imposition of government policy that harmed Tokyo’s hubbing ability. Secondly, the growth of other Asian airports, such as Incheon airport in Seoul, is due to rapid economic growth experienced in these countries, particularly set against the past 15 years of economic stagnation that Japan has suffered.
The Dubai Example Is Not Relevant
The delay in moving operations from Dubai international to Al Maktoum International Airport is not relevant to this debate. Dubai is primarily a connecting market – the majority of its passenger traffic is connecting through the airport. It does not have the large O/D market that London does. London is primarily an O/D market with some connecting traffic.
Split Hubs Are Not the Issue
We do agree with Heathrow that an option to facilitate connecting traffic through a rail link between Heathrow and Gatwick is not realistic. The connection times would be highly uncompetitive with those offered at hubs elsewhere in Europe.
Instead, we consider that a much more viable option is that Heathrow and Gatwick would be competing gateway airports on a level playing field, which would provide substantial benefits to passengers, airlines and the wider UK economy.

Assessing Connectivity in the UK’s Air Transport Market
17 July 2013
82
The Analysis of Economic Benefits is Flawed and Simplistic
In a report commissioned by Heathrow in 2011, “Connecting for Growth” by Frontier Economics, it was claimed that lack of direct connections from Heathrow to emerging markets was costing the UK economy £1.2 billion to £1.6 billion of trade per annum, and that the cumulative loss over ten years was £14 billion. However, in the “One Hub or None”, it is claimed that £14 billion per annum in trade was being lost, climbing to £26 billion per annum by 2030. The report provides little information why the estimated lost trade has increased over ten-fold since the 2011 study.
More generally, we are concerned that analysis of economic benefits is flawed and simplistic. It appears to assume that the major factor preventing trade with other countries is lack of direct air service. Thus, introducing or expanding air service results in a massive jump in the volume of trade with these countries.88 This is based, in part, on analysis of the correlation between the volume of trade between two countries and the number of flights per annum between those countries.89 However, this analysis ignores two key issues:
Size of the economy. A one of the factors affecting the volume of trade and the amount of air service between countries is the size of their economies. For example, the UK has more trade and direct air service with Germany than it does with Luxembourg, simply because Germany is a bigger economy with a bigger population. The supposed correlation between trade and air services may be largely the result of economic size.
The analysis appears to ignore the two-way nature of the relationship, i.e., increased trade likely increases the demand for air travel, and that many other factors are required in order for trade to develop. Airlines do not operate routes to promote economic development; they do so to make a profit. They look for opportunities where existing demand will support the flights offered and make them financially viable, if not immediately, then certainly within a relatively near-term planning horizon. Heathrow’s report does recognise the causality issues (page 13) but the analysis do not try to control for this.
We agree that there are significant economic benefits from the development of the UK’s connectivity. Greater connectivity will facilitate the development of enhanced levels of business and cultural ties. However, we view that the heavily flawed analysis in Heathrow’s report does not positively contribute to the debate.
The Economic Benefits of Connectivity Are Not Exclusive to Heathrow
Regardless of the correct estimates for the trade and economic benefits associated with connectivity, we note that these are not specific to Heathrow. The lost trade documented in Heathrow’s report can be recovered by connectivity at other airports and not just Heathrow. For example, the Heathrow report identifies Indonesia and Vietnam as countries with whom direct air service would spur trade. Gatwick already services two points in Vietnam and in November
88 The analysis supporting the trade estimates is provided in a separate report, “Missing Trade Opportunities: The Impact of Heathrow’s Capacity Constraint on the UK Economy” Frontier Economics, November 2012.
89 “Missing Trade Opportunities: The Impact of Heathrow’s Capacity Constraint on the UK Economy” Frontier Economics, November 2012, Pages 4-5.

Assessing Connectivity in the UK’s Air Transport Market
17 July 2013
83
2013 will have service to the Indonesian capital. Direct air services from Gatwick will generate the same levels of economic benefit as equivalent services at Heathrow.
Furthermore, a capacity solution that facilitates greater competition between airports could potentially result in greater benefits due to reduced travel costs for passengers and shippers.
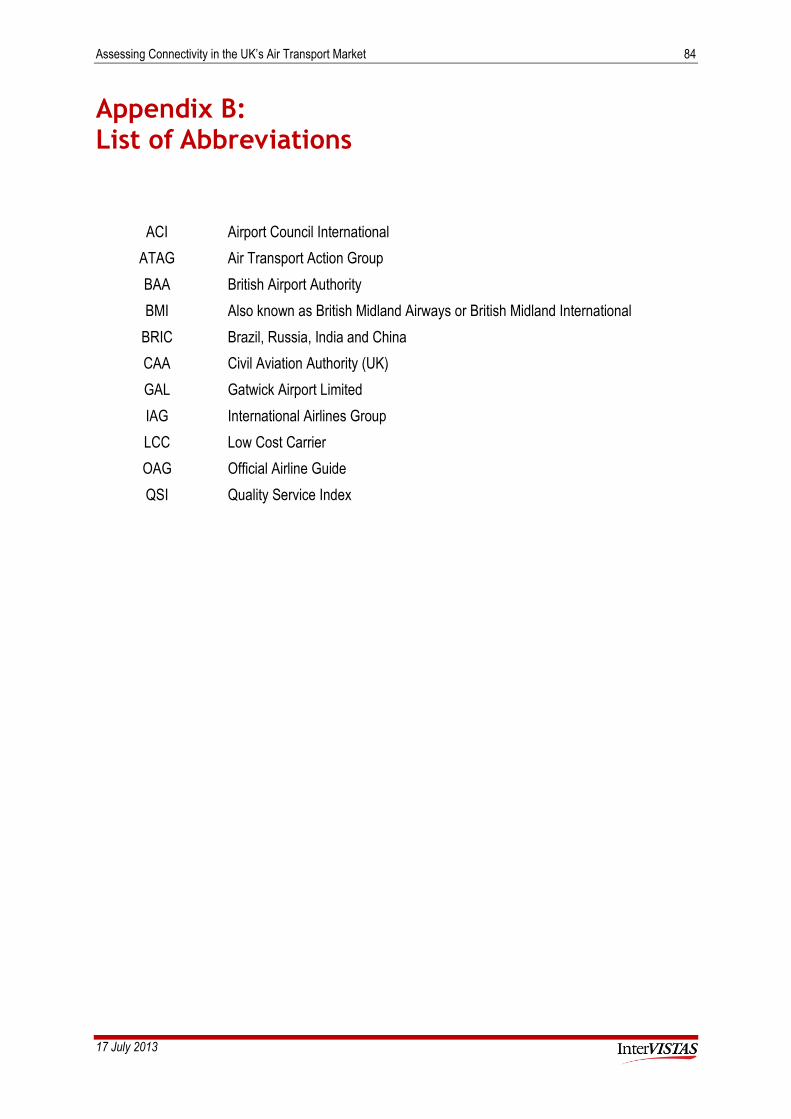
Assessing Connectivity in the UK’s Air Transport Market
17 July 2013
84
Appendix B: List of Abbreviations
ACI Airport Council International
ATAG Air Transport Action Group
BAA British Airport Authority
BMI Also known as British Midland Airways or British Midland International
BRIC Brazil, Russia, India and China
CAA Civil Aviation Authority (UK)
GAL Gatwick Airport Limited
IAG International Airlines Group
LCC Low Cost Carrier
OAG Official Airline Guide
QSI Quality Service Index

Assessing Connectivity in the UK’s Air Transport Market
17 July 2013
85
Appendix C: List of Airport Codes
Airport Code Airport Name
AMS Amsterdam Airport Schiphol
ATL Atlanta Hartsfield-Jackson International Airport
CAN Guangzhou Baiyun International Airport
CDG Paris Charles de Gaulle Airport
DAL Dallas Love Field
DFW Dallas/Fort Worth International Airport
DME Domodedovo International Airport
DXB Dubai International Airport
EWR Newark Liberty International Airport
GMP Gimpo International Airport
HKG Hong Kong International Airport
HND Tokyo Haneda Airport
HOU William P. Hobby Airport
IAH George Bush Intercontinental Airport
ICN Incheon International Airport
ITM Osaka Itami International Airport
JFK John F. Kennedy International Airport
KHH Kaohsiung International Airport
KIX Kansai International Airport
LAX Los Angeles International Airport
LCY London City Airport
LGA LaGuardia Airport
LGW Gatwick Airport
LHR London Heathrow Airport
LTN London Luton Airport
MIA Miami International Airport
NAY Beijing Nanyuan Airport
NRT Narita International Airport
OAK Oakland International Airport
ONT La/Ontario International Airport
Assessing Connectivity in the UK’s Air Transport Market
17 July 2013
86
Airport Code Airport Name
ORY Paris Orly Airport
PEK Beijing Capital International Airport
PVG Shanghai Pudong International Airport
SEN London Southend Airport
SFO San Francisco International Airport
SHA Shanghai Hongqiao International Airport
SJC Norman Y. Mineta San Jose International Airport
SNA John Wayne Airport
STN London Stansted Airport
SVO Sheremetyevo International Airport
TPE Taiwan Taoyuan International Airport
TSA Taipei Songshan Airport
VKO Vnukovo International Airport
XIY Xi’an Xianyang International Airport

Prepared by InterVISTAS Consulting Ltd.
Suite 10, Regency House 2 Wood Street Queen Square
Bath, UK BA1 2JQ
Telephone: +44 2(0) 814 1835 Facsimile: +44(0) 1225 330 209
www.interVISTAS.com