Assessing Auto Emissions in Utah-Specific … Auto Emissions ... particularly under Utah-specific...
27
Assessing Auto Emissions under Utah-Specific Conditions Dr. Randy Martin USU/UWRL Civil & Env. Eng. Logan, UT [email protected] (435) 797-1585 Joe Thomas WSU/NCAST/UDAQ Nat’l Center for Automotive Science & Technology Ogden, UT [email protected] (801) 536-4175
Transcript of Assessing Auto Emissions in Utah-Specific … Auto Emissions ... particularly under Utah-specific...
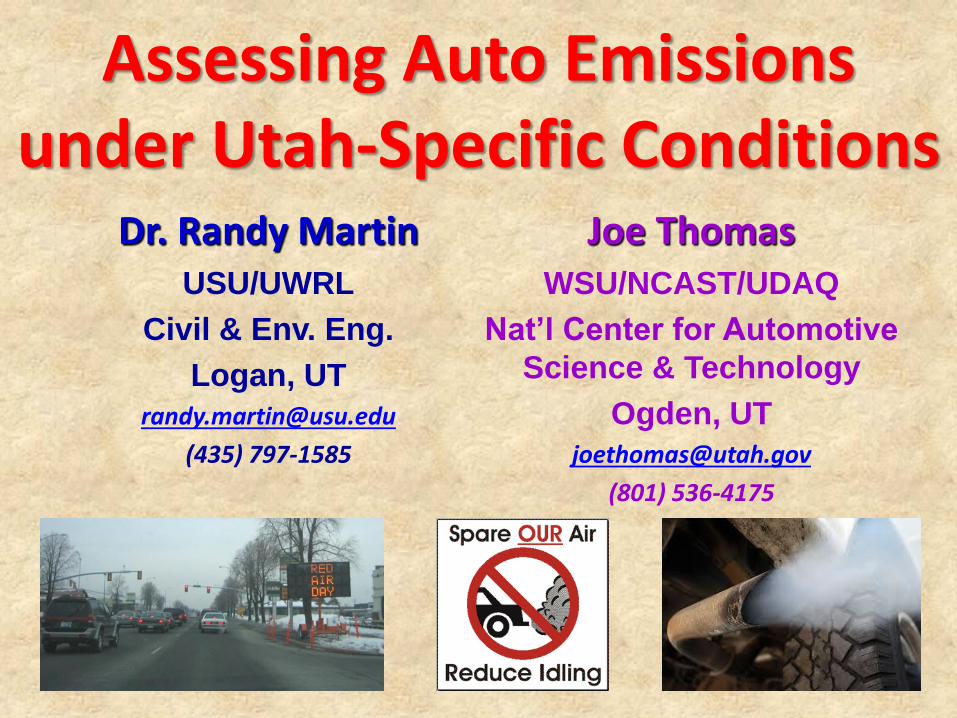
Assessing Auto Emissions under Utah-Specific Conditions
Dr. Randy Martin USU/UWRL
Civil & Env. Eng.
Logan, UT
(435) 797-1585
Joe Thomas WSU/NCAST/UDAQ
Nat’l Center for Automotive
Science & Technology
Ogden, UT
(801) 536-4175
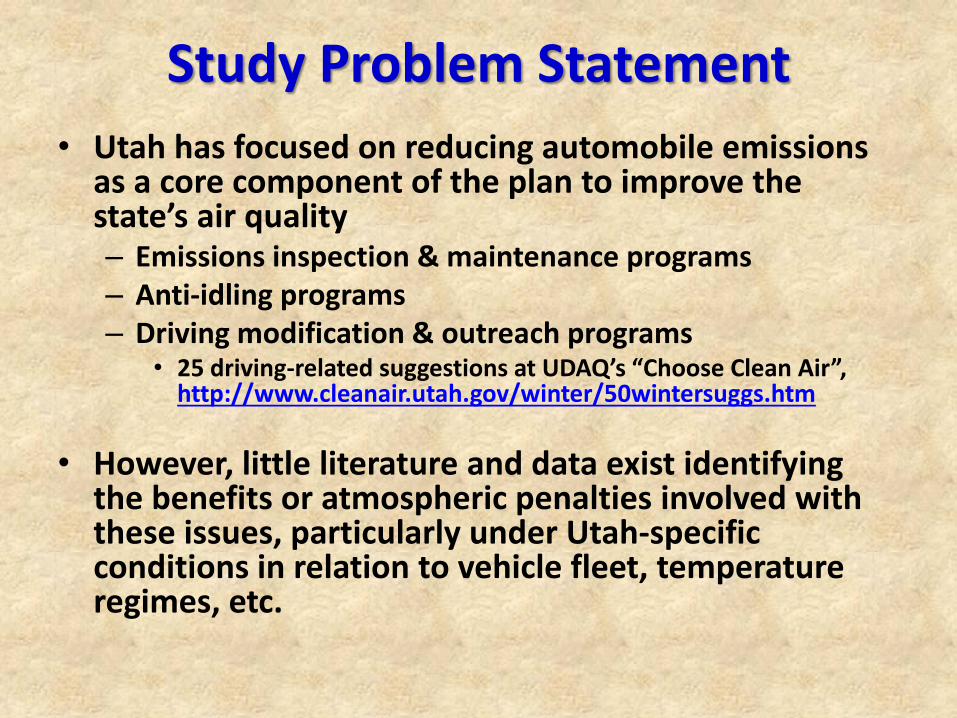
Study Problem Statement
• Utah has focused on reducing automobile emissions as a core component of the plan to improve the state’s air quality – Emissions inspection & maintenance programs – Anti-idling programs – Driving modification & outreach programs
• 25 driving-related suggestions at UDAQ’s “Choose Clean Air”, http://www.cleanair.utah.gov/winter/50wintersuggs.htm
• However, little literature and data exist identifying the benefits or atmospheric penalties involved with these issues, particularly under Utah-specific conditions in relation to vehicle fleet, temperature regimes, etc.
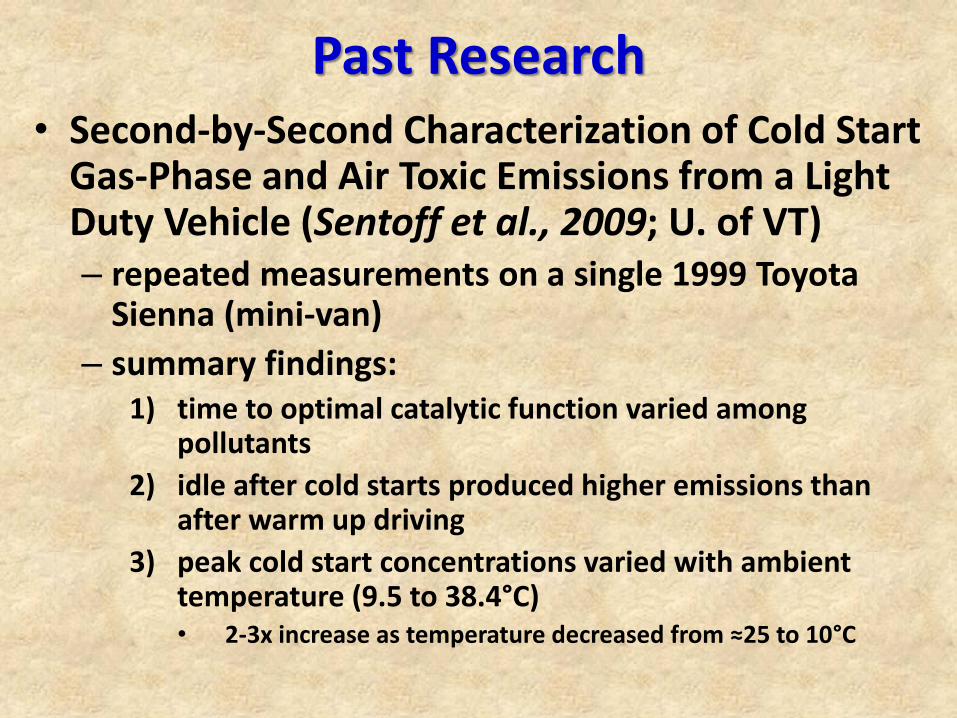
Past Research • Second-by-Second Characterization of Cold Start
Gas-Phase and Air Toxic Emissions from a Light Duty Vehicle (Sentoff et al., 2009; U. of VT) – repeated measurements on a single 1999 Toyota
Sienna (mini-van)
– summary findings: 1) time to optimal catalytic function varied among
pollutants
2) idle after cold starts produced higher emissions than after warm up driving
3) peak cold start concentrations varied with ambient temperature (9.5 to 38.4°C) • 2-3x increase as temperature decreased from ≈25 to 10°C
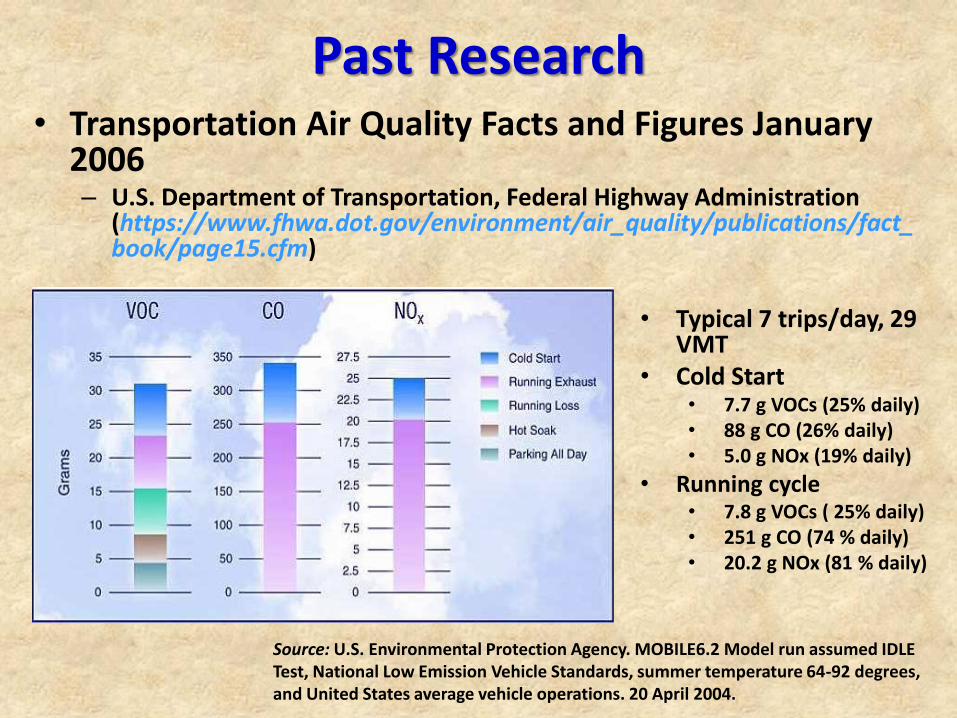
Past Research • Transportation Air Quality Facts and Figures January
2006 – U.S. Department of Transportation, Federal Highway Administration
(https://www.fhwa.dot.gov/environment/air_quality/publications/fact_book/page15.cfm)
Source: U.S. Environmental Protection Agency. MOBILE6.2 Model run assumed IDLE Test, National Low Emission Vehicle Standards, summer temperature 64-92 degrees, and United States average vehicle operations. 20 April 2004.
• Typical 7 trips/day, 29 VMT
• Cold Start • 7.7 g VOCs (25% daily) • 88 g CO (26% daily) • 5.0 g NOx (19% daily)
• Running cycle • 7.8 g VOCs ( 25% daily) • 251 g CO (74 % daily) • 20.2 g NOx (81 % daily)
Study Objectives
Study Tasks: 1) Measure the differences in emissions between cold
starts, hot starts, and continuous idling,
2) Verify whether emissions are different under different weather (temperature) conditions, and
3) Determine how long catalytic converters can remain at optimal temperatures in Utah’s seasonal conditions
• To accomplish these tasks, researchers at Utah State University (USU) and the National Center for Automotive Science and Technology (NCAST) at Weber State University (WSU) will test a group of vehicles (n ≥ 50) representative of the vehicle fleets typical of the Cache Valley and Wasatch Front Counties
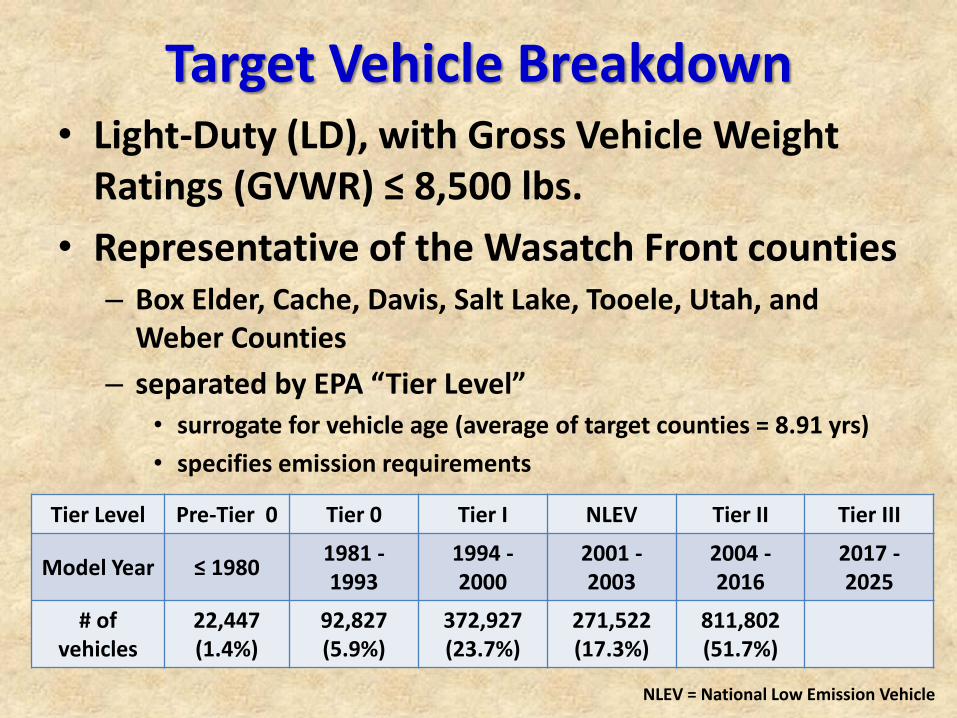
Target Vehicle Breakdown • Light-Duty (LD), with Gross Vehicle Weight
Ratings (GVWR) ≤ 8,500 lbs.
• Representative of the Wasatch Front counties – Box Elder, Cache, Davis, Salt Lake, Tooele, Utah, and
Weber Counties
– separated by EPA “Tier Level” • surrogate for vehicle age (average of target counties = 8.91 yrs)
• specifies emission requirements
Tier Level Pre-Tier 0 Tier 0 Tier I NLEV Tier II Tier III
Model Year ≤ 1980 1981 - 1993
1994 - 2000
2001 - 2003
2004 - 2016
2017 - 2025
# of vehicles
22,447 (1.4%)
92,827 (5.9%)
372,927 (23.7%)
271,522 (17.3%)
811,802 (51.7%)
NLEV = National Low Emission Vehicle
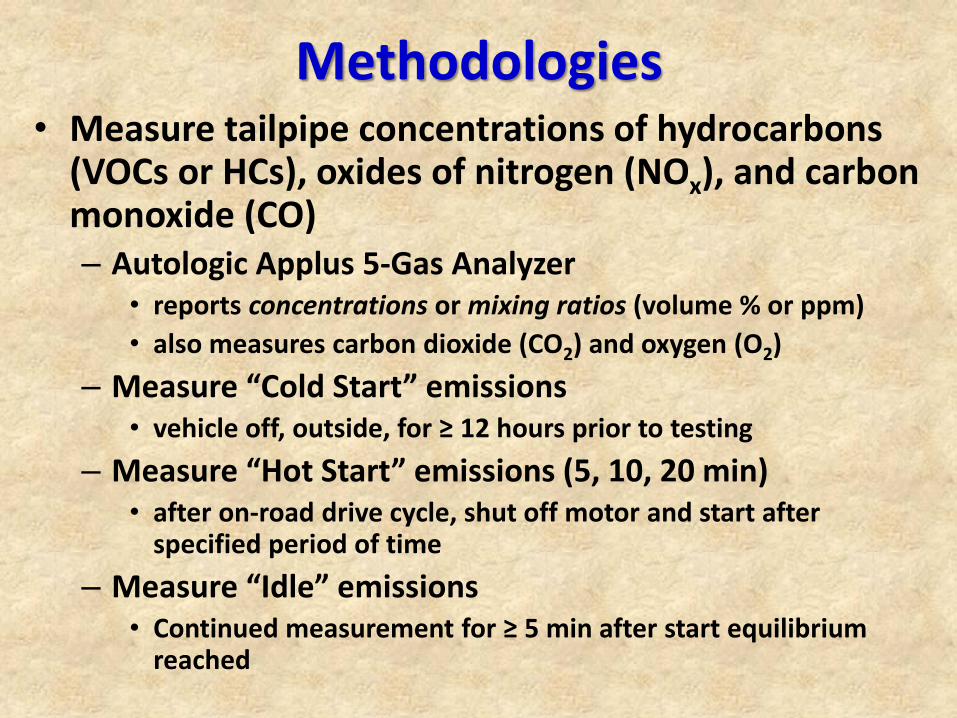
Methodologies • Measure tailpipe concentrations of hydrocarbons
(VOCs or HCs), oxides of nitrogen (NOx), and carbon monoxide (CO) – Autologic Applus 5-Gas Analyzer
• reports concentrations or mixing ratios (volume % or ppm)
• also measures carbon dioxide (CO2) and oxygen (O2)
– Measure “Cold Start” emissions • vehicle off, outside, for ≥ 12 hours prior to testing
– Measure “Hot Start” emissions (5, 10, 20 min) • after on-road drive cycle, shut off motor and start after
specified period of time
– Measure “Idle” emissions • Continued measurement for ≥ 5 min after start equilibrium
reached

Methodologies • Additional supporting measurements
– Tailpipe velocity (flow rate) • to convert concentrations to emissions (e.g. g/s)
• developed algorithms to relate engine RPM and exhaust gas temperature to tailpipe velocity – velocities measured with a high temperature propeller
anemometer
– Engine operating conditions • as available through the OBD II sensor, if available
– RPM, catalyst temperature, engine coolant temperature, oxygen sensor data
– If OBD sensor unavailable, at a minimum RPMs were manually recorded
– System external (surface) temperatures • engine block, cat skin temperature, exhaust gas, ambient
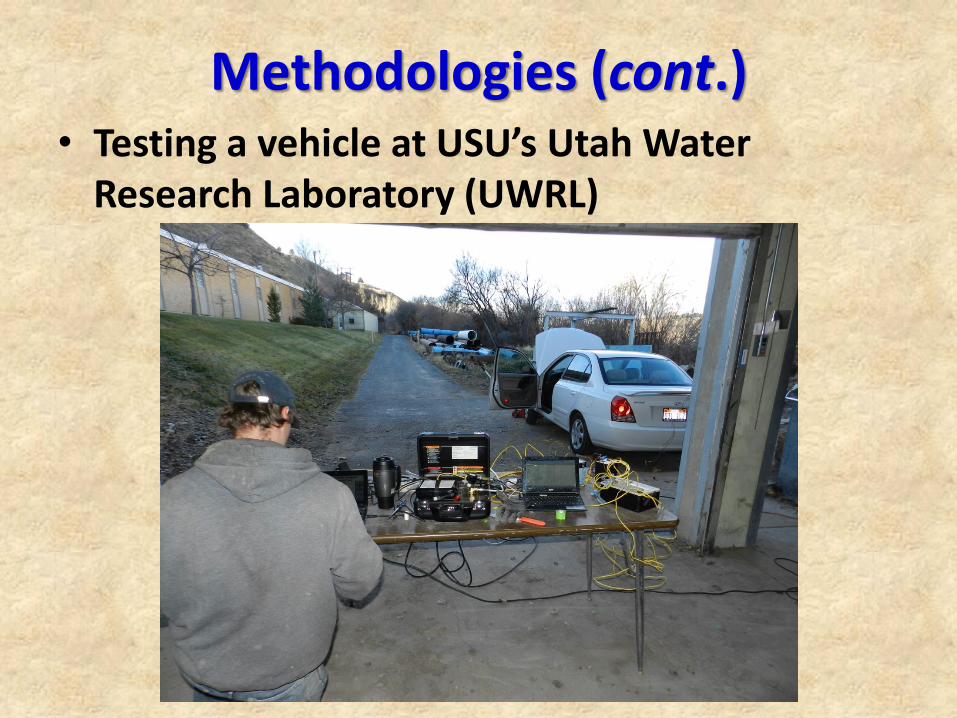
Methodologies (cont.) • Testing a vehicle at USU’s Utah Water
Research Laboratory (UWRL)
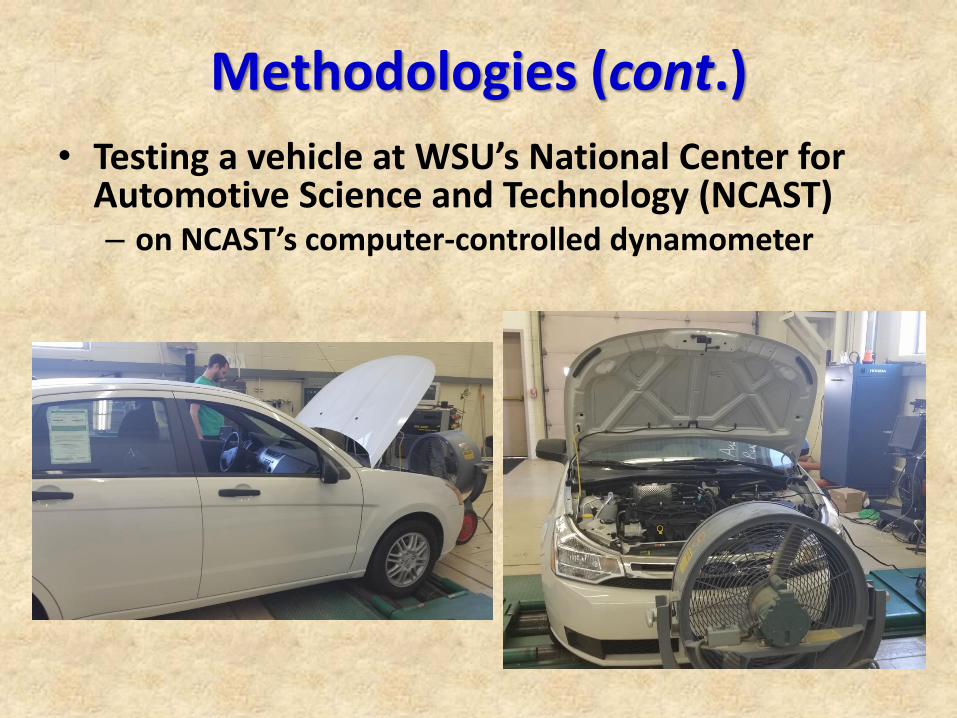
Methodologies (cont.)
• Testing a vehicle at WSU’s National Center for Automotive Science and Technology (NCAST) – on NCAST’s computer-controlled dynamometer
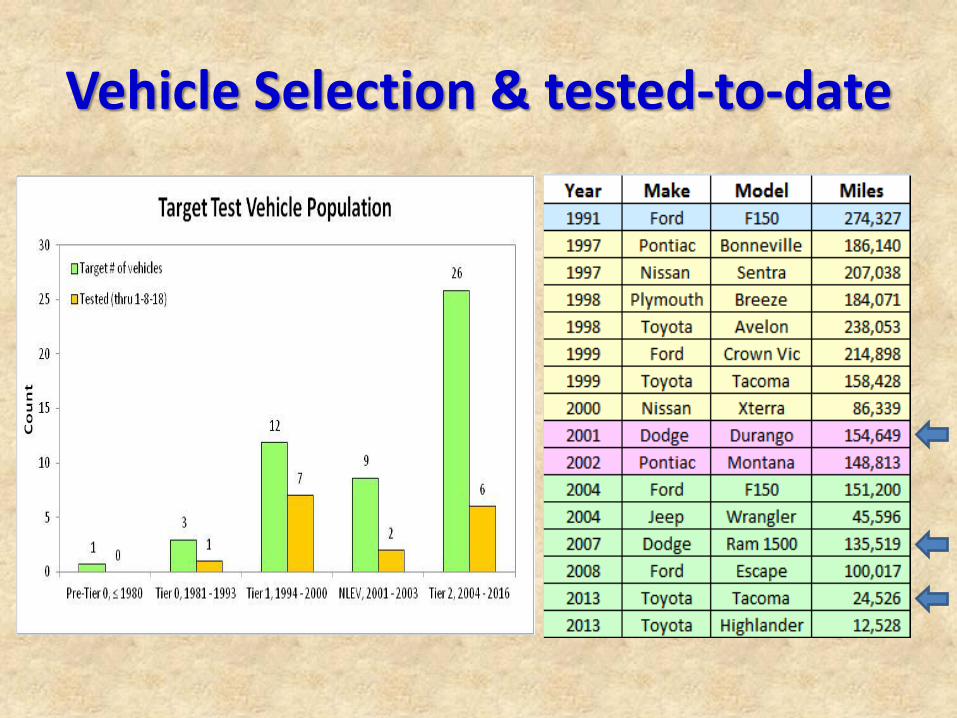
Vehicle Selection & tested-to-date
Preliminary Results
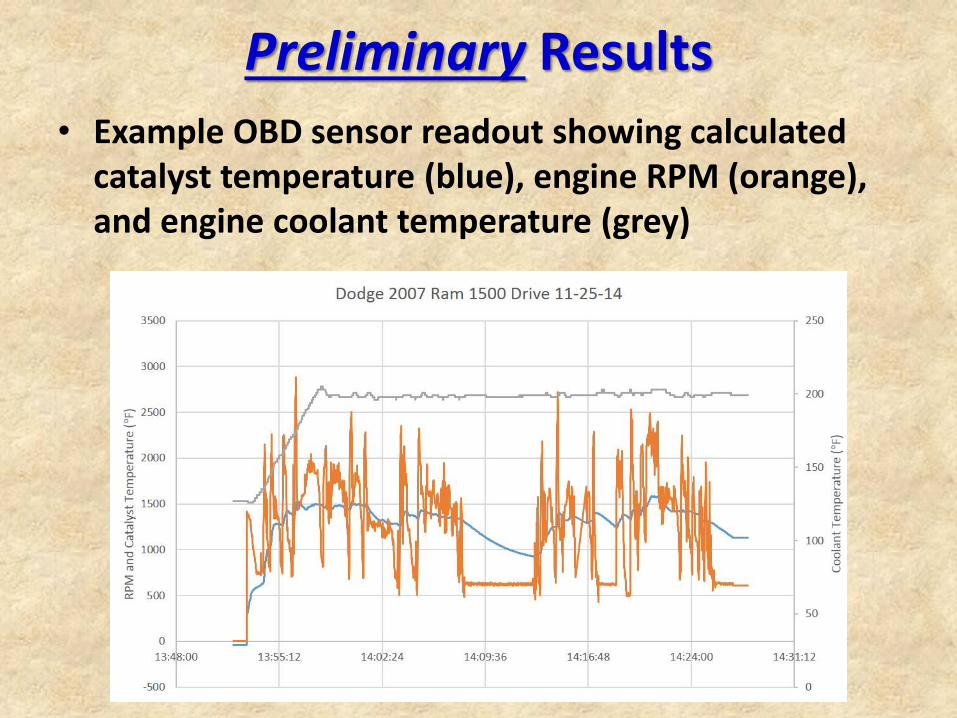
• Example OBD sensor readout showing calculated catalyst temperature (blue), engine RPM (orange), and engine coolant temperature (grey)
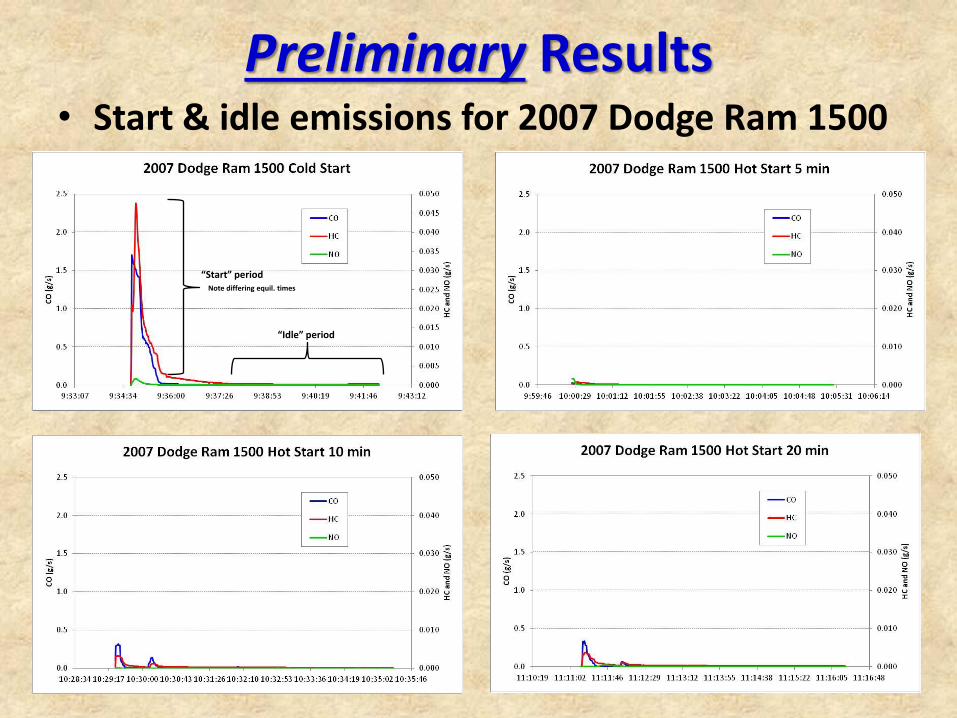
Preliminary Results • Start & idle emissions for 2007 Dodge Ram 1500
“Start” period Note differing equil. times
“Idle” period
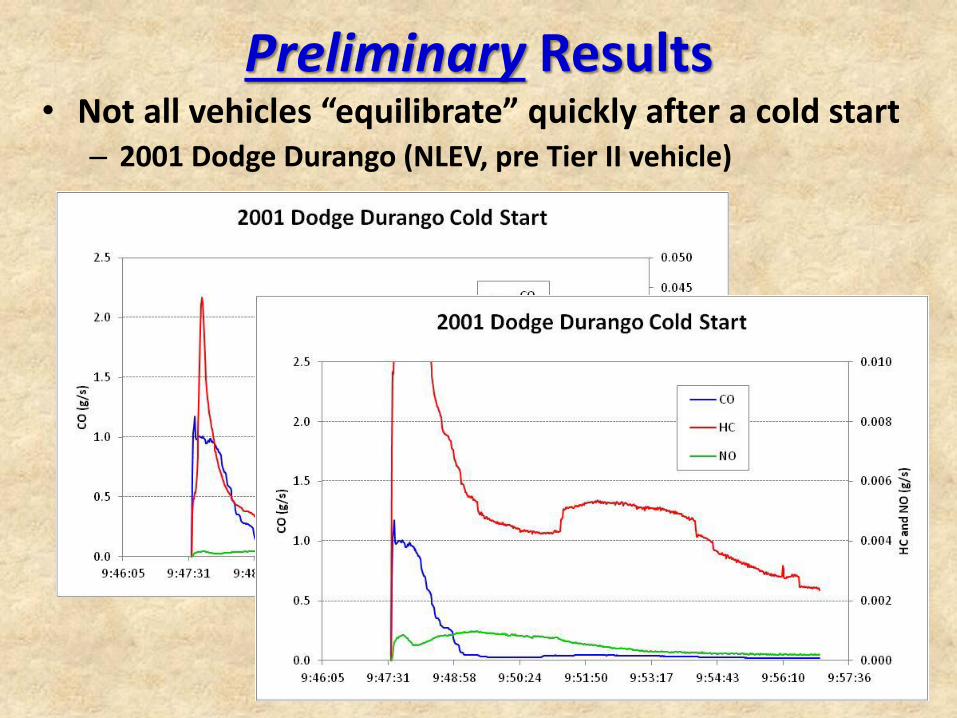
Preliminary Results • Not all vehicles “equilibrate” quickly after a cold start
– 2001 Dodge Durango (NLEV, pre Tier II vehicle)
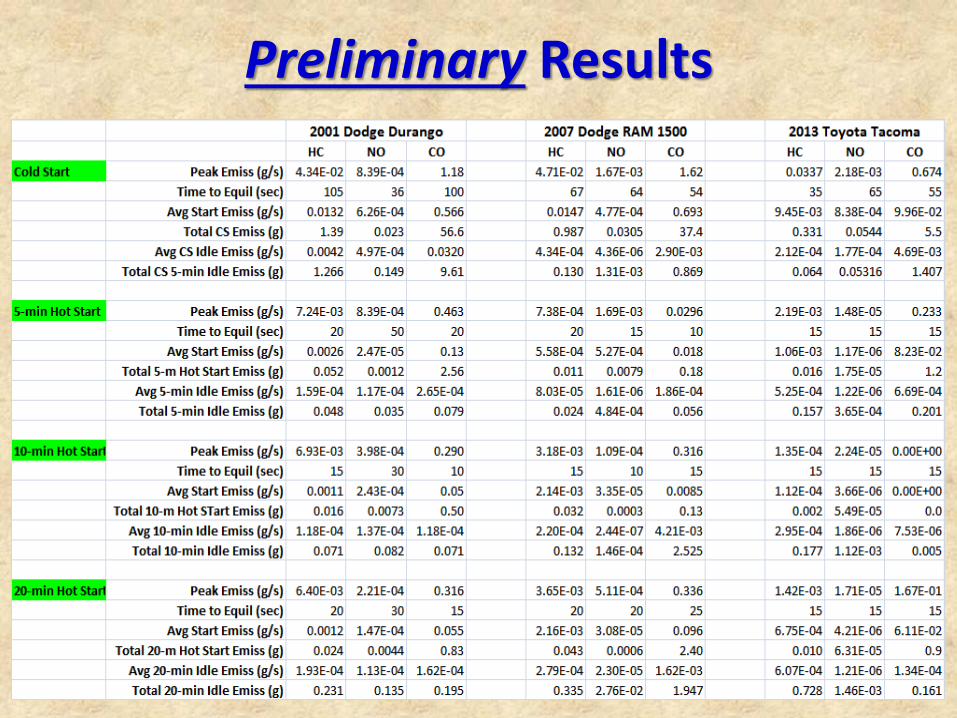
Preliminary Results
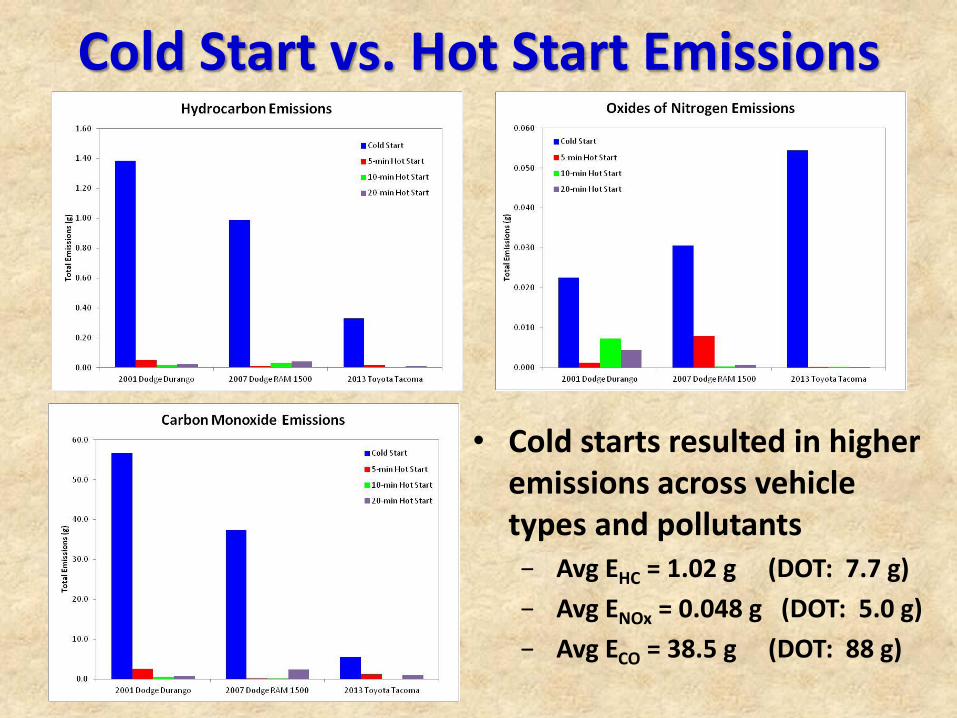
Cold Start vs. Hot Start Emissions
• Cold starts resulted in higher emissions across vehicle types and pollutants − Avg EHC = 1.02 g (DOT: 7.7 g)
− Avg ENOx = 0.048 g (DOT: 5.0 g)
− Avg ECO = 38.5 g (DOT: 88 g)
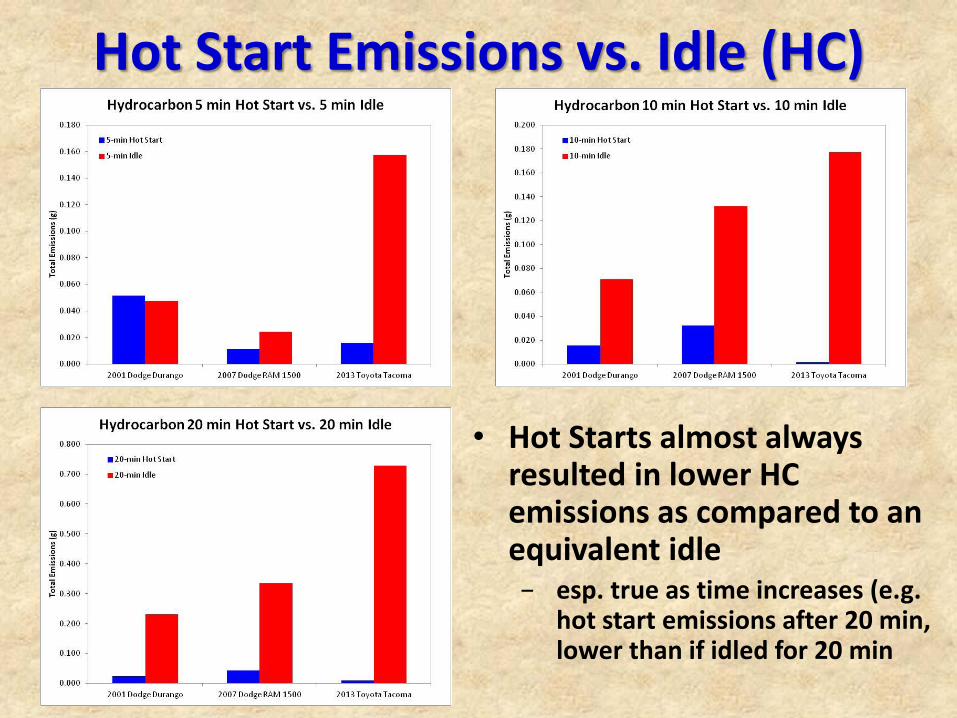
Hot Start Emissions vs. Idle (HC)
• Hot Starts almost always resulted in lower HC emissions as compared to an equivalent idle − esp. true as time increases (e.g.
hot start emissions after 20 min, lower than if idled for 20 min
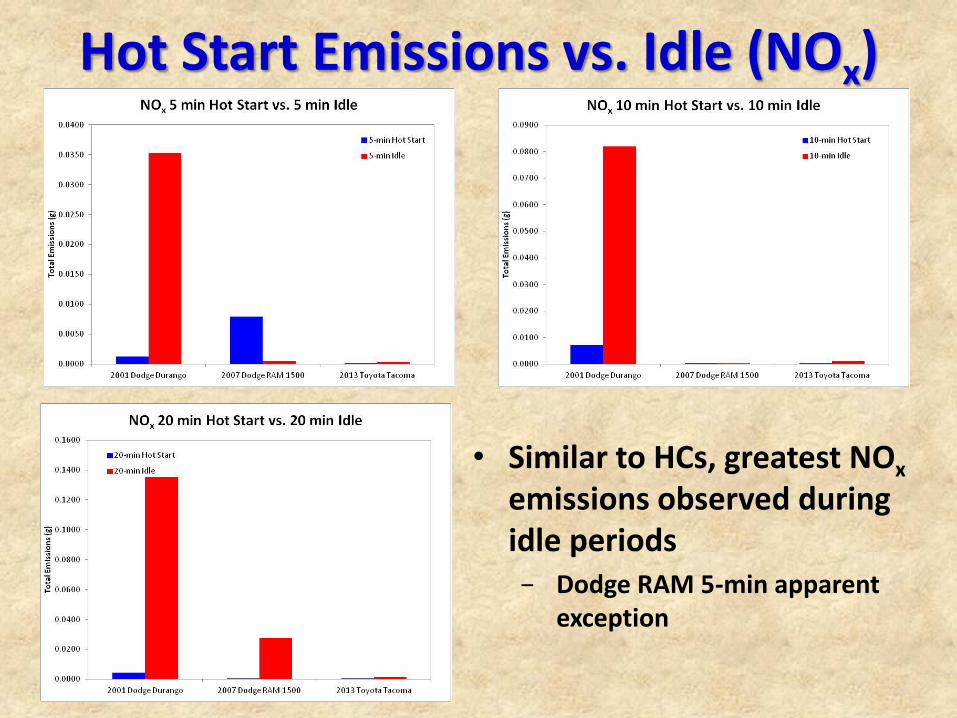
Hot Start Emissions vs. Idle (NOx)
• Similar to HCs, greatest NOx emissions observed during idle periods − Dodge RAM 5-min apparent
exception
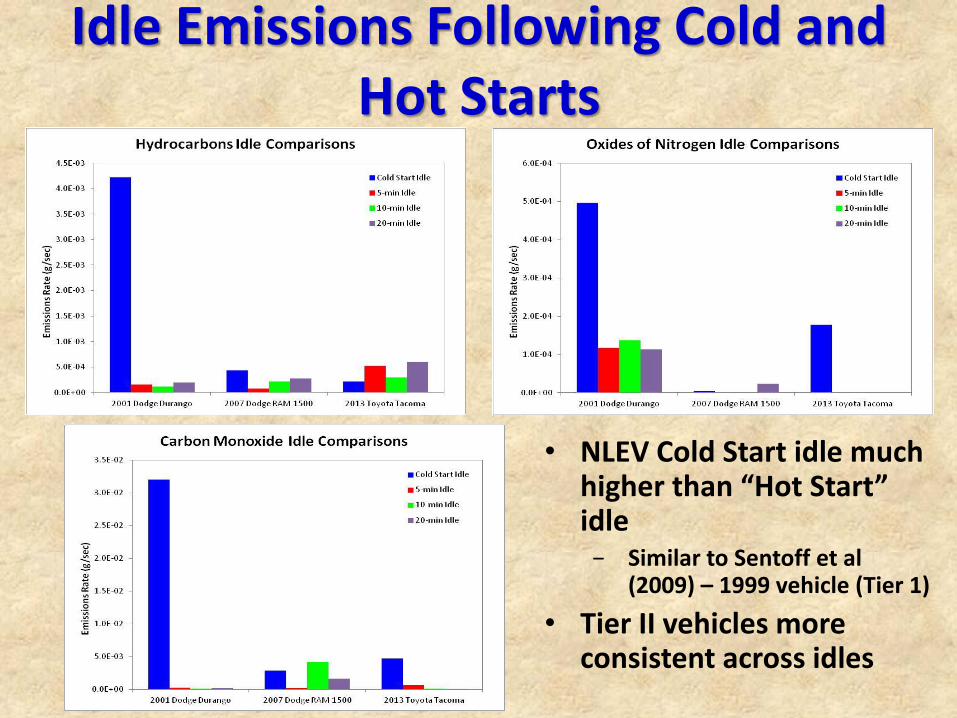
Idle Emissions Following Cold and Hot Starts
• NLEV Cold Start idle much higher than “Hot Start” idle − Similar to Sentoff et al
(2009) – 1999 vehicle (Tier 1)
• Tier II vehicles more consistent across idles
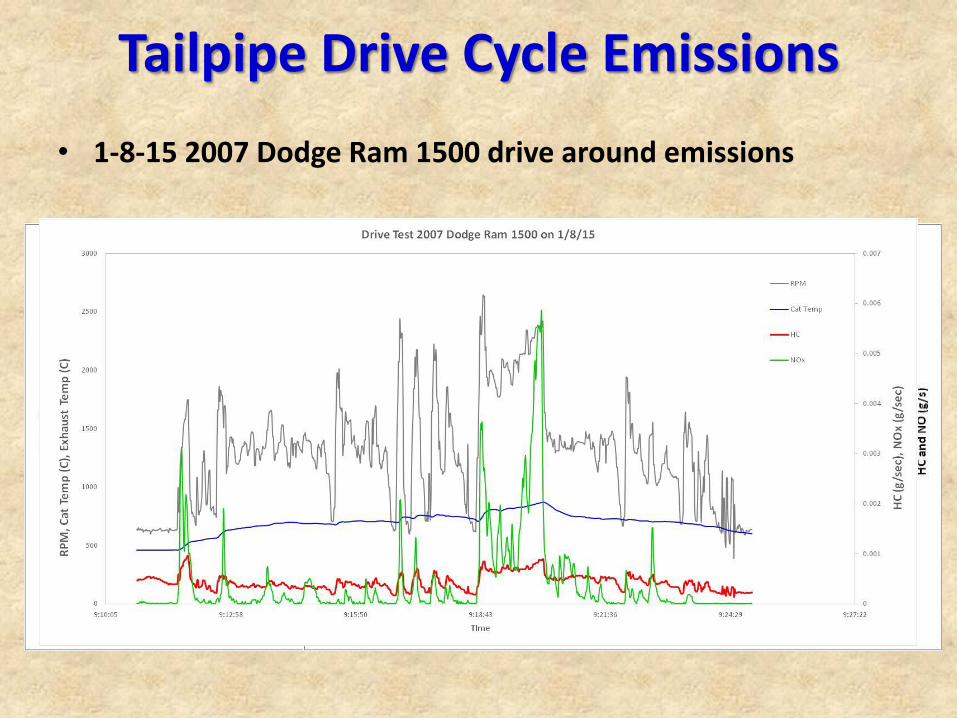
Tailpipe Drive Cycle Emissions
• 1-8-15 2007 Dodge Ram 1500 drive around emissions
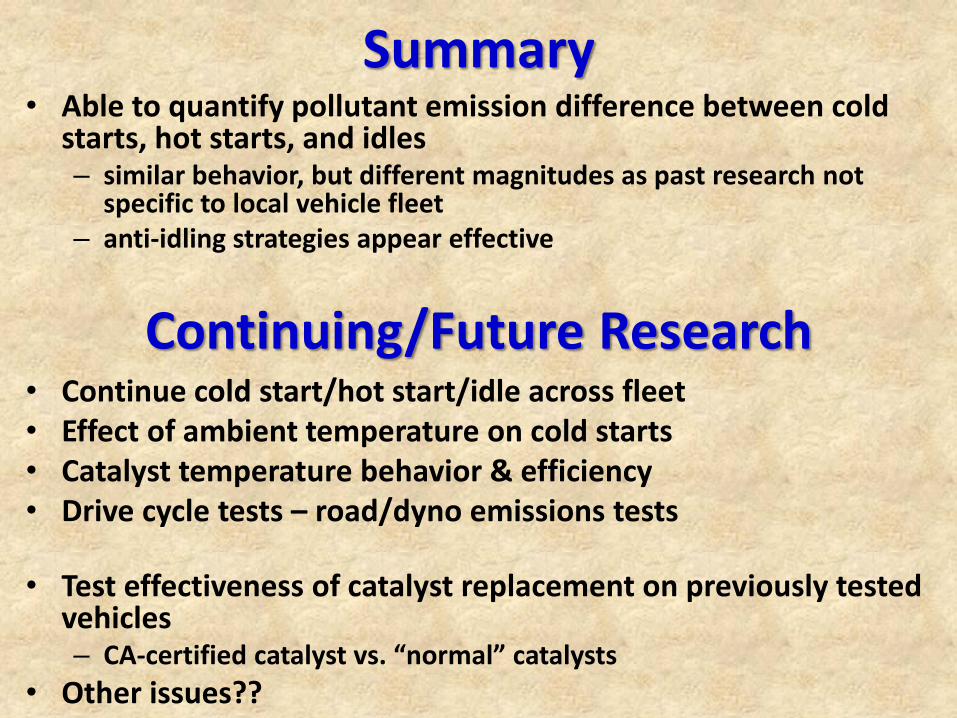
Summary • Able to quantify pollutant emission difference between cold
starts, hot starts, and idles – similar behavior, but different magnitudes as past research not
specific to local vehicle fleet – anti-idling strategies appear effective
• Continue cold start/hot start/idle across fleet • Effect of ambient temperature on cold starts • Catalyst temperature behavior & efficiency • Drive cycle tests – road/dyno emissions tests
• Test effectiveness of catalyst replacement on previously tested vehicles – CA-certified catalyst vs. “normal” catalysts
• Other issues??
Continuing/Future Research
Questions?
Acknowledgements: Utah State Legislature & Utah Division of Air Quality USU’S Utah Water Research Laboratory (UWRL) WSU’S National Center for Automotive Science & Technology (NCAST) Numerous friends & colleagues for use of their automobiles
Clay Woods (USU) Chris Woodhave (NCAST) Alan Walker (NCAST)

Supplementary Slides
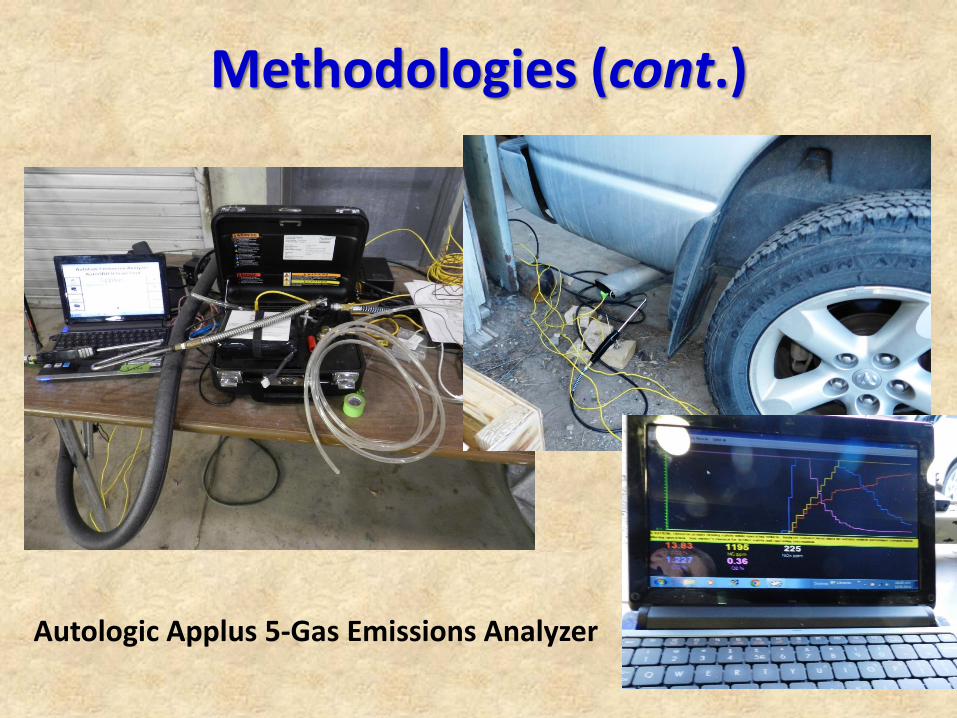
Methodologies (cont.)
Autologic Applus 5-Gas Emissions Analyzer
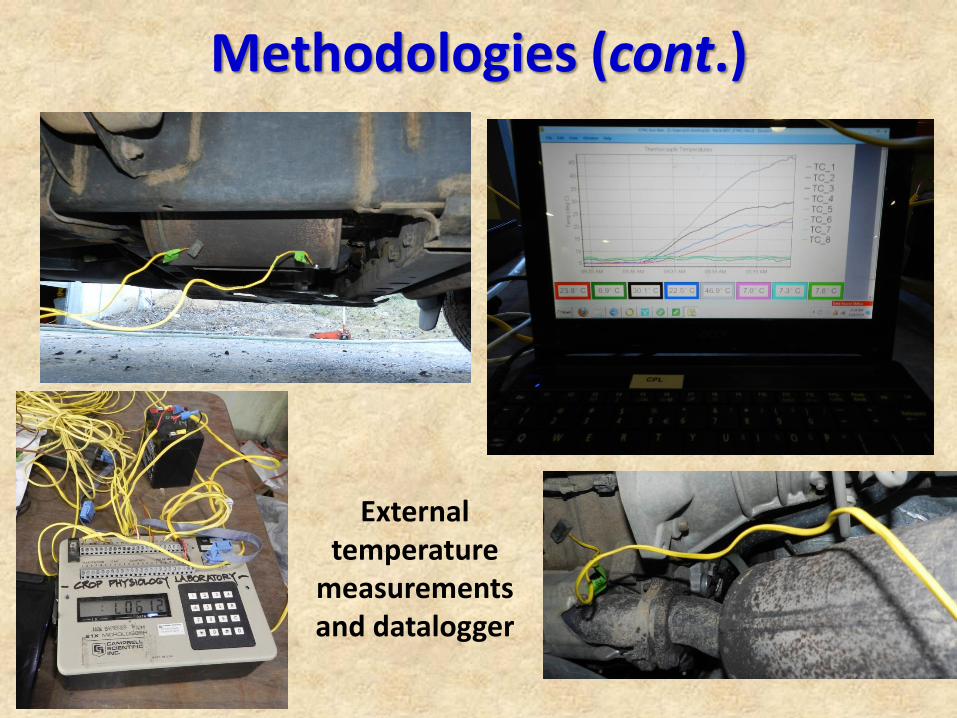
Methodologies (cont.)
External temperature
measurements and datalogger

Preliminary Results • Comparison of internal (OBD) and external
(surface/skin) temperature measurements
Note: During hot start/idle tests catalyst external surface temperatures approached 60°C

Hot Start Emissions vs. Idle (CO)
• Unlike NOx and HCs, highest CO emissions often observed from “Starts” as opposed to “Idles” − Fuel-rich?