ASSESMENT OF PM10 POLLUTION EPISODES IN A ... in terms of levels of atmospheric particles (PM10), as...
46
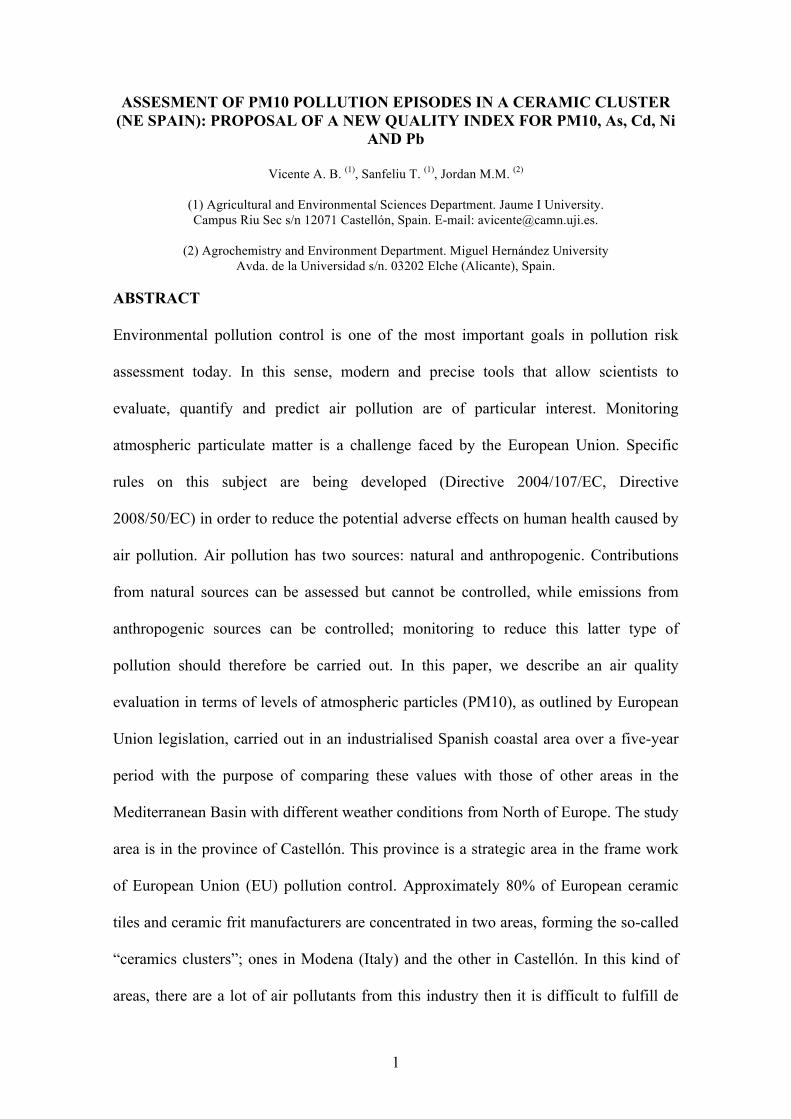
1 ASSESMENT OF PM10 POLLUTION EPISODES IN A CERAMIC CLUSTER (NE SPAIN): PROPOSAL OF A NEW QUALITY INDEX FOR PM10, As, Cd, Ni AND Pb Vicente A. B. (1) , Sanfeliu T. (1) , Jordan M.M. (2) (1) Agricultural and Environmental Sciences Department. Jaume I University. Campus Riu Sec s/n 12071 Castellón, Spain. E-mail: [email protected]. (2) Agrochemistry and Environment Department. Miguel Hernández University Avda. de la Universidad s/n. 03202 Elche (Alicante), Spain. ABSTRACT Environmental pollution control is one of the most important goals in pollution risk assessment today. In this sense, modern and precise tools that allow scientists to evaluate, quantify and predict air pollution are of particular interest. Monitoring atmospheric particulate matter is a challenge faced by the European Union. Specific rules on this subject are being developed (Directive 2004/107/EC, Directive 2008/50/EC) in order to reduce the potential adverse effects on human health caused by air pollution. Air pollution has two sources: natural and anthropogenic. Contributions from natural sources can be assessed but cannot be controlled, while emissions from anthropogenic sources can be controlled; monitoring to reduce this latter type of pollution should therefore be carried out. In this paper, we describe an air quality evaluation in terms of levels of atmospheric particles (PM10), as outlined by European Union legislation, carried out in an industrialised Spanish coastal area over a five-year period with the purpose of comparing these values with those of other areas in the Mediterranean Basin with different weather conditions from North of Europe. The study area is in the province of Castellón. This province is a strategic area in the frame work of European Union (EU) pollution control. Approximately 80% of European ceramic tiles and ceramic frit manufacturers are concentrated in two areas, forming the so-called “ceramics clusters”; ones in Modena (Italy) and the other in Castellón. In this kind of areas, there are a lot of air pollutants from this industry then it is difficult to fulfill de
-
Upload
phungquynh -
Category
Documents
-
view
212 -
download
0
Transcript of ASSESMENT OF PM10 POLLUTION EPISODES IN A ... in terms of levels of atmospheric particles (PM10), as...
1
ASSESMENT OF PM10 POLLUTION EPISODES IN A CERAMIC CLUSTER (NE SPAIN): PROPOSAL OF A NEW QUALITY INDEX FOR PM10, As, Cd, Ni
AND Pb
Vicente A. B. (1), Sanfeliu T. (1), Jordan M.M. (2)
(1) Agricultural and Environmental Sciences Department. Jaume I University. Campus Riu Sec s/n 12071 Castellón, Spain. E-mail: [email protected].
(2) Agrochemistry and Environment Department. Miguel Hernández University
Avda. de la Universidad s/n. 03202 Elche (Alicante), Spain. ABSTRACT
Environmental pollution control is one of the most important goals in pollution risk
assessment today. In this sense, modern and precise tools that allow scientists to
evaluate, quantify and predict air pollution are of particular interest. Monitoring
atmospheric particulate matter is a challenge faced by the European Union. Specific
rules on this subject are being developed (Directive 2004/107/EC, Directive
2008/50/EC) in order to reduce the potential adverse effects on human health caused by
air pollution. Air pollution has two sources: natural and anthropogenic. Contributions
from natural sources can be assessed but cannot be controlled, while emissions from
anthropogenic sources can be controlled; monitoring to reduce this latter type of
pollution should therefore be carried out. In this paper, we describe an air quality
evaluation in terms of levels of atmospheric particles (PM10), as outlined by European
Union legislation, carried out in an industrialised Spanish coastal area over a five-year
period with the purpose of comparing these values with those of other areas in the
Mediterranean Basin with different weather conditions from North of Europe. The study
area is in the province of Castellón. This province is a strategic area in the frame work
of European Union (EU) pollution control. Approximately 80% of European ceramic
tiles and ceramic frit manufacturers are concentrated in two areas, forming the so-called
“ceramics clusters”; ones in Modena (Italy) and the other in Castellón. In this kind of
areas, there are a lot of air pollutants from this industry then it is difficult to fulfill de

2
European limits of PM10 so it is necessary to control the air quality in them. The
seasonal differences in the number of days in which pollutant level limits were
exceeded were evaluated and the sources of contamination were identified. Air quality
indexes for each pollutant have been established to determine easily and clearly the
quality of air breathed. Furthermore, in accordance with Directive 2008/50/EC, an Air
Quality Plan is proposed to protect human health, and the environment as a whole, in
the study area. General and specific corrective measures of main emission sources are
provided. A strategy for air pollution management is thus presented.
Keywords: Air Pollution. Monitoring. PM10. As. Cd. Ni. Pb. Ceramic Cluster. Air
Quality Plan. Castellón.
INTRODUCTION
Recently, advancement in economic conditions has been able to nourish the
development of environmental regulations and investments in environmental
management and pollution control (Li et al., 2004). Monitoring atmospheric particulate
matter is a challenge faced by the European Union. Specific rules on this subject
(Directive 2004/107/EC, Directive 2008/50/EC) are being developed to reduce the
potential adverse effects on human health caused by air pollution. Other adverse effects
of this kind of pollution include reduced visibility and an increase in problems affecting
the climate (Kelessis, 2001), such as global warming, environmental acidification,
photochemical smog, and ozone layer depletion (Kantarci et al., 2001; Mc Michael et
al., 2006; Sivakumar, 2007 ). The European Parliament has outlined the need to reduce
atmospheric pollution to levels that minimise harmful effects on both human health,
with particular attention paid to sensitive populations, and the environment as a whole.

3
Its objectives are to improve the monitoring and assessment of air quality, including
pollutant emissions and to provide information to the public.
To ensure that the information collected on air pollution is sufficiently representative
and comparable across the European Union, it is important that standardised
measurement techniques and common criteria for the number and location of measuring
stations are used for the assessment of ambient air quality. At the same time, air quality
plans should be developed for zones or agglomerations where pollutant concentrations
in the ambient air exceed target or limit values, in addition to any temporary margins of
tolerance, where applicable. Then environmental technology may need to be introduced
to reach these target values.
In this study, air quality evaluation in terms of the levels of the atmospheric particles,
PM10 (particulate matter <10 µm) was performed in a Spanish coastal area (the
municipality of Vila-real) for five years (2001-2005) with the purpose of comparing
these values with those of other areas in the Mediterranean Basin with different weather
conditions from North of Europe. This pollutant was analysed because it may indicate a
much higher health risk despite its low representation when compared to gas pollutants.
This pollutant enters the body exclusively through the respiratory system. Its effects
depend on whether or not it enters the respiratory tract, with the degree of penetration
depending on particle size (Foster, 1999). Recent studies have shown a positive
correlation between high concentrations of particulate matter and deterioration in human
health (Kappos et al, 2004; Neuberger et al., 2004; Le Tertre et al., 2005; Wilson et al.,
2005). The underlying biological causes of the health effects of fine particles exposure

4
are not clear, thus the investigation of their physical and chemical characteristics is
important to elucidate particles toxicity (Marcazzan et al., 2001).
In addition, particles can have a toxic effect. They may be inherently toxic due to
chemical and/or physical characteristics, they may interfere with one or more of the
mechanisms that usually clear the respiratory tract, or they may act as conductor to toxic
substance absorption (López et al., 2005). For example, particles can act as a driver of
heavy metals. Generally, fine particulate matter carries the burden of heavy toxic metals
more than coarse fractions (Shah et al., 2006). With this in mind, the concentrations of
As, Cd, Ni and Pb detected in PM10 were determined according to European
regulations (Directive 2004/107/EC, Directive 2008/50/EC). Chemical elements
measurements can also help to tracer specific emission patterns. Thus, the knowledge of
the chemical composition of particle matter can be used to evaluate the impacts of the
various pollution sources on air quality (Mazzei et al., 2008).
Furthermore, in accordance with Directive 2008/50/EC, an Air Quality Plan has been
outlined in order to protect human health and the environment as a whole in the study
area. Air Quality Indexes for each pollutant have been established to easily and clearly
understand the quality of air breathed in the study area. The Air Quality Index is scale
of colours designed to help understand the impact of air quality on health. It is a
protection tool used to make decisions to reduce short-term exposure to air pollution by
adjusting activity levels during high levels of air pollution.
5
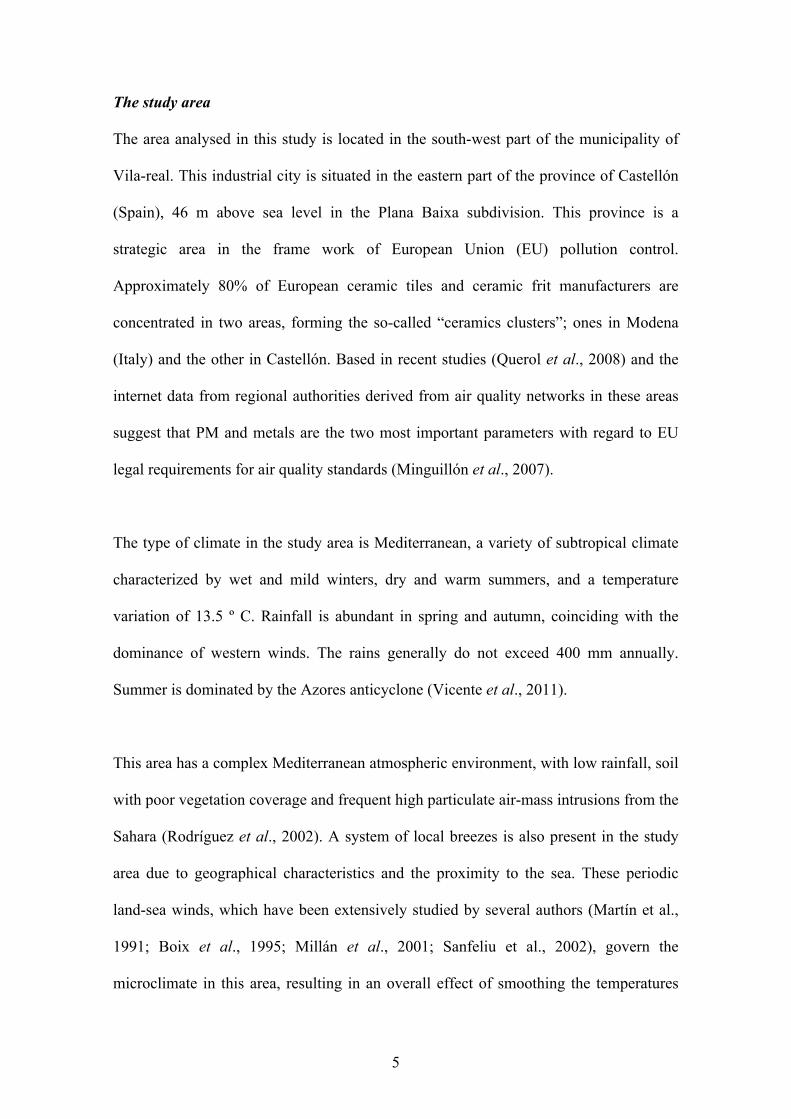
The study area
The area analysed in this study is located in the south-west part of the municipality of
Vila-real. This industrial city is situated in the eastern part of the province of Castellón
(Spain), 46 m above sea level in the Plana Baixa subdivision. This province is a
strategic area in the frame work of European Union (EU) pollution control.
Approximately 80% of European ceramic tiles and ceramic frit manufacturers are
concentrated in two areas, forming the so-called “ceramics clusters”; ones in Modena
(Italy) and the other in Castellón. Based in recent studies (Querol et al., 2008) and the
internet data from regional authorities derived from air quality networks in these areas
suggest that PM and metals are the two most important parameters with regard to EU
legal requirements for air quality standards (Minguillón et al., 2007).
The type of climate in the study area is Mediterranean, a variety of subtropical climate
characterized by wet and mild winters, dry and warm summers, and a temperature
variation of 13.5 º C. Rainfall is abundant in spring and autumn, coinciding with the
dominance of western winds. The rains generally do not exceed 400 mm annually.
Summer is dominated by the Azores anticyclone (Vicente et al., 2011).
This area has a complex Mediterranean atmospheric environment, with low rainfall, soil
with poor vegetation coverage and frequent high particulate air-mass intrusions from the
Sahara (Rodríguez et al., 2002). A system of local breezes is also present in the study
area due to geographical characteristics and the proximity to the sea. These periodic
land-sea winds, which have been extensively studied by several authors (Martín et al.,
1991; Boix et al., 1995; Millán et al., 2001; Sanfeliu et al., 2002), govern the
microclimate in this area, resulting in an overall effect of smoothing the temperatures

6
(Posgosyan, 1965). Due to this system of breezes, the concentration of pollutants may
be affected by emission sources located outside the Vila-real on a daily basis (Fig. 1).
The planning of effective strategies for the abatement of atmospheric PM concentrations
requires the evaluation of source contributions to the PM levels (Bernardorni et al.,
2011). The origin of PM10 in this area is both natural and anthropogenic. The former is
due to the resuspension of mineral materials from the surrounding mountains with poor
vegetation coverage and the long-range transport of materials from North Africa
(Rodríguez et al. 2001, Pérez et al. 2006). These dust intrusions from North Africa
influence ambient PM10 levels in the study area at around 2 !/m3 on an annual basis
(Minguillón et al, 2009). Contributions from natural sources can be assessed but not
controlled.
Anthropogenic pollution sources originate from automobile traffic (mobile sources) and
industrial activity (fixed sources). The main industrial activity in the study area is based
on producing ceramic tile (Vicente et al. 2007).. This industrial sector has two types of
factories, one for the manufacture of tiles and the other to supply raw materials. The raw
materials of the tile body consist mainly of clay from sources such as opencast quarries
within the ceramic cluster area (Jordán et al., 2009; Sanfeliu et al., 2009). The raw
materials for decoration involve manufacture frits, enamels, and colour (Jordán et al.,
2006). In the manufacture of ceramic tile, channelled and diffuse emissions from the
production processes and the storage, handling and transport of raw materials all
increase the concentration of particles in the air (Sanfeliu et al., 2002). However,
particle emissions from the manufacture of pigments, frits and enamels probably have a
greater impact on the levels of heavy metals than on particle mass. (Minguillón et al.,

7
2007). An additional important factor is that a power station, a refinery and several
chemical industries are located at east of the study area (Boix et al., 2001). These
industries together contribute to environmental pollution in the area. Finally, relevant
sources of secondary PM in the area include precursor emissions of the volatile organic
compounds (VOC’s), NOx and SO2 from high temperature ceramic processes, power
generation, petrochemical processes and biomass combustion (Minguillón et al., 2007).
!"# $%&# '()&# *+# '%&,-'(.)# /*..0$("$)# -"# 12345# '*"'&"$6($-*"# .&7&.)# *+# (6)&"-'# (6&#
())*'-($&8#9-$%#+*))-.#+0&.#'*,:0)$-*"#;$6(++-'5#/*9&6#)$($-*"5#6&+-"&6<#("8#'%&,-'(.#
-"80)$6-&)=# >%-*# ("8# ?(,&$# 3@@@A# B&7&6$%&.&))5# $%&# ,(-"# )*06'&# *+# C6)&"-'#
'*"$6-:0$-*"# -"# $%&# )$08<# (6&(# -)# 6&.($&8# $*# -"80)$6-(.# /6*'&))&)# :()&8# *"#
"*",&$(..-'#,($&6-(.)5# )0'%# ()# $%&# '&6(,-'# -"80)$6<D# E%-)# &.&,&"$# -)# +*0"8# ()# ("#
-,/06-$<# -"# :*6('-'# '*,/*0"8)# ;'*.&,("-$&# ("8# %<86*:*6('-$&A5# 0)&8# -"# $%&#
+*6,0.($-*"#*+# +6-$)#("8#&"(,&.)5#9%-'%#,&(")#(#/*))-:.&#(6)&"-'#*6-F-"5# +6*,# -$)#
7*.($-.-G($-*"#("8H*6#7(/*6-G($-*"#806-"F#$%&#+-6-"F#("8#+0)-*"#/6*'&))&)#;1(..(6I)#
&$#(.D5#J44KAD#B-'L&.#-)#+*0"8#()#(#$6('&#&.&,&"$#-"#/&$6*.5#("8#$%&6&+*6&#-$)#6&.&()&#
-"$*# $%&#($,*)/%&6&# -)# 6&.($&8#,(-".<# $*# $%&# '*,:0)$-*"#*+# +*))-.# +0&.)# ;'*(.# ("8#
+0&.#*-.A#-"#&.&'$6-'-$<#("8#%&($#/6*80'$-*"#("8#$6(++-'#&,-))-*")#;1('<"(#&$#(.D#3@MN=#
>%-*# ("8# ?(,&$#3@@@AD#B-'L&.# *O-8&)# (6&# (.)*#9-8&.<#0)&8# ()# '*,/*"&"$)# *+# $%&#
/-F,&"$)# 0)&8# -"# $%&# '&6(,-')# -"80)$6<D# E%&# '*"'&"$6($-*"# .&7&.)# *+# '(8,-0,# -"#
(,:-&"$#(-6#(6&#())*'-($&8#9-$%# -"80)$6-(.#/6*'&))&)# -"#$%&#,("0+('$06-"F#*+# +6-$)#
("8# &"(,&.D# P,-))-*")# *+# '(8,-0,# (6&# (.)*# /6*80'&8# -"# $%&# /6*'&))&)# *+# $%&#
/*9&6# )$($-*"# ;Q*-O# &$# (.D# J443AD# E%&#,*)$# -,/*6$("$# &,-))-*"# *+# .&(8# -)# $6(++-'D#
1&$6*.# (88-$-7&)# '*"$(-"# .&(8# ;1(6&L%# &$# (.D# J44JA5# 9%-'%# (+$&6# '*,:0)$-*"# -)#
6&.&()&8# -"$*# $%&# ($,*)/%&6&# ()# *6F("-'# .&(8# ;.&(8# :6*,-8&# ("8# .&(8#

8
'%.*6-"&:6*,-8&A#;1('<"(#3@@MAD#R-$%#$%&#-"$6*80'$-*"#*+#"&9#-"$&6"($-*"(.#.(9)5#
$%�)&#*+#.&(8#-"#/&$6*.#%()#:&&"#:(""&85#("8#$%-)#'*"$6-:0$-*"#-)#"*9#,-"-,(.5#-$)#
0)&# 6&80'&8# $*# *:)*.&$&#,&(")# *+# $6(")/*6$($-*"D# !"# $%&# '&6(,-')# -"80)$6<5# .&(8#
*O-8&)# (6&# (.)*# 0)&8# &O$&")-7&.<# ()# (# '*,/*"&"$# *+# /-F,&"$)D# S&.($-*")%-/)#
:&$9&&"#$%&#&,-))-*")#+6*,#$%-)#)&'$*6#$*#(-6#(,:-&"$#.&7&.)#*+#.&(8#-"#'.*):("#
(6&()#%(7&#:&&"#-8&"$-+-&8#;?("+&.-0#&$#(.D#J44J=#>T,&G#&$#(.D#J44UAD#
Bearing in mind that these emissions are from anthropogenic sources and can thus be
controlled, monitoring should be carried out to reduce pollution.
METHODOLOGY
Sampling conditions
The sampling station was set up in the southwest part of the city (UTM: X 746,543 Y
4,424,906) in accordance with the implementation guidelines of European Council
Directive 2008/50/EC. In order to avoid measuring microclimates, the sampling station
was situated 3 m above ground level on a special metallic platform in an open area
covering at least 500 m2. There were no local emission sources nearby so that a
distortion of the samples due to the influence of smoke plumes from specific pollutants
was avoided.
A PM10 medium volume sampler model IND-LVS3 manufactured by Kleinfiltergerät
was used. This device is considered as a reference according to European regulations
(Council Directive 2008/50/EC; EN 12341:1999), for the sampling of PM10 particles.
The technology used in the equipment consists of blowing air through an inlet with a

9
vacuum pump. The particulate matter was blown in through the opening circumference
between the frame and the round cover mounted on top. Within the sampler inlet the
airflow was accelerated by eight impactor nozzles and then directed toward the
impacting surface. Particles were trapped on a permeable support consisting of a 47mm-
diameter filter. The device contains a temperature sensor with a radiation protector that
eliminates deviations in the reading caused by solar radiation in addition to a pressure
sensor. The sampling flow volume was 2.3m3/h during 24 h periods. A total of 887
PM10 samples were collected in filters from 2001 to 2005. The filters used were quartz
fiber according to EN 12341:1999. They made of from Si O2 pure base and are totally
free of additives. These filters allow an efficiency of separation greater than 99.5%.
Gravimetric analysis
Particle concentration levels were determined gravimetrically. This method consists of
weighing the empty filter first and then again with the sample. In order to weigh the
filter correctly, it must be conditioned for at least 48 h in a special chamber. The
conditions inside the chamber are 50% relative humidity at 20ºC in accordance with the
normative EN 12341:1999. Filters were weighed on an analytical balance with a
precision of 0.1 mg. The PM concentration levels were determined based on the sample
quantities obtained and the volume of air pumped.
Chemical analysis
The levels of As, Cd, Ni and Pb in the PM10 samples were determined by inductively
coupled plasma mass spectrometry (ICP-MS). The equipment used was a Agilent model
7500CX that included a quadrupole, a collision cell and an integrated autosampler. The
equipment was installed in a chamber with a clean air filter unit and an independent air

10
conditioning system. This instrumental technique allows the As, Cd, Ni and Pb levels to
be rapidly identified after dissolution of the sample. Dissolution was achieved by acid
digestion in hermetic Teflon recipients. This methodology has been used by many
authors (Kubilay et al., 1995; Querol et al., 2000).
In order to detect any possible traces of contamination-causing As, Cd, Ni or Pb
contained in the reagents and quartz filter fibres, digestions with only reagents (blank
reagents) and filters without a sample (blank filters) were performed. The SRM 1648
“urban particulate matter” pattern was used to validate the results. This pattern consists
of particulate matter of anthropogenic origin collected in an industrialised urban
atmosphere and was an adequate standard of reference for this study.
RESULTS AND DISCUSSION
PM10
Table 1 shows the assessment of PM10 according to the limit values established by
current legislation (European Council Directive 2008/50/EC). The highest numbers of
exceedences of daily limit values were detected in 2005. In the same year, the highest
annual average within the five-year period studied was obtained. The values obtained in
2001 are close to those of 2005. From 2001 to 2004, a progressive decrease in the
concentration levels of PM10 occurred, but this trend did not continue in 2005.
Assessment included only the days sampled each year, not all 365 d of the year, as
outlined in Directive 2008/50/EC. The 35 d in which the legal limit value was exceeded
correspond to 9.6% of the full year. Table 2 shows the percentages of days with
exceeded levels in the five-year period. Based on this reassessment, a decrease in these
percentage values can be observed from 2001 to 2004, followed by an increase in 2005.

11
However, the percentages of exceedances of daily limit value obtained during five years
of study are higher than the percentage limit. Consequently, the limit values
recommended by EU legislation for the protection of human health and ecosystems
have not been complied with in the study area.
The seasonal evolution of the number of exceedances the proposed limit value of PM10
could supply valuable information about the potential origin of particles. These seasonal
variations are dominated by changes in meteorological conditions (Chang et al., 2008).
In this case, a tri-modal trend is observed, with peaks in spring, summer and winter
(Fig. 2). The same pattern was detected by Alastuey et al. (2000) in Onda, a town close
to Vila-real (15 Km). PM10 levels increase during the months with high temperatures
(from June to August) due to a decrease in precipitation. This causes a reduction in the
cleansing effect on the atmosphere (Bergametti et al. 1989) and consequently a greater
contaminant concentration in the ambient air. The high temperatures during these
months lead to increased dryness of the terrain, which favours the resuspension of clay-
loam substrate in the area (Gómez et al., 2005). At the same time, the mixing layer, or
lower part of the troposphere where the pollutants are free to move through the
turbulence generated in the lower layers of the atmosphere, increases its thickness and
facilitates the mixing of air masses from the north of Africa in the low layers (Kubilay
et al., 1995). Intrusion episodes of long-distance material occur, leading to an increase
in the concentration of PM10. The days in which material intrusions from long transport
are detected are presented in Table 3.
During the winter months, temperature inversions are generated. This phenomenon
occurs on clear nights when the soil loses the heat acquired by radiation and low-lying

12
air layers are cooled faster than the upper layers of air. (Wallace et al., 2010). When
pollutants are emitted under temperature inversion conditions, they accumulate in the
layers of the troposphere close to the ground. This phenomenon causes transport
through these layers to occur too slowly, producing an increased concentration of
pollutants (Monn et al., 1995). This accumulation of pollutants is also found in Milan
due to persistent thermal inversions (Marcazzan et al, 2001).
During the autumn season, the lowest values of the study were detected. This was due to
atmospheric instability, the tendency of the atmosphere to resist or enhance vertical
motion or, alternatively, to suppress or augment existing turbulence (Zoras et al., 2006).
As global weather conditions change, the input frequency of air masses from North
Africa is reduced (the mixed layer decreases), rainfall increases, and there is a greater
cleansing effect in the atmosphere (Querol et al., 2002).
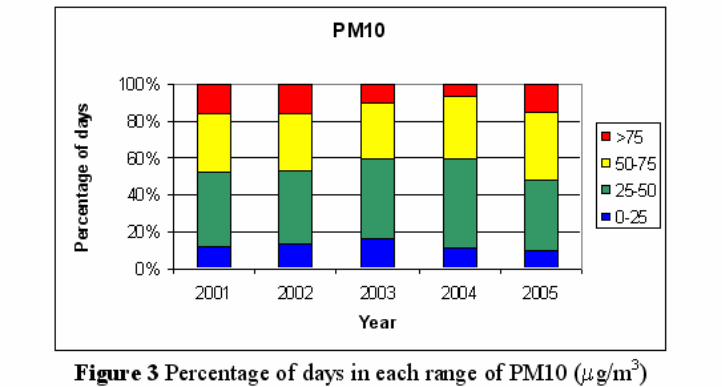
Quality Index for PM10
Table 4 presents the Daily Quality Index Criteria for PM10 reflecting the daily limit
value specified in the legislation. Figure 3 shows the percentage of days in each range.
Green and blue colours associated with good air quality and yellow and red colours
corresponding to poor air quality are distributed equally. It may be clearly observed that
the days in which the limit value of PM10 is exceeded and the days in which this limit
is not exceeded are equal in number. According to this criterion, 2004 had the best air
quality, while 2005 had the worst.
As, Cd, Ni and Pb in PM10

13
Table 5 shows the assessment of As, Cd, Ni and Pb levels in PM10 according to the
limit values established by current legislation (European Council 1999/30/EC for Pb
and Directive 2008/50/EC for As, Cd, and Ni). The annual average values for lead,
cadmium and nickel were below the recommended limit during the five-year study
period. Air pollution due to these pollutants was not detected in the study area. For lead
and cadmium, the annual average values decreased during the study period. An
improvement in air quality in terms of these pollutants was observed. At the same time,
the annual average values for nickel dropped from 2001 to 2003 and then increased
until 2005. Although the annual average values for arsenic decreased during the five-
year study period, the recommended limit value according to current legislation was not
met in 2001, 2002 or 2003. An improvement was observed starting in 2004, when the
limit value was first met. Being in mind that the main sources of Arsenic in the study
area is from raw materials used in ceramic industry; this kind of industry changed their
raw materials to others more cleanly during study period. Thus there has been an
improvement in air quality concerning this pollutant.
.
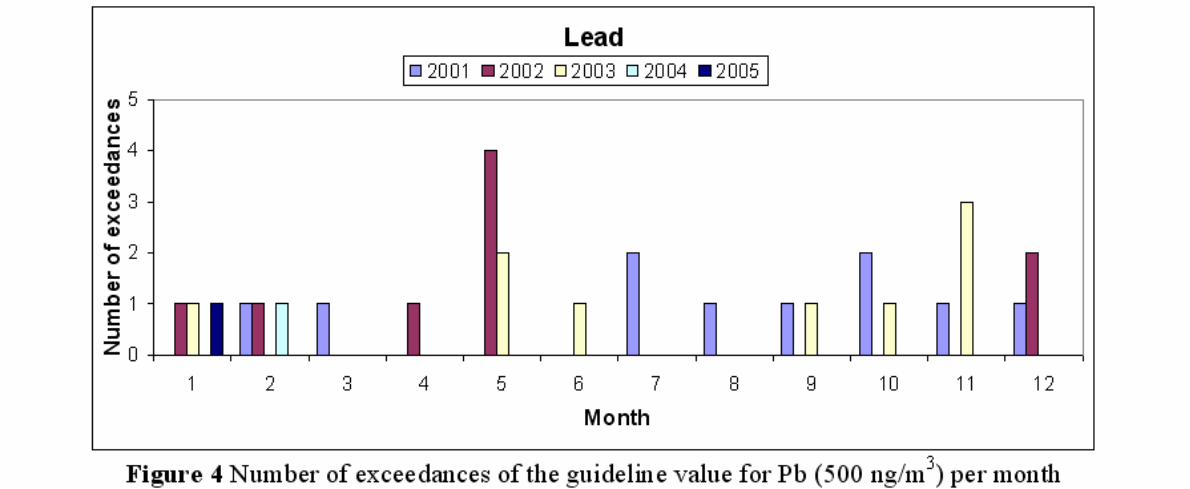
The distribution of the number of days per month with exceeded limit values for lead
(500 ng/m3), arsenic (6 ng/m3) and cadmium (5 ng/m3) is continuous and no trend may
be observed (Figs. 4, 5 and 6). In the case of nickel (20 ng/m3, Fig. 7), limit value
exceedences were very infrequent, taking place only from May to August.
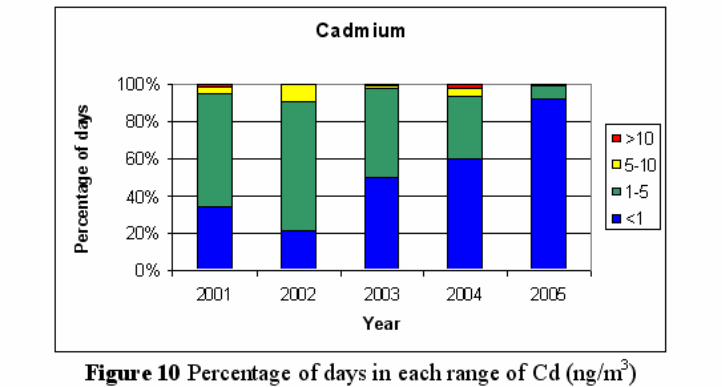
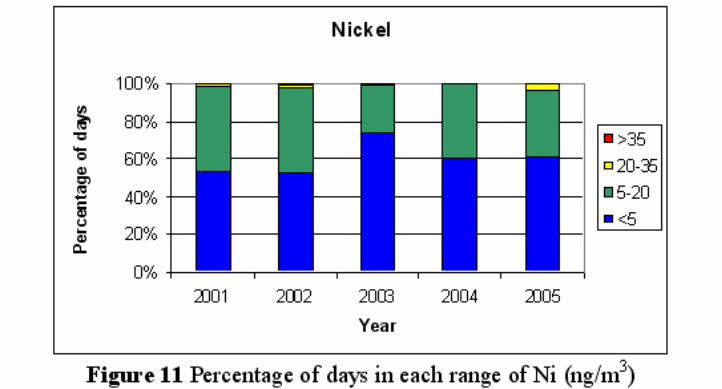
Quality Index for As, Cd, Ni and Pb in PM10
Table 6 shows the Quality Index Criteria for As, Cd, Ni and Pb in accordance with the
limit values set by the legislation. Figures 8 to 11 show the percentages of days in each
range of the quality index criteria for each pollutant.

14
In the case of lead (Fig.8), the predominant colours were green and blue, corresponding
to a low level of contamination during the study period. However, it should be noted
that during 2001, 2002 and 2003 a small percentage of yellow and red for poor air
quality appeared. This improved in 2004 and 2005.
From 2001 to 2003, the predominant colours for arsenic were yellow and red due to the
pollution from this element being very high (Fig. 9). Green and blue colours during
2004 and 2005 were observed, indicating a significant improvement in air quality.
Cadmium (Fig. 10) and nickel (Fig.11) levels did not produce yellow or red colours in
the figure, reflecting good air quality with regard to these two pollutants from 2001 to
2005.
Air Quality Plan
In view of the results from the study area, it is necessary to implement an Air Quality
Plan to improve the control of air quality, thus promoting sustainable development, to
ensuring a future with quality parameters within limit values, guaranteeing the welfare
of the population and preserving natural ecosystems and material goods.
The origin of pollutants in this area is both natural and anthropogenic (see Introduction).
Contributions from natural sources can be assessed but not controlled; emissions from
anthropogenic sources, meanwhile, are controllable and should be monitored and
reduced. With an Air Quality Plan, the specific actions at different levels of intervention
can affect different anthropogenic emission sources and be tailored to each pollutant.

15
These actions may be general or specific to each subgroup of emission sources. In the
study area, the main pollutants are automobile traffic and the ceramic industry.
Therefore, the measures taken in the Air Quality Plan specific to Vila-real should, for
the main part, adapt to these emission sources.
General corrective measures
These measures are aimed at all populations in general. The main objective is to educate
the public on problems of air quality. The following are proposed measures:
- Promote campaigns to raise public awareness.
- Inform the public of the advantages of public transport and the environmental
risks and costs of private vehicles.
- Inform the public of emissions and the associated risks to human health.
- Promote renewable energy systems (e.g. hot water heating derived from solar
energy).
- Plant trees that cause a sink effect on greenhouse gases. These vegetation fences
must be properly oriented to the direction of prevalent daytime winds.
- Carry out management with government grants and subsidies that involve all
sectors of population (citizens and local public or private entities).
Corrective measures for automobile traffic
General:
- Restrict private car use and encourage the use of public transport services.
- Modify office or work activity hours.

16
- Report on atmospheric pollution and identify the measures that affect the
mobility of citizens.
Specific:
- Control vehicle emissions.
- Establish agreements with public transport and car park companies.
- Maintain strict control of parking prohibitions and certain driving infractions.
- Reduce the speed limit on certain roadways.
Territorial:
- Create a detour for vehicles around polluted areas.
- Implement plans to change the settings of traffic lights to modify the access to
and exit from contaminated areas by motor vehicles.
- Redistribute public transport lines.
- Subsidize public transport services to encourage its use.
- Increase pedestrian areas and encourage walking inside urban areas.
Corrective measures in the industry
General:
- Restrict the use of certain fuels and eliminate polluting fuels.
- Promote renewable energy.
- Modify the activity of certain production processes to make cleaner processes
more viable.
- Establish protocols and agreements with industries that are potentially polluting
for appropriate corrective action.

17
- Introduce fiscal tools that both encumber the pollution caused by companies
such as those in the energy industry and promote a system that will reverse the
pollution and improve energy efficiency.
- Regulate the territorial concentrations of potentially polluting activities, taking
into account the carrying capacity of industrial estates. Promote the expansion of
industrial zones in areas farthest from areas of urban growth. In the case of Vila-
real, we suggest expanding the industrial area west of the city centre.
Specific: Corrective measures in relation to the extraction, transportation, loading,
unloading and storage of non-metallic mineral raw materials
These industrial activities are characterized by operations performed outdoors that
produce diffuse dust emissions at ambient temperature. The measures proposed are as
follows:
- Restrict, modify and/or alternate transport and delivery timetables of goods in
the area.
- Irrigate raw materials into and out of the transport vehicles (e.g. construction
materials, gravel, sand, and other raw clay materials).
- Clean vehicle wheels once the loading and unloading of raw materials is
finished.
- In order to prevent emissions of particles into the atmosphere from transport
losses, inspect big bags or any canvas that covers the materials.
- Irrigate outdoor clay storage, especially during the hours of solar radiation from
8 a.m. to 7 p.m., when the more intense winds are produced.
- Irrigate traffic areas in material storage areas out of doors.
18
- Limit the height of outdoor stockpiles to control dust emissions.
- Store powdery raw materials (mainly clays) in indoor areas.
- Plant vegetation fences near sites of raw material transport with proper
orientation to the direction of the prevailing wind in the locality. During the
diurnal cycle of radiation from 7 a.m. to 6 p.m., the wind direction is generally
from the south-east to the north-west.
- Encourage and promote any type of material transport in closed systems. (e.g.
pneumatic conveying systems, especially those for use in manufacturing ceramic
frits and glazes).
Specific: Corrective measures in manufacturing of tiles and frits, glazes and colours.
Corrective measures in the manufacture of frits, glazes, and colours are to be applied to
the industrial processes characteristic of the area, which are carried out indoors and
involve a process of treatment or processing of the original materials. The pollutants
discharged into the atmosphere are generally issued by chimney at a high temperature.
These emissions are produced during the preparation of raw materials (milling and
spraying), moulding, drying, preparation and application of tile glaze and melting of
frits and ceramic glazes. The proposed measures are as follows:
- Use pneumatic systems for the transport of raw materials in the various
industrial processes.
- Install inlet valves at the sites of the different processes that may generate dust
emissions.
- During the drying phase, brush the products to prevent resuspension and
subsequent particle emissions by chimney.

19
- Ensure good aspiration of the pieces in the kiln inlet in order to reduce
particulate matter discharged by chimney.
- Purify gases at the chimney outlet.
- Encourage and promote the use of clean fuels and raw materials that are free of
toxic compounds.
- Promote the implementation of environmental management systems to improve
air quality through specific grants in this field.
CONCLUSIONS
The challenge to reduce air pollution and maintain a sustainable environment is
immense. The European Parliament has established the need to reduce atmospheric
pollution to minimise harmful effects on human health, with particular attention paid to
sensitive populations, and reduce damage to the environment as a whole. This may be
carried out by improving the monitoring and assessment of air quality and pollutant
emissions and providing information to the public. With this in mind, the origin of
pollutants in the study area and the possible methods of controlling them to improve the
population’s health were analysed in our investigation.
The study area of our paper is in the province of Castellón (Spain). This province is a
strategic area in the frame work of European Union (EU) pollution control.
Approximately 80% of European ceramic tiles and ceramic frit manufacturers are
concentrated in two areas, forming the so-called “ceramics clusters”; ones in Modena
(Italy) and the other in Castellón. In this kind of areas, there are a lot of air pollutants
from this industry then it is difficult to fulfill de European limits of PM10 so it is
necessary to control the air quality in them.

20
Air quality assessment in terms of levels of atmospheric particles (PM10) was
performed in this industrialised area according to European Union laws. The seasonal
variation in the number of days in which the limit values for pollutants were exceeded
have been evaluated and the sources of the contamination have been identified.
Air quality indexes of each pollutant have been established to serve as a tool to
understand easily and clearly the quality of air in the study area. Thus, the public has
been provided with a useful method of determining whether the concentration levels of
pollutants are harmful to their health.
An Air Quality Plan is proposed in order to improve pollution control. General and
specific corrective measures for the main emission sources have been provided.
The methodology carried out in this paper is a useful tool for developing future Air
Quality Plans in other industrialised areas.
ACKNOWLEDGES
The present study was supported by Environment department of Vila-real and Almazora
city Councils. The authors wish to acknowledge “Serveis Centrals d’Intrumentació
Científica” of the Jaume I University for their collaboration.
21
REFERENCE
Alastuey A., Mantilla E.; Querol X., Rodríguez S., 2000. Study and evaluation of
atmospheric pollution in Spain necessary measures arising from the EC Directive on
PM10 and PM2.5 paricles in the Ceramic industry. Boletín de la Sociedad Española de
Cerámica y Vidrio 39(1),135-148.
Bergametti G., Dutot A.L., Buat-Menard P., Losno P., Remoudaki E., 1989. Seasonal
variability of de elemental composition of the atmospheric aerosol particles over the
Nortwestern Mediterranean. Tellus. 41B, 353-361.
Bernardoni V., Vechhi R., Valli G., Piazzalunga A., Fermo P., 2011. PM10 sources
apportioment in Milan (Italy) ussing time-resolved data. The Science of the Total
Environment. 409:4788-4795.
Boix A., Company V., Jordán M.M., Sanfeliu T., 1995. Vectorial model to study the
local breeze regimen and its relationship with SO2 and particle matter concentrations in
the urban area of Castellón, Spain. The Science of the Total Environment 172:1-15.
Boix A., Jordán M.M., Querol X., Sanfeliu T., 2001. Characterization of total
suspended particles around a power station in an urban coastal area in eastern Spain.
Environmental Geology 40, 891-896.

22
Chang S.C., Lee C.T., 2008. Evaluation of the temporal variations of air quality in
Taipei City, Taiwan, from 1994 to 2003. Journal of Environmental Management. 86,
627-635.
EN 12341:1999 Air quality: Determination of the PM10 fraction of the suspended
particulate matter. Reference method and field test procedure to demonstrate reference
equivalence of measurement methods.
European Council Directive 1999/30/EC of 22th April 1999 relating to limit values for
sulphur dioxide, nitrogen dioxide and oxides of nitrogen, particulate matter and lead in
ambient air. Official Journal of the European Union L163, 26th September, 1999. 41-60.
European Council Directive 2004/107/EC of 15th December 2004 relating to arsenic,
cadmium, mercury, nickel and polycyclic aromatic hydrocarbons in ambient air.
Official Journal of the European Union L 23, 26th January, 2005, 3-16.
European Council Directive 2008/50/EC of 21st May 2008 on ambient air quality and
cleaner air for Europe. Official Journal of the European Union L152, 11th June, 2008, 1-
44.
Foster, W.M., 1999. Deposition and clearance of inhaled particles. In: Air pollution and
Health. Eds. Holgate S.T.; Samet J.M.; Koren H.S.; Maynard R.L. Ed. Academic Press.
San Diego USA 295-324.

23
Ghio A.J.; Samet J.M. (1999) “Metals and air pollution particles”. En: Air pollution and
health. Eds. Holgate S.T.; Samet J.M.; Koren H.S.; Maynard R.L. Ed. Academic Press.
pp.634-651
Gómez, E.T., Sanfeliu, T., Jordán, M.M., Rius, J., 2005. Evolution, sources and
distribution of mineral particles and amorphous phase of atmospheric aerosol in an
industrial and Mediterranean coastal area. Water, air, and soil pollution 167, 311-330.
Jordán M.M, Álvarez C., Sanfeliu T., 2006. Spherical particles as tracers of atmospheric
ceramic industry Environmental Geology 51, 447–453.
Jordán M.M., Martín-Martín J:D, Sanfeliu T, Gómez-Gras D, De la Fuente C., 2009.#
VMineralogy and firing transformations of Permo–Triassic clays used in the
manufacturing of ceramic tile bodies.#Applied Clay Science 44, 173–177
Kantarci, M.D. and Karaöz, O., 2001. Air pollution effects on forests in Turkey.
Fresenius Environmental Bulletin 10 (3), 323-328.
Kappos, A.D., Bruckman, P., Eikmann, T., Englert, N., Heinrich, U., Höppe, P., Koch,
E., Kreyling, W.G., Rauchfuss, K., Rombout, P., Schulz-klemp, V., Thiel, W.R.,
Wichman, H.E., 2004. Health effects of particles in ambient air. International Journal of
hygiene and environmental health 207,399-407.
Kelessis, A.G.,2001. Eleven years of primary air-pollutnat observation in the city of
Thessalonki, Greece. Fresenius Environmental Bulletin 10 (7), 624-628.

24
Kubilay, N. and Saydam, A.C., 1995. Trace elements in atmospheric particulate over
the eastern Mediterranean; concentrations, sources and temporal variability.
Atmospheric Environment 29, 1352-1310.
Le Tertre, A., Schwart, J., Touloumi, G., 2005. Empirical bayes and adjusted estimates
approach to estimating the relation of mortality to exposure of PM10. Risk analysis
25(3), 711-718.
Li J., Guttikunda, S.K., Carmichael G.R., Streets D.G., Chang Y.S., Fung V., 2004.
Quantifying the human health benefits of curbing air pollution in Shanghai. Journal of
Environmental Management. 70, 49-62.
López J.M., Callén M.S., Murillo R., García T., Navarro M.V., De la Cruz M.T.,
Mastral M.V. 2005. Levels of selected metals in ambient air PM10 in an urban site of
Zaragoza (Spain). Environmental Research 99:58-67.
Marcazzan G.M., Vaccaro S., Valli G., Vecchi R., 2001. Characterization of PM2.5 and
PM10 particulatte matter in the ambient air of Milan (Italy). Atmospheric Environment
35, 4639-4650.
Martín M.; Plazas J.; Andrés M.D., Bezares J.C. Millán M.M., 1991. Comparative study
of seasonal air pollutant behaviour in a Mediterranean coastal site: Castellón (Spain)”
Atmospheric Environment 25A, 1523-1535.

25
Mazzei F., D’Alessandro A., Lucarelli F., Nava S., Prati P., Valli G., Vecchi R., 2008.
Characterization of particulate matter sources in an urban environment. The Science of
the Total Environment 401:81-89.
McMichael, A.J., Woodruff, R.E., .Hales, S., 2006. Climate change and human health;
present and future risk. Lancet 367, 859-869.
Millán M.M.; Artiñano B.; Alonso L.; Navazo M.; Castro M., 2001, The effect of meso-
scale flows on regional and long-range atmospheric transport in the western
Mediterranean area” Atmospheric Environment 25A(5/6), 946-963
Minguillón M.C., Querol X., Alastuey A., Monfort E., Mantilla E., Sanz M.J., Sanz F.,
Roig A., Renal A., Felis C., Miró J.V., Artiñano B., 2007. PM10 speciation and
determination of air quality target levels. A case study in a highly industrialized area of
Spain” Science of the total environment 372, 382-396.
Miguillón M.C., Monfort E., Querol X., Alastuey A., Celades I., Miró J.B., 2009. Effect
of ceramic industrial particulate emisión control on key components of ambient PM10.
Journal of Environmental Management 90, 2558-2567.
Monn Ch.; Braenli O.; Schaeppi G.; Schindler Ch,; Ackermann-Liebrich U.;
Leuenberger Ph. and Sapaldian team, 1995. "Particulate matter <10 µm (PM10) and
total suspended particulate (TPS) in urban rural and alpine air in Switzerland.
Atmospheric Environment 29, 2565-2573.

26
Neuberger, M., Schimek, M.G., Horak, F. Jr., Moshammer, H., Kundi, M., Frischer, T.,
Gomiscek, B., Puxbaum, H., Hauch,,H., 2004. Acute effects of particulate matter on
respiratory diseases, symptoms and functions: epidemiological results of the Australian
Project on health effects of particulate matter (AUPHEP). Atmospheric Environment
38, 3971-3981.
Pacyna J.M.; Semb A.; Hanssen J.E. 1984. Emission and long-range transport of trace
elements in Europe. Tellus 36B:163-178.
!
Pacyna J.M. 1998. Sources inventories for atmospheric trace metals. In: Atmospheric
particles. IUPAC Series on analytical and physical chemistry of environmental systems.
Eds. Harrison R.M.; Van Grieken R:E. Ed. J. Wiley & sons Vol.5:385-424.
Pallarés S., Vicente A.B., Jordán M.M., Sanfeliu T. 2007 Study of the Levels of
Concentration of As, Cd and Ni in a Ceramic Cluster. Water, Air and Soli Pollution
180:51–64.
Parekh P.P., Khwaja H.A., Khan A.R., Naqvi R.R. 2002. Lead content of petrol and
diesel and its assessment in an urban environment. Environmental Monitoring and
Assessment 74:255-262.
Pérez, C., Nickovic, S., Baldasano, J.M., Sicard, M., Rocadenbosch, R., 2006. A long
Saharan dust event over the western Mediterranean: Lidar sun photometer observations,
and regional dust modeling. Journal of Geophysical Research Vol. 111, D15214 doi:
10.1029/2055JD006579.
27
Pogosyan K.H.P., 1965. The air envelope of the earth. Published by The Israel program
for scientific translations. Jerusalem
Querol, X., Alastuey, A., López-Soler, A., Plana, F., 2000. Levels and chemistry of
atmospheric particulates induced by spill of heavy metal mining wastes in the Doñana
area Southwest, Spain. Atmospheric Environment 34, 239-253.
Querol X.; Alastuey A.; Rosa J.; Sánchez-De-La-Campa A.; Plana F.; Ruir C.R., 2002.
Source apportiment analysis of atmospheric particles in an industrialised urban site in
Southwestern Spain. Atmospheric Environment 36, 3113-3125.
Querol X., Alastuey A., Moreno T, Viana M.M., Castillo S., Pey J.,Rodríguez S,
Artiñano B, Salvador P., Sánchez M, Garcia Dos Santos S., M.D. Herce Garraletac, R.
Fernandez-Patierc, S. Moreno-Graud, L. Negrald, M.C. Minguillón, E. Monfort, M.J.
Sanz, R. Palomo-Marín, E. Pinilla-Gil, E. Cuevas, J. de la Rosa, A. Sáchez de la
Campa. 2008. Spatial and temporal variations in airborne particulate matter (PM10 and
PM2.5) across Spain 1999–2005. Atmospheric Environment 42,3964–3979.
Rodríguez, S., Querol, X., Alastuey, A., Kallos, G., Kakaliagaou, O. 2001. Saharan dust
contribution to PM10 and TPS levels in southern and eastern Spain. Atmospheric
Environment 32, 2433-2447.

28
Rodríguez, S., Querol, X., Alastuey, Mantilla E., 2002. Origin of high summer PM10
and PST concentrations at rural sites in Eastern Spain. Atmospheric Environment 36,
3101-3112.
Sanfeliu T., Jordán M.M., Gómez E.T., Álvarez C., Montero M.A., 2002. Distribution
of the atmospheric emissions of Spanish ceramics industries. Environmental Geology
41, 601-607.
Sanfeliu T., Jordán M.M., 2009. Geological and environmental management of ceramic
clay quarries: a review. Environmental Geology 57, 1613–1618.
Shah M.H., Jaffar M., Khalique A., Tariq S.R., Manzoor S. 2006. Spatial variations in
selected metal contents and particle size distribution in an urban and rural atmosphere of
Islamabad, Pakistan. Journal of Environmental Management 78, 128-137.
Sivakumar, M.V.K., 2007. Interactions between climate and desertification.
Agricultural and forest Meteorology 42(2-4), 143-155.
Vicente A.B., Jordan M.M., Pallarés S., Sanfeliu T., 2007. PM10 and Pb evolution in an
industrial area of the Mediterranean basin. Environmental Geology 51, 1413-1424.
Vicente A.B., Sanfeliu T., Jordan M.M., 2011. Comparison between industrial-urban
and rural particle stations in a ceramic cluster (NE, Spain). Water, Air and Soil
Pollution 215, 83-96.
29
Wallace J., Corr D., Kanaroglou P., 2010. Topographic and spatial impacts of
temperature inversions on air quality using mobile air pollution surveys. Science of The
Total Environment 408, 5086-5096.
Wilson, J.G., Kingham, S., Earce J., Sturman, A.P., 2005. A review of intraurban
variation in particulate air pollution: Implications for epidemiological research.
Atmospheric Environment 39, 6444-6462.
Zoras S., Triantafyllou A.G., Deligiorgi D., 2006. Atmospheric stability and PM10
concentrations at far distance from levated point sources in complex terrain: Worst-case
episode study. Journal of Environmental Management 80, 295-302.

Table 1 Air quality comparison of PM10 in the five years of study.
Averaging Limit value period PM10 (µg/m3) 2001 2002 2003 2004 2005
Daily limit value
24 hours
50 not to be exceeded more than 35 times a calendar year
87 exceedances
70 exceedances
70 exceedances
77 exceedances
94 exceedances
Annual limit value Calendar
year
40,0 52,0 51,0 47,2 46,3 52,3

Table 2 Percentages of daily limit value exceedances
Exceedance percentage Limit PM10 n=365 days
2001 n=184
2002 n=150
2003 n=178
2004 n=194
2005 n=181
9,6%
47,3%
46,7%
39,9%
39,7%
51,9%

Table 3 Intrusion days of particulate matter on the study area.
Mes 2001 2002 2003 2004 2005 January 4,8,9,11,22,24 11-13, 30-31 - 8 - February 23,24 2-3, 11-13 24-26 8-9;20-21 8 March 6,7,8,16 12-13, 21-23 12-15, 18-19
22-27 6, 9-10, 16-20, 28-29
13-25
April 7,20,22 7-9 7-9, 14-19 15, 29 8, 28-30 May 7,9,10,20,21 15-17, 29-31 3-10, 30-31 3-4, 11-12,
20-24 1-5, 21, 30-31
June 24-26 1-4, 15-27 1-2, 7-18, 26-26
7-13, 27-28 1-6, 12, 26-28
July 21-25, 29-31 7-8, 19-23, 27-29
7-15, 17-24, 30-31
6-7,17-19, 21-25, 28-29
17-18, 27-28
August 1,2,11-14,26 4-5, 14-15, 19-20
2-3, 13, 16-17, 21-24
2-3, 7-9, 22-28
9-10, 17-18
September - 2-4 3-5 1-14 4-5 October 5,12 7-8, 20-21 - 4-9, 23-25 16, 29-31 November - - 9, 17-23 30 3-4, 8 December - - 6-7 4, 5 - Source: Generalitat Valenciana www.gva.es

Table 4 Daily Quality Index Criterion for PM10 PM10 Range µg/m3
Quality Pollution Colour
0-25 Excellent Low
25-50 Good Normal
50-75 Poor High
>75 Bad Very high

Table 5 Comparison of air quality as As, Cd, Ni and Pb in PM10 during the study. Pollutant Target value (1)
(ng/m3) 2001 2002 2003 2004 2005 Lead 500 300 300 200 100 100
Arsenic 6,0 16,0 15,0 9,8 4,0 2,5
Cadmium 5,0 1,8 2,4 2,2 2,0 0,4
Nickel 20,0 6,1 5,6 3,9 4,9 5,3 (1) For the total content in the PM10 fraction averaged over a calendar year

Tabla 6 Quality Index Criterion for As, Cd, Ni y Pb in PM10 As
ng/m3 Cd
ng/m3 Ni
ng/m3 Pb
µg/m3 Quality Pollution Colour
0-2 0-1 0-5 0,0-0,1 Excelente Muy Baja 2-6 1-5 5-20 0,1-0,5 Buena Baja
6-10 5-10 20-35 0,5-0,9 Mejorable Elevada >10 >10 >35 >0,9 Deficiente Muy elevada