Aspects of the Biology of climbers in Southern Africa · Master of Science in Botany Botany...
101
ASPECTS OF THE BIOLOGY OF CLIMBERS IN SOUTHERN AFRICA by DAVID ANDREW BALFOUR
-
Upload
nguyendien -
Category
Documents
-
view
213 -
download
0
Transcript of Aspects of the Biology of climbers in Southern Africa · Master of Science in Botany Botany...

ASPECTS OF THE BIOLOGY OF CLIMBERS
IN SOUTHERN AFRICA
by
DAVID ANDREW BALFOUR
The copyright of this thesis vests in the author. No quotation from it or information derived from it is to be published without full acknowledgement of the source. The thesis is to be used for private study or non-commercial research purposes only.
Published by the University of Cape Town (UCT) in terms of the non-exclusive license granted to UCT by the author.

ASPECTS OF THE BIOLOGY OF CLIMBERS
IN SOUTHERN AFRICA
by
DAVID ANDREW BALFOUR
A Thesis Submitted in Partial Fulfilment of the Degree
Master of Science in Botany
Botany Department
University of Cape Town
April 1991
!------•-•·•~ '-" ~- ''·''•'""'"L=-'.;:.'"r;-'.•;::;:;,=:;;:=m::>'.:,~~·n
) 1he University of C'.lf.':? T?w:i :-~s_be_en given \' i the ri~;ht to r:::;x::_u':"''1_ ''.";. ·:·':'"'·; :~ ':-v;)oie tj
rl Or in p;;;r1. C.,'r"','li'. :o ,. ''' '' ;!·· .. P.•,,hor. 11 ~~:'::!.:"":~(:-"ti"'"'~,·~~'·,•.~ ·: .. ~ . ,, . ; .......... .:,,t1''"!.J1
j
Table of Contents
Abstract . . . . . . . . . . . . . , . . . . . . . . . . . . . . . . . . . . . . . . . . . . . . . . . . . . . . . . . . . . . . . . . ii
Chapter One : ................................................. , . . . . . . . . . . 1
Chapter 1'wo : . . . . . . . . . . . . . . . . . . . . . . . . . . . . . . . . . . . . . . . . . . . . . . . . . . . . . . . . . . . 6
Introduction . . . . . . . . . . . . . . . . . . . . . . . . . . . . . . . . . . . . . . . . . . . . . . . . . . . . . . . . 6 Methods .......................................................... 11 Results ......................................................... -. . 13 ·Discussion . . . . . . . . . . . . . . . . . . . . . . . . . . . . . . . . . . . . . . . . . . . . . . . . . . . . . . . . 27 Conclusion . . . . . . . . . . . . . . . . . . . . . . . . . . . . . . . . . . . . . . . . . . . . . . . . . . . . . . . . 30 References . . . . . . . . . . . . . . . . . . . . . . . . . . . . . . . . . . . . . . . . . . . . . . . . . . . . . . . . 31
Chapter Three : ...................................... t . . . . . . . . . . . . . . . . . . 33
Introduction . . . . . . . . . . . . . . . . . . . . . . . . . . . . . . . . . . . . . . . . . . . . . . . . . . . . . . . 33 Methods . . . . . . . . . . . . . . . . . . . . . . . . . . . . . . . . . . . . . . . . . . . . . . . . . . . . . . . . . .. 35, Results . . . . . . . . . . . . . . . . . . . . . . . . . . . . . . . . . . . . . . . . . . . . . . . . . . . . . . . . . . . 39 Discussion . . . . . . . . . . . . . . . . . . . . . . . . . . . . . . . . . . . . . . . . . . . . . . . . . . . . . . . . 45
Conclusion . . . . . . . . . . . . . . . . . . . . . . . . . . . . . . . . . .. . . . . . . . . . . . . . . . . . . . . . . 47 References . . . . . . . . . . . . . . . . . . . . . . . . . . . . . . . . . . . . . . . . . . . . . . . . . . . . . . . . 48
Chapter Four : . . . . . . . . . . . . . . . . . . . . . . . . . . . . . . . . . . . . . . . . . . . • . . . . . . . . . . . . . 51
Introduction . . . . . . . . . . . . . . . . . . . . . . . . . . . . . . . . . . . . . . . . . . . . . . . . . . . . . . . 51 Methods .......................................................... 52 Results . . . . . . . . . . . . . . . . . . . . . . . . . . . . . . . . . . . . . . . . . . . . . . . . . . . . . . . . . . . 55 Discussion . . . . . . . . . . . . . . . . . . . . . . . . . . . . . . . . . . . . . . . . . . . . . . . . . . . . . . . . 61 Conclusion . . . . .. . . . . . . . . . . . . . . . . . . . . . . . . . . . . . . . . . . . . . . . . . . . . . . . . . . . 63 References . . . . . . . . . . . . . . . . . . . . . . . . . . . . . . . . . . . . . . . . . . . . . . . . . . . . . . . . 64
Chapter Five : . . . . . . . . . . . . . . . . . . . . . . . . . . . . . . . . . . . . . . . . . . . . . . . . . . . . . . . . . 67
Introduction . . . . . . . . . . . . . . . . . . . . . . . . . . . . . . . . . . . . . . . . . . . . . . . . . . . . . . . 61 Methods ..... : .................................................... 71 Results . . . . . . . . . . . . . . . . . . . . . . . . . . . . . . . . . . . . . . . . . . . . . . . . . . . . . . . . . . . 74 Discussion . . . . . . . . . . . . . . . . . . . . . . . . . . . . . . . . . . . . . . . . . . . . . . . . . . . . . . . . 83 Conclusion . . . . . . . . . . . . . . . . . . . . . . . . . . . . . . . . . . . . . . . . . . . . . . . . . . . . . . . . 87 References . . . . . . . . . . . . . . . . . . . . . . . . . . . . . . . . . . . . . . . . . . . . . . . . . . . . . . . . 88
Chapter Six : . . . . . . . . . . . . . . . . . . . . . . . . . . . . . . . . . . . . . . . . . . . . . . . . . . . . . . . . . . 92
ii
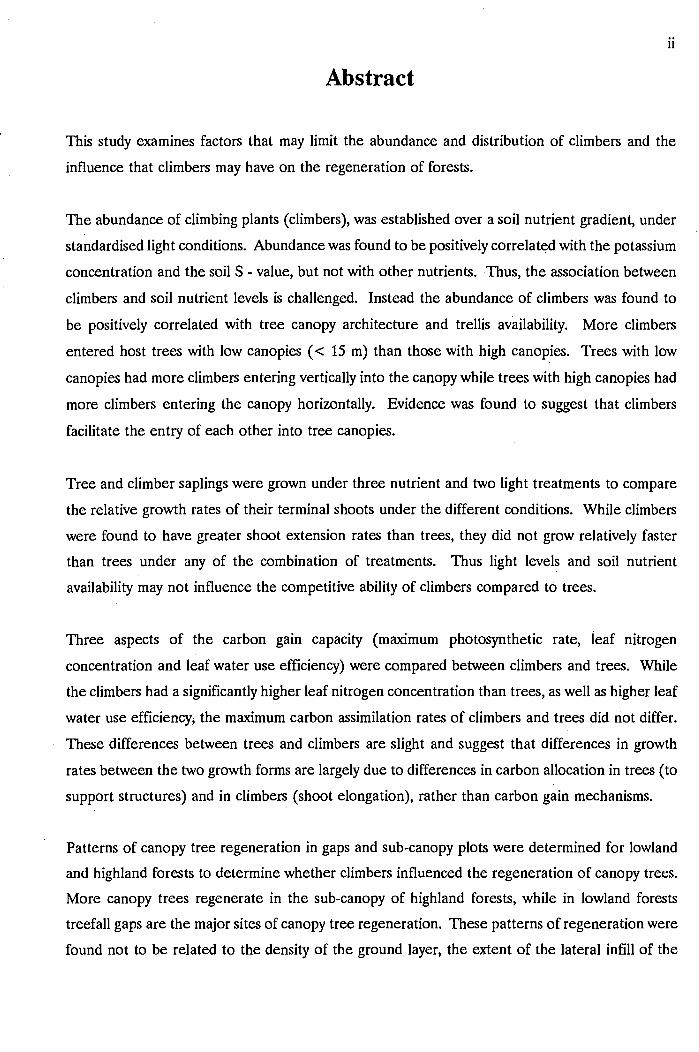
Abstract
This study examines factors that may limit the abundance and distribution of climbers and the
influence that climbers may have on the regeneration of forests.
The abundance of climbing plants (climbers), was established over a soil nutrient gradient, under
standardised light conditions. Abundance was found to be positively correlated with the potassium
concentration and the soil S - value, but not with other nutrients. Thus, the association between
climbers and soil nutrient levels is challenged. Instead the abundance of climbers was found to
be positively correlated with tree canopy architecture and trellis availability. More climbers
entered host trees with low canopies ( < 15 m) than those with high canopies. Trees with low
canopies had more climbers entering vertically into the canopy while trees with high canopies had
more climbers entering the canopy horizontally. Evidence was found to suggest that climbers
facilitate the entry of each other into tree canopies.
Tree and climber saplings were grown under three nutrient and two light treatments to compare
the relative growth rates of their terminal shoots under the different conditions. While climbers
were found to have greater shoot extension rates than trees, they did not grow relatively faster
than trees under any of the combination of treatments. Thus light levels and soil nutrient
availability may not influence the competitive ability of climbers compared t6 trees.
Three aspects of the carbon gain capacity (maximum photosynthetic rate, leaf nitrogen
concentration and leaf water use efficiency) were compared between climbers and trees. While
the climbers had a significantly higher leaf nitrogen concentration than trees, as well as higher leaf
water use efficiency; the maximum carbon assimilation rates of climbers and trees did not differ.
These differences between trees and climbers are slight and suggest that differences in growth
rates between the two growth forms are largely due to differences in carbon allocation in trees (to
support structures) and in climbers (shoot elongation), rather than carbon gain mechanisms.
Patterns of canopy tree regeneration in gaps and sub-canopy plots were determined for lowland
and highland forests to determine whether climbers influenced the regeneration of canopy trees.
More canopy trees regenerate in the sub-canopy of highland forests, while in lowland forests
treefall gaps are the major sites of canopy tree regeneration. These patterns of regeneration were
found not to be related to the density of the ground layer, the extent of the lateral infill of the

lll
gap-forming trees or the abundance of woody climbers .. Instead, a negative correlation was found
between the percentage of regenerating canopy s.pecies and the density of the herbaceous and
shrubby understory layer in both lowland and highland forests. Thus in both forests the understory
layer has an important influence on the regeneration of canopy trees. The role of vertebrate
herbivores may be important in providing the necessary release from suppressive effect of the
dense understory layer and to enable the regeneration of canopy' tree species in the lowland
forests.

iv
Acknowledgements
I thank William Bond, my supervisor, for unfailing encouragement, useful suggestions, discussions
and criticism during the project and for reading and commenting on earlier manuscripts of this
thesis. Mostly I thank him for a new way of looking at biology.
I am grateful to Ruth Beukman, Maanda Ligavha and William Bond for assistance in the field,
Mike Cramer for help with the IRGA equipment, Desmond Barnes for making up nutrient
solutions as well as Craig Hilton-Taylor for help on the computer and John Lanham for help with
the carbon isotope work. Rosena de Villiers of Forestek is thanked for help with nutrient
analyses.
I thank Rod Saunders of the nursery at Kirstenbosch Botanical Gardens and the City Council staff
at Orange K.loof for providing me with plants. I am grateful to the Cape Town City Council for
allowing me to work in Orange K.loof, and the Natal Parks Board and Kwa Zulu Bureau of
Natural Resources for giving me access to various forests in Natal.
I appreciate the efforts of Guy Midgely, Willy Stock, Eugene Moll and particularly Jean Harris
who read and commented on portions of the earlier manuscript.
This work was funded by a grant from the Department of Environmental Affairs (Forestry) as well
as a CSIR (FRD) MSc. Bursary.
Finally I thank my parents for their support when I made the change to biology from engineering,
and Jean for all her support and encouragement in writing this thesis.
1
Chapter One
Introduction
Context of the study
The abundance and diversity of climbing plants varies greatly in different forests (Grubb 1987).
Although climbers are generally associated with tropical fore8ts (Richards 1952; Givnish and
Vermeij 1976) they are often common in temperate forests (Siccama et al ~916). Despite the fact
that climbers are common growth forms in many forests, the study of their ecology has been much
neglected (Putz 1984).
Climbers differ from trees in their absence of a rigid woody support (Darwin 1867). They are thus
dependent on free-standing trees for vertical support, and have variously been termed structural
dependents (Richards 1952) or structural parasites (Stevens 1987). The dependence of climbers
on trees for support suggests that their ecology is closely linked to trees, and the role of climbers
in forest ecology and the interrelations between trees and climbers has recently become the focus
of a number of studies (Putz 1984; Putz and Chai 1987; Clark and Clark 1990).
Climbers are documented as causing damage to tree sapling growth (Fox 1968) and as impeding
tree regeneration after logging in tropical forests (Kochummen 1966) and temperate forests
(Phillips 1931). Climbers may arrest the growth of individuals in treefall gaps (Putz 1984;
Whitmore 1989) as well as forming impenetrable mats in the forest margins (Huntley 1965). The
impact of climbers on mature trees ranges from negative effects such as a reduction in the
fecundity of the host tree (Stevens 1987), reduction in tree growth (Wigham 1984) and eventual
death of the tree (Putz et al. 1987) to positive effects such as mutual support of trees by a cross
linking of climbers in their canopies (Richards 1952; Smith 1973).
The abundance and distribution of climbers has been linked to a number of abiotic factors.
Climbers have been associated with high levels of light intensity (Putz 1984), with dry soil types
(Phillips 1931) and low rainfall (Longino 1986). Climbers have been repeatedly associated with
nutrient rich soils (Richards 1952; Proctor et al. 1983; Putz 1985; Putz and Chai 1987; Grubb
1987). However this relationship remains to be substantiated and its causes are not well
understood.

2
Climber presence has further been associated with biotic factors such as disturbed forest canopies
(Lowe and Walker 1977; Putz 1985) and forest margins (Williams-Linera 1990). Other factors
such as the availability of adequate trellises for climbers to attach the~selves, in order to climb
to the canopy of a forest, have been suggested as influencing the distribution of climbers within
, a forest (Putz 1984).
Some ecopyhsiological aspects of the carbon gain mechanisms of climbers have recently been
investigated. In an attempt to explain the success of exotic climbers in northern America the
photosynthesis of two exotic invasive weedy climbers was compared with that of indigenous
climbers by Carter et al. (1989) but they found no differences. Carter and Teramura (1988a)
found that differences in non-summer stomata} conductance between two exotic climbers might
contribute to different invasive abilities while the climbing mechanics of climbers has been related
to their photosynthetic rates (Carter and Teramura 1988b ).
Little is known of the abundance and distribution of climbers in southern Africa and the factors
influencing their distribution patterns. Climbers are generally more abundant in Guineo-Congolian
forest (White 1978) than in Afromontane forest (White and Moll 1978). The ecology of climbers
in southern Africa is poorly studied. Most ecological studies are restricted to comment on the
presence or absence of climbers or their role in preventing tree regeneration (Laughton 1938),
or on the damaging effects of climbers on mature trees (Phillips 1931; V~nter 1976).
Key questions:
1. What limits the abundance of climbers and why?
I initially approached this question by testing two hypotheses 1. That climber abundance is
determined by soil nutrient levels, and 2. That trellis availability and host tree architecture
determine climber abundance. This work was done by considering the abundance of climbers over
a naturally occurring soil nutrient gradient. I followed this up by experimentally growing trees and
climbers under different nutrient and light conditions to determine the relative influence, if any,
of soil nutrients on climbers compared with trees. I further investigated whether aspects of the
carbon gain physiology of trees and climbers differ and if this can explain the competitive abilities
of climbers and their distribution patterns, associated with nutrient rich soils.

3
2. Do climbers influence the regeneration of forest trees?
I considered the dynamic effects of climbers in forests by comparing the interactions between
climbers (and other growth forms), and canopy tree regeneration. I tested the hypothesis that the
regeneration dynamics differ between lowland and highland forests in southern Africa, and that
these differences can be explained by interactions between different growth forms.
Structure of the thesis
In Chapter Two I investigate the abundance of climbers in the Knysna forest over a soil nutrient
gradient to test the idea that their abundance is correlated with soil nutrient levels. I also test an
alternative hypothesis that tree canopy architecture and the availability of trellises influence the
distribution and abundance of climbers.
In Chapter Three I address the hypothesis. that climbers are dependent on high nutrient
availability to sustain higher growth rates than trees. I describe an experiment in which the growth
of trees and climbers was compared under different nutrient and light treatments. One aim was
to determine under which conditions, if any, the climbers grew faster, and were thus more
competitive, than the trees.
Aspects of the ecological physiology of climbers are considered in Chapter Four. I ask whether
differences in growth rates between trees and climbers are due only to differences in carbon
allocation to leaves and wood or whether they also differ in carbon uptake capacity.
Photosynthetic rates as well as leaf nitrogen levels and the water use efficiency of the leaves
(determined using carbon isotope ratios) are compared between trees and climbers.
In Chapter Five the role of climbers in forest dynamics is investigated. The influence and
importance of climbers, as well as different vegetation layers, on forest regeneration, is examined
in treefall gaps and below intact forest canopy. I consider the hypothesis that interactions between
different growth forms influence the dynamics of highland and lowland forests differently and may
influence the composition of the forests.
The final chapter, Chapter Six, draws together the conclusions of the thesis and suggests directions
for further research.

•j
4
References
Carter GA and Teramura AH. 1988a. Non-summer stomatal conductance for the invasive vines kudzu and Japanese honeysuckle. Can. J. Bot. 66:2392-2395. ,
Carter GA and Teramura AH. 1988b. Vine photosynthesis and relationships to climbing mechanics in a forest understory. Amer. J. Bot. 75(7):1011-1018.
Carter GA, Teramura AH and ForsetliIN. 1989. Photosynthesis in an open field for exotic versus native vines of the southeastern United States. Can. J. Bot. 67:443-446.
Clark DB and Clark DA 1990. Distribution and effects on tree growth of lianas and woody hemiepiphytes in a Costa Rican tropical wet forest. J. Trop. Ecol. 6:321-331.
Darwin C. 1867. On the movements and habits of climbing plants. J. Lin. Soc.(Bot.) 9:1-118.
Fox JED. 1968. Logging damage and the influence of climber cutting prior to logging in the lowland dipterocarp forest of Sabah. The Malayan Forester 31(4):326-347.
Givnish TJ and Vermeij GJ. 1976. Sizes and shapes of liana leaves. Am. Nat. 110:743-778.
Grubb PJ. 1987. Global trends in species-richness in terrestrial vegetation: a view from the northern hemisphere. In: Gee JHR and Giller PS (Eds.) Organization of communities - past and present. Blackwell Scientific Publications. Oxford.
Huntley BJ. 1965. A preliminary account of the Ngoye Forest Reserve, Zululand. J. S. Afr. Bot. 31:177-205.
Kochummen KM. 1966. Natural plant succession after farming in Sg~ Krog. The Malayan Forester 29:170- 181.
Laughton FS. 1938. The 'silviculture of the indigenous forests of the Union of South Africa with special reference to the forests of the Knysna region. Science Bulletin 157, Forestry series 7, Government Printer, Pretoria. 168 pp.
Longino JT. 1986. A negative correlation between growth and rainfall in a tropical liana. Biotropica 18(3):195-200. ·
Lowe RG and Walker P. 1977. Classification of canopy, stem, crown status and climber infestation in natural tropical forest in Nigeria. J. Appl. Ecol. 14:897-903.
Phillips IF. 1931. Forest succession and ecology in the Knysna region. Memoirs of the botanical survey of South Africa No.14.
Proctor J, Anderson JM, Chai P and Vallack HW. 1983. Ecological studies in four contrasting lowland rainforests in Gunung Mulu National Park, Sarawak. J. Ecol. 71:237-260.
Putz FE. 1984. The natural history of lianas on Barro Colorado Island, Panama. Ecology 65(6):1713-1724.
5
Putz FE. 1985. Woody vines and forest management in Malaysia. Commonw. For. Rev. 64( 4):359-365.
Putz FE and Chai P. 1987. Ecological studies of lianas· in Lambir National Park, Sarawak, Malaysia. J. Ecol. 75:523-531.
Putz FE, Lee HS and Goh R. 1987. Effects of post-felling silvicultural treatments on woody lianas in Sarawak. Malaysian Forester 47:
Siccama TG, Weir G and Wallace K. 1976. Ice damage in a mixed hardwood forest in connecticut in relation to Vitis infestation. Bull. Torr. Bot. Club. 103:180-183.
Smith AP. 1973. Stratification of temperate and tropical forests. Am. Nat. 107:67f-683.
Stevens GC. 1987. Lianas as structural parasites: the Bursera simaruba example. Ecol. 68(1 ):77-81.
Venter HJT. 1976. An ecological study of the dune forest at Mapelana, Cape St. Lucia, Zululand. J. S. Afr. Bot. 42:211-230.
Whigham D. 1984. The influence of vines on the growth of Liquidambar styraciflua L. (sweetgum). Can. J. For. Res. 14:37-39.
White F. 1978. The afromontane region. In: Wergner M.J.A (Ed.), Biogeography and ecology of southern Africa. W.Junk, The Hague, pp 436 - 513.
White F and Moll EJ. 1978. The Indian ocean coastal belt. In: Wergner M.J.A (Ed.), Biogeography and ecology of southern Africa. W.Junk, The Hague, pp 563 - 598.
Whitmore TC. 1989. Canopy gaps and two major groups of forest trees.· Ecol. 70:536-538.
Williams-Linera G. 1990. Vegetation structure and environmental conditions of forest edges in Panama. J. Ecol. 78:356-373.

Chapter Two,
What Determines Climber Distribution and Abundance?
A Gradient Study in the Knysna Forest; Southern Cape.
Introduction
6
Climber distribution and abundance varies greatly with the geographic locality of forests. Woody
climbers are commonly associated with tropical forests where they are present in high diversity
(Richards 1952), and are found in greater abundance than in temperate forests· (Givinish and
Vermeij 1976; Putz 1984a, Grubb 19B7). The question of what limits the abundance· and
distribution of climbers has not been answered. A number of studies provide descriptive (Phillips
1931; Richards 1952) and quantitative data (Proctor et al. 1983; Putz 1984a; Putz and Chai 1987)
on climber abundance but little work has been done to establish the factors controlling the
observed patterns of abundance and distribution.
Forest locality and type appear to influence the occupancy of forests by climbers (Grubb 1987).
Davis and Richards (1934) and Putz (1983) suggest that tropical heath forests may have fewer
lianas (woody climbers) than lowland rainforests, while White (1978) suggests that in Africa lianas
are less common in the Afromontane forests than in the lowland Guineo-Congolian forests. In
addition different topographical regions of forests have been noted as having varying abundances
of lianas e.g. the valleys of the Lambir National Park, Malaysia have twice the abundance of lianas
compared to the hilltops (Putz and Chai 1987).
Climbers are commonly thought to be associated with more fertile soils (Richards 1952; Putz 1985;
Putz and Chai 1987) suggesting that nutrient availability may be an important limiting factor. A
relationship between climber abundance and rainfall or soil nutrients has been suggested by a
number of workers, but a clear pattern has not emerged. Phillips (1928) lists climbers as indicators
of dry soils and Longino (1986) provides evidence that the growth of a tropical climber species
is negatively correlated with rainfall. In contrast Proctor et al. (1983) show climber abundance in
the Gunung National Park (Sarawak) to be higher in the frequently inundated alluvial forests
where the soils have a high base saturation. Gentry (1982), however, found no significant
correlation between the abundance of climbers and the annual rainfall of an area, and Fernandez
(1987) suggests that water is less important in affecting climber distribution than is the longer
growth period of climbers compared with their host trees.

7
Disturbance of the forest canopy often leads to an increase in the density of lianas (Richards 1952;
Fox 1968; Lowe and Walker 1977; Putz, Lee and Goh 1987), as do natural tree fall gaps (Phillips
1931; Putz 1984a), and forest margins are frequently lined with dense tangles of lianas (Williams
Linera 1990). The close association between climbers and disturbed forest, treefall gaps and
forest margins has lead to the suggestion that they are a light demanding growth form ( eg. Phillips
1931; Putz 1984a).
There is evidence that forest architecture is important in determining climber distribution.
Climbers behave as structural parasites (Stevens 1987) relying on other plants for support. To be
successful a young climber needs to be able to reach the forest canopy and a support structure is
necessary. Putz (1984a) found the presence of trellises (young plants and small diameter
branches) to be an important factor limiting Hana access to the canopy on Barro Colorado Island,
and suggests that trellis availability influences the distribution of lianas within the forest. Trellises
are most commonly found where there has been a disturbance to the forest and there is
regeneration of young vegetation. These areas are often also sites of high light intensity, and high
nutrient l<?vels and are ideal for liana growth (Whigham 1984).
There is little literature on the distribution, abundance or the ecology of climbers in southern
Africa. Most reports are restricted to mention of the presence or absence of climbers with
occasional subjective quantification of climber abundance (Phillips 1931; Huntley 1965; White and
Moll 1978; White 1978). Ecological commentary is limited to a mention of the role of Iianas in
the prevention of regeneration of trees (Laughton 1938), as agents of damage to mature trees
(Phillips 1931; Venter 1976) and as alien invaders in Natal woodlands (Gordon and Bartholomew
1989). Geldenhuys (1989a) is the only local study to consider the distributio~ and abundance of
different growth forms in southern African forests, but it is a floristic study and little insight is
gained about the ecological importance of the climbers.
In this study I test, firstly, the suggestion that soil nutrients are an important determinant of
climber distribution. I quantify the abundance of climbers over a soil nutrient gradient and relate
differences in abundance to changes in the soil nutrient environment. I include different
topographical aspects in the gradient to test for their influence on climber abundance.
Secondly I test the hypothesis that community constraints, (eg. host tree crown characteristics)
rather than abiotic factors such as light and soil nutrients, play an important role in determining
the distribution and abundance of climbers. I suggest that the association between climber
abundance and light or soil nutrients may not be directly causative and that trellis availability may
be more directly correlated with climber distribution.

8
To test this idea I predicted firstly that in forest where the canopy· is low, and by implication
trellises more accessible, more climbers would enter the canopy of their host trees vertically while
in forest where the canopy is high and access is limited, more climbers would enter the canopy of
their host trees horizontally from a neighbouring canopy. Secondly that trees with lower canopy
would be more prone to climber occupation than trees with higher canopies. Thirdly I consider
whether the· presence of one climber species in a tree facilitates the entry of other species by
acting as a trellis.
Study Area
The study was conducted over a soil nutrient gradient in the Knysna forest (33°30'S; 22°40'E) in
the southern Cape, South Africa (Fig. 1 ). I used a second study site, the Alexandria forest
(33°15'S; 26°30'E) as an independent test of the results gained from the Knysna forest gradient.
The Alexandria forest was chosen because of its geographical proximity yet ecological
independence of the Knysna forest.
The Knysna forest is situated on the coastal scarp of the Outeniqua range of the Cape Folded
Mountains. The mountains rise to 1600 m above mean sea level and are restricted to a narrow
coastal strip less than 40 km wide. The topography of the area consists of high mountain slopes
above and separate from a plateau which can be divided into a higher plateau and a lower plateau,
which then falls away rapidly to a coastal plain (see Table 1). The lower plateau and portions of
the higher plateau are fissured by river valleys running south into the Indian Ocean.
Table 1. The number of plots in each gradient group (n), the mean altitude of each group (mean ± SE), the slope of each group (mean ± SE), the mean width of the plots at each group (the figure in parenthesis shows the number of plots greater than 50 m wide, these have not been included in the average) the canopy height, and the mean number of trees per plot in each group ( ± SE). MT = mountain site, HP = high plateau, LP = low plateau, VS valley slope, VF = valley floor, CP = coastal plain and AX = Alexandria forest.
Group n Altitude Slope Plot Width (#) (m) (0) (m)
MT 4 635 ± 64 28 ± 12 11.5 (0)
HP 4 365 ± 41 10 ± 7 8.7 (0)
LP 4 230 ± 53 4±4 12.8 (0)
vs 6 182 ± 43 26 ± 6 8.5 (0)
VF 4 235 ± 111 17 ± 7 9.0 (0)
CP 6 40 ± 21 20 ± 12 7.5 (2)
AX 4 220 ± 16 9±3 7.3 (1)

9
The parent rock of the Outeniqua mountain range is quartzitic sandstone of the Cape Super
Group (Truswell 1977) and is found on the upper slopes of the plateau and in the river valleys.
The coastal belt has a more varied substrate comprising broken areas of old leached dune sands,
granite, shales and schists (1 : 250 000 Geological Survey map of the Oudtshoom area 1979). The
soils of the mountain areas are generally podsolised, acid sands, low in nutrients while the soils
of the coastal regions tend to be richer in nutrients (Personal Communication G. Shafer, Saasveld
Forestry Research Station).
25
Figure 1. Map of the study area showing the position of the Knysna ·forest (KY) and the Alexandria forest (AX).

10
The region has a mild climate and receives an all year rainfall, with a summer peak, ranging from
600 mm in the coastal region to 1200 mm in the high mountains (Fig. 2). The mean daily
maximum and minimum temperatures range respectively from 23.8°C & 19.7°C (February) to
18.2°C & 8.9°C (August). Frosts rarely occur (Geldenhuys 1989b).
The K.nysna forest, which represents veld type 4 of Acocks (1953), is described by Phillips (1931)
and Von Breitenbach (1974). The wetter mountain patches carry high forest(± 25 m) while the
forest of the lower plateau is moist to dry ( ± 15 m) and that of the coastal belt is generally dry
forest ( ± 10 m). The forests have not experienced large scale disturbances (Geldenhuys and
Maliepaard 1983), and the major disturbance regime is the gaps formed by the uprooting or
snapping of individual or a few trees.
oc mm x Ky 140
120
100
80
30 60
20 .,,.- ..... -- ..... 40 ;" '-.. _,. .... , _____ , ___ ..... , ---- ' ... _.. ...
10 ----~ - 20
() J m m J s n m m s n 0
Figure 2. Climate diagrams for the Alexandria forest (Langebos forest station) and the mountain site of the Knysna forest. Ax = Alexandria, Ky = Knysna. (Adapted from Marker and Russell 1984). The horizontal axis show months beginning with January. Solid line is rainfall, dotted line shows temperature.
The Alexandria forest (Fig. 1 ), has been described by Marker and Russell (1984) and
phytogeographically placed by Phillipson and Russell (1988). Although there are floristic links
between the Alexandria forest and the Knysna forests (White 1978), they are phytogeographically
distinct. The soils of the area are deep well drained dune sand over lying a limestone base
(Marker and Russell 1984). The altitude of the forest ranges from 100 m to 350 m. The area gets
an all year rainfall that ranges from 700 - 900 mm for the forest (Rainfall isohyet map 1979). The
mean monthly temperature seldom rises above 22 °C and seldom drops below 11 °C (Fig. 2). The
11
area is topographically diverse with forest height ranging from 15 m in the wetter valley floors to
5 m on the drier hill tops and toward the coast.
Methods
I chose six sites along the gradient to cover a range of soil nutrients and to include two
topographical aspects of the forest. The sites were a mountain site (MT), a high plateau site
(HP), a low plateau site (LP), a valley slope site (VS), a valley floor site (VF), and a coastal plain
site (CP). The valley slope and the valley floor sites provided a topographical comparison of
plants on the forest's gradient. A seventh independent site in the Alexandria forest was chosen
as a control against which the results gained from the gradient sites in the Knysna forest could be
compared.
Within each site I randomly located four to six plots by marking a point on a road on a 1:50 000
topographical map falling within a site. To standardise light conditions as well as sample area of
the plots over the gradient I defined a plot as being a 50 m stretch of road frontage. This
"standardized gap" represents a gap in the forest canopy (the road cutting) that is standardized in
respect of lighting conditions (i.e. it is cleared to ground level with no advanced regeneration in
the "gap") and gap size, for all plots. Only trees having canopies abutting directly on the road
margins were recorded in the survey.
At each plot I recorded the gap orientation, gap width, slope of the ground, orientation of the
slope, and plot altitude. A soil sample was collected from each site from scrapings of the side of
a pit dug 15 cm deep, and sited 10 m into the forest on the upslope side of the forest to avoid any
influence of road construction materials. The soil was analyzed for total N, total P and total K •
as well as the S - value (sum of exchangeable Ca, Mg, Na and K, expressed as g/lOOg soil), the pH,
organic matter content and percentage of clay in the soil. Although the total concentration of N
and P are not the same as the plant available concentrations, plant available N and P are difficult
to estimate and the total concentrations are used as approximations in this study.
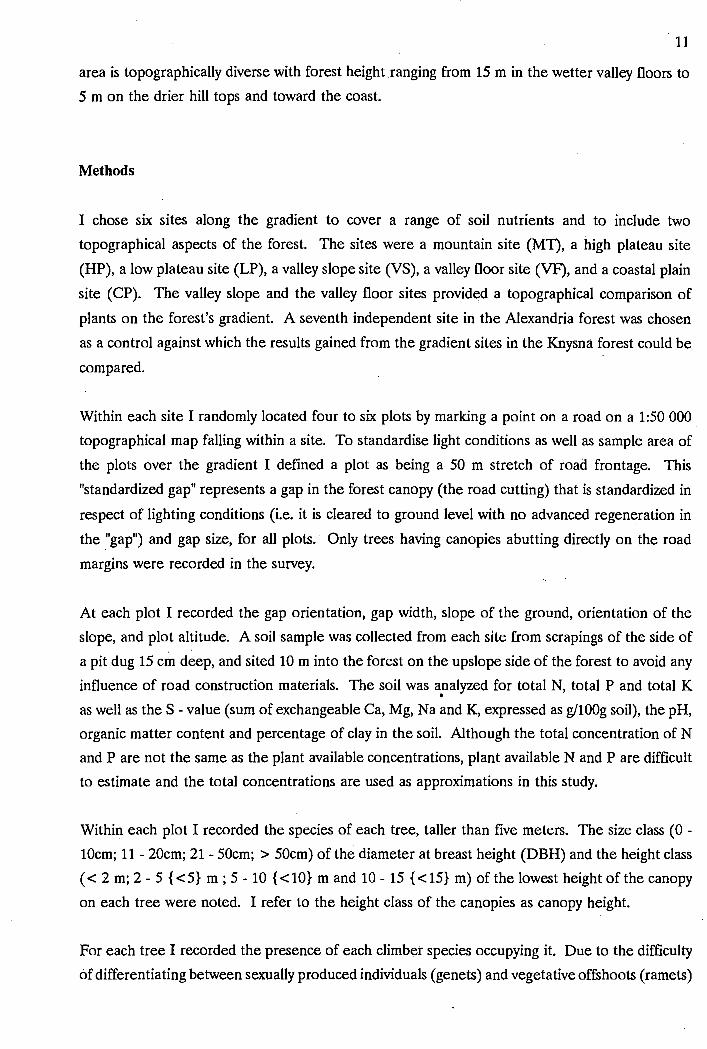
Within each plot I recorded the species of each tree, taller than five meters. The size class (0 -
lOcm; 11 - 20cm; 21 - 50cm; > 50cm) of the diameter at breast height (DBH) and the height class
( < 2 m; 2 - 5 { <5} m ; 5 - 10 { < 10} m and 10 - 15 { < 15} m) of the lowest height of the canopy
on each tree were noted. I refer to the height class of the canopies as canopy height.
For each tree I recorded the presence of each climber species occupying it. Due to the difficulty
of differentiating between sexually produced individuals (genets) and vegetative offshoots (ramets)

12
I considered all climbing stems that were apparent between the heights of two and three meters
to be separate individuals. To over come the problems involved in counting every climber
individually, estimates of abundance were made by grouping species into abundance classes of 0 -
10; 11 - 20; 21 - 50 and > 50. As even climbers of small sizes can support a large leaf area in
the forest canopy (Putz 1983), the abundance of three size classes of climber ( < 1 cm; 1 - 2 cm;
> 2 cm) was recorded for each species. Climber diameter was measured at a height of between
two and three meters above the ground.
To determine how climbers enter the canopy of their host trees, I recorded the direction of entry
into the canopy i.e. vertically into the canopy or horizontally from a neighbouring tree. In addition
the height of entry was recorded and I noted whether climbers entered the canopy via the main
stem or directly into the canopy branches.
The nature of the data recorded for the abundance of climbers i.e. the number of times a climber
species was present in each of the abundance and size classes, made it not possible to deal with
absolute numbers of climbers in the results. Instead I discuss the data in three forms: 1) as the
abundance of climbers - the average number of tim~ that a different size and abundance class of
climber occurs per 50 m plot) the weighted abundance of climbers 2) - the abundance of climbers
in each size class multiplied by a weighting factor. The weighting factor used is the median of the
abundance class. i.e. weightings of 5, 15 , 35 are respectively used for the abundance classes 0 -
10, 11 - 20, and 21 - 50) the number of climbers and 3) - the weighted abundance of climbers but
with all the size classes grouped.
I performed ax?- analysis to determine if the frequency of climbers entering the canopy vertically
and horizontally conformed with a theoretical expected frequency. The expected frequency was
generated by taking the occurrence of the vertical and the horizontal entries of the weighted
abundances for all the gradient groups and Alexandria combined.
X2 analysis was performed to determine if the frequency of climber species occupying a tree
conformed to a Poisson distribution. Departure from poisson might indicate competition or
facilitation between climber species. Facilitation of one species entry into a tree by another would
result in more trees having a higher number of climber species than expected while competition
would be indicated by the reverse trend. I generated the expected frequency using the weighted
abundance of climber species, ignoring size classes, for all the sites in the study.
I used standard correlative statistical techniques to relate climber abundance to soil nutrient data
and standard one way ANOV A to determine statistical differences between groups. To gain some
understanding of the relationship between the individual species of trees and climbers with the

13
average site altitude and edaphic conditions I used canonical correspondence analysis (Terbraak
1987). This is a multivariate direct gradient analysis technique which has been developed to relate
community composition to known variation in the environment (Terbraak 1987), it is an extension
of the reciprocal averaging technique. The output is a biplot diagram with species and sites being
represented by plotted points and the environmental variables being represented by arrows. From
this one can read the approximate distribution of a species along the environmental gradients that
best explain community composition (Terbraak 1987). This method as opposed to other
correspondence analyses techniques was used as it incorporates the environmental variables into
the ordination analysis and does not attempt to superimpose them at a later stage using the help
of previous knowledge.
Results
Nutrients
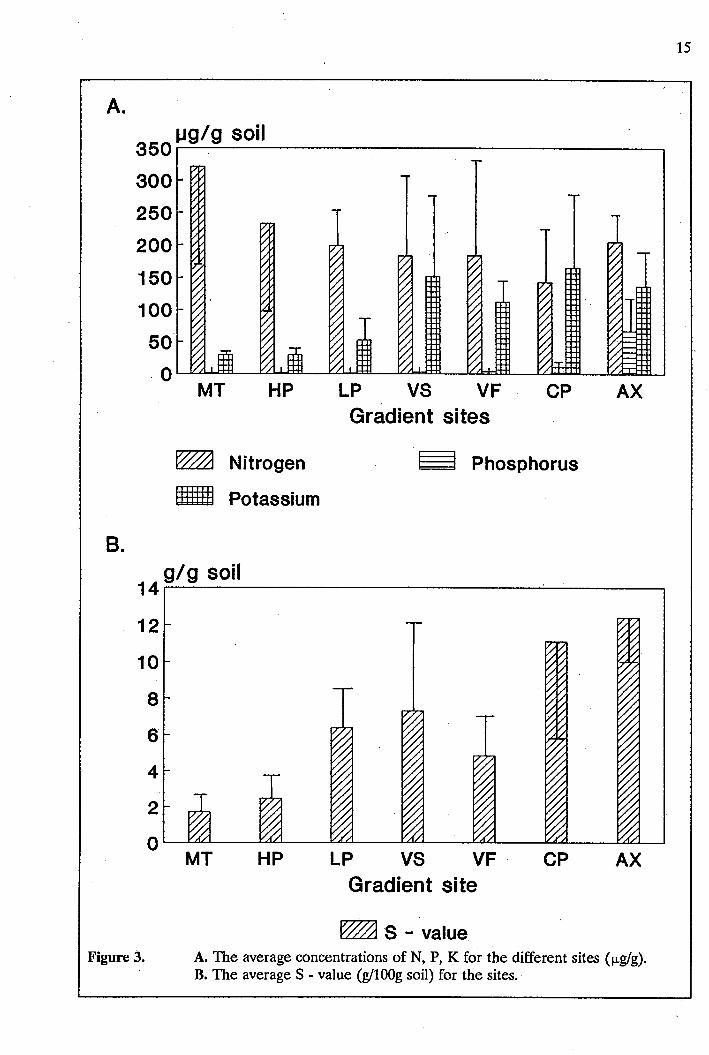
The nutrient status of the soils of the different gradient sites is given in Fig 3. There were no
significant differences (ANOVA) between the sites in the Knysna forest for nitrogen (µglg)and
potassium (µgig) concentrations or the S-values (gllOOg soil), although there were clear trends
indicated by the plotted means (Fig 3). The K concentration was highest at the coast (164 ± 138
µglg)and lowest in the mountain (28 ± 1.1 µglg)(Fig.3a), likewise for the S-value (Fig. 3b) where
the highest value on the gradient (11.1 ± 7.4 µglg)was recorded at the coast and the lowest value . .
(1.69 ± 0.85 µglg)in the mountains, which is a very low value indica~ing low soil fertility. There
was a significant correlation between the concentration of K as well as the S - value and the
weighted abundance of climbers in the small ( < 1 cm) size class (p < 0.05 in both cases), which
suggests a link between these factors and climber abundance.
For N this trend is reversed with values of 142 ± 98 µglgat the coast and 321 ± 312 µglgin the
mountain. The N concentration was positively correlated with the level of organic matter in the
soil (r2 = 0.67; p < 0.01), which was highest in the mountain and lowest in the coast (Table 2).
For phosphorous there was a significant difference (p < 0.01) between the site at the coastal plain
(9,86 ± 2,7 µgig) and the rest of the gradient sites. The pH value decreased from 6.5 to 3.5 as
the sites go up the gradient from the coast to the mountain.
The site at Alexandria had a K value just less than that at the coastal plain (136 ± 83.6 µglg)and
a P value of 66 ± 85.8 µg/gwhich was higher than the highest value in the gradient sites. The
S-value of 12.4 ± 2.0 gllOOg was higher than that of the coastal plain as was the N value of 204
± 36 µglgwhich compares with the low plateau on the gradient. Alexandria had the highest pH

14
value of 7.1 (Table 2) .. Thus the Alexandria site most resembled the coastal site in the Knysna
gradient.
Table 2. The pH, organic matter content (gig soil) and the clay fraction (%) of the soils for the different gradient sites. The values are averages for the site ± SE.
MT HP LP vs VF CP AX
pH 3.5 4.0 4.4 4.9 4.1 6.5 7.1
SE ±0.6 ±0.4 ±0.3 ±1.2 ±0.7 ±1.4 ±0.6
Org 12.0 10.7 10.5 7.2 6.8 5.6 6.9
SE ±8.2 ±6.9 ±1.5 ±4.0 ±6.6 ±3.9 ±2.1
Clay 1.0 4.0 4.4 4.9 4.1 6.5 7.1
SE ±1.0 ±2.1 ±3.2 ±9.9 ±7.5 ±9.0 ±0.8
Trends that are apparent for the altitudinal gradient are not as clearly seen in the topographical
gradient (Fig. 3). There were no significant differences between the soil nutrients of the valley
slope and the valley floor although for all of the factors except N and P there were higher levels
in the valley slope site than the valley floor site. The S - value was substantially different between
the two groups (7.3 & 4.9 g/lOOg respectively).
Species distribution
The separation of the sites surveyed based on their soil nutrient status is. clear from Fig. 4. The
mountain, coastal plain and Alexandria sites stand clearly apart with the high and low plateau and
the two valley sites clustered together in between, reflecting the trends shown in Fig. 3 and
Table 2.
There is a tendency for the climbers of all species, to lie to the left of the plot in the region of
enhanced levels of P, K and a higher pH and S-value, while the trees species are more widely
spread. The distribution of individual species of trees and climbers show patterns clearly linked
with sites (Fig. 4).
The trees Cunonia capensis, Ocotea bullata and Rapanea melanophloes are clearly linked to the
Knysna mountain forests while Cordia caffra and Erythrina caffra are linked to the Alexandria
forest There is only one climber that appears to be site specific to the mountain region and that
is the understory vine Pyrenacantha scandens. The climbers Tylophora cordata and Kedostris nana
stand out as coastal plain specialists and Solanum geniculatum and Jasminum angulare as
Alexandria specialists. Rhoicissus tomentosa is clearly more generalist climber and is found across
the gradient. Although the distributions indicated in this biplot are not absolute (see Geldenhuys
1989a), they indicate that there is a response by individual species to the gradient.
A.
8.
ug/g soil 350.---.~~~~~~~~~~~~~~~~~~-.
300
250
200
150
100
50 . o~.u...i..c=----L..Ll.oL..l:=----L..<...U.-t=----IL~=----IL.Ll::i:::l=-----'-~~--l<~
MT HP
~ Nitrogen
U Potassium
LP vs VF CP AX Gradient sites
~ Phosphorus
g/g soil 14.---~~~~~~~~~~~~~~~~____,
12
10
8
6
4
2
OL--..i:...a.£..L.-~..L.a.<:.1-~-'<-4-""'--~-L.£.LL.l-~-L£1LJ_~~La-~-L~--l
MT HP LP vs VF CP AX Gradient site
~ S - value Figure 3. A. The average concentrations of N, P, K for the different sites (µgig).
B. The average S - value (g/lOOg soil) for the sites.
15

16
•-TREE; KY
0 -TREE: AX a
e - VINE: KY
o Solanum geniculatum Q..,VINE: AX
.A.-TREE: AX &.KY
t:>.-VINE: AX & KY
a Cordia caffra
o Jasminum angulare
0
capensis, •
Cynanchum '/'renacantha scandens
• Rapanea• melanophlo.es
COAST AL PLAIN
• FLOOR
S~camone alpini
• I SLt:>PE Kedostris nana
Figure 4. The biplot of the results of the canonical correspondence analysis. Not all species are indicated in the biplot for clarity. Key species are plotted and labelled. the environmental variables are indicated by the arrows and their relative importance is indicated by the length of the vector.

17
Forest architecture
The forest was highest in the high plateau (22 ± 3.4 m) and lowest in the coastal plain (9.1 ± 1.5
m) (Table 3). Th.ere was a significant difference between the height of the forest in the coastal
plain and the height of the forest in the mountain anq high plateau sites (p < 0.05). There.was
a significant difference (p<0.05) between the number of trees per plot (Table 3) in the coastal
plain (11 ± 2.8) and the high and low plateau (20 ± 2.6 and 19 ± 3.3 respectively). There were
no significant correlations between the orientation or width of a plot and the abundance of
climbers at the plot.
Table 3. The height of the canopy (mean ± SE) and the number of trees per plot (mean ± SE) for each of the sites.
Site Canopy height Number of trees (m) (#)
MT 18 ± 3.2 16 ±
HP 22 ± 3.4 20 ± 5.4
LP 16 ± 4.6 19 ± 3.3
vs 14 ± 5.5 17 ± 3.0
VF 13. ± 4.9 15 ± 5.7
CP 9.1 ± 1.5 11 ± 2.8
AX 9.5 ± 1.7 11 ± 2.8
Climber abundance (per plot)
At each plot on the gradient group as well as in Alexandria there were more climbers with low
abundances (1 - 10) than higher abundances (Table 4). There were also more small climbers ( <
tern) than larger climbers (1 - 2cm & > 2cm) for all the plots, except for the medium sized
climbers (1 - 2cm) in the Alexandria plots which were more abundant in the 1 - 10 abundance
class. There were no climbers at all recorded in the mountain plots (Table 4).
The highest abundance of climbers was found in the small size class in the coastal plain plots (16.0
± 2.9) in the 1 - 10 abundance class. There were significantly more small climbers in the 11 - 20
(p < 0.005) and the 21 - 50 (p < 0.01) abundances classes in the coastal plain plots than in the
plots of the other sites (Table 4). There were significantly more large (> 2cm) climbers in the
1 - 10 abundance class in the Alexandria plots (2.0· ± 0.07) than there were at any of the gradient
sites (p < 0.01). There were no significant differences between the climber abundances of the

18
valley slope and the valley floor plots (Table 3).The variability of climber abundance per plot
(Table 4), was fairly high except for the abundance of the small climbers ( < lcm) in the 1 - 10
abundance class.
Table 4. The mean abundance of climbers ( ± SE) in the different size and abundance classes for each plot.
Gradient Size Abundance Class Group Class
1 - 10 11 - 20 21- so >50
Mountain < 1 0±0 0±0 0±0 0±0 1-2 0±0 0±0 0±0 0±0 2-5 0±0 0±0 0±0 0±0
High Plateau < 1 5 ± 1.2 0.5 ± 0.5 0.5 ± 0.5 0±0 1-2 1.8 ± 1.4 0±0 0±0 0±0 2-5 0±0 0±0 0±0 0±0
Low plateau < 1 6.3 ± 3.3 0.8 ± 0.8 0±0 0±0 1-2 1.0 ± 0.7 0±0 0±0 0±0 2-5 0±0 0±0 0±0 0±0
Valley Slope <1 14 ± 2.9 4.0 ± 1.4 0.3 ± 0.3 0±0 1-2 8.2 ± 2.0 1.3 ± 0.8 0±0 0±0 2-5 0.5 ± 0.2 0±0 0±0 0±0
Valley Floor < 1 10 ± 3.6 2.0 ± 2.0 0.5 ± 0.5 0±0 1 - 2 7.5 ± 2.7 1.0 ± 1.0 0±0 0±0 2-5 0.5 ± 0.3 0.5 ± 0.5 0±0 0±0
Coast Plain < 1 16 ± 2.9 11 ± 1.9 3.3 ± 1.1 1.5 ± 1.0 1-2 6.3 ± 3.5 2.0 ± 1.2 0±0 0±0 2-5 0.2 ± 0.2 0.7 ± 0.7 0±0 0±0
Alexandria < 1 12 ± 2.4 3.0 ± 0.7 0.8 ± 0.5 0±0 1-2 16 ± 2.3 2.3 ± 1.1 0.5 ± 0.5 0.5 ± 0.5 2-5 2.0 ± 0.7 1.3 ± 0.8 0.3 ± 0.3 0±0
To approximate the number of climbers at each site I calculated the weighted abundance of
climbers for each plot. A clear trend of increasing climber abundance with decreasing altitude was
apparent (Fig. 5). The high and low plateaus had the lowest number of small ( ± 50) and medium
( < 10) climbers per plot while the coastal plain had over 350 small climbers and about 50 medium
sized climbers. The valley slope, valley floor and coastal plain sites had very similar numbers of
medium sized climbers per plot ( ± 50) while the site at Alexandria had over 100 medium sized
climbers per plot (Fig. 5).

300
200
100
Figure S.
19
MT HP LP vs VF CP AX Gradient site
~<1cm ~1-2 cm U275 cm The average weighted abundance of climbers per forest plot. The climbers are divided into size classes.
Climber abundance (per host tree)
Any impact that climbers have on trees will depend on their abundance per host tree. I calculated
the weighted abundance of climbers per host tree for the sites as a measure of the density of
climbers per tree (Fig. 6). The density of climbers per host tree increased with a decrease in
altitude. The densities of the small climbers ranged from < 5 climbers per tree in the higher
forests to > 30 climbers at the coastal plain and 15 climbers at Alexandria. There was less than ·
one medium sized climber per host tree in the higher forests compared to more than five in the
coastal plain and double this number ( ± 10) at Alexandria. For the gradient sites the percentage
of trees with no climbers on them was highest in the Mountain (100%) and lowest in the Coastal
Plain (10,3%) (Fig. 7).

20
. Density 4Qr-~~~~~~~~~~~~~~~~~~~~
35
30
25
20
15
10
5 OL-----L~--l~:::!=-~~..=±=,__-L~=--~...1£.L...!:::t:OL-~.LA....L..J......~..J:.E.J.~L--J
Figure 6.
MT HP LP VS VF CP AX Gradient site
~<1cm ~ 1-2 cm U2-5 cm The weighted abundance of the climbers (with the abundance classes grouped) expressed as the density of climbers per host tree, for each site.
Percentage 100 .
Figure 7.
MT HP LP VS VF CP AX Gradient site
~ Trees with climbers The percentage of the trees sampled in each of the forest sites that carried one or more climbers.

21
Climber diversity
The number of species recorded at each site is shown in Fig. 8. Most species were recorded at
the coastal plain sites (28) while only 5 were recorded in the high plateau. There was a significant
correlation between the number of species present and the weighted abundance of small climbers
at each site (r2 = 0.85; p < 0.01), but not for the larger size climbers. This indicates an increasing
diversity across the gradient. There was an increase in the percentage of the climber species that
are herbaceous as the number of species recorded increases (Fig. 8). A comparison of the 36
species of climber recorded in this study (36% herbaceous and 67% woody) with the 57 species.
(79% herbaceous and 21% woody) listed by Geldenhuys (1989a) shows a preponderance of woody
species in this study.
Number of species so..--~~~~~~~~~~~~~~~~~~~~_,
25
20
15
10
5
01----'-~~-"'...t:..A.~~~..__~~~~~..........,,__~_....,_"-"'-~--J'-""-'--'
Figure 8.
MT HP LP VS VF CP AX Gradient sites
~ Woody climbers § Herbaceous climbers The number of species of climber that were sampled in each of the forest sites. The species are divided into those that are woody and those that are herbaceous.
Mode of entry
The percentage of climbers (weighted abundance) entering host trees vertically, horizontally or
both vertically and horizontally for each of the sites gives an indication of the access routes
available to climbers (Figure 9). The number of climbers entering the canopy of the individual
trees horizontally from a neighbouring tree was significantly higher than expected in the high

22
plateau, low plateau and the valley slope sites (X2 = 58, 125, 144 respectively; df = 5; p<0.01)
(Fig. 10). The presence of trellises can be important for climbers to gain access to the canopy of
host trees (Putz 1984a). As the branches of a tree's canopy are smaller in diameter than the main
trunk I predicted that in forest where the canopy is high and there are few trellises more climbers
would enter the canopy of their host trees horizontally from neighbouring trees than in forest
where the tree canopies are low and more trellises are available. The number of climbers entering
the canopy of individual trees vertically in the Coastal plain was significantly higher than expected
(X.2 = 48; df = 5; p<0.01), while for the same group the number of climbers entering their host
tree canopy horizontally was significantly lower than expected (X.2 = 239; df = 5; p<0.001),
(Table 5).
100
80
60
40
20
0
Figure. 9.
Percent
MT HP LP vs VF CP AX
Gradient site
~Vertical § Horizontal UBoth The percentage of climbers entering their host trees vertically horizontally or both vertically and horizontally for each forest site.

Percent 12Qr---~~~~~~~~~~~~~~~~~--.
100
80
60
40
20
MT HP LP vs VF CP AX Gradient site
~Canopy ~Trunk meoth
23
Figure 10. The percentage of climbers that entered their host canopies vertically, categorized into those that entered via the trunk and those that entered directly into the canopy.
Table 5. The mode of entry of climbers into the canopy of individual trees. Low = indicates that the observed frequency is below the expected frequency, High = indicates that the observed frequency is higher than the expected frequency. *"' indicates a x 2 significance level of p > 0.01, NS indicates no significant difference. '
Site Vertical Horizontal Both
MT No Climbers
HP Low NS High ** Low NS
LP Low ** High ** High NS
vs Low ** High ** High **
VF Low NS Low NS High **
CP High ** Low ** Low **
AX No Difference High ** Low **

24
Of the climbers entering their host tree vertically, the highest percentage of climbers entering via
the trunk was 32% in the Alexandria forest and the lowest 2% in the coastal plain (Fig. 10). The
results suggest that the trunk of a tree is relatively unimportant as an access route to the canopy
for climbers.
Mutual facilitation
I tested the hypothesis that the presence of one climber species in the canopy of a tree will
facilitate access to the canopy by other climber species. The null hypothesis was that the number
of climber species in the canopy of host trees would follow a Poisson distribution. The alternative
is that there were either fewer incidences of species co-occurring than predicted by the Poisson
distribution suggesting that there is competition between species or that there were more species
co-occurring than predicted which suggests facilitation between species for access to the host tree.
150
100
50
Figure 11.
0 1 2 3 4 5 6 7 8 Number of climber species per tree
~ Observed frequency ~ Expected frequency The observed frequency distribution of the climbers on the host trees compared with the expected Poisson distribution.
The distribution frequency of climbers was significantly diff~rent from a Poisson distribution CX: = 13,2; df = 5; p <0.01) with more species co-occurring than expected. This suggests that there
is facilitation between the climbers for access to the canopy (Fig. 11 ), and that the presence of one
climber species in a tree canopy may enhance the ability of other climbers in attaining the canopy .
by providing access trellises (Putz 1984a).

25
Climber load
I was interested to know whether some of the host trees were more vulnerable to climber
occupation or, on the other hand, if some trees were able to avoid climber occupation. Of the
tree species sampled, and considering only those species of which there were more than ten
individuals so as to minimise the effect of small sample size, only one species, Cordia caffra,
carried one or more species of climber on every individual tree. Cunonia capensis was the only
tree species to carry no climbers at all. Six tree species carried climbers on more than 65 % of
the individuals sampled, while four tree species carried climbers on less than 20 % of the
individuals sampled (Table 6). Of the six tree species that carried climbers on more than 65% of
the individuals sampled, four (Ce/tis africana, Cordia caffra, Nu:x:ia jloribunda, and Sideroxylon
inerme) have the same climber on more than 50% of their individual trees (Table 6).
Table 6. Tree species of the Knysna and the Alexandria forests with high climber loads ( > 65 % of trees with 1 or more climbers) and low climber loads ( < 20 % of trees climbers). Where more than half of the trees of one species host the same climber species this is shown in the column labelled 'Climber Species' and the host trees species is indicated in the first column.
Tree species % Bearing Climbers Climber Species >65% > 50%
IBuddleja saligna 70 %
Celtis africana 89% Cynanchum elipticum 56%
Scutia myrtina 56%
Cordia caffra 100 % Cynanchum elipticum 86%
Nuxia jloribunda 65% Rhoicissus tomentosa 50%
Rhus chirindensis 85 %
Sideroxylon inerme 100 % Capparis sepiaria 52%
Rhoicissus tomentosa 50%
< 20%
Cunonia capensis 0%
Curtisia dentata 19% ,
Ocotea bullata 15 %
Platylophus trif oliatus 19%
It is not possible however to separate this data from the effect of the site and an element of
circularity is introduced into the argument. To circumvent this circularity I asked if there were

26
any architectural features of a tree that made it more vulnerable to climber occupation. As most
of the climbers entered the host tree canopy vertically from the ground (Fig. 9), I tested the
hypothesis that trees with lower canopies would be more vulnerable to climber occupation and
would carry a higher climber load than trees with a higher canopy. The alternative would be that
there is no difference in the climber load of trees with different canopy heights. To avoid the
influence of the extreme forest types I considered only the high plateau, low plateau, valley slope
and vaUey floor sites. To generate the expected frequency the four sites were grouped together,
and the trees were categorized into those with canopies in four height classes ie. < 2m; < Sm; <
lOm & < 15m (Fig. 12). The proportion of trees in each height class were multiplied by the total
Number 100.----~~~~~~~~~~~~~~~---.
140
120
100
80
60
40
20 0'-"-........:~'--..U..C:::LJ..L~--L< ............ ~'--.U...C=<..L.l..>...1--.1'."'-'-l..1."'-1~-"-"'-..L.L.l.~_.....=::i......_-J
MT HP LP vs VF CP AX Gradient site
~<2 ~<5 H<10 ~<15 Figure.12. The number of climbers entering their host trees in each of four different heights for the
different forest sites. ·
number of climbers at a site. This gave the expected frequency of climbers entering into trees in
each canopy height class. The observed frequency was the total number of climbers entering trees
in each canopy class. There was a significant difference between the expected frequency of
climbers entering the trees in each canopy height class and the observed frequency (p < 0,001)
(Table 7). This suggests that the height of the tree canopy is important in determining the
vulnerability of a tree to climber invasion.

Table 7.
Discussion
27
The observed number of climbers entering trees in each canopy height class and the expected poisson frequency - see text for details.
Low Point Observed Expected Chi Class Frequency Frequency Squared
< 2m 670 808.5 23.7
<Sm 1272 870.7 185.0
< lOm 614 639.7 1.0
< 15m 65 302.1 186.1
Abiotic factors
The concentration of the soil nutrients measured follow the altitudinal gradient with the potassium
and phosphorus concentration, the pH and the S - value increasing and the nitrogen concentration
decreasing as the altitude decreases demonstrating higher levels of soil bases in the lower gradient
sites. The concentration of potassium as well as the S - value are both significantly correlated with
the weighted abundance of climbers. This suggests that there is a relationship between the
abundance of climbers and the soil base levels. The relationship between climbers and soil base
levels is further supported by the distribution of climber species (Fig. 4) 'being linked to the S -
value, and potassium and phosphorus levels in the soil.
The results from the gradient study are supported by those from the Alexandria (Fig. 3) forest
(Proctor et al. 1983) who found higher Iiana abundances in forest types where there are high
concentrations of total exchangeable bases in the Gunung Mulu National Park, Sarawak.
In general, increased levels of soil nutrients enhance the growth rates of plants. If the link '
between the abundance of climbers and soil nutrients in this study and suggested by Putz (1985)
and Putz and Chai (1987) is a result of the competitive needs of th,e climbers, (ie. to be successful
a climber needs to be able to out grow its host tree), a positive correlation would have to be
shown between climber abundance and all limiting nutrients as any limiting nutrient will tend to
restrict climber abundance. However in both this study and Proctor et al. (1983) the link is
restricted to the soil cations (bases). Climber abundance is negatively linked to the total nitrogen
concentration which does not support the argument that climbers are nutrient limited. This is
28
surprising, especially in the southern Cape, where nitrogen as well as phosphorus is a limiting
nutrient (Donald et al. 1987; Van Daalen 1984).
Comparison of the topographical aspects of the low plateau (top of the valley), valley slope and
the valley floor show there to be greater climber density in the valley floor, a result that agrees
with studies of Putz (1984), Putz and Chai (1987) and Proctor et. al. (1983). The soil potassium
and S - values are lower in the valley floor than on the valley slope which also does not support
the idea that soil nutrients are responsible for the increased climber abundance. The high climber
abundance in the valley floor may be due to an increase in the disturbance level at this site.
Although the disturbance rates have not been measured for the Knysna forest, Putz and Chai
(1987) suggest high disturbance levels in the valley floor as being a factor causing higher liana
abundances in the Gunung Mulu National Park forest in Sarawak.
The altitude of the gradient groups does not directly affect the vegetation (or climber abundance)
but it can serve as an index of other factors such as soil nutrient status and moisture availability
to the plant or it can merely be incidental to edaphic conditions (see Proctor et al. 1983). Further
the S - value of the soil, a similar measure to the concentration of total exchangeable bases, of the
soil is usually negatively correlated with macroclimatic conditions such as rainfall (Russell 1973),
which increases up the gradient. I thus suggest that the relationship between climber abundance
and soil nutrients may be correlative rather than causative.
The sampling method, ie. the use of a standardised light environment in each plot and the
inclusion of herbaceous climbers in this study prevents comparisons of climber abundance being
made with the results of other workers (eg. Proctor et al. 1983; Putz 1984; Putz and Chai 1987) .
. What is clear though is that despite the standardised lighting conditions there is variation in the
abundance of climbers over the gradient and that light is not the only factor limiting climber
abundance. I suggest that the presence of trellises may play an important role in determining the
abundance of climbers.
Interactions between trees and climbers
The significance of trellises is emphasized by the data in (Fig. 10) showing that most climbers enter
their host trees directly into the canopy and not via the stem. This suggests that small diameter
trellises and not the main tree trunk are the major route that climbers use to get to the forest
canopy. These trellises are temporary vehicles which once used are shed (Richards 1952; Putz

29
1984), either by the trellis branch being broken off under the climber load, climber strangulation
or by self thinning of the trellis plant.
To test the idea that trellis availability is an important factor in limiting climber abundance I
considered the mode of entry of climbers into the host tree canopy. Evidence from this study
supports the prediction that where the canopy is high and there are few trellises more climbers
enter their host tree canopies horizontally from a neighbouring tree than vertically. The reverse
should also be true ie. that where the forest canopy is low and there are more trellises there would
be more climbers entering their host tree canopies vertically from the ground. Most climbers in
the taller parts of the Knysna forest (i.e. high plateau, low plateau and the valley slope sites) enter
their host trees horizontally from a neighbouring tree (Table 5), while in the shorter forests (the
coastal forest and that of Alexandria) most of the climbers enter the canopy of their host trees
vertically.
A further prediction of the trellis hypothesis is that trees with lower canopies would have higher
climber occupation than trees with higher canopies. There is a clear trend showing more climbers
than expected occupying trees with short trunks and low canopies and fewer climbers in tall trees
and high ( < 15 m) canopies (Table 7). There is also greater climber abundance in the coastal
plain and Alexandria forests, forests with lower canopy height (Table 1), than in the higher forests.
As this data covers a number of different gradient sites (but excluding the extremes of the
gradient), they lend support to the generality of the idea that climber abundance is limited by
trellis availability rather than nutrients.
How this situation compares with the tropical forests is uncertain. Putz (1984a) suggests that the
presence of young trellises in tropical forest, even in the shaded understory, would enable the
lianas to get to the canopy. Physiognomically the taller Knysna forests more closely resemble the
tropical forests in most other studies (eg. Kochummen 1966; Fox 1968; Lowe and Walker 1977;
Appanah and Putz 1987), and the relative scarcity of trellises may explain the low climber
abundance.
I
Do trees have mechanisms to help them avoid climber occupation? Putz (1984b) suggests that
flexibility of the bole as well as long leaves may aid trees to shed or avoid lianas. This study
provides support for the hypothesis that by growing tall and having the lowest branches placed
high, trees may be able to escape climbers. I suggest that this may be an important refinement

30
on the suggestion of Putz (1984a) that there is no correlation between crown depth and liana
occupation. It may not be the absolute crown depth but the height of the lowest extremities of
the host tree canopy that determines the ability of the tree to avoid climbers.
Interactions between climbers
Climber species co-occurrence patterns in trees further support the trellis argument. This study
finds evidence that facilitation of access of climber species to host tree canopies may occur. This
is suggested by the demonstration that the presence of one climber species in a tree canopy is
associated with the presence of other species more than expected. This supports the suggestion
of Putz (1984) that climbers can provide trellises to other climbers although Putz and Chai (1987)
note that although a high percentage of trees carry lianas, few carry a particularly heavy load. The
presence of such a process provides further support for the role of trellises in climber success.
Conclusion
There are differences in climber abundance over the soil nutrient gradient in the Knysna forest.
The results of the survey of the Alexandria forest, which has soil nutrient levels similar to the
coastal plain of the Knysna forest, as well as similar climber abundances, validate the results of the
gradient survey and extend the generality of the results. U oder standardisep light conditions, there
are positive correlations between some of the soil nutrient levels (S - value and potassium
concentration) and the abun.dance of climbers. However these correlations may merely reflect the
attitudinal gradient and not be the cause of variation in climber abundances. I suggest that the
presence of trellises may be the most important factor limiting the distribution and abundance of
climbers. This hypothesis is supported by evidence showing that climbers predominantly enter a
canopy vertically except where the canopy is high and the only access route is horizontally via a
neighbouring canopy. Secondly differences in climber loads among trees can be related to the
height of the canopy. Further the presence of one climber in a tree appears to facilitate access
by another climber by providing a trellis. Climber distribution thus appears to be controlled by
the biotic, rather than the physical environment.

31
References
Acocks JPH. 1953. The veld types of Southern Africa. Memoirs of the botanical survey of South Africa. No. 40.
Appanah S and Putz FE. 1987. Climber abundance in virgin dipterocarp forest and the effect of pre-felling climber cutting on logging damage. Malaysian Forester 47:335-342.
Davis TAW and Richards PW. 1934. The vegetation of Moraballi Creek, British Guiana: An . ecological study of a limited area of a tropical rain forest. Part 2. J. Ecol. 22:106-155.
Donald DGM, Lange PW, Schultz CJ and Morris AR. 1987. The application offertilisers to pines in southern Africa. S. Afr. For. J. 141:53-62.
Fernandez SR. 1987. Auswirkungen der Kletterstrategie der lianen auf deren Verbreitung. Tuexenia 7:447-458.
Fox JED. 1968. Logging damage and the influence of climber cutting prior to logging in the lowland dipt~rocarp forest of Sabah. The Malayan Forester 31(4):326-347.
Lowe RG and Walker P. 1977. Classification of canopy, stem, crown status and climber infestation in natural tropical forest in Nigeria. J. Appl. Ecol. 14:897-903.
Marker ME. and Russell S. 1984. The application of biogeographical techniques to forest site-factor analysis. South African Geographical Journal 66(1):65-78.
Phillips JFV. 1928. The principle forest types in the Knysna region - an outline. S. Afr. J. Sci. 25:188-201.
Phillips JF. 1931. Forest succession and ecology in the Knysna region. Memoirs of the botanical survey of South Africa No.14.
Phillipson PB and Russell S. 1988. Phytogeography of the Alexandria forest (southeastern Cape province). Monogr. Syst. Bot. Missouri Bot. Gard. 25:661-670.
Proctor J, Anderson JM, Chai P and Vallack HW. 1983. Ecological studies in four contrasting lowland rainforests in Gunung Mulu National Park, Sarawak. J. Ecol. 71:237-260.
Putz FE. 1983. Liana biomass and leaf area of a "tierra firma" forest in the Rio Negro basin, Venezuela. Biotropica 15(3):185-189.
Putz FE. 1984a. The natural history of Iianas on Barro Colorado Island, Panama. Ecology 65(6):1713-1724.
Putz FE. 1984b. How trees avoid and shed lianas. Biotropica 16(1):19-23.
Putz FE. 1985. Woody vines and forest management in Malaysia. Commonw. For. Rev. 64( 4):359-365.
32
Putz FE and Chai P. 1987. Ecological studies of Iianas in Lambir National Park, Sarawak, Malaysia.J. Ecol. 75:523-531.
Putz FE, Lee HS and Goh R. 1987. Effects of post-felling silvicultural treatments on woody Iianas in Sarawak. Malaysian Forester 47:
Rainfall Isohyet Map of the Alexandria area. Government Printer, Pretoria, South Africa.
Richards PW. 1952. The tropical rain forest. Cambridge University Press, Cambridge .
. Russell EW. 1973. Soil conditions and plant growth. Longman. London.
Stevens GC. 1987. Lianas as structural parasites: the Bursera simaruba example. Ecol. 68(1):77-81.
Terbraak CJF. 1987. The analysis of vegetation-environment relationships by canonical correspondence analysis. Vegetatio 69:69-77.
Truswell JF. 1977. The geological evolution of South Africa. Purnell, Cape Town, South Africa.
Van Daalen JC. 1984. Distinguishing features of forest species on nutrient-poor soils in the southern Cape. Bothalia 15:229-239.
Venter HJT. 1976. An ecological study of the dune forest at Mapelana, Cape St. Lucia, Zululand. J. S. Afr. Bot. 42:211-230.
Von Breitenbach F. 1974. Southern Cape forests and trees. Government printer, Pretoria. 328 pp.
Whigham D. 1984. The influence of vines on the growth of Liquidainbar styraciflua L. (sweetgum). Can. J. For. Res. 14:37-39.
White F. 1978. The afromontane region. In: Wergner M.J.A. (Ed.), Biogeography and ecology of southern Africa. W. Junk, The Hague, pp 436 - 513.
White F and Moll EJ. 1978. The Indian ocean coastal belt. In: Wergner M.J.A. (Ed.), Biogeography and ecology of southern Africa. W. Junk, The Hague, pp 563 - 598.
Williams-Linera G. 1990. Vegetation structure and environmental conditions of forest edges in Panama. J. Ecol. 78:356-373.
33
Chapter Three
The response of trees and climbers to nutrients and light:
A field experiment.
Introduction
The distribution and abundance of climbers has been associated with nutrient rich soils (Richards
1952; Putz 1985; Putz and Chai 1987; Grubb 1987). Proctor et al. (1983) show climber abundance
to be higher in forests on alluvial soils where there are high levels of base saturation, while White
(1978) found climbers to be less common in the Afromontane forests with nutrient poor soils than
in the nutrient rich lowland Guineo-Congolian forests of southern Africa.
Within a forest, climbers are commonly associated with forest margins (Williams-Linera 1990) and
disturbances such as clear felling (Fox 1968; Lowe and Walker 1977) and natural tree fall gaps
(Phillips 1931; Putz 1984). This association has been interpreted as an indication that the climbers
are a light demanding growth form (Phillips 1931; Putz 1984), although thyy can be found in deep
shade (Forseth and Teramura 1987; Carter and Teramura 1988a).
To be successful a climber needs to be able to grow faster than its host tree (Putz 1984). High
growth rates, or in the case of climbers high shoot extension rates, are dependent on high nutrient
availability {Grime 1977) and adequate C02 uptake which is related to light conditions (Schulze
1982). Is the success of a climber dependent on high light and nutrient levels or are there other
factors that are more important, with light and nutrient levels merely being coincidental? Although
studies have been made of the photosynthetic rates of climbers in relation to their ecology \
(Forseth and Teramura 1987; Carter and Teramura 1988a; Kuppers 1985), they have not
eonsidered the relative growth rates of trees and climbers under different light conditions. To date
there have been no studies that have looked specifically at the growth rate of climbers under
different nutrient conditions.
·In this study I investigated the growth rates of trees and climbers grown under different light and
nutrient conditions. The aim is to determine whether climbers respond differently to the different

34
conditions and under which conditions, if any, the shoot extension rates of climbers are greater
than trees, thus conferring a competitive advantage to the climbers.
Study area
The study site was situated in the Orange Kloof valley at the southern end of Table Mountain (18°
25' W, 34° 05' S) (Fig. 1). The area lies in the winter rainfall region of the south western Cape
and experiences a mediterranean climate of hot dry summers and cool wet winters with an average
annual rainfall of 1230 mm. There are no evapotranspiration figures for the area but a nearby
area on Table Mountain has an overall annual water surplus. of 792 mm with a deficit occurring
in January, February and March (McKenzie et. al. 1977). Temperature ranges from 33 °C in
summer to 5 °C in winter. Frosts are rare. Although the valley is generally well sheltered it is
subjected to strong south easterly winds channelling through the valley in summer and north
westerly winds in winter.
Figure 1. Map of the orange Kloof valley and the position of the study site.

35
The altitude of the valley as a whole ranges from 140 m to 600 m above mean sea level, with the
study site being at approximately 250 m. The geology of the valley consists of an upper layer of
Table Mountain Series sandstone at altitudes above 350 m, and granite partially covered . by
colluvial sandstone at lower altitudes (Geological survey map, Government Printers, Pretoria).
Much of the vegetation of the valley is mountain fynbos (McKenzie et al. 1977), but there is well
established indigenous forest following the major water courses and in the bowl of the valley. In
parts of the lower regions of the valley Pine (Pinus sp.) plantations have been established for the
last 50 years (McKenzie et. al. 1977).
Methods
Study plot and species
The position of the study plots (Fig. 1) is in an old felled plantation neighbouring on existing
indigenous forest. Although there is debate about the original extent of the forested portion of
the valley and the extent to which anthropogenically induced fire and other influences have
reduced the forest (McKenzie et. al. 1977), the area is sufficiently close to the indigenous forest
to have at some stage been under indigenous trees. As there was no suitable site within the forest
in which to conduct the study this was the best option available for simulating forest conditions.
Three of the four species used in this experiment are indigenous to the south western Cape. The
trees, Kiggelaria africana L. and Cassine peragua L. and the woody climber Rhoicissus digitata (L.f.)
Gilg & Brandt are commonly found in the forests of the south-western Cape (Bond and Goldblatt
1984). The fourth species, a herbaceous climber Senecio thamnoides, is a commonly grown garden
plant in the southern Cape which is also found in the forests and is well suited to growing in the
area. Each plant used was between two and four years old and had been established in nutrient
rich, well watered soils under nursery conditions in .the Cape Peninsula. No plant had been
subject to stress prior to the experiment. The experiment was run for one year (August 1989 -
August 1990).
Experimental setup
I erected four shade cloth shelters with two replicate shelters each of a 30% and an 80% shade
cloth. The shelters were 2.5 m high 5.5 m long and 2 m wide. AU sides of the shelter had shade
cloth extending to the ground except the south facing side which had shade cloth extending down

36
0.5 m. Shelters were separated by 4 m to avoid mutual shading. At all times all plants were
shaded from direct sunlight. The 80 % shade cloth was designed to simulate the growth
environment within a forest and the 30 % shade cloth the growth environment in a treefall gap
or forest margin where the light levels are higher but shading still occurs. Within each shelter I
established three replicate plots 1.5 by 1.0 m (Fig. 2). Each plot contained twelve plants, i.e. three
individuals of each of the four study species inv~stigated. Each individual plant of each species
within a plot received a different nutrient treatment. There were thus, in all, six replicates of each
treatment.
3Q O/o 80 O/o 30 O/o 80 °/o
.ooo 000 000 000 000 000 000 000 000 000 000 000 000 000 000 000
000 000 000 000 000 000 000 000 000 000 000 ... ooo 000 000 000 000
000 000 000 000 000 000 000 000 000 000 000 000 000 000 000 000
lN©W~~ < I
Figure 2. Set up of the experimental plot. 30% = 30% shade cloth. 80% = 80% shade cloth. Individual circles indicate individual plants.

37
Nutrient treatments
Within each plot one individual of each species was subjected to a high (H), one to a medium (M)
and the third to a low (L) nutrient addition treatment. The position of the individuals as well as
the nutrient treatments were randomised within each plot. I calculated the high nutrient addition
on the basis of increasing the mean base level of the natural soil in Orange Kloof (ca. 2400 !Lglg
nitrogen and 151 !Lglgphosphorus) to levels reflecting the higher recorded levels in the southern
Cape forests (ca. 4500 )J-glg Nand 450 )J-glg P) (Van Daalen 1984; Donald et al. 1987;
Unpublished data G. Shafer, Saasveld Forestry Research Station). The medium nutrient addition
was one half the high addition, and the low nutrient treatment received no nutrient addition. The
calculation of the amount of nitrogen to add was based on the assumption that three percent of
the total nitrogen determined to be in the soil is available to the plant (Mitchell et al. 1987) and
the assumption that all the nitrogen added would be available.
To ensure that the nutrients were confined to the individual plants to which they were applied I
grew each plant in a six litre plastic pot (26 cm top diameter) with the bottom cut out. This
provided isolation of the plants from one another, while still allowing the plants access to the
ground water, thus minimising the need for additional watering.
I added nutrients every two months to avoid any form of nutrient toxicity and to reduce leaching
losses (Groves and Keraitis 1976). This method of application also avoided a nutrient induced
growth burst followed by a return to the nutrient poor conditions. High nutrient nitrogen
additions, in the form of urea formaldehyde (H2NCONH2 • HCHO) a slow release granule, were
66 !LgN/g soil (0.52 glpot) and medium nutrient additions 33 )J-gN/g (0.26 glpot) (Table 1).
Phosphorus, the next most limiting nutrient in the southern Cape, was added to create aN: P
ratio of ten to one (Mitchell et al. 1987). I added phosphorus as part of a Long Ashton nutrient
solution (Smith et al. 1983) from which the nitrogen had been excluded. This allowed a balanced
nutrient addition for the rest of the macro and micro nutrients to be achieved (Table 1). The
nutrients in the Long Ashton solution were added with two Htres of water after the urea to
moisten the urea granules and initiate the release of nitrogen. Two litres of deionised water were
added to the plants receiving the low nutrient treatment at the time of each nutrient application.
In the hot dry summer months it was necessary to water the plants as the ground water proved
inadequate at the depth of the pots. Equal treatments of deionised water were added to all
individuals.

38
Table 1. The nutrients and the quantities used for the medium and high nutrient additions to the potted trees and climbers every two months. The ratio of the components of the solution follows the Long Ashton nutrient solution; see text for explanation.
Nutrient source Quantity (ml/pot)
High Treatment Medium Treatment
UREA H2NCONH2•HCHO(g/pot) 0.52 0.26
MgS04 2.5 1.25
K2S04 2.5 1.25
CaCl2 2.5 1.25
NaH2P04 1.25 0.625
Na2HP04 1.25 0.625
EDTA 0.25 0.125
Balanced µ.nutrients 0.25 0.125
Growth analysis
Shoot extension
I established grow rates by measuring the extension of the main shoots of ~oth trees and climbers.
The initial lengths of the main shoot of ea~h plant were recorded and, subsequently these shoot
were remeasured every two months at each nutrient application. Measurements were made from
a set mark on the pot in which the plant was growing to the terminal bud of the main shoot. For
trees I made no attempt to straighten the stem but climber stems were loosely unravelled and laid
out for measurements to be made. I express the growth as the plotted ratio of the length of the
stem at a timex (Lx) to the initial length (Lo). This enables the comparison to be made between
the different species. Because August is the first month of the experiment, the plot at August has
a ratio one. The slope of the plotted curve is a measure of the growth rate of the plant. To test
if any of the variance in the growth rates of the plants was attributable to them being grown under
either of the replicate shade cloths a I performed a two-way anova on log transformed data from
the two replicates with the nutrient treatments used as a second factor.
Total biomass
To enable comparison of the influence of the light and nutrient treatments on the overall above
ground carbon gain of the individuals, I recorded initial biomass readings of the leaves and stems
39
of 5 random plants of each species, from the same nursery cohort as the experimental plants.
After one year I made final biomass measurements of the leaves and stems of three replicate
individuals of each species grown under each of the light and nutrient treatments.
Leaf specific weights
At the beginning and the end of the experiment I made measurements of the leaf specific weights
(dry mass/leaf area in g/cm2) of ten fully expanded leaves of each species grown under each of the
light and nutrient treatments.
Leaf nitrogen content
At the end of the experiment I obtained total leaf nitrogen content of three replicate fully
expanded leaves of each species, grown under each of the light and nutrient treatments.
Results
Initial nutrient levels
The initial nutrient levels in the pots were 2.4 ± 0.41 mg/g nitrogen and 151.7 ± 3.46 µgig
phosphorus which are in the lower range of nutrient levels reported for southern Cape forests
(Masson and Moll 1987)
Shoot extension
The initial heights of the individuals of the four species ranged from 52 ± 12 cm for S. thamnoides
to 101 ± 14.5 cm for C. peragua, (R digitata = 96 ± 28.3cm and K africana = 75 ± 8.5 cm). All
species experienced a measure of die-back of the terminal shoot region from December. K
africana leaves were selectively fed upon by the caterpillar Acraea horta between October and
January, and the die-back of this species appears to be related to a heavy caterpillar infestation.
For this reason only the results until April (8 - months) are shown as the effects of the die back
become too dominant later in the year. The die-back was not restricted to either of the nutrient
or the light treatments although there was a tendency for more die-back to occur in the plants
grown under high light conditions.

40 I
There were no significant differences between the growth rates of the plants grown in the
replicate 30 % or the replicate 80 % shade cloths (Two way Anova, log transformed data). The
maximum shoot extension of the climbers S. thamnoides and R digi,tata (3.6 and 2.2 times original
length respectively) (Fig. 3b,d) was greater than the maximum shoot extension of the trees C.
peragua andK africana (1.1and1.35 times original length respectively) (Fig. 4a,d), indicating that
the climbers had higher growth rates.
Different nutrient conditions did not result in significant differences (Anova) in shoot extension
of plants in any of the species of climber (Fig. 3) or tree (Fig. 4) investigated. There was also no
clear pattern of response of the climbers or trees, grown under equal light conditions, to different
nutrient treatments. For each species, there were no significant differences (Anova) in shoot
extension of individuals grown under different light conditions, but equal nutrient treatments.
A
c
Ratio 4·
Sun
0.5'------'-----'----'----~
August October December February April
Ratio 2.16 Sun
1.95
1.75 1.66 1.35
S. thamnoldes
-- High --<>- Medium __,._ Low
1.15,b====~===:!:-==~===--.:::;+ 0.95 August October December February April
R. digitata
-- High -e- Medium __,._ Low
B
0
4 Ratio
3•5
Shade
3
2.5
2
0.5'----~---~---'----~ August October December February April
S. thamnoldes
-- High -e- Medium __..,.._ Low
Ratio
2.16 Shade
1.95
1.75 1.66 1.35
1.16b===~==::~~==-__, ___ J 0.95
August October December February R. digitata
-- High -e- Medium __..,.._ Low
April
Figure 3. Shoot extension growth rates of climbers grown under different light and nutrient conditions. A= S. thamnoides (Highlight), B = S. ihamnoides (Low light), C = R. digitata (High light), D = R. digitata (Low light). The ratio of the Y axis is the ratio of the length of the stem at the time of measurement to the initial length of the stem. (Each point is the mean of 6 readings, SE bars have been excluded for clarity.)

41
There was also no consistent trend in the response of any of the species to different light
conditions. This suggests that at the levels investigated, nutrients and light have little effect on
shoot extension rates of the climber and tree species studied.
A 1.15
Ratio
Sun 1.1
1.05
0.95
0.9
0.85
0.8 August
c Ratio
1.35 Sun
1.25
1.15
1.05
0.9.5
0.85 August
Figure 4.
Biomass
B 1.15
Ratio
1.1 Shade
1.05
0.95
0.9
0.85
October December February Apr I! 0.8 August October December February April
C. peragua C. peragua
---High --e- Medium -A-Low ---High --e- Medium _._Low
D 1.35
Ratio
Shade 1.25
1.15
1.05
0.95
0.85 October December February April August October December February
K. afrlcana K. afrlcana
---- High --e- Medium _._low ---High --e- Medium _..,._Low
Shoot extension growth rates of trees grown under different light and nutrient conditions. A = C. peragua (Highlight), B = C. peragua (Low light), C = K. afecana (High light), D = K. afecana (Low light).
For each species the greatest increase in stem and leaf biomass was for the individuals grow with
a high nutrient application and under high light conditions (Table 2). The largest percentage
increase in stem and leaf biomass was for K africana (217 % and 185 % ) respectively. The lowest
percentage increase in stem biomass was for R. digi.tata (156 % ) and in leaf biomass was for C.
peragua ( 132 % ) (Table 2). In terms of absolute stem biomass the mean increase for C. peragua .
.(46.9 ± 3.2g) and K africana (39.4 ± 3.7g) are significantly greater (P < 0.01) (Anova) than the
increase for R. digi.tata (11.9 ± 2.2g), while for the leaves there was no significant difference
between the mean absolute biomass increase (Anova) between any of the species indicating that
trees accumulate more stem biomass than the climber but that the leaf biomass increment is
equivalent for the trees and climber.

Table 2.
42
The average initial biomass of the plants used in the experiment and the fmal biomass of the plants after the different nutrient treatments, (n = 5).
Climbers Trees Treatment s. R. digitata C. peragua K. africana
thamnoides
Light Nutrient Stem biomass (g)
Initial 14.8 ± 2.3 21.2 ± 6.6 49.3 ± 7.8 26.0 ± 0.4
High High no data 33.1 ± 2.2 96.2 ± 6.2 56.4 ± 1.8 Low no data 28.1 ± ·23 87.9 ± 5.3 55.8 ± 1.7
Low High no data 28.6 ± 1.9 86.4 ± 6.6 53.5 ± 1.7 Low no data 26.8 ± 2.6 79.9 ± 4.3 53.3 ± 2.0
Light Nutrient Leaf biomass (g)
Initial 2.22 ± 0.4 16.5 ± 1.3 25.8 ± 0.9 13.7 ± 0.2
High High no data 25.3 ± 1.0 34.0 ± 2.1 25.0 ± 1.0 Low no data 28.0 ± 1.9 30.2 ± 1.4 23.2 ± 0.9
Low High no data 27.4 ± 1.8 28.0 ± 1.2 20.6 ± 1.1 Low no data 34.7 ± 2.0 33.9 ± 2.3 21.3 ± 0.7
The final stem biomass of both climber and trees grown under low nutrient conditions were not
significantly different (Anova) from those grown under high nutrient condit~ons (Table 2). For
each species there was also no significant difference in the leaf biomass of plants grown under the
high and low nutrient conditions for each light treatment, with the exception of C. peragua (28.0
± 1.2 and 33.9 ± 2.3 respectively, P < 0.05) and R digi.tata (27.4 ± 1.8 and 34.7 ± 2.0
respectively, P < 0.05) where leaf biomass of plants grown under low nutrient conditions was
greater than under high nutrient conditions. This suggests that nutrient levels do not effect leaf
biomass under all except low light conditions.
Light levels did not effect the final stem biomass of plants grown under low nutrient conditions
(Anova). Under high nutrient conditions the final stem biomass of the two tree species was
similar, while the climber R digi.tata displayed a larger increase under high (33.1 ± 2.2) than low
(26.8 ± 1.9) light conditions (P < 0.05). However, for the trees C. peragua and K africana grown
under high nutrient conditions the increase in leaf biomass was significantly greater for plants
grown under high compared to low light conditions (34.0 ± 2.1 & 28.0 ± 1.2, (P < 0.05) and 25.0
± 1.0 & 20.6 ± 1.1, P < 0.05) respectively) (Table 2). Under low nutrient conditions the increase
in leaf biomass of trees was similar for plants grown under both light levels. In contrast the

43
increase in leaf biomass of the climber R. digi.tata grown under low nutrient conditions was greater
in high than in low light conditions (34.7 ± 2.0 and 28.0 ± 1.9, (P < 0.05))(Table 2). Under high
nutrient conditions, light levels did not effect the growth of leaves of the climber. Thus the
growth of leaves of the climber appears to be influenced directly by the soil nutrient availability.
In both the initial and the final condition for the plants grown under high light and high nutrients
the climber R digi.tata had a greater leaf biomass per unit stem biomass (78 % ) than C. peragua
(52 %) and K africana (53 %).
Leaf specific weight
I measured leaf specific weights (LSW) to determine whether differences between individual plants
reflected the different light and nutrient treatments. For each species, grown under each light
condition there were no significant differences in the LSW of plants grown in high and low
nutrient treatments (Anova) (Table 3). There were also no significant differences for plants grown
in high and low light conditions (Anova) (Table 3). There was, however, a trend with the LSW
of plants grown in high light conditions being more than those of the plants grown under low light
conditions (Table 3).
Table 3. The initial and final leaf specific weights (g/cm2) of the four species under the four treatments. 30 = 30% shade and 80 = 80% shade. H = high nutrient application and L = low nutrient application. There are no measurements of LSW for individuals of S. thamnoides, n = 10.
Climbers Trees Treatment
S. thamnoides • R. digitata C. peragua K. africana
Initial 29,8 ± 3.2 22,9 ± 1.8 30,8 ± 1.1 24,7 ± 1.6
30 - H 28,5 ± 2.6 19,6 ± 3.5 27,5 ± 1.2 11,8 ± 1.2
30 - L no data 21,2 ± 1.4 28,3 ± 1.5 10,6 ± 1.7
80 - H no data 18,9 ± 1.8 24,7 ± 3.2 8,0 ± 1.3
80- L no data 19,l ± 1.1 26,8 ± 2.2 9,7 ± 1.4
• the measurement is for a nursery grown plant
This suggests a positive response by leaves of both growth forms to increased light levels. There
was no difference in the pattern of trees and climbers. The mean LSW of the climber R. digi.tata
was significantly different from those of both tree species C. peragua and K africana. There is
however no clear difference between the different growth forms as the value of the LSW of the
climber falls between that of the two tree species.

44
Leaf nitrogen concentration
For the plants grown under high light and high nutrient conditions the herbaceous climber S.
thamnoides and the pioneer tree K africana had the highest nitrogen concentrations (2.3lµg/gdry
wt. and 2. l2µg/gdry wt.), while the woody climber R. digi.tata and the non-pioneer tree C. peragua
had much lower nitrogen concentrations (1.33µg/gand 0.94µg/g)(Fig. 5). For each species under
each light condition there was only a significant differences between the leaf nitrogen
concentration of the plants of S. thamnoides grown in the high and low nutrient treatments (2.3
µg/gand 1.0 µg/grespectively (P < O.Ol))(Anova) (Fig. 5). There was however a trend with all
species from the high nutrient treatments having higher leaf nitrogen concentrations than those
from the low nutrient treatment under the same light condition. For each species under each
nutrient treatment there was no significant difference between the leaf nitrogen concentration of
the plants grown under the different light conditions (Anova) (Fig. 5). The results suggest little
response of leaf nitrogen concentration of the trees to the different light and nutrient treatments,
while the climbers may respond' to increased nutrient levels. There appear to be no responses to
the different light conditions.
Concentration (µg/ g) 2.5..--~~~~~~~~~~-.-~~~~~~~~~~----.
2
1.5
1
0.5
0 L--..--LJ.~ S. thamnoides R. digitata
Climbers
~ 30 Shade - H
~ 80 Shede - H
C. peragua K. africana Trees
~ 30 Shade - L
~ 80 Shade - L Figure 5. Leaf total nitrogen concentration (µg/gdry wt.) for each of the four species .
grown under each of the high and low light and nutrient treatments. H = High nutrient addition. L = Low nutrient addition.

45
Discussion
Die-back appears to have affected all species, and to be due to wind burn from the strong wind
that can channel through the Orange Kloof valley. However, although the effective experimental
period was thus shortened the growth season was sufficiently long (late winter to early summer)
to realistically interpret the results.
Species with rapid growth rates require high nutrient availability to support the growth (Grime
1977). The presence of high nutrient levels however, does not ensure rapid growth rates (biomass
accumulation) which are dependent on multiple environmental factors (Whitaker 1975; Field and
Mooney 1986). The lack of significant differences in the rates of stem elongation of the climbers
under the different light and nutrient conditions suggests that neither of these factors conferred
a competitive advantage on the climbers. These results differ from those of Putz (1984) who
found increased stem elongation of the climber Dioclea reflexa in the well lit canopy gaps
compared to the forest sub-canopy. The absence of a difference in the growth rates of climbers
grown under higher soil nutrient levels challenges the association between climber abundance and
high nutrient levels (Richards 1952; Putz 1985; Grubb 1987; see also Chapter Two in this thesis).
There is a great range of stem extension growth rates, for the species considered in this study.
The variability appears to be due to the response of the plants to the nutrients and not between
the replicate light treatments. In general the climbers grew faster than the trees ·with the slower
climber growth rates for R. digi.tata remaining higher than the faster tree K africana while the
faster growing climber S. thamnoides rapidly out grew both tree species (Fig. 3 & 4).
There are however some inconsistencies in the results which are difficult to explain. For example
both R. digi.tata and K africana displayed greater shoot extension rates under low light conditions.
This is surprising for K africana, a pioneer forest species, which is fairly shade intolerant in natural
conditions. For R. digi.tata which displayed an initial slow growth response followed by a rapid
increase in stem length, shoot extension growth may be dependent on the building up of sufficient
reserves in root tubers which are than directed into stem growth. This suggests that whole plant
growth phenology may be important in competitive interactions between trees and climbers.
Although R. digi.tata experienced a significant increase in stem biomass for the plants grown under
high light and high nutrient conditions and the two tree species did not, the mean absolute

46
increase for the two trees is significantly greater than for the climber (Table 2). These differences
in biomass accumulation patterns of the two growth forms suggest an inherently higher capacity
of the trees to accumulate above ground biomass compared to the climber. The greater shoot
extension of the climber (Fig. 3) does not compensate for the biomass that does not go into
structural support, nor does the increased biomass that is placed into leaves (Table 2). It is
possible that the extra biomass is allocated to basal stem support in a climber of this age as it may
need to gain initial height to access other support structures (Putz 1984). There are no
comparable studies to date with which to compare these results.
The greater ratio of leaf biomass to stem biomass of the climber in this study (Table 2) is
supported by (Putz 1983) who found that woody climbers contributed 4.5 % of the above ground
biomass in an evergreen tropical rain forest and 19 % of the leaf area index. The enhanced leaf
area to stem biomass suggests that climbers have a greater capacity to gain carbon per unit stem
biomass than trees (Putz 1983), although the above results do not support this.
The significant increase in the leaf biomass of C. peragua and R. digi.tata (Table 2) in response to
increased nutrient levels and of all three species in response to increased light conditions suggests
that there are no fundamental differences between the growth response in terms of leaf biomass
increase of the two growth forms to the nutrients and light treatments. A pattern that is reflected
by the response of stem biomass to increased nutrient conditions.
The absence of a leaf specific weight response to the light treatments differs from the general
trend (Langeheim et al. 1984; Thompson et al. 1988). This result is possibly due to the low
number of replicate leaves sampled as there is a trend for leaves of all species grown in high light
conditions to have a higher LSW than those grown in low light conditions (Table 3). The average
value of the LSW of the climber R. digi.tata falls between that of the pioneer tree K africana and
a climax tree C. peragua suggesting that there are no patterns of difference~ in LSW between the
growth forms.
Plants that received high nutrient applications tended to have higher leaf nitrogen levels than
those with the low nutrient application (Fig. 5) although this is only significant for S. thamnoides.
This result agrees with the observation by Vitousek and Sanford (1986) that, within a species, the
levels of nitrogen in a leaf are likely to reflect the nitrogen levels available in the soil. The light
levels under which the experimental plants were grown appear to have had little effect on the

47
nitrogen concentration in the leaves (Fig. 5). This is contrary to the general trend of leaves
growing under high light conditions having higher nitrogen concentrations than leaves growing
under low light conditions (Kuppers 1984; Thompson et al. 1988). The reason for this is
uncertain. As with leaf specific weight however there appears to be no pattern between the tree
and the climber growth forms. There is limited data on the nutrient concentration of climber
foliage but Greenland and Kowal (1960) report no difference between the nitrogen concentration
of leaves in trees and climbers thus supporting this study.
Conclusion
The study supports the general observation that climbers have greater shoot extension growth
rates than trees. The application of nutrients and higher light levels resulted in increased shoot
extension of both trees and climbers but does not particularly favour the climber. Thus higher
shoot extension rates of climbers appears not to be a result of higher nutrient availability nor
higher light conditions, but is possibly due to differences in allocation of carbon, growth phenology
or leaf area index between the two growth forms. These results need to be treated as preliminary
and further studies need to extend the experimental period as well as to include an investigation
into the phenology of the experimental plants and carbon allocation to below ground structures,
as well as cover a greater range of both tree and climber species.

48
References
Bond P and Goldblatt P. 1984. Plants of the Cape flora: a descriptive catalogue. J. S. Afr. Bot. Supplementary Vol. 13. pp455.
Carter GA and Teramura AH. 1988a. Vine photosynthesis and relationships to climbing mechanics in a forest understory. Amer. J. Bot. 75(7):1011-1018.
Carter GA and Teramura AH. 1988b. Nonsummer stomatal conductance for the invasive vines kudzu and Japanese honeysuckle. Can. J. Bot. 66:2392-2395.
Donald DGM, Lange PW, Schultz CJ and Morris AR. 1987. The application of fertilizers to pines in southern Africa. S. Afr. For. J. 141:53-62.
Fernandez SR. 1987. Auswirkungen der Kletterstrategie der lianen auf deren Verbreitung. Tuexenia 7:447-458.
Field C and Mooney HA 1986. The photosynthesis-nitrogen relationship in wild plants. In: Givnish T (Ed.) On the economy of form and function. Cambridge University Press .. Cambridge. pp 25-55.
Forseth IN and Teramura AH. 1987. Field photosynthesis, microclimate and water relations of an exotic temperate liana, Pueraria lobata, kudzu. Oecologia 71:262-267.
Fox JED. 1968. Logging damage and the influence of climber cutting prior to logging in the lowland dipterocarp forest of Sabah. The Malayan Forester 31(4):326-347.
Greenland DJ and Kowal JML. 1960. Nutrient content of the moist tropical forest of Ghana. Plant Soil 12:154-173.
Grime JP. 1977. Evidence for the existence of three primary strategies in plants and its relevance to ecological and evolutionary theory. Am. Nat. 111:1169-1194. ·
Groves RH and Keraitis K 1976. Survival and growth of seedlings of three sclerophyll species at high levels of phosphorus and nitrogen. Aust. J. Bot. 24:681-690.
Grubb PJ. 1987. Global trends in species-richness in terrestrial vegetation: a view from the northern hemisphere. In: Gee JHR and Giller PS (Eds.) Organization of communities - past and present. Blackwell Scientific Publications. Oxford.
Kuppers M. · 1984. Carbon relations and competition between woody species in a central European hedgerow. 1. Photosynthetic characteristics. Oecologia 64:332-243. ·
Kuppers M. 1985. Carbon relations and competition between woody species in a central european hedgerow. IV. Growth form and partitioning. Oecologia 66:343-352.
Langeheim JH, Osmond CB, Brooks A and Ferrar PJ. 1984. Photosynthetic responses to light in seedlings of selected Amazonian and Australian rain forest tree species. Oecologia 63:215-224.

49
Lowe RG and Walker P. 1977. Classification of canopy; stem, crown status and climber infestation in natural tropical forest in Nigeria. J. Appl. Ecol. 14:897-903.
Masson PH and Moll EJ. 1987. Factors affecting forest colonisation of fynbos in the absence of recurrent fire at Orange Kloof, Cape Province, South Africa. S. Afr. For. J. 143:5-10.
McKenzie B, Moll EJ and Campbell BM. 1977. A phytosociological study of Orange Kloof, Table Mountain, South Africa. Vegetatio 34:41-53.
Mitchell DT, Stock WD and Jongens-Roberts SM. 1987. Nitrogen and phosphorus cycling in the fynbos biome. A report of the terrestrial ecosystems section . of the ecosystem programmes, Number 18.
Peace WJH and MacDonald FD. 1981. An investigation of the leaf anatomy, foliar mineral levels and water relations of trees of a Sarawak forest. Biotropica 13:100-109.
Philips JF 1931 Forest succession and ecology in the Knysna region. Memoirs of the botanical survey of South Africa No.14.
Proctor J, Anderson JM, Chai P and Vallack HW. 1983. Ecological studies in four contrasting lowland rainforests in Gunung Mulu National Park, Sarawak. J. Ecol. 71:237-260.
Putz FE. 1984. The natural history of Iianas on Barro Colorado Island, Panama. Ecology 65( 6): 1713-1724 ..
Putz FE. 1985. Woody vines and forest management in Malaysia. Commonw. For. Rev. 64( 4):359-365.
Putz FE and Chai P. 1987. Ecological studies of lianas in Lambir National Park, Sarawak, Malaysia. J. Ecol. 75:523-531.
Richards PW. 1952. The tropical rain forest. Cambridge University Press. Cambridge.
Schulze E-D. 1982. Plant life forms and their carbon, water and nutrient relations. Encyclopedia of plant physiology, NS Vol 12B. Springer Verlag, Berlin.
Smith GS, Johnston CM and Conforth IS. 1983. Comparison of nutrient solutions for growth of plants in sand culture. New phytol. 94:537-548.
Thompson WA, Stocker GC and Kreidemann PE. 1988. Growth and photosynthetic response to light and nutrients of Flindersia brayleyana F. Muell., a rain forest with broad tolerance to sun and shade. Aust. J. Plant Physiol. 15:299-315.
Van Daalen JC. 1984. Distinguishing features of forest species on nutrient-poor soils in the southern Cape. Bothalia 15(1&2):229-239.
Vitousek PM and Sanford RL. 1986. Nutrient cycling in moist tropical forest. Ann. Rev. Ecol. Syst. 17:137-167.
White F. 1978. The afromontane region. In: Wergner MJA (Ed.) Biogeography and ecology of southern Africa. W. Junk, The Hague. pp 436-513.

50
Whittaker RH. 1975. Communities and Ecosystems. Macmillan, New York.
Williams-Linera G. 1990. Vegetation structure and environmental conditions of forest edges in Panama. J. Ecol. 78:356-365.

51
Chapter 4
Climber photosynthetic attributes:
Or how do climbers grow faster than trees?
Introduction
Climbers differ from trees in their absence of a rigid woody support (Darwin 1867; Givnish and
Vermeij 1976; Halle et al. 1978). Many climbers are characterised by rapid stem extension rates
while stem diameter growth is slow (Putz and Windsor 1987). Climbers also have higher leaf areas
to stem biomass ratios than trees (Putz 1983). To be competitively successful a climber needs to
be able to grow faster than its host in order to gain access to the canopy (Putz 1984). The
competitive abilities of a plant can be expressed at different levels (Kuppers 1984). They can be
expressed at the level of the whole plant, through patterns of carbon allocation to support
structures or through differing branching patterns differ (Kuppers 1985; Givnish 1986).
Alternatively they can be expressed at leaf level where high C02 assimilation rates, and thus
carbohydrate supply to the plant, may contribute to the competitive ability. of a plant (Chapin
1980).
Climbers are thought to be associated with well lit forests and high nutrient levels (Phillips 1931;
Richards 1952, Proctor et al. 1983; Putz 1984; Grubb.1987). A number of studies have compared
photosynthetic attributes of native and exotic climbers in an attempt to explain the invasive
abilities of the exotics (Carter et al. 1989; Forseth and Teramura 1987) as well as to explain the
ecology of vines with different climbing mechanisms (Carter and Teramura 1988). Kuppers (1984)
investigated competitive interactions between different growth forms by measuring C02 uptake
capacity of the leaves of shrubs and a climber. However with the exception of these studies the
ecological physiology of climbers remains poorly understood.
In this study I investigate whether the differences in growth rates, defined as shoot extension,
between trees and climbers is a function of different rates of carbon assimilation. I consider
aspects of the carbon gain mechanisms of trees and climbers at the level of the leaf in an attempt

52
to determine if differences in the carbon assimilation patterns of the two growth forms can explain
their relative successes. I do this in three ways:
Firstly, I measured the maximum photosynthetic rates and light response curves of two forest tree
and two climber species. Measurements were made on plants that had been grown under different
light and nutrient conditions, to test the idea that the differing environmental factors affect the
relative photosynthetic rates, and potentially, the growth rates of trees and climbers.
Secondly, as the maximum photosynthetic capacity of leaves is related to the nitrogen content of
those leaves (Field and Mooney 1986), I measured the nitrogen concentration of leaves from trees
and climbers covering a broad geographical range to determine whether there were any general
patterns of higher nitrogen content in climbers than in trees.
Thirdly, I investigated the water use efficiency of climbers, and by implication their productivity
(Farquhar and Richards 1984), relative to trees by comparing the &13C isotope ratio in leaves of
trees and climbers from a broad range of forests.
Methods
Leaf collection and preparation
To enable generalization of the results over a broad geographical range, I collected leaf material
from five each of the common tree and climber species at each of five southern African forests
(only two from Alexandria) (Fig. 1). To reduce intra-forest variation in leaf 813C values due to
differences in light environment (Korner et al. 1986; Ehleringer et al. 1987) I standardised the
collection process by taking leaf materi~l only from the outer edge of the canopy where leaves
were in full stinlight. Leaves were oven dried at 70 °C for four days and ground through a 0.4 mm
mesh.
Photosynthetic attributes
I used plants from the experiment described in Chapter Three. These comprised individuals of the
canopy tree species Cassine peragua, the forest margin tree Kiggelaria africana, a woody climber
Rhoicissus digi.tata and a herbaceous climber Senecio thamnoides, all C3 species. Each individual,
except those of S. thamnoides, had been grown for 16 months under two shade cloth treatments,.

53
i.e. 30 % shade cloth (sun plants) and 80 % shade cloth (shade plants), and two nutrient
conditions, i.e. a low condition with no nutrient additions to a nutrient poor soil and a high
condition with nutrients added to simulate the high levels of some of the southern Cape forests
(van Daalen 1984) (see Chapter three for details of the study site and the experimental design).
The high nutrient additions were 66 µg/gN, 6.6 µg/gP and other nutrients in a Long Ashton ratio
to the P levels (see Smith et al 1983). All individuals of S. thamnoides grown in the experiment
of chapter three had suffered a complete dieback, and nursery grown plants therefore were used.
These plants had been grown under high light and high nutrient conditions.
I kept all plants used for photosynthetic measurements under their original shading conditions and
watered twice a week until immediately prior to measurements, when they were transferred in
their pots, to a phytotron. The light in the phytotron was produced by a bank of sodium and metal
halide lamps to achieve a balanced light spectrum.
For each species, I made measurements on one leaf each of three replicate plants for each of the
four treatments (only one treatment for S. thamnoides). To ensure that comparisons between the
photosynthetic readings of leaves were not compounded by the effects of differing leaf phenology
common in evergreen plants (Mooney and Gulmon 1982), the leaves selected were judged, by
their appearance and position on the plant, to be even aged. To measure the gas exchange
response to different light conditions as well as the maximum photosynthetic. respo.nse (Amax), I
made initial measurements at a high photosynthetic photon flux density (PPFD) of 1600 µmol/m2/s
to which the plants were allowed to acclimate for 15 to 20 minutes before readings were taken.
Measurements were made on 5.5 cm2 of fully expanded undamaged leaf placed in the cuvette of
an ADC LCA2 (Hoddesdon, England) portable infra red gas analyzer (IRGA). After each set of
readings the light intensity was reduced by the erection of shade cloth and a 15 - 20 minute
acclimation period was allowed before taking the next set of readings. The light was reduced in
steps from 1600, 1200, 600, 200, 100 and 50 µmol/m2/s.
Leaf nitrogen ·
I used 5 g of dried and ground leaf material to determine the nitrogen concentrations of tree and
climber leaves over the collection range. The analyses were done using phenate Colorimetry
(Nicholson 1984). For statistical purposes I transformed the data using the arcsine of the square
root of the percentage N in the leaves and analysed using two way ANOV A to identify any
differences in the N concentration between trees and climbers as well as between forests.
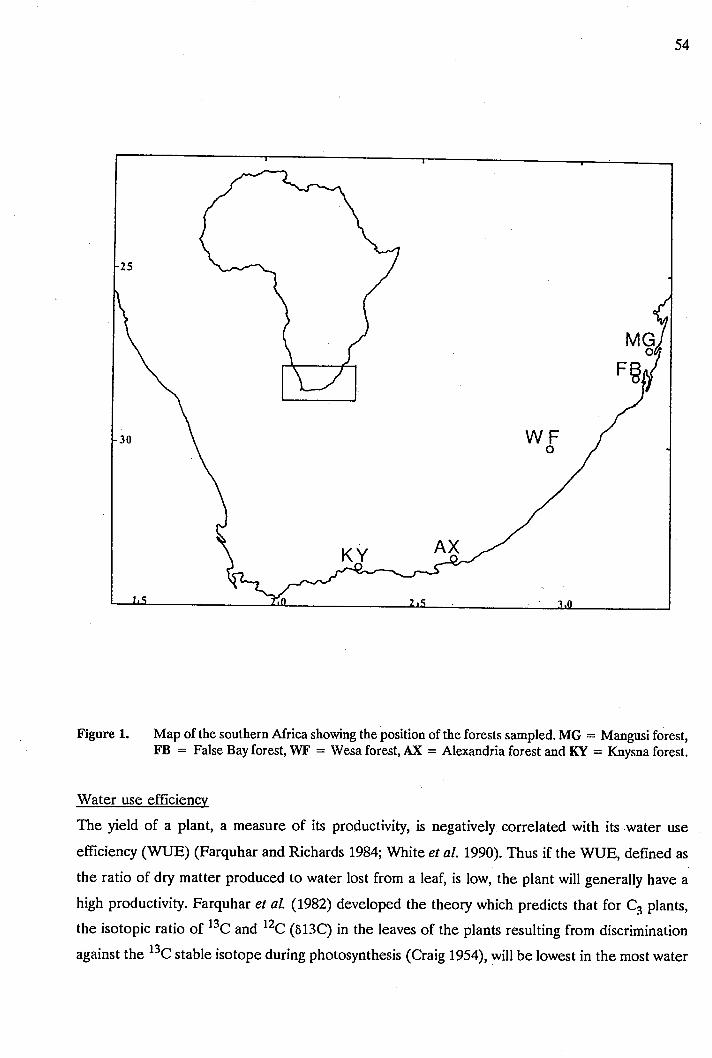
25
30
Figure 1.
54
WF 0
Map of the southern Africa showing the position of the forests sampled. MG = Mangusi forest, FB = False Bay forest, WF = Wesa forest, AX = Alexandria forest and KY = Knysna forest.
Water use efficiency
The yield of a plant, a measure of its productivity, is negatively. correlated with its water use
efficiency (WUE) (Farquhar and Richards 1984; White et al. 1990). Thus if the WUE, defined as
the ratio of dry matter produced to water lost from a leaf, is low, the plant will generally have a
high productivity. Farquhar et al. (1982) developed the theory which predicts that for C3 plants,
the isotopic ratio of 13C and 12C (813C) in the leaves of the plants resulting from discrimination
against the 13C stable isotope during photosynthesis (Craig 1954), will be lowest in the most water

55
use efficient plants. Recently this theory has been empirically verified (Rubick et al. 1986;
Farquhar and Richards 1984).
I combusted ground leaf material (5 - 8 mg) of each tree and climber at 800 °C for six hours. The
combustion was done in an evacuated quartz tube with one gram copper oxide, a few coils of
copper shavings and a sliver of silver to catalyze the complete conversion of carbon into C02
(Sofer 1980). The carbon dioxide resulting from the combustion was separated from the nitrogen
and water vapour by cryogenic distillation techniques (Sofer 1980). This entails initially releasing
the gasses into a stainless steel line evacuated to 10-2 Torr. The carbon dioxide and water vapour
were then frozen into a glass trap with liquid nitrogen while the remaining nitrogen is pumped off.
The trap is then immersed in a slurry of dry ice and ethanol which causes the carbon dioxide to
boil off and the water vapour to remain frozen. Finally the carbon dioxide is trapped in a
collecting tube with liquid nitrogen and is sealed off with a flame .
. I analysed the carbon dioxide on a mass spectrometer (Micromass VG 602E) to determine the
ratio of 13c to 12C and thus the s13C value as described by Tieszen et al. (1987). The final s13C
values for the samples are expressed relative to the isotopic composition of the belemnite
carbonate standard from Peedee (PDB), south Carolina (Craig 1957). As three replicate analyses
of the s13C ratio from one test leaf sample showed an error of less than 0.5 percent, I did not
replicate subsequent sample measurements. I analysed the results statistically using two way Anova
on log transformed data.
Results
Photosynthetic responses
Photosynthetic responses to PPFD differed for the trees and climbers grown in the shade and
those grown in the sun (Fig. 2). For all sun grown plants photosynthesis was saturated at 1200 -
1600 µmol/m 2/s(Fig. 2a) while shade grown plants were saturated at light intensities of 600 - 1200
µmol/m 2/s (Fig. 2b ).

B.
A (11mol/m2/s) 12 s 11 un
10 9 8
500
A (11mol/m2/s) 7 Shade 6
5
4
3
2
1
1000 1500 2000
ol-lliii_;;;_~~~~-'-~~~~~----'~~~~~~-'-~~~~~---'
0 500 1000 1500 2000 PPFD (11mol/m /s)
~ CP (H) -a- KA (H) -8- RD (H) -- ST (N)
---+-- CP (C) -'V'- KA (C) -8- RD (C)
56
Figure 2. Response curves of net photosynthetic carbon uptake (A) measured on leaves of the four species grown under the two nutrient treatments. A. Sun grown plants; B. Shade grown plants. Each point is a mean from three leaves. CP = C. peragua, KA = K africana, RD = R. digitata and ST = S. thamnoides. (H) = grown under high nutrient conditions, (C) = grown under control nutrient conditions and (N) = grown under nursery conditions.

57
The maximum C02 assimilation rates (Amax) for all the sun grown plants ranged between 3.1 and
6.3 µ.mol/m2/s(Fig. 3) while those of the shade grown plants ranged between 1.5 and 4.8 µ.mol/m2/s
(Fig. 3). For all species, individuals grown in the high nutrient conditions had a higher Amax than
individuals grown under control nutrient conditions.
Amax (µmol/m2 /s) 7.--~~~~~~~~~~~~~~~~~~~~~~~~~~~
6
5
4
3
2
1 oL--~f..a:::U..U;.J._~~~.J.L.L.-U.l.-l-~~~~-=-._.,_~~~-'-''"'--1-~~-J
CP
~ 30-H
~ 80-H
KA Species
~
~
RD ST
30 - L·
80 - L
Figure 3. Amax values for the leaves of the four species grown under the two nutrient and light treatments. Each point is a mean from three leaves. CP = C. peragua, KA = K africana, RD = R. digitata and ST = S. thamnoides. (H) = grown under high nutrient conditions, (C) = grown under control nutrient conditions and (N) = grown under nursery conditions.
For the sun grown plants the canopy tree, C. peragua grown in the high nutrient treatment and
the climber R.. digitata grown in both the high and the control nutrient treatments, showed very
similar maximum C02 assimilation rates of ± 6 µ.mo1/m2/s.S. thamnoides had the lowest Amax of
3 µ.mol/m 2/s (Fig. 3). The percentage increase in Amax between the low and the high znutrient
treatments was greaier for both C. peragua and K africana than for R. digitata (Fig. 3).
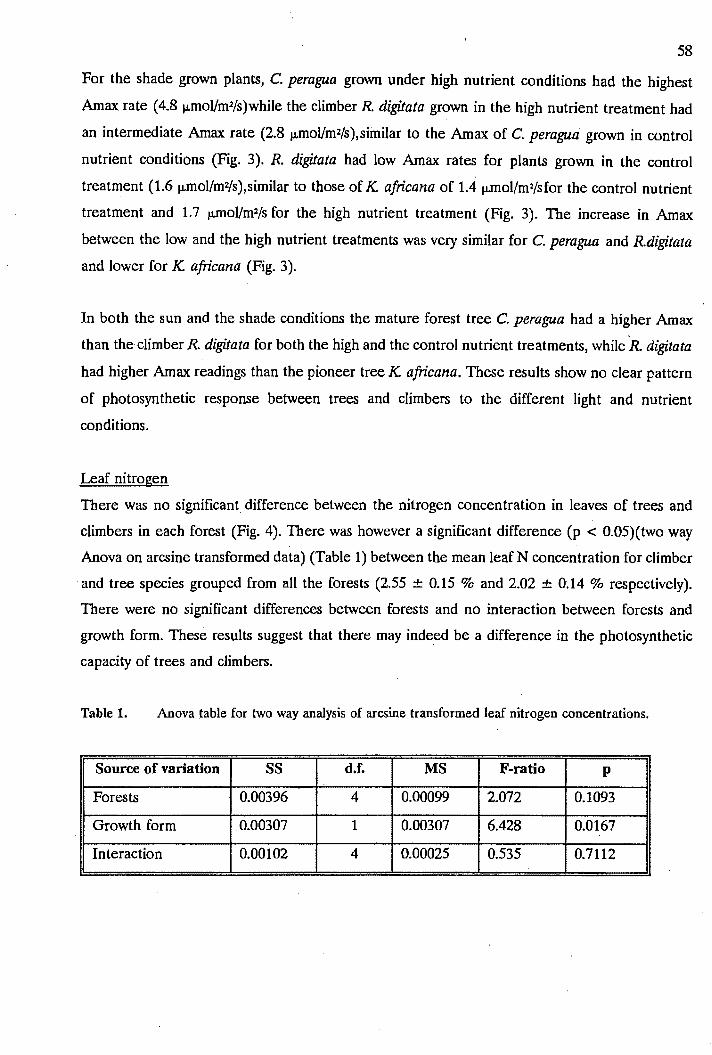
58
For the shade grown plants, C. peragua grown under high nutrient conditions had the highest
Amax rate ( 4.8 µ.mol/m2/s )while the climber R. digitata grown in the high nutrient treatment had
an intermediate Amax rate (2.8 µ.mol/m2/s),similar to the Amax of C. peragua grown in control
nutrient conditions (Fig. 3). R. digitata had low Amax rates for plants grown in the control
treatment (1.6 µ.mol/m2/s),similar to those of K africana of 1.4 µ.mol/m2/sfor the control nutrient
treatment and 1.7 µ.mol/m2/s for the high nutrient treatment (Fig. 3). The increase in Amax
between the low and the high nutrient treatments was very similar for C. peragua and R.digitata
and lower for K africana (Fig. 3).
In both the sun and the shade conditions the mature forest tree C. peragua had a higher Amax
than the climber R. digitata for both the high and the control nutrient treatments, while R. digitata
had higher Amax readings than the pioneer tree K africana. These results show no clear pattern
of photosynthetic response between trees and climbers to the different light and nutrient
conditions.
Leaf nitrogen
There was no significant difference between the nitrogen concentration in leaves of trees and
climbers in each forest (Fig. 4). There was however a significant difference (p < 0.05)(two way
Anova on arcsine transformed data) (Table 1) between the mean leaf N concentration for climber
and tree species grouped from all the forests (2.55 ± 0.15 % and 2.02 ± 0.14 % respectively).
There were no significant differences between forests and no interaction between forests and
growth form. These results suggest that there may indeed be a difference in the photosynthetic
capacity of trees and climbers.
Table 1. Anova table for two way analysis of arcsine transformed leaf nitrogen concentrations.
Source of variation SS d.f. MS F-ratio p
Forests 0.00396 4 0.00099 2.072 0.1093
Growth form 0.00307 1 0.00307 6.428 0.0167
Interaction 0.00102 4 0.00025 0.535 0.7112

N Concentration (%) 3,--~~~~~~~~~~~~~~~~~~~~~~--.
2.6
2
1.5
MG FB
~ Tree leaves
AX Forests
WF
§ Climber leaves
KY
59
Figure 4. The mean concentration(%) of nitrogen in the leaves of the trees and climbers from the five forests. MG = Mangusi forest, FB = False Bay forest, AX = Alexandria forest, WF = Wesa forest and KY = Knysna forest.
Isotopic measurements
The measured leaf B 13c of trees covered a similar range (-25.47 to -31.23) to climbers (-25.28 to -
32.24) (Fig. 5), although the two trees with s13C values of -31 were both from Wesa forest and
appear to be outliers. With in these ranges the mode of tree B13C values at -26 indicates a
tendency toward less discrimination against the 13C isotope than for climbers with a mode of -28
(Fig. 5).
There was no significant difference a~ong the mean s13C values for each forest (Anova)(Fig. 6).
There was no significant difference between the mean s13C value of tree (-27.49 ± 0.37) and
climber (-28,32 ± 0.33) leaves from all the forests grouped (two way Anova, p < O.l)(Table 2)
although there was a trend with the climbers generally having more negative s13C values than the ·
trees, suggesting that the climbers are less water use efficient than the trees.

Relative frequency (0/0) ao.-~~~~~~~~~~~~~~~~~~~---.
50
40
30
20
10
-25 -26 -27 -28 -29 d13C
-30
~Trees §Climbers
-31 -32
60
Figure S. The frequency distribution of the carbon isotope ratios for the tree and climber leaves sampled in the five forests. The leaves are grouped by the integer of the 813C value.
Table 2. Anova table for two way analysis of log transformed leaf a13c values.
Source of variation SS d.f. MS F-ratio p
Forest 0.00121 4 0.00030 0.502 0.734
Growth forin 0.00180 1 0.00180 2.980 0.095
Interaction 0.00229 4 0.00006 0.946 0.451

d13C 30.-~~~~~~~~~~~~~~~~~~~---.
29
28
27
26
MG FB
~Trees
AX Forests
WF
§Climbers
KY
61
Figure 6. The mean &13C isotope ratio of the tree and climber leaves of the five forests. The bars represent the standard errors. MG = Mangusi forest, FB = False Bay forest, AX Alexandria forest, WF = Wesa forest and KY = Knysna forest.
Discussion
Climbers generally have higher shoot extension rates than self supporting trees and shrubs (Putz
1984; see Chapter 3). I was interested to know if differences in the photosynthetic capacities
between the two growth forms. provide a physiological basis to explain growth differences or are
they simply a function of differences in allocation. The results of this study show that, within a
nutrient treatment, while the Amax of one of the climbers R. digi,tata was consistently greater than
that of the pioneer tree K africana it was also consistently lower than the later successional tree
C. peragua. Further the climber S. thamnoides had the lowest Amax of all species. This lack of a
cle~r pattern in the Amax values of the trees and climber suggests that the capacity to
photosynthesize faster does not explain the differences in shoot extension growth rates between
the two growth forms. This conclusion is supported by the results of Kriedemann and Smart (1971)
62
who found that the photosynthetic rates of the field vine Vitis vinifera L were not inherently
higher than those of other deeiduous perennial shrubs.
Increased photosynthetic rates of plants grown under higher nutrient conditions have been
documented (e.g. Thompson et al. 1988), while climbers have been associated with soils of higher .
nutrient status (Phillips 1931; Putz and Chai 1987; Grubb 1987). Implicit in the association is the
idea that higher nutrient levels permit enhanced climber growth rates and confer a competitive
edge to climbers over their host trees. However a causal relationship between climber abundance
and soil nutrient status remains to be demonstrated (see Chapter Two). These results show that
while the Amax of the climber R. digitata increased with increased nutrient availability the rate was
still lower than that of the tree C.peragua. Further the percentage increase in the Amax of R.
digitata in response to increased nutrients under high light conditions is less than that of
C.peragua. This suggests that differences in maximum photosynthetic responses to increased
nutrient levels are insufficient to explain the greater shoot extension rates recorded for this
climber in Chapter Three.
The patterns of Amax readings of the two tree species are surprising considering the generally
accepted idea that early successional plants have higher photosynthetic rates than later
successional plants (Bazzaz and Picket 1980; Medina 1986). The reasons for this are not clear but
are possibly due to the plants having experienced sufficient stress to cause die.back of the terminal
shoots earlier in the year (see Chapter Three), and thus not accurately r~flecting the nature of
the growth forms under optimal conditions. The low levels of Amax recorded in the study are
comparable with those of other sclerophyll leaves from southern Africa (Mooney et al. 1983).
The significant difference between the leaf nitrogen level of climber and tree species sampled from
a number of forests (Fig. 4) suggests that climbers have the capacity to photosynthesise at a higher
rate than trees. However the difference is small in magnitude and appears insufficient to be an
important factor in explaining the faster shoot extension rates of climbers compared with trees.
These results differs from those gained by the IRGA analysis of instantaneous photosynthesis, but
because it reflects a more integrated measure as well as a number of species over a wide
distribution this result probably carries more weight than those of the Amax readings. While the
Amax readings represent an instantaneous measurement of the photosynthetic capacity of the
trees and climbers under light saturated conditions the leaf nitrogen concentration provides a more
integrated measure (see Field and Mooney 1986). The relationship between the leaf nitrogen

63
concentration and the Amax of C3 leaves is relatively insensitive to differences among species,
their growth conditions and growth forms (Field and Mooney 1986, but see Evans 1989).
Finally the study shows climbers to have more negative s 13C values than trees, although the
difference is not quite significant at the five percent level. Potential confounding effects due to
sampling from different parts of the canopy (Ehleringer et al. 1987) have been minimised and the
attitudinal effects are probably minimal (Korner et al. 1986), so that the differences between trees
and climbers reflect real differences in water use efficiency. In a study covering many growth forms
Ehleringer et al. (1987) found woody climbers to have a mean s13C value of -31.22, which differs
from trees with a value of -31.08. A lower water use efficiency for climbers would imply that they
are inherently more productive than trees (Farquhar and Richards 1984), a result that supports
the higher leaf nitrogen levels found in climbers compared with trees.·
Conclusions
Both the leaf nitrogen concentrations and the leaf s13C ratios suggest that there are differences
in the photosynthetic capacities of trees versus climbers. However the Amax readings recorded for
trees and clirp.bers grown under different light and nutrient conditions do not support this finding.
This can possibly be explained by the photosynthetic rates recorded in this study being a result of ., .
the past history of the plants rather than reflecting the inherent properties of the growth forms.
The differences between the growth forms in foliar nitrogen concentration and s13c are small,
and there are probably other factors involved in the rapid shoot extension rates of climbers
compared to trees.· The most important of these must include differences in the allocation of
carbon to shoot extension growth rather than tosupport structures as seen in Chapter Three, but I
could also include more complex factors such as branching patterns (Kuppers 1985) and factors
such as seasonal variation in photosynthetic response to light as well as the length of the growing
season (Kuppers 1984; Carter et al. 1989) and the ability to control leaf orientation (Forseth and
Teramura 1987). More detailed studies of these factors will contribute greatly to our understanding
of the ecology of climbers ..

64
References
Bazzaz FA and Pickett STA 1980. Physiological ecology of tropical succession: a comparative review. Ann. Rev. Ecol. Syst. 11:287-310.
Carter GA and Teramura AH. 1988. Vine photosynthesis and relationships to climbing mechanics in a forest understory. Amer. J. Bot. 75(7):1011-1018.
Carter GA, Teramura AH and Forseth IN. 1989. Photosynthesis in an open field for exotic versus native vines of the southeastern United States. Can. J. Bot. 67:443-446.
Chapin FS. 1980. The mineral nutrition of wild plants. Ann. Rev. Ecol. Syst. 11:233-260.
Craig H. 1954. Carbon-13 in plants and the relationships between carbon-13 and carbon-14 variations in nature. J. Geol. 62:115-149.
Craig H. 1957. Isotopic standards for carbon and oxygen and correction factors for mass spectrometric analysis of carbon dioxide. Geochim. Cosmochim. Acta 12:133-149.
Daiwin C. 1867. On the movements and habits of climbing plants. Journal of the Linnaean Society (Botany) 9:1-118.
Ehleringer JR, Lin ZF, Field CB, Sun GC and CY Kuo. 1987. Leaf carbon isotope ratios of plants from a subtropical monsoon forest. Oecologia 72:109-114.
Evans JR. 1989. Photosynthesis and nitrogen relationships in leaves of C3 plants. Oecologia 78:9-19.
Farquhar GD, O'Leary MH and Berry JA 1982. On the relationship between carbon isotope discrimination and the intercellular carbon dioxide concentration in leaves. Aust. J. Plant Physiol. 9:121-137.
Farquhar GD and Richards RA 1984. Isotopic composition of plant carbon correlates with water use efficiency of wheat genotypes. Aust. J. Plant Physiol. 11:539-552.
Field C and Mooney HA 1986. The photosynthesis-nitrogen relationship in wild plants. In: On the economy of plant form and function. Ed. T Givnish.Cambridge University Press Cambridge.
Forseth IN and Teramura AH. 1987. Field photosynthesis, microclimate and water relations of an exotic temperate liana, Pueraria lobata, kudzu. Oecologia 71:262-267.
Givnish TJ and Vermeij GJ. 1976. Sizes and shapes of liana leaves. Am. Nat. 110:743-778.
Givnish TJ. 1986. Economics of support. In: Givnish TJ (Ed) 'On the economy of plant form and function'. Cambridge University Press, Cambridge. pp 413-420.
Grubb PJ. 1987. Global trends in species-richness in terrestrial vegetation: a view from the northern hemisphere. In: Gee JHR and Giller PS (Eds.) Organization of Communities - past and present. Blackwell Scientific Publications, Oxford.

65
Halle F, Oldeman RAA and Tomlinson PB. 1978. Tropical trees and forests: An architectural analysis. Springer-Verlag, Hiedelberg, Germany.
Rubick KT, Farquhar GD and Shorter R. 1986. Correlations between water-use efficiency and carbon isotope discrimination in diverse peanut (Arachis) germplasm. Aust. J. Plant Physiol. 13:803-816.
Korner Ch, Bannister P and Mark AF. 1986. Attitudinal variation in stomata! conductance, nitrogen content and leaf anatomy in different plant life forms in New Zealand. Oecologia 69:577-588.
Kriedemann PE, Smart RE. 1971. Effects of irradiance, temperature, and leaf water potential on photosynthesis of vine leaves. Photosynthetica 5(1):6-15.
Kuppers M. 1984. Carbon relations and competition between woody species in a central European hedgerow. 1. Photosynthetic characteristics. Oecologia 64:332-243.
Kuppers M. 1985. Carbon relations and competition between woody species in a central european hedgerow. IV. Growth form and partitioning. Oecologia 66:343-352.
Medina E. 1986. Forests, savannas and montane tropical environments. In: Photosynthesis in contrasting environments. Eds. Baker NR and Long SP. Elsevier Science Publishers.
Mooney HA and Gulmon SL. 1982. Constraints on leaf structure and function in reference to herbivory. Bioscience 32:198-206.
Mooney HA, Field C, Gulmon SL, Runde! P and Kruger FJ. 1983. Photosynthetic characteristic of South African sclerophylls. Oecologia 53:398-401.
Nicholson G. 1984. Methods of soil, plant and water analysis. FRI Bulletin No. 70, Forest Service, Rotorua New Zealand.
Phillips JF. 1931. Forest succession and ecology in the Knysna region. Memoirs of the botanical survey of South Africa No.14.
Proctor J, Anderson JM, Chai P and Vallack HW. 1983. Ecological studies in four contrasting lowland rainforests in Gunung Mulu National Park, Sarawak. J. Ecol. 71:237-260.
Putz FE. 1983. Liana biomass and leaf area of a "Tierra firme" forest in the Rio Negro Basin, Venezuela. Biotropica 15:185-189.
Putz FE. 1984. The natural history of lianas on Barro Colorado Island, Panama. Ecology 65(6):1713-1724.
Putz FE and Chai P. 1987. Ecological studies of lianas in Lambir National Park, Sarawak, Malaysia.J. EcOI. 75:523-531.
Putz FE and Windsor DM. 1987. Liana phenology on Barro Colorado Island, Panama. Biotropica 19:334-341.
Richards PW. 1952. The tropical rain forest. Cambridge University Press. Cambridge.

66
Schulze E-D. 1982. Plant life forms and their carbon, water and nutrient relations. Encyclopedia of plant physiology, NS Vol 12B. Springer Verlag, Berlin.
Smith GS, Johnston CM and Cornforth IS. 1983. Comparison of nutrient solutions for growth of plants in sand culture. New Phytol. 94:537-548.
Thompson WA, Stocker GC and Kriedemann PE. 1988. Growth and photosynthetic response to light and nutrients of Flindersia brayleyana F.Muell., a rainforest tree with broad tolerance to sun -and shade. Aust. J. Plant Physiol. 15:299-315.
Tieszen LL, Hein D, Qvotrup SH, Troughton JH and Imbamba SK 1979. Use of 813C values to determine vegetation selectivity in east African herbivores. Oecologia (Berlin) 37:351-359.
Van Daalen JC. 1984. Distinguishing features of forest species on nutrient-poor soils in the southern Cape. Bothalia 15(1&2):229~239. ·
White JW, Castillo JA and Ehleringer J. 1990. Associations between productivity, root growth and carbon isotope discrimination in Phaseolus vulgaris under water deficit. Aust. J. Plant Physiol. 17:189-198.

67
Chapter Five
The impact of climbers on forest regeneration:
Or do climbers inhibit forest regrowth?
Introduction
The evergreen forests of southern Africa have been broadly categorised into two biogeographical
groups, the upland Afromontane forests and the lowland Tongaland/Pondoland forests (White
1983; White and Moll 1978). The highland forests experience a cooler, more moist climate than
the_warmer and drier conditions of the lowland forests (Geldenhuys 1989) .. The soil substrate of
sedimentary rock (Meadows and Linder 1989) with a low nutrient status in the highland forests
differs from that of the lowland forests which is derived from uplifted sands and dunes (Moll 1980)
and is more nutrient rich (see MacDevette 1989; Marker and Russell 1984). Does this grouping,
based on floristic differences, reflect only the individual species response to climate and soil
differences, past species migrations and shared histories or are there differences in the dynamics
and the regeneration conditions (Grubb 1977) that may underlie the compositional shifts between
the groups?
Forest dynamics and the regeneration of mature forest canopy trees by new growth has long
interested forest ecologists (Phillips 1931; Watt 1947; Richards 1952; Whitmore 1982). The initial
focus on the replacement patterns of trees after large scale disturbance of a forest ( eg. Veblen
1979) has, in the last two decades, been replaced by an interest in the effects of smaller scale
disturbances, in particular gaps in the forest canopy due to tree falls (Hartshorn 1978; Runkle
1985; Denslow 1987).
Many studies have been concerned with the description and quantification of the regeneration of
mature forest trees and the successional pathways that are followed, after the formation of a
treefall gap (see Phillips 1931; Swaine, Lieberman and Putz 1987). These studies include work
on biotic factors such as seed bank dynamics (Schupp 1988), seed germination (Garwood 1983),

68
and seedling (Turner and Newton 1990) and sapling dynamics (Lang and Knight 1983). Other
studies have concentrated on changes in environmental factors such as the increase in light
intensity (Canham 1988a), the increase in air and soil temperatures (Denslow 1980) the increase
in nutrient availability in larger gaps (Denslow 1987), and the effect that these changes have on
the species composition and structure of the regenerating forest.
The most dramatic, and possibly the most important change that occurs when a gap forms in the
canopy, is the change in the light intensity (Canham 1988a). The importance of the response of
forest plants to light has led Swaine and Whitmore (1988) to suggest that two guilds, based on the
plants light response, be named ie. pioneer (shade intolerant) and climax (shade tolerant) guilds.
Much of the literature on forest regeneration is concerned with the competitive interactions and
differential survival of different light response guilds to different gap formation processes, gap
frequencies and gap sizes (see Denslow 1987 for review), and how these interactions may influence
community composition of a forest (Brokaw 1985; Connell 1989). Gaps in the forest canopy have
become widely accepted as being important for the regeneration of canopy species (Whitmore
1989).
Different plants growing to different heights within a forest result in a layered structure developing
between the ground and the canopy (Richards 1952; Smith 1973). Little 'WO~k has been done on
the interaction between the understory and the overstory and the effects that these interactions
may have on the regeneration of canopy tree species. The inhibitory effects of shading by
individual vegetation layers, for example the understory layer (Veblen 1979) and the lateral growth
of the gap edge branches (Hibbs 1982), on regenerating individuals have been considered.
However the influence of different layers within the same forest on the regenerating canopy tree
species has not been studied. The impact of climbers on the regeneration of canopy trees in
treefall gaps has been mentioned (Phillips 1931; Kochummen 1966; Putz 1984), but not quantified.
The treefall gap as a homogeneous entity has been challenged (Halle et al. 1978), and differences
in the distribution of species within treefall gap microsites have been shown (Brandani et al. 1988;
Putz 1983). The orientation of the gap appears to effect the regeneration processes (Poulson and
Platt 1989). These demonstrations suggest that gaps are not rigid entities which influence forests
regeneration in set ways. There have been recent challenges of the universal validity of viewing
69
a forest as a series of gaps in an otheiwise complete candpy, for understanding forests dynamics
(the gap/non-gap paradigm) (Canham 1988b; Lieberman et al. 1989; Midgley et al. 1990). For the
present study, however, the dichotomy is found to be a useful tool in investigating the differences
in dynamics between the highland and the lowland forests.
Little has been done on the dynamics of the forests of southern Africa. In the southern Cape,
Phillips (1931) investigated broad forest succession, Geldenhuys and Maliepaard (1983) have
examined the causes and nature of gaps, and Midgley et al. (1990) have looked at shade tolerance
and species distribution patterns. A number of studies describe and discuss aspects of the
successional dynamics of the forests of the Natal coastal belt (Huntley 1965; Breen 1971; Moll
1972; Weisser and Marques 1979; Moll 1980; Ward 1980). Understanding of the processes driving
the regeneration dynamicS of these forests is, however, weak.
In this study I attempt to quantify the regeneration dynamics of a number of highland and lowland
forests by comparing the regeneration of canopy species in gaps and non-gaps. I aim to determine
whether any differences in the regeneration dynamics between upland and lowland forests can be
detected and whether these can be attributed to the shading effects of different vegetation layers
within the forests.
Study area
I selected nine forests from the mixed evergreen forests of Natal and the southern and eastern
Cape (Fig. 1). Rainbow Gorge, Wesa forest andKnysna forest represent a range of Afromontane
forests of the highlands and Mist Belt of Natal and the southern Cape (White 1978). Mangusi,
Mabibi, False Bay and Cape Vidal represent lowland forests of the Tongaland/Pondoland region ·
(White and Moll 1978); (for a detailed report of the indigenous forests of Natal see Gordon
(1989)). Oribi Gorge and Alexandria Forest do not fit neatly into the Afro-Montane or the Indian
Ocean Costal Belt phytochoria and can be considered to be transition (or linking) forests between
the above two groupings (Phillipson and Russell 1988; Cooper 1985) (see Table 1). Although
there are floristic links between the Afromontane and the Tongaland/Pondoland forests there are
structural differences (particularly in the number of climbers) between the two regions and the

70
growth rates are generally higher in the Tongaland/ Pondoland forests (White and Moll 1978).
While the majority of forest patches in southern Africa cover less than 1 km2 (Geldenhuys 1989),
the forests chosen for this study were all sufficiently large to enable edge effects to be avoided.
25
RG 0
Figure 1. Map of southern African showing the location of the forests. MG = Mangusi fore$t, MB = Mabibi forest, FB = False bay forest, CV = Cape Vidal forest, RG = Rainbow Gorge forest, WF = Wesa forest, OG = Oribi Gorge forest, AX = Alexandria forest and KY = Knysna forest.

71
Table 1. The forests that were surveyed in this study, their abbreviations in brackets, the number of gap and sub-canopy plots surveyed in each forest, their elevation above mean sea level and their phytogeographical affinities. TIP = Tongaland Pondoland Forest.
Forest Plot Elevation Affinity Number
Mangusi (MG) 10 < lOOm TIP (Lowland)
Mabibi (MB) 9 < lOOm TIP (Lowland)
False Bay (FB) 6 < lOOm TIP (Lowland)
Cape Vidal (CV) 6 < lOOm TIP (Lowland)
Alexandria (AX) 6 200m Transition (linking)
Oribi Gorge (OG) 6 400m Transition (linking)
Rainbow Gorge (RG) 10 2000m Afromontane (Highland)
Wesa Forest (WF) 6 750m Afromontane (Highland)
Knysna (KY) 5 250m Afromontane (Highland)
Methods
Field surveys were carried out between April and June 1990. Although in Natal closed canopy
woody communities greater than five meters high are often classified as forest (MacDevette et.al.
1989), I restricted all sampling to forest with a canopy at least ten meters high.
To establish where the canopy species were regenerating and to assess the structural attributes of
the forest, I surveyed between five and ten gaps and neighbouring sub-canopy plots within each
forest (Table 1). I defined a gap as an opening in the canopy where there was evidence of at least
one fallen tree. In each case the gaps were situated well away from the forest margin. Sub
canopy plots, defined as plots below intact forest canopy, were sited in a random direction from
the centre of the gap and initiated five meters from the base of a gap edge tree so as to avoid the
influence of the gap light conditions on the sub-canopy vegetation (Canham 1988a). The sub
canopy plots were of the same area and dimensions as the adjacent canopy gap.
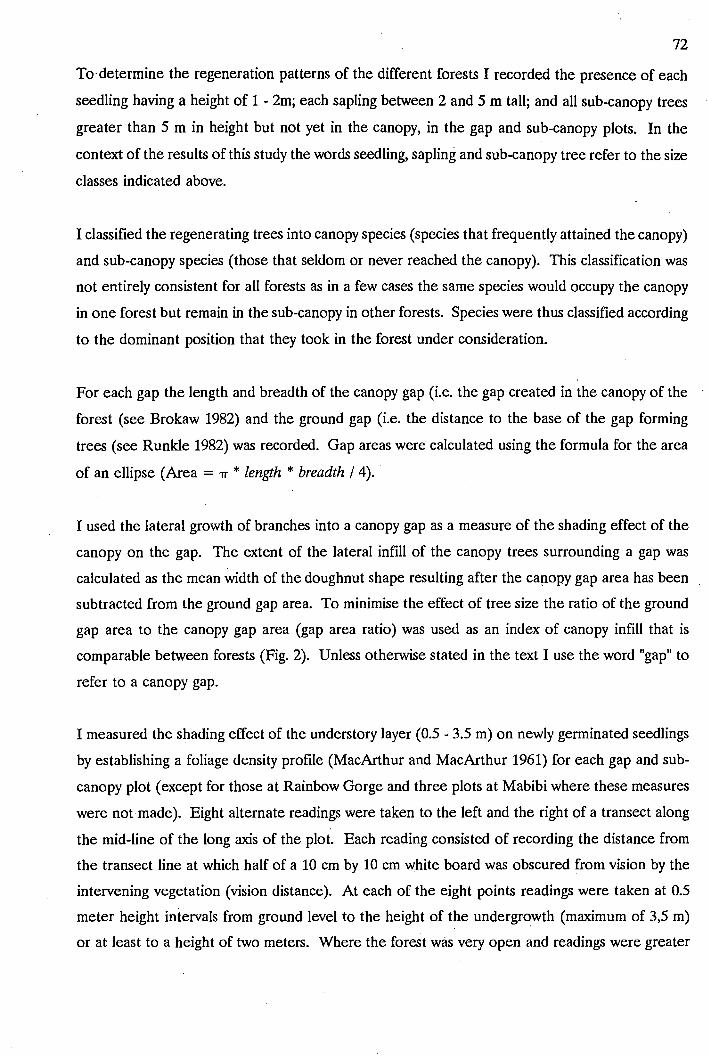
72
To·determine the regeneration patterns of the different forests I recorded the presence of each
seedling having a height of 1 - 2m; each sapling between 2 and 5 m tall; and all sub-canopy trees
greater than 5 m in height but not yet in the canopy, in the gap and sub-canopy plots. In the
context of the results of this study the words seedling, sapling and sub-canopy tree refer to the size
classes indicated above.
I classified the regenerating trees into canopy species (species that frequently attained the canopy)
and sub-canopy species (those that seldom or never reached the canopy). This classification was
not entirely consistent for all forests as in a few cases the same species would occupy the canopy
in one forest but remain in the sub-canopy in other forests. Species were thus classified according
to the dominant position that they took in the forest under consideration.
For each gap the length and breadth of the canopy gap (i.e. the gap created in the canopy of the
forest (see Brokaw 1982) and the ground gap (i.e. the distance to the base of the gap forming
trees (see Runkle 1982) was recorded. Gap areas were calculated using the formula for the area
of an ellipse (Area = 'IT * length * breadth I 4).
I used the lateral growth of branches into a canopy gap as a measure of the shading effect of the
canopy on the gap. The extent of the lateral infill of the canopy trees surrounding a gap was
calculated as the mean width of the doughnut shape resulting after the cap.opy gap area has been
subtracted from the ground gap area. To minimise the effect of tree size the ratio of the ground
gap area to the canopy gap area (gap area ratio) was used as an index of canopy infill that is
comparable between forests (Fig. 2). Unless otherwise stated in the text I use the word "gap" to
refer to a canopy gap.
I measured the shading effect of the understory layer (0.5 - 3.5 m) on newly germinated seedlings
by establishing a foliage density profile (MacArthur and MacArthur 1961) for each gap and sub
canopy plot (except for those at Rainbow Gorge and three plots at Mabibi where these measures
were not made). Eight alternate readings were taken to the left and the right of a transect along
the mid-line of the long axis of the plot. Each reading consisted of recording the distance from
the transect line at which half of a 10 cm by 10 cm white board was obscured from vision by the
intervening vegetation (vision distance). At each of the eight points readings were taken at 0.5
meter height intervals from ground level to the height of the undergrowth (maximum of 3,5 m)
or at least to a height of two meters. Where the forest was very open and readings were greater

73
than ten meters I recorded the vision distance as ten meters. The inverse of the vision distances
at each height were calculated and joined using a best fit line. The integral of the best fit line was
used as a measure of foliage density. A foliage density index for each plot was calculated as the
mean area of the eight reading points.
Figure 2.
A.
B.
Illustrating the effect of two gap area ratios (the ratio of the ground gap area to the canopy gap area, see text for details) on the penetration of light to the ground. A. A small ratio (e.g. 2:1) indicates a higher probability that the whole ground gap is influenced by the incoming light. B. A larger ratio (e.g. 4:1) indicates a higher probability that any advance regeneration remains shaded. ·
Ground cover was recorded in each plot as a measure of the shade environment of germinating
and newly establishing seedlings. Ground cover categories comprised grasses and ferns, seedlings
of herbaceous Acanthaceous species e.g. Jsoglossa woodii, fallen Iiana (woody climber) mats and
bare ground. Cover values were recorded only for individuals less than 30 cm in height.

74
I recorded the presence of woody climbers for each plot. Lianas were classified into small ( < 1
cm); medium (1 - 2 cm) and large (2 - 5 cm) size classes. Abundance ratings of 1 - 10 (5); 11 -
20 (15); or 21 - 50 (35) were made. The figure in brackets is the weighting given to each
abundance group in the results. The presence of liana curtains was noted.
Results
Regeneration Dynamics
The percentage of canopy species regenerating in the highland forests was two times higher than
in the lowland forests, both in the gaps and the sub-canopy plots; 51 %; and 56% for the highland
and 29% and 25% for the lowland gaps and sub-canopy plots, ·respectively (Table 2). The highest
mean number of seedlings of a canopy species regenerating in any of the forests was 8.3
individuals from the gap plots in the False Bay forest while the lowest is zero for the Cape Vidal
forest (Table 2). There were no significant differences between the number of canopy seedlings,
saplings or sub-canopy trees regenerating in the gap and the sub-canopy plots for any of the
forests (Table 2).
For the forests grouped into highland and lowland forests, excluding the transitional forests, there
were no significant differences between the number of canopy seedlings, saplings or sub-canopy
trees in the gap and the sub-canopy plots for the highland or the lowland forests. However, for
each of the size classes there was a clear trend with the lowland forests having more canopy
individuals regenerating in the gaps than in the sub-canopy plots while· in the highland forests
more canopy individuals regenerated in the sub-canopy plots than in the gaps (Table 3).
For the grouped data there were significantly fewer (p < 0.001) (Anova) seedlings (1 - 2 m) of
·canopy species, regenerating in the sub-canopy of the lowland forests (1.7 ± 0.4) than in the sub
canopy of the highland forests (7.2 ± 1.7) (Table 3). There Wyre also significantly fewer sub
canopy trees of canopy species regenerating in the sub-canopy plots of the lowland forests (1.4
± 0.3) than in the highland forests (3.2 ± 0.7) (p < 0.05). This trend is not apparent for the
saplings (2 - 5 m). There were no .differences in canopy species regenerating between the gaps
of the lowland and highland forests, in any of the three size classes (Table 3).

I ,.
Table 2.
75
The mean number of seedlings {1-2 m), saplings {2-5 m) and sub canopy trees {>5 m but not in the canopy) in each of the forests ( ± SE) for the gap and sub-canopy plots {S~C), and the percentage of the total stems that are canopy species in each class.
Size Class Forest
Lowland Transition Highland
MG MB FB CV AX OG RG WF KY
1-2 Gap 1.7 1.2 8.3 0.0 2.7 1.5 4.2 5.3 5.2 SE 1.2 0.7 4.2 0.0 1.0 0.2 2.1 2.0 3.9 % 19 21 53 0 33 24 49 40 63
1-2 S-C 2.9 1.2 1.7 0.2 2.7 2.8 9.6 7.0 5.2 SE 1.3 1.0 0.8 0.2 1.2 1.0 3.7 1.9 3.7 % 33 15 52 2 25 40 62 56 72
2-5 Gap 5.4 4.7 3.8 0.7 0.0 2.0 4.7 2.3 1.2 SE 2.7 2.0 2.7 0.3 0.0 0.6 1.2 0.8 0.6 % 43 33 44 8 0 29 60 21 30
2-5 S-C 6.6 2.0 1.2 4.2 1.3 3.5 4.8 2.0 2.4 SE 2.1 0.6 0.5 1.5 0.8 1.6 1.5 0.8 1.2 % 52 15 26 24 21 29 59 11 75
>5 Gap 2.3 1.0 0.8 0.2 4.3 1.0 2.1 1.5 2.8 SE 1.0 0.6 0.3 0.8 1.4 0.5 0.7 0.6 1.0 % 57 56 30 4 86 44 81 35 78
>5 S-C 2.0 0.8 0.5 2.3 2.2 2.7 4.0 2.3 3.4 SE 0.6 0.3 0.3 1.1 0.7 1.3 0.9 1.2 1.4 % 40 15 10 25 40 33 80 24 74
Table 3. The mean number of canopy species individuals ( ± SE), regenerating in the different size classes, for the gaps and the sub-canopy plots {S-C) of lowland and highland forests. Lowland includes Mangusi, Mabibi, False Bay and Cape Vidal forests; Highland includes Rainbow Gorge, Wesa and Knysna forests.
Size Class Highland Lowland
1-2 m Gap 4.8 ± 1.4 3.5 ± 1.4 S-C 7.2 ± 1.7 1.7 ± 0.4
2-5 m Gap 3.0 ± 0.6 5.8 ± 1.2 S-C 3.2 ± 0.6 3.3 ± 1.0
>Sm Gap 2.1 ± 0.4 1.8 ± 0.4 S-C 3.2 ± 0.7 1.4 ± 0.3

76
There appears to be a consistent self thinning effect shown by the reduction in the number of
individuals with increasing size classes in both the gaps and the sub-canopy plots in the highland
forest (Table 3), while there is no clear pattern for the lowland forests.
The highland forests had a consistently higher percentage of canopy seedlings regenerating in both
the gaps and the sub-canopy (Fig. 3a) than the lowland forests where there was great variability
in the regeneration patterns. No clear pattern is evident for the larger size classes although the
differences between the lowland and the highland forests become less clear (Fig. 3b,c). These
results suggest that there is greater predictability in the regeneration of the highland forests while
the lowland forests have episodic regeneration.
Structure
Ground cover
Newly germinated seedlings may be excluded by competitive interactions with the ground layer of
a forest. However in the present study there was a hig;h percentage of bare ground recorded in
all the forests .. The ground cover for the gap and sub-canopy plots in all of the forests was less
than 30% except in Wesa Forest (67% in gap; 69% in U/S) and Rainbow Gorge (58% in gap;
35% in U/S) (Table 4). There was significantly more grass and fern cc.JVer in the gaps of the
highland forests than in the gaps of the transitional and lowland forests (p < 0.05). The
Acanthaceous layer (often largely comprising Isoglossa woodii) never occupied more than 30% of . !
the cover at this level. Liana mats, were only found in the gaps and were more common in the
highland forests (Table 4), however they provide very little of the cover, being greatest at
Alexandria (12% ), and were absent in most forests. The cover values shown in Table 4 do not
always total 100% as other categories such as the presence of boulders and treefall logs have not
been included in the table although they always represented less than ten percent of the cover.
These results suggest that the influence of the ground layer on germinated seedlings is probably
slight.

A.
B.
c.
p e r c e n t a g e
p e r c e n t a g e
p e r c e n t a g e
Figure 3.
70 1 - 2 m
70 2 - 5 m
100 > 5 m
80
60
40
20
oL_J~:;i___JCL.i:::::::t....___J~::i___Jl:::.:E3.-L-Jca::::::t....___J~::::t...._....1.......[L.1:::::1-~i:a::::1.-~1,G.1;--
MG MB FB Lowland
cv AX OG RG WF KY Trane High land
Foree ta
~ Gap ~ Sub-canopy
77
The percentage of the regenerating individuals that are canopy species in the gap and the sub-canopy plots of each forest. A. Seedlings, B. saplings and C. sub-canopy trees.

78
Table 4. The composition and mean percentage of the ground cover in the gap and sub-canopy (S-C) plots for all of the forests surveyed.
*
Forest
Lowland Transition Highland
Forest MG MB FB CV AX OG RG WF KY"'
1. woodii Gap 14 28 0 29 0 0 0 0 6 S-C 15 0 0 28 2 0 0 0 2
Grass/Ferns Gap 3 0 3 2 6 12 58 67 14 S-C 5 0 0 0 17 0 32 1
Liana mat Gap 1 0 0 5 12 0 8 7 3 S-C 0 0 0 0 0 1 0 0 0
Bare ground Gap 83 80 95 63 78 65 28 13 75 S-C 80 00 00 72 81 91 60 14 96
The understory in this forest is not largely represented by Isoglossa woodii but by a woody shrub, Trichocladus crinitus.
Understory layer
The foliage density of the understory was measured as an index of the light environment
experienced by seedlings. The density of the gap understory was highest at Cape Vidal (8.01 ±
0.87) and lowest at Knysna (1.92 ± 0.22). The density of the sub-canopy.understory was highest
at Cape Vidal (2.65 ± 0.28) and lowest at False Bay (0.49 ± 0.14) (Fig. 4).
There was a significant difference (p < 0,001) between the density of the gap understory and the
sub-canopy understory in each of the eight forests where density was measured (Rainbow Gorge
excluded). The forests were grouped into highland, transitional and lowland forests to determine
whether there was a difference in the mean densities of the understory between the groups. The
density of the under story in lowland gaps (4.19 ± 0.27) was significantly higher than under the
sub-canopy (1.43 ± 0.12) (p < 0.001), and the density of the understory in highland gaps (2.3 ±
0.19) was significantly greater than the density of the understory under the forest canopy (0.96 ±
0.07)(p < 0,001) (Fig. 5).

79
Density Index 10,--~~~~~~~~~~~~~~~~~~~--
8
6
4
2
MG
Figure 4.
MB FB CV AX OG WF KY Forests
~Gap § Sub-canopy The density index of the understory in the gap and the sub-canopy plots in each of the forests.
The understory density of the gaps in lowland forests was significantly greater (4.19 ± 0.27) than
highland forests (2.3 ± 0.19)(p < 0.01) (Fig. 5). The same is true for below the canopy where
the lowland understory (1.43 ± 0.12) was significantly more dense than the highland (0.96 ± 0.07)
(p < 0.05).
There was a significant negative correlation between the number of canopy seedling regenerating
in the gaps of the different forests and the density of the associated understory (r2 = 0.523; Y = -0.94 X + 6.9; p < 0.05), as well as between the percentage of canopy species and the density of
the herbaceous layer in the gaps of the different forests (r2 = 0.63; Y = - 6.95 X + 56.6; p <
0.05) (Fig. 6). This suggests that the density of the understory layer negatively influences the
regeneration of canopy species in these forests.

80
Density Index 5.--~~~~~~~~~~~~~~~~~~~~~~-
4
3
2
1
LOWLAND.
~Gap
TRANSITION Forests
HIGHLAND
~ Sub-canopy
Figure 5. The density index of the understory in the gap and the sub-canopy plots for the forests grouped into lowland (Mangusi, Mabibi, False Bay and Cape Vidal), transitional (Oribi Gorge and Alexandria) and highland (Wesa and Knysna) forests.
There was a greater range in understory density of the lowland forests, both in the gap and the
sub-canopy plots, than in the highland forests (Fig. 4). To ascertain if any of the forests had
particularly patchy understory, I considered the degree of heterogeneity of the understory density
by calculating the coefficient of variation of the density indices (Table 5). There was no significant
difference in the coefficients ·of variation of the gap or sub-canopy understory density indices
between the forests.
Table 5. The coefficient of variation of the density indices of the gap and the sub-canopy understory layers for the forests measured. The results suggest that the understory layer has an impact on the regeneration of canopy species and may influence where seedlings can establish.
Lowland Transition Highland
Forest MG MB FB CV AX OG WF KY
Gap Coef. var. .53 .53 .52 .75 .93 .97 .79 .73
S-C Coef. var. 84 1.39 2.04 0.74 0.72 1.32 .39 1.19

Percentage Sor-~~~~~~~~~~~~~~~~~~~--.
50
40
30
20
10
[] Y •. -6.95X + 56.6
r • 0.63
0'--~~~-'-~~~~-'--~~~--l~~~~-µ.;i.~~~----1
0 2 4 6 8 10 Density Index
81
Figure 6. The regression of the density index of the understory and the percentage of the regenerating individuals that are canopy species in each forest.
Canopy lateral growth
I quantified canopy gap lateral growth to determine whether patterns of regeneration could be
explained by the shading effect of this lateral growth. There was no significant difference in the
size of the mean canopy gaps between forests although Cape vidal has a significantly larger mean
ground gap area than the other forests (p < O.Ql ). There was also no significant difference
between the extent of lateral infill of the gap edge trees between forests except between that of
Alexandria (6.9 m) and Oribi Gorge (2.2 m) (P<0.05) (see Table 6). There were no significant
differences in the extent of lateral infill between the lowland and the highland groupings of the
forests.
The gap area ratio (ground gap area : canopy gap area), was remarkably similar between the
forests with a ratio value of approximately 2.5 for most forests (Table 6), the exceptions being
False Bay (8.3) and Mangusi (6.2). There was no significant correlation between the height of the
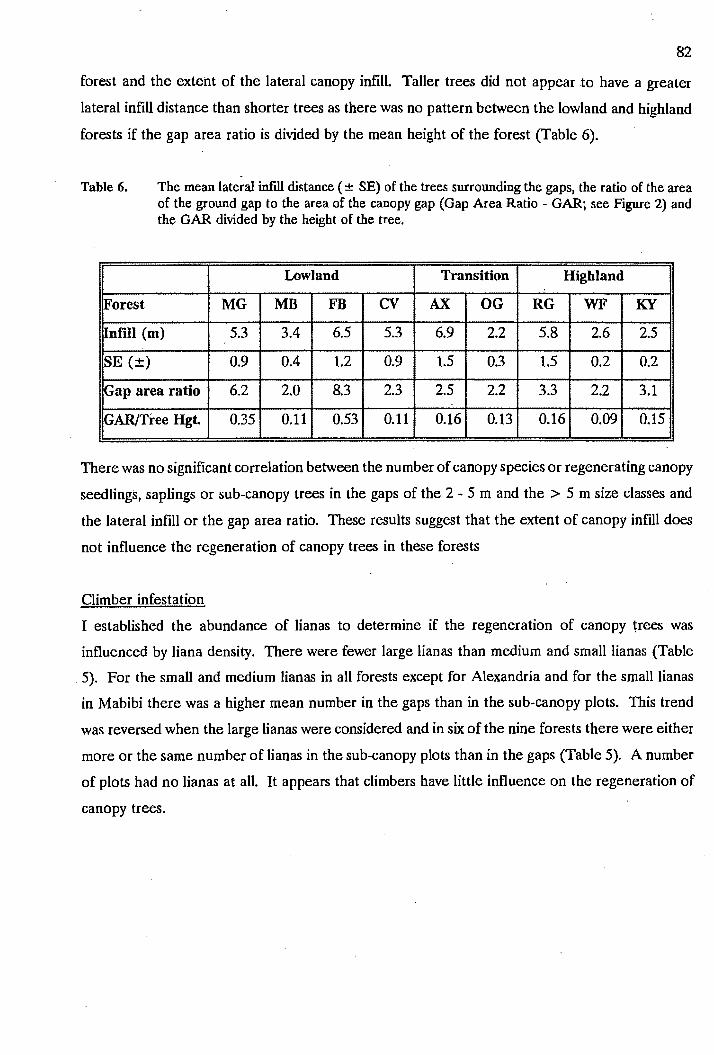
82
forest and the extent of the lateral canopy infill. Taller trees did not appear to have a greater
lateral infill distance than shorter trees as there was no pattern between the lowland and highland
forests if the gap area ratio is divided by the mean height of the forest (Table 6).
Table 6. The mean lateral infill distance ( ± SE) of the trees surrounding the gaps, the ratio of the area of the ground gap to the area of the canopy gap (Gap Area Ratio - GAR; see Figure 2) and the GAR divided by the height of the tree.
Lowland Transition Highland
Forest MG MB FB CV AX OG RG WF KY
Infill (m) 5.3 3.4 6.5 5.3 6.9 2.2 5.8 2.6 2.5
SE(±) 0.9 0.4 1.2 0.9 1.5 0.3 1.5 0.2 0.2
Gap area ratio 6.2 2.0 8.3 2.3 2.5 2.2 3.3 2.2 3.1
GAR/Tree Hgt. 0.35 0.11 0.53 0.11 0.16 0.13 0.16 0.09 0.15
There was no significant correlation between the number of canopy species or regenerating canopy
seedlings, saplings or sub-canopy trees in the gaps of the 2 - 5 m and the > 5 m size classes and
the lateral infill or the gap area ratio. These results suggest that the extent of canopy infill does
not influence the regeneration of canopy trees in these forests
Climber infestation
I established the abundance of Iianas to determine if the regeneration of canopy irees was
influenced by liana density. There were fewer large lianas than medium and small lianas (Table
5). For the small and medium lianas in all forests except for Alexandria and for the small lianas
in Mabibi there was a higher mean number in the gaps than in the sub-canopy plots. This trend
was reversed when the large lianas were considered and in six of the nine forests there were either
more or the same number of lianas in the sub-canopy plots than in the gaps (Table 5). A number
of plots had no lianas at all. It appears that climbers have little influence on the regeneration of
canopy trees.
--------- -----

Table 7.
Stem Site
< lcm Gap S-C
1-Scm G{lp S-C
>5cm Gap S-C
83
The weighted mean number of lianas in the gap and sub-canopy plots (S-C) of the different forests. HLM is the mean for the highland forests, TM is the mean for the transition forests and LLM is the mean for the lowland forests.
FOREST
MG MB FB CV LLM AX OG TM RG WF KY HLM
24.0 5.5 13.3 0.0 8.2 8.3 13.3 10.8 18 5.0 1.8 ~.3 7.8 7.7 o.o [).0 3.9 11.6 0.0 l5.8 0.0 0.0 1.2 [).4
11.3 7.5 8.3 8.3 8.9 3.3 13.8 8.6 11.7 28.0 13.8 14.5 5.8 4.8 p.O 3.2 4.7 10.8 l3.3 17.1 4.8 6.7 1.6 4.4
7.2 1.4 1.2 1.8 2.9 0.0 1.7 0.8 1.8 1.8 0.8 1.5 3.9 1.7 1.2 3.3 2.5 5.8 1.7 13.8 5.6 1.0 14 2.3
Discussion
The comparison of the patterns of regeneration of canopy trees between the lowland and the ., '
highland forests shows clear differences. Firstly, the highland forests are characterised by a greater
percentage of canopy species regenerating as seedlings and saplings than the lowlands (Table 2).
Secondly, at the sampling scale used in the study, lowland forests show great variability in. the
regeneration patterns of canopy seedlings between forests, while highland forests show greater
consistency of pattern (Fig. 3a). If the different size classes are taken to reflect the different ages
of individual plants, then variability in the success of establishment of canopy species over a time
period, can be seen. Under equilibrium conditions with consistent annual recruitment and
subsequent self thinning (Meyer 1952), there would be fewer canopy individuals as the plants get
larger. The highland forests display this pattern (Tables 2 & 3) suggesting a high degree of
predictability in the regeneration dynamics (see also Midgley et al. 1990). Recruitment of canopy
species in the lowland forests, on the other hand, appears to be episodic and with a low degree
of predictability. Thirdly, there are differences in the sites of canopy species regeneration between
highland and lowland forests. Sub-canopy plots are the main sites of canopy regeneration in the
highland forests, while treefall gaps appear to suppress much of this regeneration. In the lowland

84
forests, on the other hand, the gaps are the main sites of canopy regeneration with little canopy
regeneration in the sub-canopy plots.
Can the differences in regeneration dynamics between lowland and highland forests be explained
in terms of competitive interactions between different growth forms? The competitive dominance
of tree seedlings by perennial herbs and shrubs has been well documented (see Grime 1979;
Maguire and Forman 1983; Bond 1989). Different layers of the vegetation within a forest have
been shown to have a negative influence on the regeneration of forest plants with smaller stature
by shading (Veblen et al. 1977; Veblen 1979; Hibbs 1982).
Dealing first with the ground layer, its near absence in the lowland forests, suggests that the
shading effect of this layer provides little or no obstacle to the germination and establishment of
canopy tree seeds. The reasons for the low ground cover are not clear, but may be due to the
already dense shade provided by the sub-canopy layer of Drypetes and Cola spp. found in the sub
canopy. A second possibility is that much of the growth at this level is reduced by heavy browsing
of ungulates of which there was much evidence. Both False Bay and Cape Vidal are in fenced
reserve areas where browsing ungulate numbers are manipulated and have recently been high
(Personal communication with reserve staff). The dwarf antelopeNeotragus moschatus (Heinichen
1972) and other antelope (see Smithers 1983) are recorded as eating small forest plants in this
area.
The higher percentage of grass and fern ground cover in the highland forests, particularly in
Rainbow Gorge and Wesa Forest, do not appear to inhibit seedling regeneration of canopy species
significantly as evidenced by the high number of seedlings regenerating in the sub-canopy of the
highlands (Table 2). This result is surprising in the light of the work by Maguire and Forman
(1983) showing the negative impact of the herb layer on tree regeneration. The cover value does
not exceed 70% in this study which may be insufficient to suppress seedling regeneration. The
impact of Hana mats, through shading, on the regeneration of canopy species appears to be
minimal as they never cover more than a mean of 12 % of the gap ground area.
The lack of a significant correlation between the number of regenerating saplings or sub-canopy
trees and the infill distance or the gap area ratio for the forests suggests that shading effects of
the gap edge trees do not influence the regeneration of the canopy species (see Table 6). Hibbs
(1982), in a study on small canopy gaps showed a negative influence of lateral canopy growth on

85
tree reproduction in a hemlock-hardwood forest. However this situation differs from that
described by Hibbs (1982) where the size of the ga'ps concerned were much smaller. I have no
measure of the foliage density of individual tree species but suggest that it could play an important
role in altering the shade environment of the gap understory (cf. Horn 1971; Halle et al. 1978).
Lianas are frequently associated with gaps where they are found drooping from gap edge trees as
well as being concentrated within the gaps (Richards 1952; Putz 1984). In this study the tWo
smaller size classes of liana were more abundant in gaps than in the sub-canopy plots (Table 7).
The greater abundance of larger climbers in the sub-canopy plots is possibly a result of the poor
light conditions and the absence of trellises by which young lianas can reach the canopy (Putz
1984; see also Chapter 2 this thesis). In the gaps on the other hand there is a higher light level
as well as there being more trellises for young lianas to gain access to the canopy. I found no
association between liana abundance and reduced canopy species regeneration, suggesting that
they do not impact on southern African forests in this way. This is contrary to the commonly
published view that they negatively impact forests regeneration in tropical forests (Kochummen
1966; Fox 1968; Neil 1984).
Shading, due to the density of the understory, appears to provide the largest obstacle to the
establishment of canopy species in the forests considered here. In highland fores'ts the density of
the understory layer is greatly reduced in the sub-canopy relative to the gaps (Figs. 4 & 5). I
suggest that release from the suppressive effect of understory vegetation accounts for the
improved canopy regeneration in the sub-canopy. The significant negative correlation between
the number of canopy seedlings and the density of the understory as well as the percentage of
canopy species regenerating in the gaps of the forests and the density of the gap understory (Fig.
6) supports this argument. Community control of vegetation in this manner has been reported for
temperate Nothofagus forests in south-central Chile (Veblen 1979; Veblen et al~ 1977), where .the
regeneration of canopy trees is inhibited by the understory bamboo Chusquea tenuiflora, and
appears to be an important influence in the regeneration of the forests.
The mean density of the understory in lowland forests was double that of highland forests but little
regeneration of canopy species occurs in the understory of the lowland forests. How then do
canopy trees regenerate in the crowded gaps of the lowland forests? The answer is not clear and
more research is needed. However, in the light of observations made in the field I suggest a few
possible solutions.

86
If regeneration of the canopy species is dependent on the release from the suppressive competitive
effects of the understory this release could occur in a number of ways. Firstly, heterogeneity in
the density of the understory could provide less dense "gaps"· in this layer through which
regeneration of canopy species could occur. The results suggest that this is not the case. The
coefficient of variation of the density of the gap understory is lower in the lowlands than in the
highlands where the understory appears to inhibit regeneration. Further, heterogeneity in the
understory layer would not explain the episodic nature of the recruitment of canopy species in the
lowland forests.
Secondly, die back every seven to ten years of the semelparous dominant understory herb Isoglossa
woodii (Acanthaceae) (Ward 1980), could provide a temporary release of one to two years within
. which less vigourous or shade intolerant canopy species can establish. The establishment of tree
species in the die back period of semelparous bamboo of the genus Chusquea has been reported
for near timberline Nothofagus forests in Chile (Veblen 1979). Recruitment in this manner would
result in a pulsed regeneration pattern of canopy species in lowland forests such as is seen in
Table 3. The age of the seedlings in this study is not known but a prediction arising from this idea
is that there would be pulses of even aged cohorts of canopy species ·in the lowland forests,
correlated with the time of the last die back of I. woodii.
Thirdly, population eruptions by ungulates such as the nyala (TragelapJ:ius angasii) and other
antelope may result in large scale browsing of the understory. This could be partially responsible
for the episodic recruitment of canopy species in lowland forests. There were signs of recent
heavy browsing in the False Bay forests attributed to a recent nyala outbreak which could explain
the low density of the understory recorded there. The role of large mammals such as the elephant
may be particularly important in forests such as Alexandria where the understory is not
herbaceous, but a woody shrub Grewia occidentalis, which can become particularly dense.
Historical records (Skead 1980) suggest that elephant were common in the area of the Alexandria
forests and that they fed on the fruit and foliage of Grewia spp. In the last one hundred years
however, elephant numbers have declined substantially with no elephant being recorded in the
area for at least fifty years (Skead 1980). I suggest that the destructive effect of elephant walking
through treefall gaps and feeding on the dense growths of Grewia would have opened sufficient
space to allow the release of canopy seedlings, an event that has not happened in the recent past.
This would be consistent with regeneration failure of canopy dominants such as Podocarpus, Celtis
andErythrina species in this forest.

87
Conclusions
The southern African highland and lowland forest regions differ in their regeneration dynamics.
The importance of gaps for the regeneration of forest canopy tree species is recognised for the
lowland forests while highland forests regenerate predominantly in the sub-canopy.
While the ground layer appeared to have little impact on the regeneration of the canopy species
and evidence for the impact of the canopy lateral growth was inconclusive, the understory appears
to negatively influence the regeneration of canopy tree species. There is a negative correlation
between the density of the understory and the ability of the canopy species to regenerate. Thus
in the highland forests, canopy species regenerate more in the sub-canopy while regeneration is
weaker in the gaps. Lowland forests, on the other hand, experience particularly dense
understories which suppress canopy species regeneration in both the gaps and the sub-canopy.
They do however appear to experience periodic release from this condition allowing episodic
regeneration of forest trees in the treefall gaps. The impact of climbers on the regeneration of
canopy trees appears to be minimal.
There are a number of implications for the management of these forests. The highland forests
experience predictable and continuous regeneration of canopy trees in the sub-canopy regions
while regeneration is impeded in the treefall gaps. The felling of any tree, thus needs to take this
into account and to disturb the canopy as little as possible, minimizing the size of the canopy gap
that is formed. Secondly, attempts should be made to do as little damage to the advanced tree
regeneration as is practical to allow the closure of the canopy gap by these individuals. The results ·
of this study essentially agree with those of Geldenhuys and Maliepaard (1983).
In the lowland forests vertebrates could have an important impact on forest dynamics a) by
influencing the frequency and size of gaps and b) by influencing the density of the understory and
therefore its capacity to suppress canopy regeneration. The regeneration of forest trees is
dependent on the formation of gaps and any natural gap forming processes. The role of elephants
in toppling old or dead trees, may be essential for the functioning of the forest. However within
a gap the regeneration of canopy species is dependent on a reduction in the density of the
understory. This can be achieved by managing the density and nature of vertebrate herbivores as
well as events such as the die back of semelparous herbaceous vegetation. If large herbivores are
excluded, for example at Mangusi where the forest is fenced off, special compensatory
management may be needed to ensure the continual regeneration of canopy species. Clearly more
work is needed on these aspects of forest dynamics.

88
References
Brandani A, Hartshorn GS and Orians GH. 1988. Internal heterogeneity of gaps and tropical tree sp~cies richness. J. Tropical. Ecol. 4:99-119.
Breen CM. 1971. An account of the plant ecology of the dune forest at lake Sibayi. Trans. roy. Soc. S. Afr. 39:223-235.
Brokaw NVL. 1982. The definition of treefall gap and its effect on measures of forest dynamics. Biotropica 14:158-160.
Brokaw NVL. 1985. Gap-phase regeneration in tropical forest. Ecol. 66:682-687.
Bond WJ. 1989. The tortoise and the hare: ecology of angiosperm dominance and gymnosperm persistence. Biol. J. Lin. Soc. 36:227-249.
Canham CD. 1988a. Growth and canopy architecture of shade-tolerant trees: response to canopy gaps. Ecol. 69(3):786-795.
Canham CD. 1988b. An index for understory light levels in and around canopy gaps. Ecol. 69( 5): 1634-1638.
Connell JH. 1989. Some processes affecting the species composition in forest gaps. Ecol. 70:560-562.
Cooper KH. 1985. The conservation status of indigenous forests in Transvaal, Natal and O.F.S., south Africa. Wildlife Society of South Africa. Durban.
Denslow JS. 1980. Gap partitioning among tropical rainforest trees. Trc:i'pical Succession 47-55.
Denslow JS. 1987. Tropical rainforest gaps and tree species diversity. Ann. Rev. Ecol. Syst. 18:431-451.
Fox JED. 1968. Logging damage and the influence of climber cutting prior to logging in the lowland dipterocarp forest of Sabah. The Malayan Forester 31:326-347.
Garwood NC. 1983. Seed germination in a seasonal tropical forest in Panama: a community study. Ecol. Mono. 53(2):159-181.
Geldenhuys GC. 1989. Richness, composition and relationships of the floras of selected forests in southern Africa. In: Geldenhuys CG (Ed) Biogeography of the mixed evergreen forests of southern Africa Foundation for research development occasional report. No. 45. pp 208.
Geldenhuys CG and Maliepaard W. 1983. The causes and sizes of canopy gaps in the southern Cape forests. S. Afr. For. J. 124:50-55.
Gordon IG (Ed). 1989. Natal indigenous forests: A preliminary collection of reports on indigenous forests in Natal. Natal Parks Board Publication, Pietermaritzburg. 195 pp.

89
Grime JP. 1979. Plant strategies and vegetation processes. John Wiley & Sons. Chichester, England.
Grubb PJ. 1977. The maintenance of species-richness in plant communities the importance of the regeneration niche. Biol. Rev. Cambridge Philos. Soc. 52:107-145.
Halle F, Oldeman RAA and Tomlinson PB. 1978. Tropical trees and forests: An architectural analysis. Springer-Verlag, Hiedelberg, Germany.
Hartshorn GS. 1978. Treefalls and tropical dynamics pp 617-638. In: Tomlinson PB and Zimmermann MH (Eds). Tropical trees as living systems. Cambridge University Press, New York.
Heinichen IG. 1972. Preliminary notes on the suni Neotragus moschatus and red duiker Cephalophus natalensis. Zool. Afr. 7:157w165.
Hibbs DE. 1982. Gap dynamics in a hemlock-hardwood forest. Can. J. For. Res. 12:522-527.
Horn HS. 1971. The adaptive geometry of trees. Monographs in Population Biology Number 3. Princeton University Press, Princeton, New Jersey, USA.
Huntley BJ. 1965. A preliminary account of the Ngoye forest reserve, Zululand. J. S. Afr. Bot. 31:177-205.
Kochummen KM. 1966. Natural plant succession after farming in Sg. Krog. The Malayan Forester 29:170- 181.
Lang GE and Knight DH. 1983. Tree growth, mortality, recruitment, and canopy gap formation during a 10-year period in a tropical moist forest. Ecol. 64(5):1075-1080.
Lieberman M, Lieberman D and Peralta R. 1989. Forests are not just swiss cheese: canopy stereogeometry of non-gaps in tropical forests. Ecol. 70:550-552.
MacArthur RH and MacArthur JW. 1961. On bird species diversity. Ecol. 42:594-598.
MacDevette DR. 1989. The vegetation and conservation of the Zululand coastal dunes. In: Gordon IG. (Ed). Natal indigenous forests: A preliminary collection of reports on indigenous forests in Natal. Natal Parks Board Publication, Pietermaritzburg. 195 pp.
· MacDevette DR, MacDevette DK, Gordon IG and Bartholomew RLC. 1989. The floristics of the Natal indigenous forests. In: Gordon IG. (Ed). Natal indigenous forests: A preliminary collection of reports on indigenous forests in Natal. Natal Parks Board Publication, Pietermaritzburg. 195 pp.
Maguire DA and Forman RTR. 1983. Herb cover effects on tree seedling patterns in a mature hemlock-hardwood forest. EcoL 64:1367-1380.
Marker ME and Russell S. 1984. The application of biogeographical techniques to forest sitefactor analysis. South African Geographical Journal.· 66:65-78.

90
Meadows M and Linder HP. 1989. A reassessment of the biogeography and vegetation history of the southern Afromontane region. In: Geldenhuys GC (Ed) Biogeography of the mixed evergreen forests of southern Africa. Foundation for research development occasional report. No. 45. pp 208.
Meyer HA 1952. Structure, growth and grain in balanced uneven aged forests. J. For. 50:85-92.
Midgely J, Seydack A, Reynell D and McKelly D. 1990. Fine-grain pattern in southern Cape plateau forests. J. Veg. Sci. 1:539-546.
Moll EJ. 1972. The current status of mistbelt mixed podocarp forest in Natal. Bothalia 10:595-598.
Moll EJ. 1980. Terrestrial plant ecology. In: Bruton M and Cooper K. (Eds.) Studies on the ecology of Maputaland. Rhodes University and the Natal branch of the Wildlife society of southern Africa.
Neil PE. 1984. Climber problems in Solomon Islands forestry. Commonw. For. Rev. 63:27-34.
Phillips J. 1931. Forest succession and ecology in the Knysna region. Memoirs of the botanical survey of South Africa No.14.
Phillipson PB and Russell S. 1988. Phytogeography of the Alexandria forest (southeastern Cape province). Mono gr. Syst. Bot. Missouri Bot. Gard. 25:661-670.
Poulson TL and Platt WJ. 1989. Gap light regimes influence canopy tree diversity. Ecol. 70:553-555.
Putz FE. 1983. Treefall pits and mounds, buried seeds, and the importance of soil disturbance to pioneer trees on Barro Colorado Island, Panama. Ecol. 64(5):1069-1074:
Putz FE. 1984. The natural history of lianas on Barro Colorado Island, Panama. Ecology 65(6):1713-172:4.
Richards PW. 1952. The tropical rain forest. Cambridge University Press, Cambridge.
Runkle JR. 1982. Patterns of disturbance in some old-growth forests of eastern North America. Ecol. 63:1533-1546.
Runkle JR. 1985. Disturbance regimes in temperate forests. In: The ecology of natural disturbance and patch dynamics. Eds. Pickett STA and White PS. Academic Press Inc.
Schupp EW. 1988. Seed and early seedling predation in the forest understory and in treefall gaps. Oikos 51:71-78.
Skead DM. 1980. Historical mammal incidence in the Cape province. Cape Town, Department of Nature Conservation.
Skinner RHN. 1983. The mammals of the southern African subregion. University of Pretoria, Pretoria, South Africa.

91
Smith AP. 1973. Stratification of temperate and tropical forests. Am. Nat. 107:671-683
Swaine MD, Lieberman D and Putz FE. 1987. The dynamics of tree populations in tropical forest: a review. J. Tropical Ecol. 3:359-366.
Swaine MD and Whitmore TC. 1988. On the definition of ecological species groups in tropical rain forests. Vegetatio 75:81-86.
Turner IM and Newton AC. 1990. The initial responses of some tropical rain forest tree seedlings to a large gap environment. J. Appl. Ecol. 27:605-608.
Veblen TT, Ashton DH, Schlegel FM and Veblen AT. 1977. Distribution and dominance of species in the understory of a mixed evergreen-deciduous Nothofagus forest in south-central Chile. J. Ecol. 65:815-830.
Veblen IT.1979. Structure and dynamics of Nothofagus forests near timberline in south-central Chile. Ecol. 60:937-945.
Ward CJ. 1980. The plant ecology of the Isipingo beach area, Natal, South Africa. Memoirs of the Botanical Survey of South Africa No. 45. Botanical Research Institute. South Africa.
Watt AS. 1947. Pattern and process in the plant community. J. Ecol. 35:1-22.
Weisser PJ and Marques F. 1979. Gross vegetation changes in the dune area between Richards Bay and the Mfolozi river, 1937-1974. Bothalia. 12,4:711-721.
White F. 1978. The afromontane region. In: Wergner M.J.A. (Ed). Biogeography and ecology of southern Africa. W.Junk, The Hague, pp 436 - 513.
White F and Moll EJ. 1978. The Indian ocean coastal belt. In: Wergner M.J.A. (Ed). Biogeography and ecology of southern Africa. W. Junk, The Hague, pp 563 - 598.
White F. 1983. The vegetation map of Africa: a descriptive memoir to accompany the UNESCO/AETFAT/UNSO map of Africa. Natural resources Research 20, UNESCO, Paris 356 pp.
Whitmore TC. 1982. On pattern and process in forests, pp 45-59. In: Newman El. (Ed). The plant community as a working mechanism. Blackwell Scientific, Oxford.
Whitmore TC. 1989. Canopy gaps and two major groups of forest trees. Ecol. 70:536-538.

92
Chapter Six
Conclusion
In this study I set out to answer two questions. Firstly, what limits the abundance of climbers and
why? Secondly, do climbers influence the regeneration of forest trees? My intention in this
chapter is to consider the extent to which I have answered these questions and to consider
beneficial directions for future research to follow.
What limits the abundance of climbers and why?
I show that there is variation in the abundance of climbers over a soil nutrient gradient. Under
standardised light conditions there is a positive correlation between climber abundance and the
potassium concentration and the S - value of the soil, but not the nitrogen concentration. There
is thus no positive correlation between all soil nutrients and climber abundance suggesting that
there is no causative relationship between them. The positive results may merely be reflecting the
altitudinal gradient. There is also little difference between the growth response of climbers and
trees to increased nutrient availability. I thus question the link between climber abundance and
soil nutrient status.
Instead I suggest that the role of tree canopy architecture and trellis availability, may be important
in determining the distribution and abundance of climbers. As few climbers enter their host trees
via the trunk, tall trees with high canopies tend to avoid climber occupation except for those that
enter the tree canopy horizontally from neighbouring trees. Also, trees with lower canopies have
more climbers which enter the canopy vertically via available trellises. There is thus a positive
correlation between aspects of tree canopy architecture and climber abundance. The role of
trellises is highlighted by the apparent facilitatory role whereby the presence of one climber
species enhances the chances of another species gaining access to the canopy of a host tree. I
suggest that climber abundance and distribution may be controlled by interactions between the
tree and climber growth forms rather than by the abiotic environment. This idea needs to be
tested over a wider range of forests, while further attention needs to be paid to the relationship
between climber abundance and specific soil nutrient levels e.g. potassium. An interesting study
would be to determine the relationship, if any, between the availability of trellises (tree
architecture) and soil nutrient levels.

93
Climbers differ from trees in that they fail to allocate resources to the formation of a rigid woody
support. In this study I show that they possibly also differ in aspects of their physiology related
to carbon gain, although these differences are smalL I present contradictory evidence which
suggests that climbers may be able to photosynthesize at higher rates than trees while other
evidence indicates that there are no differences between the maximum photosynthetic rates of the
two growth forms. There appears to be minimal difference in water use efficiency between trees
and climbers. Clear increases in the carbon gain capacity of climbers compared with trees would
support the argument that climbers are reliant on high nutrient levels to be competitive. While
evidence presented here suggest that climbers may have a higher carbon gain capacity than trees
the difference appears to be small and insufficient to justify the apparent association between
climbers and high soil nutrient levels. This further supports the earlier questioning of the
relationship. The implications of these differences for the ecology of climbers, are that climber
distribution and abundance may be independent of soil nutrients. Further studies that consider
both the carbon allocation patterns and the carbon gain mechanisms of trees and their hosts in
the wild as well as their growth phenologies will greatly enhance our understanding of climber
ecology. Such understanding will be of use to both tropical foresters concerned with the
regeneration of logged trees as well as to conservationists concerned with the invasive ability of
exotic climbers.
Do climbers influence the regeneration of forest trees?
Contrary to widely documented reports that climbers In tropical forests swamp gaps and
disturbances in a forest canopy and inhibit the regrowth of canopy tree species, little evidence of
this was found in southern Africa. I suggest that the climber growth form does not influence the
dynamics of forests at the level of seedling and sapling regeneration. Instead the impact of other
vegetation layers, such as the herbaceous and shrub understory layer, play an important role in
influencing the regeneration of canopy trees after a treefall. This is apparent in highland forests
where canopy species tend to regenerate below intact canopies where the density of the
understory is low compared with the gaps. There are implications of this for lowland forests where
the understory density is on average double that in highland forests. Many canopy species in
lowland forests are shade intolerant and are dependent on gaps to regenerate. However they are
also dependent on disturbance to the understory layer to release them from the suppressive
influence of the dense understory. I suggest this release can occur through natural processes such
as die back of the semelparous acanthaceous herbs, but can also occur through the effects of
browsing by large ungulates. Management of browsing pressure on the understory may provide

94
the necessary release for seedlings of canopy species to establish and to ensure the regeneration
of canopy trees in these forests.
Observation in the field suggests that the largest impact of lianas is by inducing early adult
mortality of the host trees, through shading, and thus increasing gap formation rates. I suggest
that in lowland forests where herbivores are prevented from providing the release that canopy
· seedlings need to regenerate, and where lianas are maintaining high adult mortality rates, the
forest dynamics may alter to the extent where there is virtually no replacement of canopy trees
leading to the gradual stagnation and collapse of the forest ecosystem. Further research needs
to focus on the dynamics of the understory layer in southern African forests and the interaction
between this layer and both large herbivores and regenerating canopy seedlings. The role of
climbers (particularly lianas) needs to be investigated particularly at the level of inducing adult tree
mortality.