ASPECTS OF ORGANISATIONAL BUYING BEHAVIOUR IN THE … · ASPECTS OF ORGANISATIONAL BUYING BEHAVIOUR...
243
ASPECTS OF ORGANISATIONAL BUYING BEHAVIOUR IN THE SOUTH AFRICAN LEATHER INDUSTRY (DYESTUFFS AND CHEMICALS) BY DIRK OTTO SCHMIDT submitted in fulfilment of the requirements for the degree of MASTER OF COMMERCE in the subject of BUSINESS ECONOMICS at the UNIVERSITY OF SOUTH AFRICA PROMOTER: RICHARD MACHADO June 1994
Transcript of ASPECTS OF ORGANISATIONAL BUYING BEHAVIOUR IN THE … · ASPECTS OF ORGANISATIONAL BUYING BEHAVIOUR...
ASPECTS OF ORGANISATIONAL BUYING BEHAVIOUR
IN THE SOUTH AFRICAN LEATHER INDUSTRY
(DYESTUFFS AND CHEMICALS)
BY
DIRK OTTO SCHMIDT
submitted in fulfilment
of the requirements for
the degree of
MASTER OF COMMERCE
in the subject of
BUSINESS ECONOMICS
at the
UNIVERSITY OF SOUTH AFRICA
PROMOTER: RICHARD MACHADO
June 1994
• v .• ~ ~ .
i
I express my sincere thanks and gratitude to the following
persons:
o My promoter, Richard Machado, for the valuable
assistance, guidance and encouragement which he has given
me. The final product owes much to his constructive
criticisms, suggestions, and motivation.
o My wife, Sonja, for her support, love and understanding.
Thank you for the sacrifices and assistance over the
years 8 it is greatly appreciated. I love you.
o My parents for their support and motivation.
o The typist, Mrs Eileen van den Heever, for her patience
and perseverance.
o The editor, Ms Suzette Plantema for her invaluable
assistance and patience.
o Finally the Lord, for the strength and encouragement he
has provided.
CONTENTS
PAGE
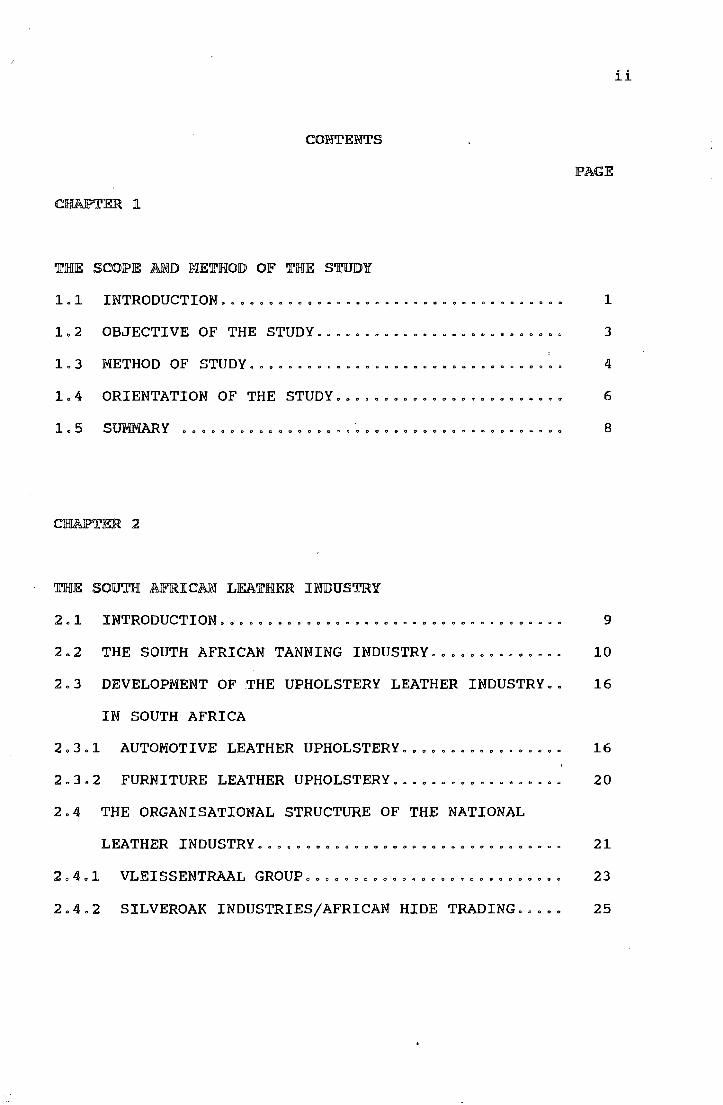
THE SCOPE MID WETJHIOID OF THE STUDY
1.1 INTRODUCTION ..........•................••....... 1
1o2 OBJECTIVE OF THE STUDY.......................... 3
1 . 3 METHOD OF STUDY . . . . . . . . . . . • . . . . . . . • . . . . . . . . . . . . . 4
lo4 ORIENTATION OF THE STUDY........................ 6
1 0 5 SUlVIMARY 0 0 0 0 0 0 0 0 0 0 .g .. 0 0 0 0 0 0 0 0 0 0 0 0 0 0 0 0 0 0 0 0 0 0 D 0 0 0 0 0 8
CJHIAPTEJR 2
TEE SOUTJHl AFRICAW LEATHER IJNIDUSTRY
2. 1 INTRODUCTION. . . . . . . . . • • • • . . . . • . . . . • . . . . . . . . . . . . . 9
2.2 THE SOUTH AFRICAN TANNING INDUSTRY.............. 10
2.3 DEVELOPMENT OF THE UPHOLSTERY LEATHER INDUSTRY.. 16
IN SOUTH AFRICA
2.3.1 AUTOMOTIVE LEATHER UPHOLSTERY................. 16
2.3.2 FURNITURE LEATHER UPHOLSTERY.................. 20
2.4 THE ORGANISATIONAL STRUCTURE OF THE NATIONAL
LEATHER INDUSTRY .......••...... o o o ... o . . . . . . . . . . 21
2 o 4 o 1 VLEISSENTRAAL GROUP ... o . o • o ..... o ••.... o o . . . . . 2 3
2.4o2 SILVEROAK INDUSTRIES/AFRICAN HIDE TRADING..... 25
ii

"7:' •
iii
PAGE
2 • 4 . 3 FOODCORP. . . . . . . . . . . . . . . . . . . . . . . . . . . . . . . . . . . . . . 2 6
2.4.4 IMPERIAL COLD STORAGE .................••.... ~. 27
2. 4. 5 FUTURA GROUP. . . . . . . . . . . . . . . . . . . . • . . . . . . . . . . . . . 27
2.4.6 INDEPENDENT TANNERIES......................... 28
2 o 5 SUMMARY o o o o o ... o o o o o o o o o o o o o o o o o • o o o o o o o Q o o (I o • o (II o 3 3
ORGANISATIONAL BUYING BEHAVIOUR
3 . 1 INTRODUCTION. . . . . . . . . . . • • . . . . . . . . . . . . . . . . . . • . . . . . 3 5
3.2 ORGANISATIONAL BUYING MOTIVES.................... 36
3.2.1 RATIONAL MOTIVES............................... 36
3 • 2 . 2 EMOTIONAL MOTIVES. . . . . • . . . . . . . . . . • . . . . . . . . . • . . . 3 8
3.3 THE ORGANISATIONAL BUYING PROCESS................ 39
3. 4 BUYING SITUATIONS. . . . . . . . . . . • . . . . . . . . . . . . . . . . . . . . 4 5
3.4.1 NEW TASK PURCHASE.............................. 45
3.4.2 MODIFIED REBUY SITUATION....................... 46
3.4.3 STRAIGHT REBUY SITUATION....................... 47
3.5 THE ORGANISATIONAL BUYING CENTRE................. 47
3 o 5o 1 USERS o o o o o t:l o • o o o o o o o o o o o o o o o o o o o o o o o o o o o o o o o o o o 4 9
3 • 5 . 2 INFLUENCERS . . • • . . . . . . . . . . . . . . . . . • . . . . • . . . . • • . . . 4 9
3 o 5o 3 BUYERS: o o o o o o o o o o o o o o o o o o o o o o o a o o o o o o o o o o o o o o o o 4 9
iv
lPAGE
J o 5o 4 DECIDERS o o o o o o o o o o o o o o o o o o a o o o o o o o g o o o o o o o o o a o o 5 Q
3 • 5. 5 GATEKEEPERS. . . . . . . . . . . . . . . • . . . . . . . . . • . . . . . . . . . . 51
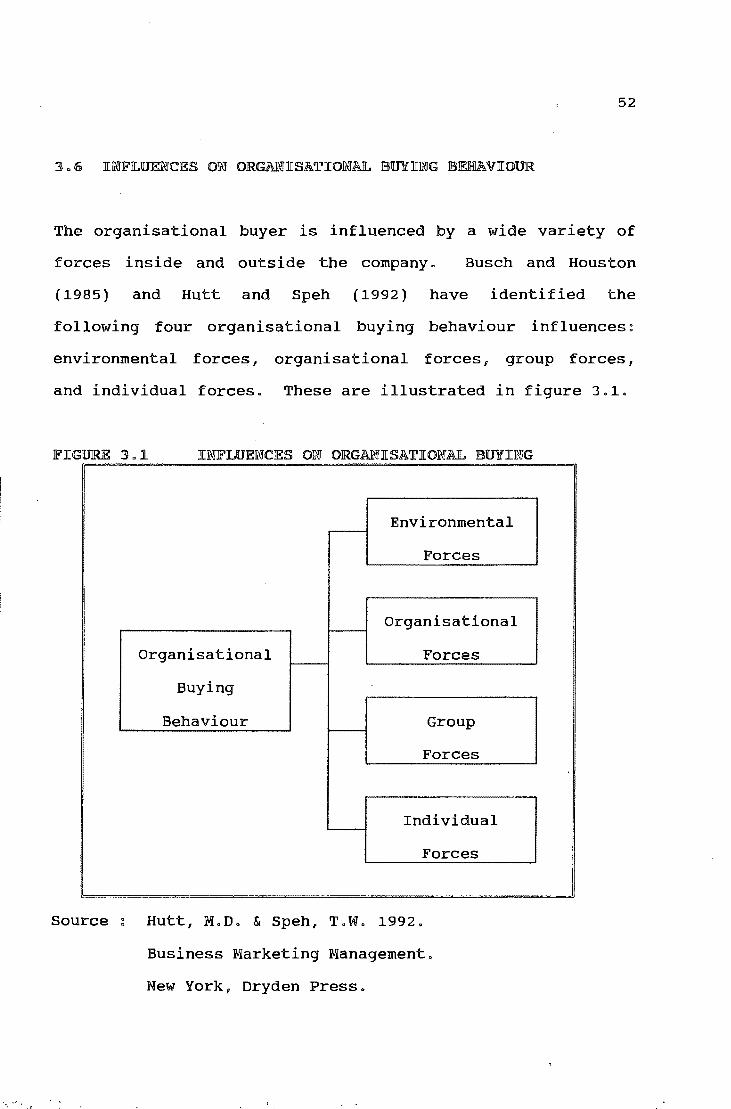
3.6 INFLUENCES ON ORGANISATIONAL BUYING.............. 52
3.6.1 ENVIRONMENTAL FORCES........................... 53
3.6.2 ORGANISATIONAL FORCES.......................... 55
3 . 6. 3 GROUP FORCES ....................•.. o o • • • • • • • • • • 57
3. 6. 4 INDIVIDUAL FORCES. . • . . . . . . . • . . . . . • . . . . . . . . . . . . . 58
3.7 MODELS OF ORGANISATIONAL BUYING BEHAVIOUR........ 61
3. 7. 1 THE BUY GRID MODEL. . . . . . . . . . . . . • . . . . . . . . . . . . . . . 61
3.7.2 THE ORGANISATIONAL BUYING BEHAVIOUR MODEL...... 66
3.7.3 THE INDUSTRIAL MARKET RESPONSE MODEL........... 70
3.7.4 THE INDUSTRIAL BUYER BEHAVIOUR MODEL........... 72
3 o 8 SUMJ.VIARY o o o o o o o o • o o o o o o o o o o o o o o ., o o o o ., o o. o o o o o ., ., o o o o 7 6
RESEARCH WETHODOLOGY
4ol INTRODUCTIONo o o o o o o o o o o o o o o o o o o o o o o o o o o o o o o o o o o o o 79
4. 2 SECONDARY RESEARCH. . . . . . . . . . . . . . . . • . . . . . . • • . . . . . . 80
4. 3 PRIMARY RESEARCH. . • . . . . . . • • . . . . . . . . . . . . . . . . . . . . . . 8 2
4. 3.1 THE SCOPE OF THE STUDY. . . . . . • . . . . . . . . . . • • . . . . . . 89
4.3.2 CHARACTERISTICS OF THE UNIVERSE................ 89
v
PAGE
4.3.3 DATA COLLECTION METHODS........................ 90
4 . 3 . 3 . 1 PERSONAL INTERVIEWS .................... .; . . . . . 91
4. 3 . 3. 2 MAIL QUESTIONNAIRE. . . . . . . . . . . . . . . . . . . . . . . . . . . 9 2
4.3.3.3 TELEPHONE QUESTIONNAIRE...................... 93
4.4 QUESTIONNAIRE DESIGNooooooooooooooooooooooooooooo 95
4.4.1 TYPES OF QUESTIONSooooooooooooooooooooooooooooo 98
4 . 5 COVERING LETTER. . . . . . . . . . . . . . . . . . . . . . . . . . . . . . . . . . 10 4
4.6 METHODOLOGICAL LIMITATIONS ....................... 104
4o6o1 NON RESPONSE BIASoooooooooooooooooooooooooooooo 106
4.6.2 AFFINITY BIASoooooooooooooooooooooo~ooooooooooo 107
4.6.3 TIME PRESSURE AND FATIGUE BIAS ................. 108
4.6.4 COURTESY BIAS.................................. 108
4.6.5 PRESTIGE SEEKING AND SOCIAL DESIRABILITY BIAS .• 109
4.6.6 SAMPLING BIAS .............................•. -... 109
4 • 6 . 6 INTERVIEWER BIAS. . . . . . . . . . . . . . . . . . . . . . . . . . . . . . . 110
4 o 7 SUMMA.RY o o o o o o o o o o o o o o o o o o o o o o o o o o o o o o o o o o o o o o o o o o 110
_., '

vi
PAGE
5.1 INTRODUCTION..................................... 112
5.2 RESEARCH DATA.................................... 114
5.2.1 PURCHASING DECISIONS ........................... 114
5.2.2 ENVIRONMENTAL AND ECONOMIC CONSIDERATIONS ...... 128
5. 2. 3 COMPANY ORIENTATION. . . . . . • . . . . . . . . . . • . . . . • . . . . . 140
5.2.4 PRODUCT INFORMATION SOURCES AND SELECTION
CRITERIA .................................•..... 147
5.2.5 JOINT DECISION MAKING AND PRODUCT/SUPPLIER
LOYALTY o o o o o o o o o o o o o o o o o o o o o o o o o o o o o o o o o o o o o o o o 15 4
5.2.6 DEMOGRAPHIC INDICATIONS ........................ 160
5 o 3 SUMMARY o o o o o o o a. o o o o o o o o o o o o o o o o o o o o o o o o o o o o o o o o o o 16 7
COWCLUSIOWS AN~ RECOWMEW~ATIOWS
6. 1 INTRODUCTION. . . . . . . . . . . . . . . . . . . . . . . . . . . . . . . . . . . . . 171
6.2 SUMMARY OF MAIN FINDINGS AND INTERPRETATIONS ..... 173
6.3 CONCLUSIONS IN TERMS OF STATED OBJECTIVES ........ 196

vii
JPAGE
6o4 AREAS FOR FUTURE RESEARCHoooooooooooooooooooooooo 200
6o5 CONCLUSIONo o o o o o o o o o o o o o o o o o o o o o o o o o o o o o o o o o o o ,0 o o 201
APPENDIX A BIBLIOGRAPHY o o o o o o o o o o o o o o o o o o o o o o o 202
APPENDIX B QUESTIONNAIRE o o o o o o o o o o o o o o o o o o o o o o 209
APPENDIX c COVERING LETTER o o o o o o • o o o o o o o o o o o o o 221
APPENDIX D PRETESTING OF QUESTIONNAIREoooooooo 223
APPENDIX E INTERVIEWSo o o o o o o o o o o o o o o o o o o o o o o o o 225

FIGURE 2.1
FIGURE 3.1
FIGURE 3.2
FIGURE 3.3
FIGURE 3.4
FIGURE 3.5
FIGURE 3.6
FIGURE 5.1
LJCS'I' OJEi' JEi'J[Gli.JJRES
GEOGRAPHICAL LOCATIONS OF TANNERIES .....
INFLUENCES ON ORGANISATIONAL BUYING ....•
ENVIRONMENTAL INFLUENCES ON
ORGANISATIONAL BUYING ....•......•......
THE ROBINSON, FARIS & WIND BUY GRID
r.qo DEL o o o o o o o o o o o o o o a o o o o o a o o o o o o o o o o a o o
THE WEBSTER AND WIND ORGANISATIONAL
viii
PAGE
32
52
53
64
BUYING MODEL . . . . . . . . . . . . . . . . . . . . . . . . . . . 6 7
THE CHOFFRAY AND LILIEN INDUSTRIAL
MARKET RESPONSE MODEL................. 71
THE SHETH INDUSTRIAL BUYING BEHAVIOUR'
MODEL o o a o o o o a o a o o o o o o o a a o o a o o o o o o o o o a o 7 3
RESPONDENTS INVOLVED IN THE DECISION
MAKING PROCESS .....•........• o o ••• o ••• 115
. ...
FIGURE 5.2
FIGURE 5.3
FIGURE 5.4
FIGURE 5.5
FIGURE 5.6
FIGURE 5.7
FIGURE 5.8
FIGURE 5.9
JPAGE
AUTONOMOUS AND JOINT DECISION MAKERS ... 116
DEPARTMENTAL APPROVAL REQUIRED FOR
PURCHASE DECISIONS .................... 117
POSITION OF INDIVIDUALS WHOSE APPROVAL
IS REQUIRED 118
THE MEMBER 1 S ROLE IN THE PURCHASING
DECISION o o o o o o o o o o o o o o o o o o o o o o o o o o o o o o 12 0
THE RESPONSIBILITY OF RESPONDENTS IN
THE EVENT OF THE SELECTED PRODUCTS NOT
PERFORMING TO EXPECTATIONS ..•.......•.. 121
REASONS RESPONDENTS WOULD NOT BE HELD
RESPONSIBLE FOR NON PERFORMANCE ........ 122
REASONS RESPONDENTS WOULD BE HELD
RESPONSIBLE FOR NON PERFO~ffiNCE ........ 123
RESPONDENTS UNDER TIME PRESSURE ........ 124
ix
JP.AGE
FIGURE 5o10: HOW TIME PRESSURE AFFECTS RESPONDENTS
DECISION o o o o o o o o o o o o o o o o o . o o o o o o o o . o o o 125
FIGURE 5o11: ACTIONS TAKEN BY RESPONDENTS WHEN
DISSATISFIED WITH DYESTUFF AND
CHEMICAL PURCHASESooooooooooooooooooooo 126
FIGURE 5o12: NUMBER OF TANNERIES THAT HAVE BECOME
ENVIRONMENTALLY FRIENDLY SINCE 199looooo 129
FIGURE 5o13: ALTERNATIVES USED BY ENVIRONMENTAL
CONSCIOUS TANNERIES 00000000000000000000 130
FIGURE 5o14: REASONS TANNERIES HAVE NOT BECOME
ENVIRONMENTALLY CONSCIOUS o.oooooooooooo 131
FIGURE 5o15: ENVIRONMENTAL CONSIDERATIONS INFLUENCING
RESPONDENTS PURCHASING CRITERIA OF
DYESTUFFS OR CHEMICALSoooooooooooooooo•o 132
FIGURE 5o16: LABOUR TURNOUT DURING THE AUGUST 1992
STAY AWAY ACTION ooooooooooooooooooooooo 133
X

~: ,.,...
PAGE
FIGURE 5o17~ THE EFFECT OF THE LIFTING OF SANCTIONS
ON SOUTH AFRICAN TANNERIES 135
FIGURE 5o18~ BENEFITS OF THE PARTIAL LIFTING OF
ECONOMIC SANCTIONS 000000000000000000000 136
FIGURE 5o19~ COUNTRIES EXPORTED TO BY SOUTH AFRICAN
TANNERIES 137
FIGURE 5o20~ TANNERIES EXPORTING PRIOR TO THE LIFTING
OF ECONOMIC SANCTIONS 000000000000000000 138
FIGURE 5o21~ STAGE OF PRODUCTION OF EXPORTS 000000000 139
FIGURE 5o22~ AFFILIATED TANNERIES BELONGING TO ONE
GROUP o o o o o o o o o o o o o o o o o o o o o o o o o o o o o o o o o o 141
FIGURE 5o23: THE BUYING DEPARTMENT'S POSITION IN THE
ORGANISATION o o o o o o o o o o o o o o o o o o o o o o o o o o o 142
FIGURE 5o24~ TANNERIES WITH AN ESTABLISHED PURCHASING
POLICY 000000000000000000000000000000000 143
xi

xii
PAGE
FIGURE 5o25: RATING OF DEGREE OF FORMALISATON OF THE
TANNERY'S PURCHASING POLICY •o•ooooooo•o 144
FIGURE 5.26: PERSONNEL ORIENTATION IN SOUTH AFRICAN
TANNERIES 147
FIGURE 5o27: INFORMATION SEARCH DURING A NEW PRODUCT
DEC I S I 0 N o o o o o o o ., o o o o o o o o o o o o o o o o o o o o o o o 14 8
FIGURE 5o28: INFORMATION SOURCES CONSULTED oooooooo•o 149
FIGURE 5.29: PRODUCT CRITERIA OF THE PRODUCTION
DEPARTMENT o o o o o o o o . o o o o o o o o o o o o o o o o •• o o 154
FIGURE 5o30: LEVEL OF AGREEMENT DURING JOINT DECISION
MAKING 155
FIGURE 5o31: CONFLICT RESOLUTION DURING JOINT DECISION
MAKING o o o o o o o o o o o o o o o o o o o o o o o o o o o o o o o o o 15 7
FIGURE 5o32: LOYALTY TO ESTABLISHED SUPPLIERS AND
THEIR PRODUCTS o •••••• o o o o o o o o. o •• o o o o o o 157

xiii
Jl>AGE
FIGURE 5.33: NEW PROCESS DEVELOPMENT INVOLVING A NEW
PRODUCT o o o o o o o o o o o o o o o o o o o o o o o o o o o o ~~~ o o o o 15 9
FIGURE 5.34: THE NUMBER OF YEARS RESPONDENTS HAD BEEN
ASSOCIATED WITH THE LEATHER INDUSTRY ••.. 161
FIGURE 5.35: NUMBER OF YEARS RESPONDENTS HAD BEEN
EMPLOYED BY THEIR PRESENT COMPANY 162
FIGURE 5.36: RESPONDENTS WITH SPECIALISED LEATHER
QUALIFICATIONS .•.. o o ••• o o o •••••• o o. • • • • • 163
FIGURE 5.37: SPECIALISED LEATHER QUALIFICATIONS OF
RESPONDENTS 164
FIGURE 5.38: RESPONDENTS PARTICIPATING IN SPORT 166
FIGURE 5.39: RESPONDENTS WITH HOBBIES 0 0 0 0 0 0 0 0 0 0 0 0 0 0 0 0 166
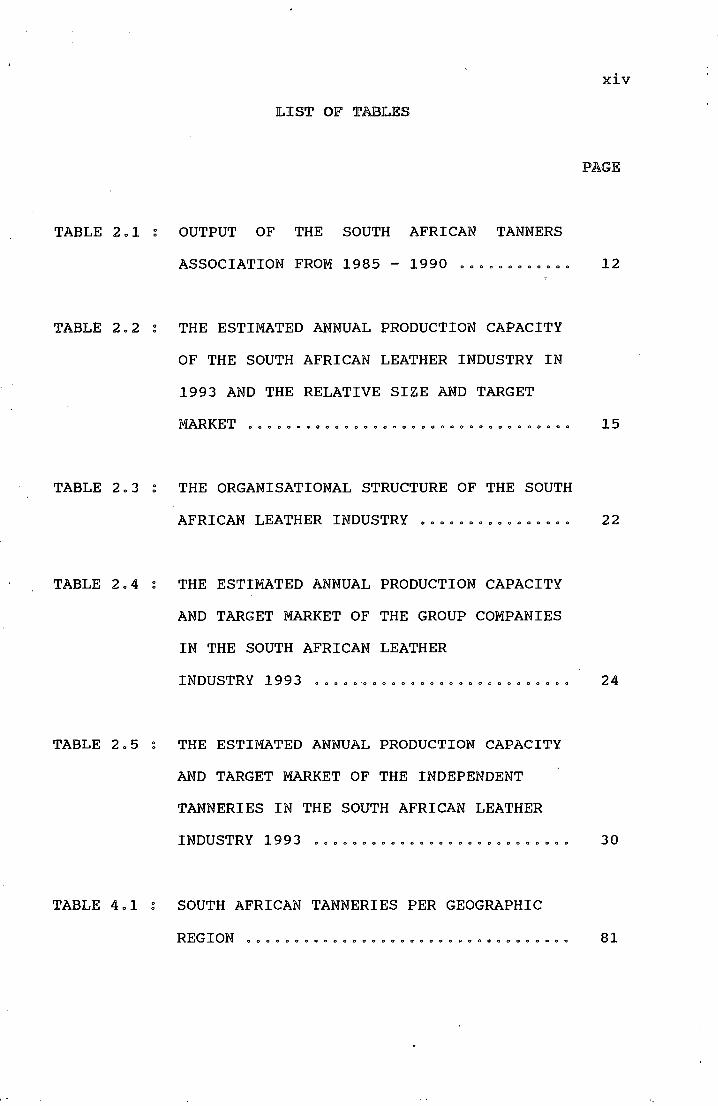
TABLE 2.1
TABLE 2.2
TABLE 2.3
TABLE 2.4
TABLE 2.5
TABLE 4.1
LIST OF TABLES
OUTPUT OF THE SOUTH AFRICAN TANNERS
ASSOCIATION FROM 1985 - 1990
THE ESTIMATED ANNUAL PRODUCTION CAPACITY
OF THE SOUTH AFRICAN LEATHER INDUSTRY IN
1993 AND THE RELATIVE SIZE AND TARGET
xiv
lPAGE
12
MARKET o o o o o o o o o o o o o o o o o o o o o o o o o o o o o o o o o o 15
THE ORGANISATIONAL STRUCTURE OF THE SOUTH
AFRICAN LEATHER INDUSTRY •.....•...•..... 22
THE ESTIMATED ANNUAL PRODUCTION CAPACITY
AND TARGET MARKET OF THE GROUP COMPANIES
IN THE SOUTH AFRICAN LEATHER
INDUSTRY 1993 ooooo·oooooooooooooooooooooo 24
THE ESTIMATED ANNUAL PRODUCTION CAPACITY
AND TARGET MARKET OF THE INDEPENDENT
TANNERIES IN THE SOUTH AFRICAN LEATHER
INDUSTRY 1993 ....•.•.............•...... 30
SOUTH AFRICAN TANNERIES PER GEOGRAPHIC
REG I ON o o o o o o o o o o o o o o o o o o o o o o o o o o o o o o o o o o 81

XV
PAGE
TABLE ·4.2 THREE TYPES OF PRIMARY RESEARCH o o o o • o .• o o 83
TABLE 4.3 : TELEPHONE QUESTIONNAIRE - QUESTION
CATEGORY o o o o o o o o o o o o o o o o o o o o o o o o o o o o o o o o 102
TABLE 5o1 AUTONOMOUS AND JOINT DECISION SITUATIONS. 127
TABLE 5.2 NUMBER OF EMPLOYEES IN SOUTH AFRICAN
TANNERIES 145
TABLE 5.3 SELECTION CRITERIA FOR SPECIALISED
CHEMICALS 150
TABLE 5.4 ~ SELECTION CRITERIA FOR DYESTUFFS ..•.••.• 151
TABLE 5.5
TABLE 5.6
SELECTION CRITERIA FOR DYESTUFFS AND
SPECIALISED CHEMICALS ••••••o••o••••••··· 152
ANNUAL FINANCIAL PACKAGE 165

xvi
Knowledge of the many influences that affect purchasing
preferences is important for marketers o Apart from the
technical and economic factors of importance, non- economic
factors are also significanto The latter have sociological
and psychological bases o Organisational buying behaviour
models attempt to provide a comprehensive scenario of these
factors that in combination, help to explain buyer
behaviouro
Sheth 0 s model of industrial buying behaviour presents many
of the factors that influence the organisational buying
process and describes the complexity of decision making o
These relationships are reflected in an integrated
frameworko Sheth's model is not intended to be definitive,
it does, however, offer a framework that systematically
presents the factors that influence organisational buying
behaviouro This study shows that the Sheth ~odel of
industrial buying behaviour can be applied in the South
African leather industry, and that valuable information can
be obtained when the model is appliedo
1
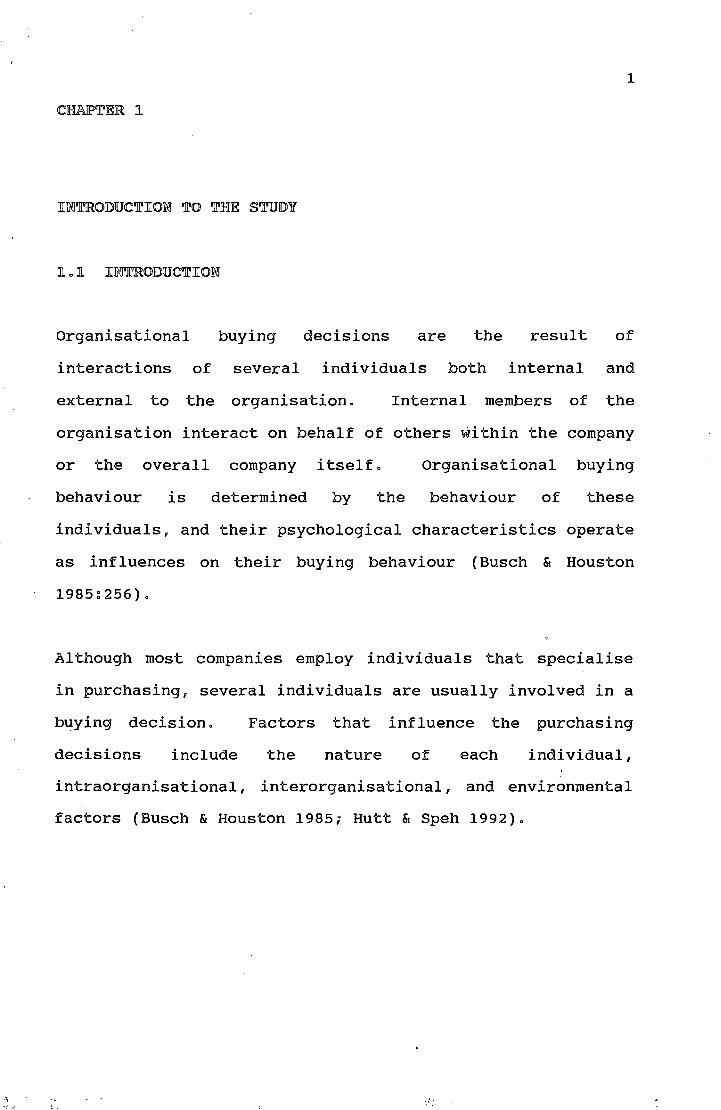
IOOTRODUCTIOOO TO THE STUDY
1.1 IOOTRODUCTIOOO
Organisational buying decisions are the result of
interactions of several individuals both internal and
external to the organisation. Internal members of the
organisation interact on behalf of others within the company
or the overall company itself. Organisational buying
behaviour is determined by the behaviour of these
individuals, and their psychological characteristics operate
as influences on their buying behaviour (Busch & Houston
1985~256).
Although most companies employ individuals that specialise
in purchasing, several individuals are usually involved in a
buying decision. Factors that influence the purchasing
decisions include the nature of each individual,
intraorganisational, interorganisational, and environmental
factors (Busch & Houston 1985; Hutt & Speh 1992).
·.:·

. .,.
2
The organisational buying process follows the same phases as
those found in consumer behaviour. These include problem
recognition, internal search, external search, information
receipt, decision and post decision. The nature of each
phase, however, differs. Organisational buyers tend to use
more objective evaluative · criteria, personal sources of
information, and engage in more active information searches.
They may use reciprocity as a basis for supplier and product
selection (Busch & Houston 1985).
Organisational purchasing procedures can be placed into one
of three categories. Depending on the extensiveness of the
process, the purchase can be classified as a straight rebuy,
modified rebuy, or a new task buying situation. These will
be discussed in Chapter 3. The three buying situations
establish the basic purchasing pattern of the individuals
involved in the decision-making process (Eckles 1990; Hutt &
Speh 1992).
Models of organisational buying behaviour attempt to provide
an integrated and comprehensive scenario of the major
factors that combine to explain buyer behaviour (Morris
1988). The models describe many of the factors involved in
organisational buying and indicate the complexity of the
decision-making process. These integrated relationships
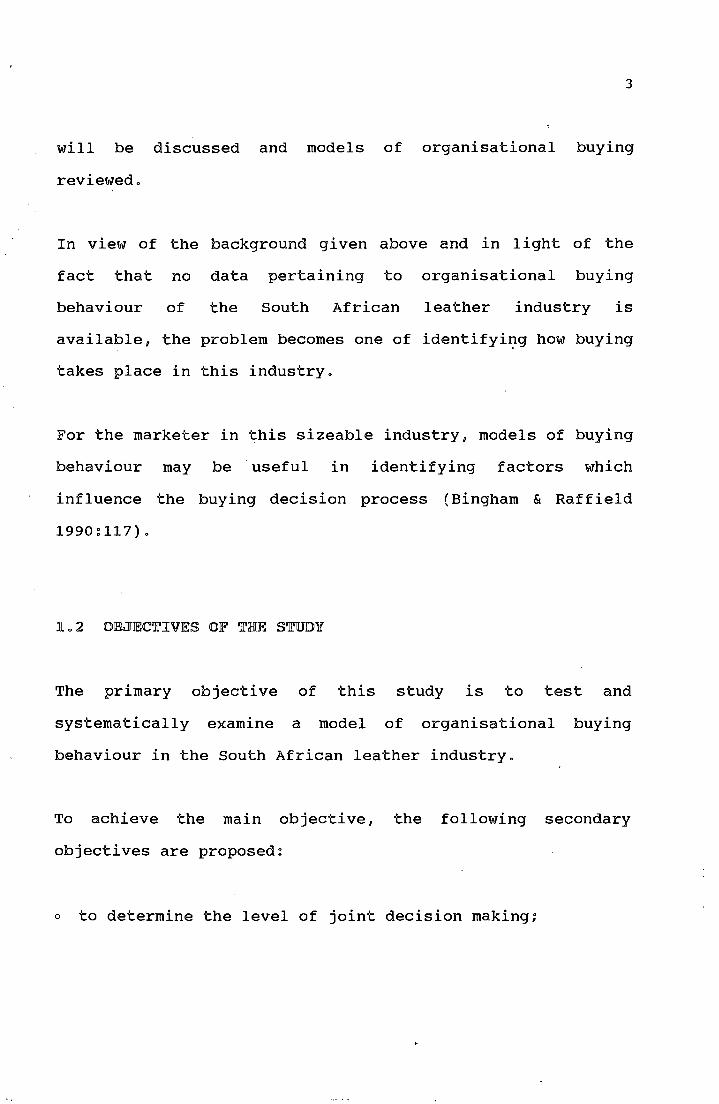
3
will be discussed and models of organisational buying
reviewedo
In view of the background given above and in light of the
fact that no data pertaining to organisational buying
behaviour of the South African leather industry is
available 1 the problem becomes one of identifyi~g how buying
takes place in this industryo
For the marketer in this sizeable industry 1 models of buying
behaviour may be useful in identifying factors which
influence the buying decision process (Bingham & Raffield
199Q~ll7)o
The primary objective of this study is to test and
systematically examine a model of organisational buying
behaviour in the South African leather industryo
To achieve the main objective, the following secondary
objectives are proposed:
o to determine the level of joint decision making;

··,":·
4
o to identify'the conflict resolution methods used in joint
decision making;
o to identify the degree of formalisation of the purchasing
policies of the individual tanneries;
o to establish selection criteria used for dyestuffs and
chemicals;
o to determine information sources consulted during new
purchase situations;
and
o to determine whether tanneries have become
environmentally conscious.
The research method used in this study comprises a two phase
approach involving a review of secondary information and a
formal study based on primary information derived from
telephone interviews.

5
Secondary information can be defined as vu. • • existing data
generated from a problem other than the one at hand 11 (Busch
& Houston 1985~791). The secondary information consulted
for this study comprises published information from various
sources including international and local industry-specific
literature. From this information, relevant conclusions are
drawn with regard to the South African leather industry.
Primary information was collected by means of telephone
interviews. Primary research is information that is vv •••
collected specifically for the research needs at hand"
(Kinnear & Taylor 1987:139).
Telephone interviews were conducted during which clear and
precise questions were put to the respondents. All
respondents were notified by post prior to the interview
that a study was being conducted and that they could expect
to be contacted. The results· obtained by the telephone
interview depended on the co-operation of the respondents
and their understanding of the questions. The questionnaire
and instructions were therefore carefully developed and
constructed.
implementation.
The questionnaire was pre-tested before
6
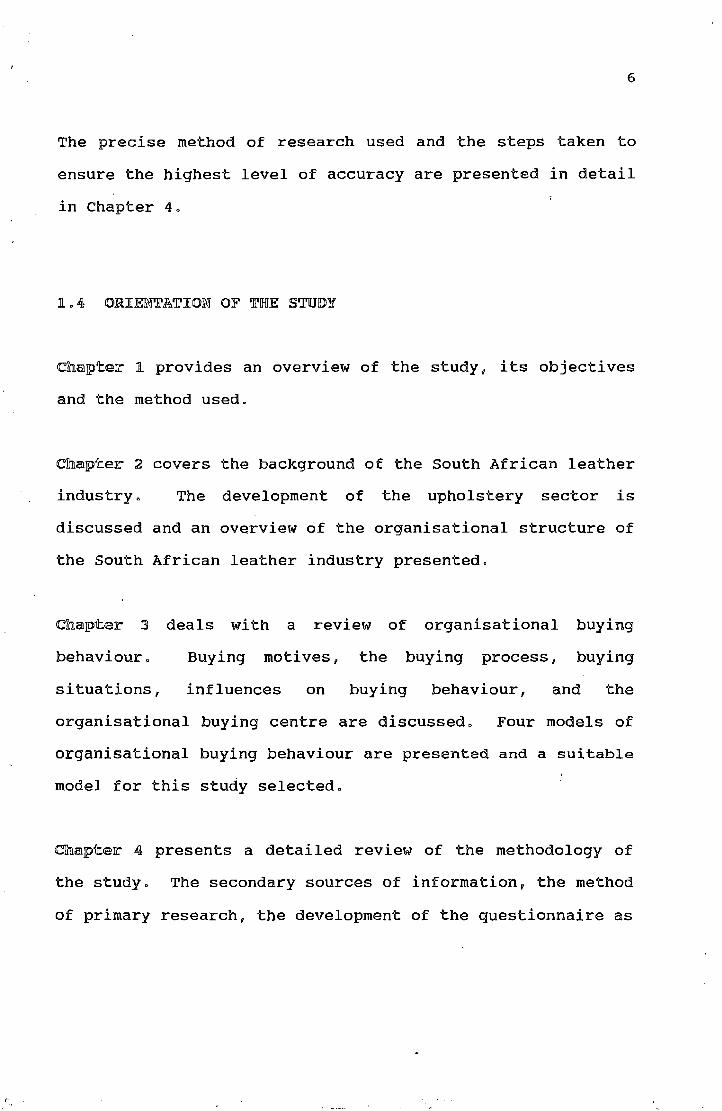
The precise method of research used and the steps taken to
ensure the highest level of accuracy are presented in detail
in Chapter 4.
1.4 ORIENTATION OF THE STUDY
Chapter 1 provides an overview of the study, its objectives
and the method used.
Chapter 2 covers the background of the South African leather
industry. The development of the upholstery sector is
discussed and an overview of the organisational structure of
the South African leather industry presented.
Chapter J deals with a review of organisational buying
behaviour. Buying motives, the buying process, buying
situations, influences on buying behaviour, and the
organisational buying centre are discussed. Four models of
organisational buying behaviour are presented and a suitable
model for this study selected.
Chapter 4 presents a detailed review of the methodology of
the study. The secondary sources of information, the method
of primary research, the development of the questionnaire as

. ·,
7
well as the methodological limitations are discussed in
detail.
Chapter 5 presents the results of the study, the level of
joint decision making, possible time pressures experienced
by respondents and the other decision makers involved in the
buying process. The degree of formalisation of the
purchasing policies, the personnel orientation of the
tanneries, their selection criteria for dyestuffs and
chemicals, environmental consciousness, and conflict
resolution during joint decision making, are covered.
Chapter 6 sets out the conclusions and recommendations of
this study. This chapter relates the research findings to
the objectives of the study and makes pertinent
recommendations for further research in the field of
organisational buying behaviour in the South African
industry .
8
Jl.o5 S~Y
This chapter discusses the scope and method of the studyo
Organisational buying decisions are the result of
interactions of individuals both internal and external to
the organisation 0 The buying process of the organisation
follows the same phases as those found in consumer
behaviouro The nature of the phase , however, differs as
organisational buyers tend to use more objective evaluation
criteria, personal sources of information; and search more
actively for informationo
Models of organisational buying behaviour attempt to
describe many of the factors involved in organisational
buying, and indicate the complexity of the decision making
processo
The objective of this study is to examine and test a model
of organisational buying behaviour in the South African
leather industry o To achieve the main objective several
secondary objectives are proposedo The methodology includes
the use of the telephone interview methodo

9
'JI'JHIE S010TlHI AJFRICAW LJE:ATJH[EJR IWDUSTRY
Just as the South African livestock indus.try has grown in
order to feed the population of the country, so the tanners
have increased their output to meet the demand for footwear,
leather goods and more recently furniture and automotive
upholstery leather.
The national leather industry, from being orientated mainly
towards the production of footwear and leather goods has
diversified and followed international trends for leather
upholstery. The motor industry has had a tremendous impact
on South African tanners, generating increased invest~ents
and foreign interest in South Africa as a supplier of export
grade leather.
The South African leather industry is a relatively old and
established industry having survived many economic cycles
and political isolation for several years. Some companies
were established in. the late 1800~'s and early 190ous that
are still operating today, such as Mossops (established
1846), Western Tanning (established 1880) and Sutherlands
10
Tannery (established 1914).
Local .tanneries have continually renewed their production
facilities with major capital investments to meet the
growing demand and the higher expectations of international
customers. European tanneries have also sought to become
part of the South African industry. Bader Germany
established a tannery and Lindgens and Schweizer concluded
technical assistance programmes with Ladysmith Leathers and
King Tanning respectively (World Leather 1992:31).
2.2 THE SOUTH AFRICAN TANNIWG INDUSTRY
In the early 1980's the national tanning industry underwent
a lean period due to severe drought conditions. Although
generally there is no shortage of hides, high quality grades
are in short supply as many South African hides tend to be
blemished by defects such as scratches, tick bites and brand
marks. This has lead to a significant increase in imported
wet-blue hides to satisfy local demand. ~wet-blue hides~ is
an international expression given to hides that have been
pre~tanned with basic chrome sulphates and basifying agents.
This gives the semi-finished product good .storage stability
for up to six months. There is a surplus of low grade
hides, especially as military buying has dropped
11
considerably in recent years. Most of this surplus is
exported in wet-blue form to European countries (S.A.
Shoemaker and Leather Review 1991:2).
Production of footwear decreased by 20 percent in the first
half of 1990 as compared with the same period in 1989. This
affected the South African tanner, many of whom worked below
60 percent capacity· in the first months of 1990 (World
Leather 1991:22). Footwear production continued the
downward trend which commenced in 1989. Production of all
footwear totalled 52.6 million pairs in 1991 compared with
62.6 million pairs in 1988, a decrease in production output
of 15.8 percent (Leather 1993:54).
Table 2. 1 shows the total output of members of the South
African Tanners Association which represents the local
tanning industry. It shows that the total number of hides
soaked, rose by ten percent from 1985 - 1990. An indication
of the industryus growth is reflected in the number of hides
processed to finished leather, an increase of 190 ood pieces
or 18 percent is recorded.
South African shoemakers have traditionally imported
significant quantities of better quality bovine leather for
the upper market shoe ranges. This amounted to some 30
million feet in some years. These quantities were

12
TABLE 2.1 : OUTPUT OF THE SOUTH AFRICAN TANNERS ASSOCIATION FROM 1985 - 1990
CATEGORY/YEAR 1985 1986 1987 1988 1989 1990
Hide Soaks (pieces)
Local (pieces) 1 575 000 1 573 000 1 680 000 1 747 000 1 773 000 1 738 000
Imported (pieces) 13 000 27 000 80 000 100 000 44 000 12 000
TOTAL SOAKS 1 588 000 1 600 000 1 760 000 1 847 000 1 817 000 1 750 000
Wet-Blue Imports (pieces) 16 000 30 000 32 000 200 000 125 000 86 000
Wet-blue Exports (pieces) 538 000 531 000 504 000 318 000 144 000 580 000
Hides Finished (pieces) 1 066 000 1 089 000 1 288 000 1 729 000 1 798 000 1 256 000
Grain Leather (sq. m) 3 520 000 4 104 000 4 036 000 4 267 000 4 495 000 3 900 000
Finished Split (sq. m) 918 000 940 000 1 111 000 1 150 000 1 294 000 900 000
Suede Split (sq. m) 337 000 442 000 225 000 185 000 129 000 130 000
TOTAL BOVINE (sq. m) 4 775 000 5 486 000 5 372 000 5 602 000 5 918 000 4 930 000
Sole Bends (pieces) 208 000 217 000 216 000 237 000 201 000 205 000
Source : World Leather 1991:27.
13
imported despite the 20 percent import duty on bovine material
(World Leather 1991 ~ 22). The fall of the Rand over the last
years has affected the industry, making the imported material
expensive. This resulted in a greater demand on the local
tanneries for larger quanti ties. This is apparent from the
latest statistics published in Leather ( 1993:54) which show
that South African tanners had soaked 2. 04 million hides in
1991 compared to 1.76 million hides in 1990 - an increase of 16
percent.
South African tanners exported only 8 percent of their output
of wet-blue leather in 1989, compared to 18 percent in 1988 n
1
Estimates for 1990, however, predict an increase of up to 33
percent. Local tanners may well exploit the fall of the Rand
to generate foreign currency and investment.
The fortunes of local tanners were heavily dependent on the
shoe industry. The South African shoe industry has been
attacked by imports from Brazil, Taiwan, Korea and China. This
is a common occurrence in many other countries in the·Western
World. In 1987, almost 30 million pairs of shoes were imported
compared to a local production of 60 million pairs of shoes n
Despite the South African governmentus close links with Taiwan
in 1988, the South African Board of Trade and Industries (BTI)
was persuaded to introduce even higher interim protective
duties on cheap textiles and synthetic footwear. This
14
effectively reduced footwear imports to 11 million pairs in
1989 (World Leather 1991~22).
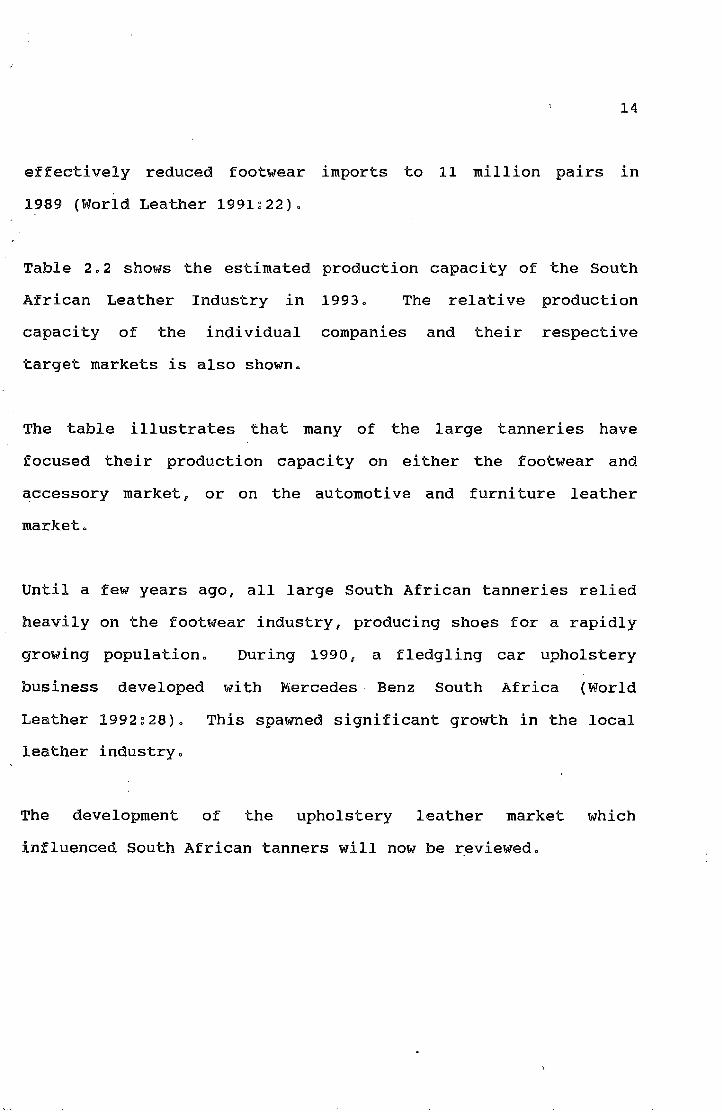
Table 2.2 shows the estimated production capacity of the South
African Leather Industry in 1993. The relative production
capacity of the individual companies and their respective
target markets is also shown.
The table illustrates that many of the large tanneries have
focused their production capacity on either the footwear and
accessory market, or on the automotive and furniture leather
market.
Until a few years ago, all large South African tanneries relied
heavily on the footwear industry, producing shoes for a rapidly
growing population. During 1990, a fledgling car upholstery
business developed with Mercedes Benz South Africa (World
Leather 1992~28). This spawned significant growth in the local
leather industry.
The development of the upholstery leather market which
influenced South African tanners will now be r.eviewed.
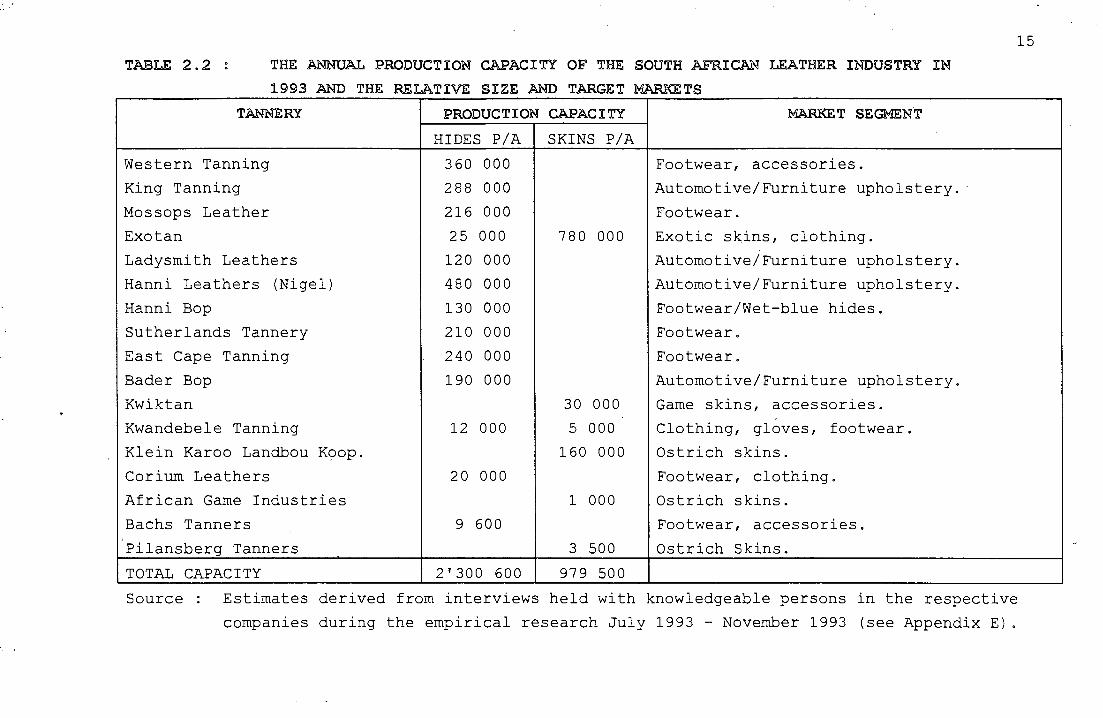
TABLE 2.2 THE ANNUAL PRODUCTION CAPACITY OF THE SOUTH AFRICAN LEATHER INDUSTRY IN
1993 AND THE RELATIVE SIZE AND TARGET MARKETS
TANNERY
Western Tanning
King Tanning
Mossops Leather
Exotan
Ladysmith Leathers
Hanni Leathers (Nigel)
Hanni Bop
Sutherlands Tannery
East Cape Tanning
Bader Bop
Kwiktan
Kwandebele Tanning
Klein Karoo Landbou K9op.
Corium Leathers
African Game Industries
Bachs Tanners
Pilansberg Tanners
TOTAL CAPACITY
PRODUCTION
HIDES P/A
360 000
288 000
216 000
25 000
120 000
480 000
130 000
210 000
240 000
190 000
12 000
20 000
9 600
2'300 600
CAPACITY
SKINS P/A
780 000
30 000
5 000
160 000
1 000
3 500
979 500
MARKET SEGMEN.T
Footwear, accessories.
Automotive/Furniture upholstery.
Footwear.
Exotic skins, clothing.
Automotive/Furniture upholstery.
Automotive/Furniture upholstery.
Footwear/Wet-blue hides.
Footwear.
Footwear.
Automotive/Furniture upholstery.
Game skins, accessories.
Clothing, gloves, footwear.
Ostrich skins.
Footwear, clothing.
Ostrich skins.
Footwear, accessories.
Ostrich Skins.
Source Estimates derived from interviews held with knowledgeable persons in the respective
companies during the empirical research July 1993 - November 1993 (see Appendix E) .
15

2" 3 DEVELOll?WEWT OF '][']l{E UPHOLSTERY LEA'][']l{ER INDUSTJRY IN
SOUTH AFllUCA
Automotive Leather Upholstery
16
The development of an export driven leather market has provided
many opportunities for South African and foreign tanners. Two
factors have combined by chance to change the South African
industry (World Leather 1992:28). Firstly, the rapid
globalization of the motor vehicle industry which meant that
components and sub-assemblies were manufactured and exchanged
by major motor company plants throughout the world. This
allows motor manufacturers to maximise their cost advantages in
certain countries and standardise their products' wherever
possible.
The second factor relates in specific to the locai car
industry, and has its origin in the South African governmentus
desire for industrial self-sufficiency, coupled with a need to
conserve foreign exchange. The stringent ~local content"
regulation governing the motor industry resulted in the
establishment of the only Bayrische Motoren Werke (BMW) and
Mercedes Benz manufacturing plants outside Germany. Other
motor manufacturers include Volkswagen (VW)/Audi, Toyota,
Nissan, Delta, and the South African Motor Corporation (Samcor)
which produces Ford and Mazda vehicles. Honda is manufactured
in the Mercedes Benz South Africa (MBSA) plant while Fiat

17
produces their Uno in . the Nissan plant. This represents a
large range for the new passenger car market which consists
only of some 200 000 units per annum (World Leather 1992~28).
The '0local content programme" has changed several times, and
over the years the South African government has tried to
encourage more local content. The sixth and most recent phase,
emphasises local content measured by value, rather than weight.
This spurred car manufacturers into action, and in particular
the luxury car producers, BMW, who saw their competitive edge
being eroded by increased tax penalties if they failed to meet
the new value limits. BMW embarked on a concerted programme to
export relatively low-tech but high value parts to its Bavarian
parent company. This enabled the company to gain excise tax
credits under the programme in phase six.
Leather seats and interior car trimmings fitted the bill
perfectly, resulting in BMW's rapid expansion of their off-take
of upholstery leather, which up to this point had been
restricted to local car sales. Initially, BMW relied: heavily
on Hanni Leathers in Nigel. The synergy developed so well
between the two companies that Hanni dropped the production of
shoe leathers to concentrate on the more profitable upholstery
market, expanding considerably in the process. Hanni now soak
40 000 hides a month. The top 75 percent are used for auto and
furniture leathers, the remaining 25 percent
the wet-blue stage. Imports of a further
are exported in
4000 selected
18
European wet-blue hides give Hanni a production in excess of
1.25 mill1on square feet of leather per month. More than half
of this output is sold to the motor industry with the balance
going to furniture, leather goods and footwear manufacturers
(World Leather 1992~30).
Hanni 9 s major customer, BMW, still sources a significant
proportion of its requirements from this firm" However, its
needs have far exceeded the supply of a single tannery. This
situation developed in tandem with BMW 9 s expanded capacity for
exporting fabricated car seat covers to Germany. The parent
company approached one of their larger home suppliers, the
Bader tannery in Goppingen, Germany, with a view to
establishing a production facility in South Africa. Bader was
persuaded to follow its market to South Africa and invest in a
production facility near to the adjacent BMW car trim plant
in the industrial development area of former Bophuthatswana,
near the main car factory in Rosslyn. Bader Bop started off in
1990 as a finishing plant but has now expanded to tan up to 10
000 hides per month. Supplemented by wet-blue hide · imports
from . its parent company in Goppingen, Bader Bop us production
output has increased to some 600 000 square feet of leather per
month. Bader and Hanni Nigel supply their upholstery leather
to BMW in a kit forrn to be stitched into car seat covers for
the local and export market. BW# air freights some 400
completed interior trim sets daily from Johannesburg to
Germany, an equivalent of 1 600 hides per day. This m~kes BMW
19
the largest. user of auto leather in South Africa. Of the
·estimated· 24 million square feet of leather required by South
African car producers, 19 million square feet, or nearly 80
percent are consumed by BMW (World Leather 1992:31).
Mercedes Benz South Africa has used local upholstery leather
for years, most of it from the Silverton Tannery in Pretoria,
or at least until the tannery closed its doors in 1989. The
tannery has moved to a new plant, Ladysmith Leathers.
Ladysmith Leathers processes up to 10 000 local and imported
wet-blue hides per month, making up some ten percent of South
African upholstery production, most of which is automotive
leather for Mercedes/Honda and , Toyota (World Leather
1992:31).
There is international technical co-operation between the
German tannery Lindgens Leder of M;iilheim, a major supplier of
Mercedes, and Ladysmith Leathers. King Tanning Company has
also announced a technical agreement with another German
tannery, Lederfabrik Louis Schweizer of Murrhardt. Based in
King Williams Town, King Tanning tans its own material in a
wet-blue hide plant with a capacity of 1 200 hides per day.
The tannery finishes some 500 000 square feet of auto and
furniture leather per month (World Leather 1992:31).

20
Italy has long been a major customer for South African hides,
both in a raw or wet-blue stateo Many shipments are delivered
to the Arzignano furniture leather tannerso · South Africa has
followed the world trend for leather furniture o The Gerald
Yosh Company (GY Lounge) of South Africa leads the field by
discounting large quanti ties of leather upholstered furniture
through specialised retail outletso Other furniture
manufacturers include Motani, Grafton Everest, Airflex and
Dunker & Louw which cater for the top end of the marketo Since
South African tanners have begun offering an acceptable product
to imported leathers at competitive prices, it is likely that
most of the 3o5 million square feet required for the furniture
industry is being sourced locally (World Leather 1992)o
In mid 1992 0 the demand for furniture leather decreased sharply
as the recession took its tollo Local demand for cars
decreased steadily to a predicted 180 000 units in 1992, with
down-trading prevalent as motorists struggled to cope with the
currency-dominated inflation rate o Another setback for the
local auto upholstery industry was the re-examination of
industrial protections and subsidies by the South African
Minister of Financeo This could mean the lifting of the phase
six local content regulationo How attractive this will make
the export of leather components depends on the contents of the
new dispensationo It may directly influence the local tanning

...
21
industry which is currently geared to supply around 25 million
square feet of automotive leather per annumo
A closer look at the local tanneries will help define the
structure of the South African tanning industryo
2 o ~ "l'lHHE OlRGMISA'lL'IOOOAJL S'JI.'JRUCTmRJE: OF 'l'lH!E OOA'll'IOOOAI. LU'l'lH!llm.
IOOIDUS'JI.'JR'lf
Most of the larger South African tanneries belong to one of the
five major groups namely,
Industries/African Hide Trading,
Storage or Futurao Table 2o3
Vleissentraal, Silveroak
Foodcorp, Imperial Cold
shows the organisational
structure of the South African Leather Industryo
Vleissentraal, the country's largest meat co-operative, owns
Western Tanning in Wellington and King Tanning in King Williams
Towno Silveroak Industries/African Hide control Mossop
Leathers in Cape Town, Exotan in Port Elizabeth and Ladysmith
Leathers in Ladysmitho Foodcorp owns Hanni Leathers in Nigel
and Hanni Bop in Mogwase near Rustenburgo Imperial Cold
Storage has Suther lands Tannery in Pietermari tzburg o Other
leather producers include East Cape Tanning based in Uitenhage
and owned by Futura; Bader Bop, situated in Garankuwa near
Pretoria with its parent company Bader Goppingen based in
Germany; Kwiktan and African Game in Krugersdorp; Kwandebele
Tanning in Bronkhorstspruit; the Klein Karoo Landbou Korporasie

22
TABLE 2. 3 THE ORGANISATIONAL STRUCTURE OF THE SOUTH AFRICAN LEATHER INDUSTRY
GROUP COMPANY TANNERY LOCATION
Vleissentraal Western Tanning Wellington
King Tanning King Williams Town
Silveroak Industries I Mossop Leathers Cape Town
African Hide Exotan Port Elizabeth·
Ladysmith Leathers Ladysmith
Foodcorp Hanni Leathers Nigel
Hanni Bop Mogwase
Imperial Cold Storage Sutherlands Tannery Pietermaritzburg
Futura East Cape Tanning Uitenhage
Independents Bader Bop Garankuwa
Kwiktan Krugersdorp
Kwandebele Tanning Bronkhorstspruit
Klein Karoo Landbou Koop. Oudtshoorn
Corium Leathers Wellington
Pilansberg Tanners Pilansberg _,
Bachs Tanners Paarl ·-
African Game Industries Krugersdorp

23
Tannery in Oudtshoorn; Pilansberg Tanners near Rustenburg;
Corium in Wellington; and Bachs Tanners in Paarl.
Table 2. 4 shows the estimated annual production capacity and
target markets of the tanneries belonging to group companies in
the South African Leather Industry. The table illustrates that
the Vleissentraal group has the largest production capacity of
some 648 000 hides per annum, followed by the Foodcorp group
with 610 000 hides per annum, Silveroak with 361 000 hides and
780 000 skins, Futura with 240 000 hides, and Imperial Cold
Storage with 210 000 hides per annum.
Vleissentraal Group
King Tanning forms part of the Livestock Products Division of
Vleissentraal. Established in the 1870's in King Williams
Town, it concentrated on producing top quality footwear
leathers before the meat co-op, Vleissentraal, gained control.
The management of Vleissentraal reassessed its tanning
interests and decided to concentrate its footwear production in
the Western Tanning plant in Wellington in the Cape. The King
Tanning plant processes some 24 000 hides per month of
automotive upholstery leather for Mercedes Benz and Nissan as
well as leather for furniture upholstery.

TABLE 2. 4
GROUP
COMPANY
Vleissentraal
Silveroak/
African Hide
Foodcorp
Imperial Cold
Storage
Futura
THE ESTIMATED ANNUAL PRODUCTION CAPACITY AND TARGET MARKET OF THE GROUP
COMPANIES IN THE SOUTH AFRICAN LEATHER INDUSTRY 1993
TANNERY
Western Tanning
King Tanning
Mossop Leathers
Exotan
Ladysmith Leathers
Hanni Leathers
Hanni Bop
Sutherlands Tannery
East Cape Tanning
TOTAL GROUP COMPANIES
PRODUCTION
HIDES
PER ANNUM
360'000
288'000
216'000
25'000
120'000
480'000
130'000
210'000
240'000
2'069'000
CAPACITY
SKINS
PER ANNUM
780'000
780'000
MARKET SEGMENT
Footwear, Accessories.
Auto/Furniture Upholstery.
Footwear.
Exotic Skins, Clothing.
Auto/Furniture Upholstery.
Auto/Furniture Upholstery.
Footwear/Wet Blue.
Footwear.
Footwear.
Source Estimates derived from personal interviews conducted with knowledgeable persons in
each of the respective tanneries during 1993.
24

25
The Western Tanning Company was established in the 1880's in
Wellington. This shoe leather tannery has a capacity for wet
blue of over 30 000 hides per month for their own production
and represents the largest manufacturer of leather for the
footwear and leather goods industries in South Africa (World
Leather 1991:30).
Silveroak Industries/African Hide Trading
Ladysmith Leathers came into operation in 1989 and processes
some 10 000 local and imported hides per month. Most of this
tannery's production is aimed at the automotive upholstery
market of Mercedes/Honda, Toyota and BMW. As with all South
African Tanners supplying the motor industry, the leather is
cut and supplied in kit form after careful inspection and
quality control (World Leather 1992:31).
Established in 1846, Mossop Leather in Cape Town is South
Africa 1 s oldest established tannery. The tannery became part
of the Silveroak group in the mid eighties and processes some
18 000 wet-blue hides per month for the footwear and leather
goods market. Regarded as fashion leaders among local tanners,
Mossop Leathers has developed a comprehensive range of prints
and exotic finishes and has the capacity to produce over one
million square feet of leather per month (World Leather
1991:30).

26
Exotan, near Port Elizabeth, processes a variety of skins from
antelope to zebra as well as pythons, sheepskin nappa, and
until recently, much of the world's production of legally
culled elephant leather. Exotan 1 s expansion into top quality
sheep nappa led to the building of Exofell, a new sheepskin
pullery and pickling plant which its parent, company
Sil veroak/African Hide built adjacent to Exotan. This plant
came on stream in late 1989 and processes up to 3000 skins per
day. Exoblue, the wet-blue hide section of the group has been
upgraded to produce nearly 30 000 wet-blue hides per month,
some of which are for Mossop Leathers, with the balance for
export to Europe (World Leather 1991:27).
Food! corp
Hanni Leathers in Nigel was established in the 1960's by a
German immigrant family with tanning roots going back to the
eighteenth century. Currently owned by the major agricultural
business group Foodcorp, Hanni soak 40 000 hides per month.
The top quality hides are used for automotive and fUrniture
leather, with the lower grades being exported or supplied to
its subsidiary footwear leather tannery, Hanni Bop.

27
In addition Hanni Nigel import up to 4000 hides of European top
grade wet-blue hides which extends its production capacity to
over 1.25 million square feet per month. Half of this
production is supplied to its car industry 1 with the balance
sold to furniture, leather goods, and footwear manufacturers.
Major automotive customers include BMW, Toyota South Africa 1
VW/Audi South Africa and Samcor (World Leather 1992:30).
Imperial Cold storage (ICS)
sutherlands Tannery near Piete~maritzburg is owned by Imperial
Cold Storage, a food products group of the Barlows industrial
empire. The tannery processes up to 7 000 hides into vegetable
tanned leather (leather that is tanned with the aid of bark
extracts mainly from Wattle or Mimosa trees) as well
15 000 wet-blues for the shoe-upper leather market.
as over
Most of
this production is taken up by neighbouring shoe factories in
the province that produce about two thirds of South Africa's
footwear output. The holding company ICS have recognised its
good location and invested substantial funds in renovating the
tannery (World Leather 1991:31).
Fut.ura Group
The East Cape Tanning company, previously the South African
Bata Tannery, is situated in Uitenhage, home of the Volkswagen

28
plant in the Eastern Cape. The fact that it is owned by
Futura, an ex Bata shoe operation in South Africa, precludes
any involvement in the automotive upholstery market as the
tannery is geared for the manufacture of shoe leather only.
The tannery has the capacity to produce over 20 000 hides per
month, and finishes up to 80 percent of these. into corrected
and full grain leather. The remaining twenty percent are
offered for contract wet-bluing of hides to other tanneries.
East Cape Tanning is one of the few tanneries without meat or
hide connections (World Leather 1991:27).
Independent Tanneries
Bader Bop, an extension of its parent compa~y Bader Goppingen
in Germany, is situated in the industrial township of Garankuwa
near Rosslyn. The tannery concentrates on producing automotive
upholstery leather mainly for BMW. Other customers include
VW/Audi South Africa and Mazda South Africa. Bader Bop has
extended its tannery to produce up to 10 000 wet-blue hides
per month and supplements its production output with imported
wet-blues from parent company Bader Germany (World Leather
1992:31).
29
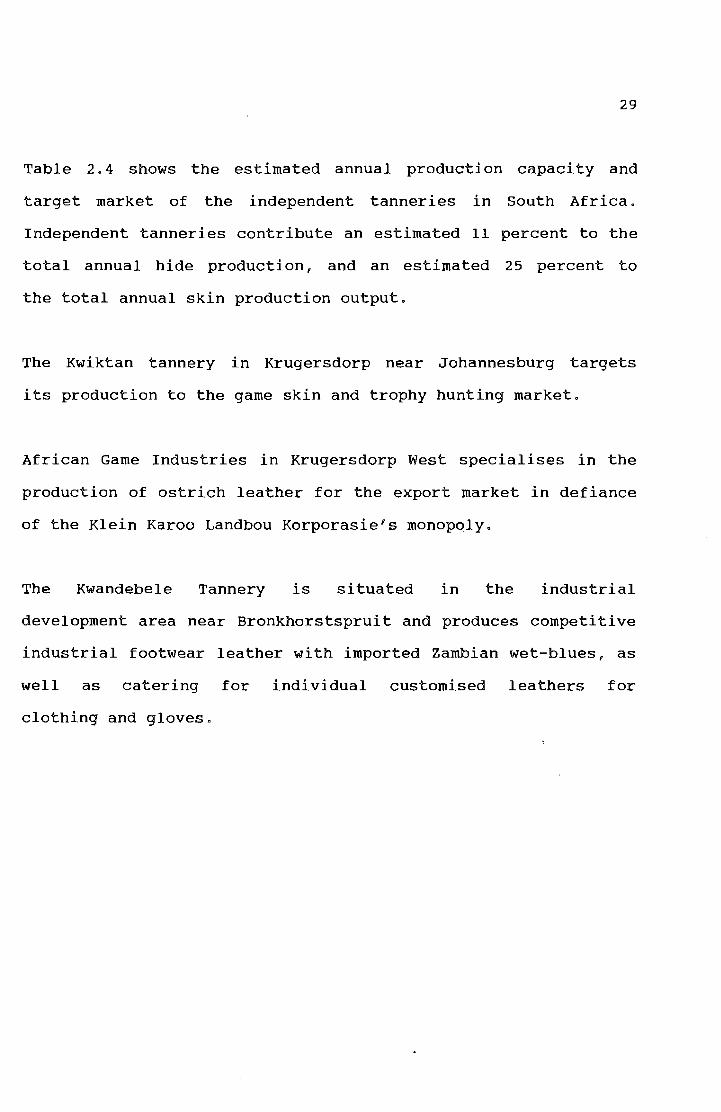
Table 2. 4 shows the estimated annual production capacity and
target market of the independent tanneries in South Africa.
Independent tanneries contribute an estimated 11 percent to the
total annual hide production, and an estimated 25 percent to
the total annual skin production output.
The Kwiktan tannery in Krugersdorp near Johannesburg targets
its production to the game skin and trophy hunting market.
African Game Industries in Krugersdorp West specialises in the
production of ostrich leather for the export market in defiance
of the Klein Karoo Landbou Korporasie's monop~ly.
The Kwandebele Tannery is situated in the industrial
development area near Bronkhorstspruit and produces competitive
industrial footwear leather with imported Zambian wet-blues, as
well as catering for individual customised leathers for
clothing and gloves.

TABLE 2. 5 THE ESTIMATED ANNUAL PRODUCTION CAPACITY AND TARGET MARKET OF THE
INDEPENDENT TANNERIES IN THE SOUTH AFRICAN LEATHER INDUSTRY 1993
TANNERY PRODUCTION CAPACITY MARKET SEGMENT
HIDES PER SKINS PER
ANNUM ANNUM
Bader Bop 190'000 Automotive Furniture.
Kwiktan 30'000 Game skins, Accessories.
Kwandebele Tanning 12'000 5'000 Clothing, Gloves, Footwear.
Klein Karoo Landbou Koop 160'000 Ostrich Skins.
Corium Leathers 20'000 Footwear,Clothing,Accessories.
African Game Industries 1'000 Ostrich Skins, Accessories.
Bachs Tanners 9'600 Accessories.
Pilansberg Tanners 3'500 Ostrich Skins, Accessories.
TOTAL IND~PEND~NT ~~~!!! ___ ___ 2_3 __ 1_'_0_0_0 __ ~ ___ 1_9_6_'_0_0_0 __ ~--------------------------------
Source Estimates derived from personal interviews conducted with knowledgeable
persons in each of the respective tanneries during 1993.
30

31
The Klein Karoo Landbou Korporasie (K.K.L.K.) tannery forms
part of a farmers co-operative based in the town of Oudtshoorn.
Its control of the marketing of all produce derived from
ostriches was protected by law. The Klein Karoo tannery was
established 1n the 1970's, effectively cutting off the
lucrative supply of raw skins to Europe by other tanneries.
Most of its production is exported at high prices. This has
awakened interest in outsiders to break the monopoly. Ostrich
farming in places such as New Mexico, Namibia, Australia,
Israel and Zimbabwe could alter the balance of supply and
demand which the K.K.L.K. has managed so successfully over the
years (World Leather 1991:30).
Pilansberg Tanners
former homeland of
farm and cull their own ostriches in the
Bophuthatswana. The annual production
comprises 3 500 skins for the local and export market.
Bachs Tanners is situated in Paarl and produces up to 800
vegetable tanned hides per month for the leather goods
industry.
Corium, a specialist finishing plant in Wellington purchases
its hides from neighbouring Western Tanning and imports hides
from Asia. Corium supplies the fashion industry and has a
finishing capacity. of 200 000 square feet per month (World
Leather 1991:27).

32
Figure 2.1 shows a map of South Africa and the various towns
and cities in which tanneries are located. It can be seen that
production is located in the Cape, the
Witwatersrand, Vereeniging), and Durban area.
FIGURE 2.1 GEOGRAPHIC LOCATIONS OF TANNERIES
PWV
) /
( I
'
(Pretoria,
Source World Leather. 1991. Regional Focus: South Africa.
Vol. 4.
33
2a5 SmmARY
This chapter described the South African tanning industry and
significant developments that have taken place in the leather
upholstery industry. The organisational structure of the
industry has been described and the individual tanneries, their
affiliated production capacities and target markets have been
reviewed.
The well-established South African tanning industry has been
severely tested by the harsh drought conditions in Southern
Africa. However, since 1985, the total hide soaks have
increased from 1. 575 million hides to 2. 04 million hides in
1991 - a growth of 29. 5 percent. The recession has affected
the demand of both the footwear and upholstery markets.
Footwear tanneries have experienced a decrease in demand of 15
percent. However, roughly 40 percent of South Africa's leather
production capacity is now concentrated on upholstery, using
some of the best hides in response to the reward of higher
prices.
With an industry capable of producing around·25 million square
feet of upholstery leather per annum, there is a vast potential
for further investments into a financially interesting source
of competitively priced upholstery leathers. The
development of the South African leather industry since
rapid
the

34
1980's has proven that with international business interests,
South Africa is set to become a major player in the world
leather market. An unknown factor, however, remains, as future
government dispensations may directly influence the automotive
industry phase six local content programme which has
undoubtedly generated millions of dollars in export revenue for
the country.

35
CIHfAJPTER 3
ORGANISATIONAL BUYING BEHAVIOUR
This chapter discusses the background to organisational
buying behaviour. Organisational buying motives are
reviewed and rational and emotional factors influencing
organisational members when a choice is necessary among
competing products (Hutt & Speh 1992) will be explored. The
purchasing process is analysed and comprises eight
sequential buying phases. Buying situations are discussed
and related to the phases of the purchasing process. The
organisational buying centre, which refers to all
individuals included in the organisational decision-making
process, is reviewed with reference to the distinct roles
members may play in the decision-making process itself.
The influences that may affect organisational · buying
behaviour both inside and outside the organisation will be
discussed in detail.
Finally, four models of organisational buying behaviour will
be illustrated and reviewed for use as a basis for the
research of this dissertation.

36
3~2 ORGANISATIONAL BUYING MOTIVES
Members of organisations are influenced by both rational and
emotional motives when choosing between competing products
and suppliers (Butt & Speh 1992:79). Rational motives are
mainly concerned with the economic needs of the organisation
such as price, quality, service and supply. Emotional
motives are based upon human factors such as job security
and organisational status (Eckles 1990; Butt & Speh 1992).
lRartiornal Woti ves
The rational motives of an organisation may include : price,
quality, service, continuity of supply and reciprocity (Butt
& Speh 1992:79). Each of these will now be discussed.
Price affects the organisation's profit and is a value
measure that can b~ identified in a return-on-investment
(ROI) calculation. According to Eckles (1990), price is not
as important to organisational buyers as marketers ·may be
led to believe. When a product is sold on price, quality
and service may be perceived to be suspect.
When the product is sold on quality and service, it may be
perceived as being more durable and conducive to the
development of a customer-seller partnership, based on

37
trust.
Quality to the organisation means the correct materials,
design, fit, appearance and consistency. First-time quality
reduces remanufacture, reruns, returns, delays, customer
dissatisfaction and possible lost future business (Eckles
1990).
Service includes training, repair, spare parts, replacement
of damaged goods during shipment, information, installation
of new systems and cost reductions or value.analysis (Eckles
1990). According to Hutt and Speh ( 1992:81) a supplier
offering sound technical advice, reliable and fast delivery,
and available supply of replacement may have an edge over
competing marketers.
Continuity of supply can be critical to the organ~sation 's
buyers as an interruption in the flow of key materials can
impair the production process resulting in costly delays and
lost business (Hutt & Speh 1992:81). Inconsistent suppliers
may therefore soon be dismissed (Eckles 1990).
Reciprocity can be described as the situation in which the
purchase decision is influenced by a buyer-seller
arrangement rather than by economic or performance factors
(Hutt & Speh 1992). This reciprocal buying arrangement may

38
originate from a close buyer-seller relationship and be
based on friendly or highly coercive pressure (Eckles 1990;
Hutt & Speh 1992).
Emotional Motives
Emotional motives are less overt than rational motives and
may include status and rewards, perceived risk, and
friendship (Hutt & Speh 1992:83).
Status and reward refers to the buyer's perception of what
the purchase decision will mean to a number of aspects that
can give status or reward. Success through recognition,
promotion, salary increases, and job security (Eckles 1990;
Hutt & Speh 1992).
The perceived risk may be divided into two components (Hutt
& Speh 1992:83). Firstly, uncertainty about the result of a
decision, and secondly, the magnitude of the consequences
associated with a wrong decision. Organisational · buyers
will usually reduce the level of risk by relying on
reputable and familiar suppliers.
The buyer may also reduce uncertainty by visiting the
supplier 1 s production facilities, or consult top management
before making a decision, thereby reducing the possibility

39
of unfavourable consequences.
Emotional motives may often influence purchasing decisions
in more subtle ways. A buyer may be known to select on the
basis of competitiveness but work with a friend to ensure
that his price and product specifications are competitive
(Hutt & Speh 1992:84). These friendships usually last for
many years as both parties like each other and prefer to do
business together (Eckles 1990).
Both rational and emotional motives exist in the purchasing
process (Eckles 1990). Organisational buying can be viewed
as a process rather than an isolated act and consists of
several phases (Hutt & Speh 1992). The buying phases in the
organisational purchasing process will now be discussed.
3o3 THE ORGANISATIONAL BUYING PROCESS
Approaches to defining the purchasing process geherally
include five generic steps that apply to both to consumer
and industrial buying (Morris 1988:86).
Need recognition,
evaluation, the
evaluation.
the search for information, production
purchase decision, and post purchase

,·.
40
Robinson, Faris and Wind (1967) have tailored these generic
steps to the industrial buying process by developing eight
sequential buying phases. These include the following :
Phase 1
Phase 2
Phase 3
Phase 4
Phase 5
Phase 6
Phase 7
Phase 8
0 .
Anticipation or problem recognition.
Determination of characteristics and quantity
of the required item.
Description of characteristics and quantity
of the required item.
Search for and qualification of potential
sources.
Acquisition and analysis of proposals.
Evaluation of proposals and selection of
supplier(s).
Selection of an order routine.
Performance feedback and evaluation.
In the first buying phase, a person in the organisation
becomes aware of a need or problem that is not currently
being met. This need or problem may arise throughout the
organisation (Morris 1988:86) such as technical problems in
developing new processes, the purchasing department may
determine that a supplier is becoming less dependable, or
new customer specifications are required.
41
The individual who initiates the buying process by
identifying the need or problem is not necessarily the one
who decides what is to be purchased, if anything, to satisfy
the need (Morris 1988:86). According to Reeder, Brierty and
Reeder (1987) and Von Hippe! (1978) the industrial marketer
can act as the initiator by helping the customer recognise a
need. The need perception can be created by raising doubts
in the buyer's mind whether he or she is pa¥ing too much for
existing products or is abreast with new technologies and
innovations.
The second and third buying phases are closely related
(Morris 1988:87). In the second buying phase, members of
the buying organisation determine which product or service
characteristics may resolve the perceived problem.' Once a
general solution has been established, the organisation
breaks its need down into specific characteristics and
quantities required for a product or service. At this third
phase, product specifications such as the light and
migration fastness of dyes, the required colour or· shade,
are established.
Morris ( 1988) and Reeder, et al. ( 1987), indicate that the
decisions made in the second and third buying phases can
prejudice what happ~ns throughout the remaining decision
making processes. The need description may be tailored to

42
products of well-known or favoured suppliers.
The fourth buying phase involves searching for, and
qualifying suitable suppliers. Reeder, et al.{1987),
indicates that buying influencers search for information on
suppliers in order to establish quality and quantity
requirements. Information sources such as trade journals,
trade shows, industrial directories, sales calls, word-of
mouth, and existing contracts and prices may be relied on
for information. According to Morris {1988:89), the
evaluation process may be directed at quality and
dependability. A supplier who has an excellent product but
unreliable deliveries, or is inflexible to adapting to the
. buyerus needs, may not be selected. Morris {1988) suggests
that the relationship between buyer and seller is similar to
a marriage. As a result, the buyer will evaluate the
supplier 1 s production facilities, service and delivery
record, quality assurance programme, financial health and
even quality of management of the supplier(s).
During the fifth buying phase the buying organisation
acquires and evaluates specific proposals after identifying
suitable suppliers (Reeder et al. 1987).
The proposal may take ~he form of a formal price quotation
or a listing of sales terms. In this phase, the process of
43
negotiations with suppliers over price, delivery, terms, and
inventory levels receives particular attention. Both
Reeder, et al. (1987), and Morris (1988) agree that phases
four and five may occur simultaneously in routine purchases
where the organisation has past experience.
In the sixth phase, the buyer evaluates proposals and
decides on a final supplier. The actual selection of the
source of supply may involve considerable negotiation within
the buying organisation. Individuals involved in the
decision may have different selection criteria and
perceptions of suppliers (Morris 1988).
Phase seven begins with the placing of an order, and is not
completed until the ordered item is delivered to the buying
organisation and accepted for use (Reeder et al. 1987). The
levels of stock holding, procedures for placing orders and
taking delivery are agreed upon. The relationship with a
supplier will usually last beyond the initial purchase.
Supplier loyalty is however not automatic (Morris 1988).
Buying phase eight involves performance feedback and ongoing
evaluation of product and supplier. Reeder, et al. (1987)
indicates that should the purchased item not solve the
original problem or need, suppliers that were screened
earlier may be reconsidered. Research undertaken by Doyle,
44
Woodside and Michell (1979} support the finding that
alternatives previously rejected are viewed in· a more
favourable light if the purchased item failed to solve the
original problem.
It is important to note that the decision making process may
not be the same for all types of products (Morris 1988}.
For example in repurchase situations the buying organisation
may be loyal to its current supplier and automatically
reorder the product without re-evaluating its needs or
obtaining proposals from other suppliers. Furthermore, some
of the buying phases ·may take place simultaneously, rather
than sequentially. The process can also be interactive,
where the results of later phases require the organisation
to return to, and modify, earlier stage decisions. For
example, Morris (1988:88} points out that the buyer
concludes that the supplier's capabilities make it necessary
for specifications to be reviewed (phase three) or that the
organisation°s needs have changed (phase two).
The various buying situations will now be reviewed against
the eight buying phases discussed in this section.
45
Jo4 BUYIOOG SITUATIOOOS
The same product can produce different buying patterns in
different companies which have various levels of experience
and information (Hutt & Speh 1992:71) o Three types of
buying situations have been identified : New Task, Modified
Rebuy and the Straight Rebuy (Eckles 1990; Reeder et al.
1987)o These three buying situations establish the basic
purchasing patterns by product and purchase functions
(Eckles 1990; Hutt & Speh 1992), and will now be related to
the eight sequential buying phases of the purchasing
process.
NeB Task Purchase
A new task purchase is an extensive decision-making and
problem solving process as the organisation has no previous
experience nor any prior product use in this type of
purchase (Eckles 1990:52)" When confronted with a new task
buying situation,
defined criteria
suppliers (Hutt
organisational decision makers lack well
for comparing alternative products and
& Speh 1992:72), and commence with an
extensive search for ·information and alternatives to solve
the problem o
infrequently
A new task purchase usually involves
purchased items such as machinery
installations, computers or a new building.

46
Eckles ( 1990:52) indicates that preferential treatment may
be given to current suppliers. Hutt and Speh (1992) support
this finding, as ~'inn or current suppliers can monitor the
changing needs of the organisation and prepare the needs of
new-task buyers.
Wodified Rebuy Purchase
In the modified rebuy situation, organisational decision
makers may feel that additional benefits could be derived
from a re-evaluation of alternatives. It may be worthwhile
to obtain additional information or consider alternative
solutions (Eckles 1990~ Hutt & Speh 1992). The modified
rebuy situation is likely to occur when the organisation is
no longer satisfied with the present supplier's performance,
for example poor deliveries (Reeder et al. 1987). According
to Hutt and Speh (1992) the modified rebuy situation can be
described as limited problem-solving in which decision
makers have well-defined criteria, but are uncertain about
the supplier that would best fit their requirements.
Modified rebuy purchases often include products such as
small hand tools, supplies such as dyes and chemicals, and
sub assemblies (Eckles 1990:53).

47
In the straight rebuy situation, purchases have become
routine in nature as buyers have substantial experience in
purchasing the product (Eckles 1990:73). Hutt and Speh
( 1992:72) indicate that routine response behaviour is the
decision process buyers employ in the straight rebuy
situation. Well dev~loped choice criteria have been refined
over a period of time by organisational buyers and
predisposition to one or a few selected suppliers may have
developed (Hutt & Speh 1992). Products in this category
include raw materials such as hides and skins, and wattle or
chrome extracts for the tanning process.
In each of the three buying situations various
organisational members may be involved
making process, forming a buying centre.
will now be discussed.
in the decision
This buying centre
The buying centre which refers to all organisational members
included in the decision-making process (Busch & Houston
1985), is usually an informal, cross-departmental decision
unit whose primary objective is to obtain, import and

48
process purchasing related information (Hutt & Speh 1992).
The composition of the buying centre may change from one
purchasing situation to another. According to Hutt and Speh
(1992:105) a buying group evolves during the purchasing
process in response to the need for information of a
specific purchase situation. As organisational buying can
be described as a . process rather than an isolated act,
different individuals are important to the purchasing
process at different times (Lilien & Wong 1984).
For example, a· production manager in a tannery may exert
significant influence early in the purchasing process when
product specifications are being established, other
organisational members such as the technical manager may
assume a more dominant role in the later phases. Hutt and
Speh ( 199 2) indicate that the size of the buying centre
varies. An average buying centre may include four
organisational members per purchase situation. However, the
number of all individuals involved in all the stages of the
purchasing process may be as many as twenty.
The buying centre usually includes five distinct roles
users, influencers, buyers, deciders and gatekeepers (Eckles
1990; Busch & Houston 1985; Hutt & Speh 1992).
now be discussed.
These will

49
Useirs
Users are individuals or departments who will use the
purchased product and may initiate the buying process by
suggesting a need for the product (Busch & Houston
1985 ~ 253). Users may include operations· managers, factory
personnel, research and development people, accountants and
marketing managers.
Jirrnfluerrncers
Influencers are directly or indirectly involved in the
purchasing
criteria.
process
These
and can
criteria
exert influence by
may constrain the
alternative
defining
available
products choices by providing information on
(Busch & Houston 1985; Morris 1988). Influencers can be
purchasing managers, production managers, research and
development engineers and technical managers. Indi victuals
may exert pressure with their knowledge of prices,
suppliers, chemical processes, and production schedules
(Eckles 1990).
Buyeirs
Buyers are usually organisational members that possess
formal authority to select supplier(s) and arrange the terms

50
of the purchase (Busch & Houston 1985; Morris 1988). This
formal authority can, however, be contained by individuals
who specify requirements that may limit the choice of
suitable suppliers. The influence of buyers occurs
throughout the purchasing process (Busch & Houston
1985:253). Generally buyers are individuals within the
purchasing department who control the issue
order numbers and attempt to channel all
behaviour through their department (Eckles 1990).
Deciders
of purchase
purchasing
Deciders are members with formal or informal authority to
make a final decision and have veto power over the buying
centre (Eckles 1990:57). The identity of deciders may be
. difficult to determine as they tend to remain in the
background (Berkowitz 1986). They prefer to observe and
evaluate, and after reviewing and discussing with their
colleagues, make the final decision (Eckles 1990:57).
Deciders may be general managers, engineers, sales and
marketing managers, purchasing managers, research and
development people.
.. . ; : .

Gatekeepers
Gatekeepers
control the
are individuals within the
flow of information into
51
organisation who
the buying centre
(Busch & Houston 1985:253). Organisational buyers are
likely to be gatekeepers because of their frequent
interaction with suppliers which enables them to confuse or
deny supplier information to the members of the buying
centre (Eckles 1990). Other gatekeepers would include
technical personnel who may withhold or inject superfluous
technical information into the group in order to control or
delay the decision making process. Gatekeepers are likely
to influence decision making when they have found
alternative suppliers to evaluate {Busch & Houston
1985:253).
These five key individual people that make up the members of
the buying centre from a network of interaction that
characterises the organisational buying process. Two or
more roles can be performed by a single indi viduai whose
degree of influence may vary across the organisation and the
buying situations (Busch & Houston 1985). The influences
that may affect organisational buying behaviour will now be
reviewed.
· ...
52
The organisational buyer is influenced by a wide variety of
forces inside and outside the company. Busch and Houston
(1985) and Hutt and Speh (1992) have identified the
following four organisational buying behaviour influences:
environmental forces 1 organisational forces, group forces 1
and individual forces. These are illustrated in figure 3.1.
FIGURE 3 .. 1 INFLUENCES ON ORGANISATIONAL BUYING
Source
Environmental
Forces
Organisational -Organisational Forces
Buying
Behaviour Group
Forces
Individual
Forces
Hutt, M.D. & Speh, T.W. 1992.
Business Marketing Management.
New York, Dryden Press.
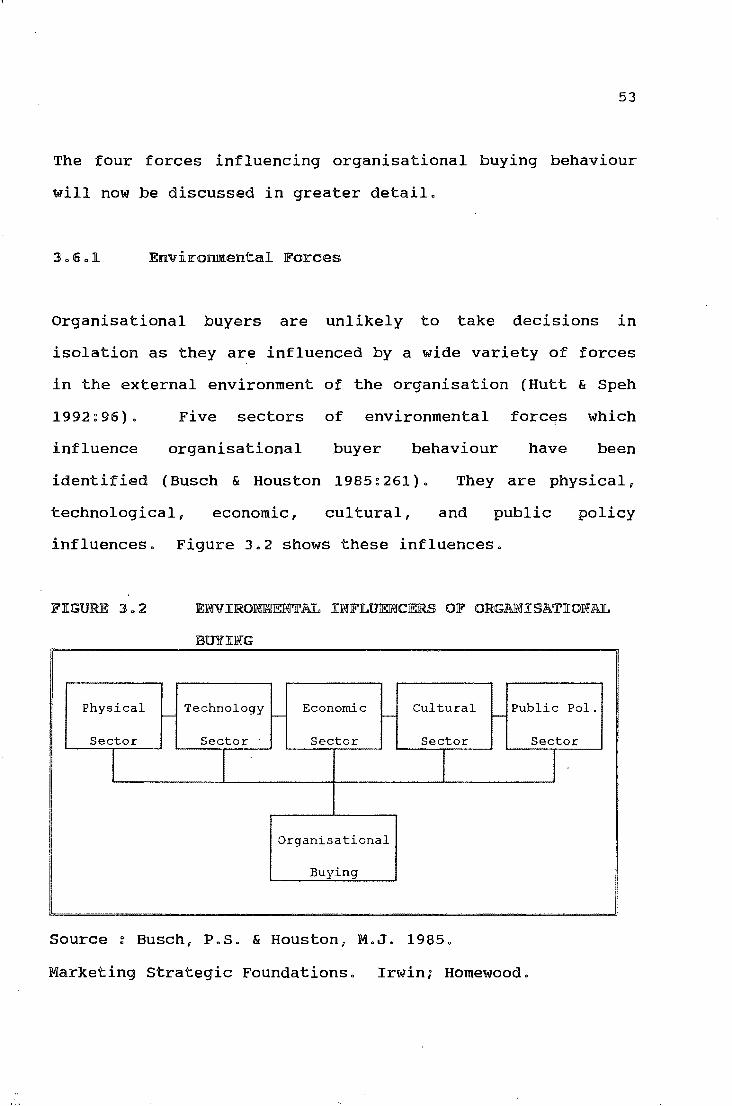
53
The four forces influencing organisational buying behaviour
will now be discussed in greater detail.
E~vironmental Forces
Organisational buyers are unlikely to take decisions in
isolation as they are influenced by a wide variety of forces
in the external environment of the organisation (Hutt & Speh
1992~96). Five sectors of environmental forces which
influence organisational buyer behaviour have been
identified (Busch & Houston 1985:261)" They are physical,
technological, economic, cultural, and public policy
influences., Figure 3.2 shows these influences.
FIGURE J a 2 E!MVIRONJIIJENTAL IWFLUENCER.S OJ!.i' ORGAJNJISATIOWAL
lBlUYIWG
Physical Technology Economic Cultural Public Pol. - r-- - -Sector Sector Sector Sector Sector
I I I I .
Organisational
Buying
Source : Busch, P.S. & Houston, M.J. 1985.
Marketing Strategic Foundations. Irwin; Homewood.
54
Collectively, these environmental influences define the
boundaries within which the organisational buyers and
sellers interact (Hutt & Speh 1992:100)o
The physical sector refers to the natural resources such as
labour and raw materials as well as the climate and
geographical location of the organisation (Hutt & Speh
1992)o The technological environment defines the
availability of products and services and, in turn the
quality of products and services the company provides (Hutt
& Speh 1992)o The economic condition of a country is
reflected in its economic growth, employment, price
stability, income and availability of resourceso According
to Busch and Houston, (1985:262) the economic environment
influences the organisation's ability to finance its
purchases as the general economic conditions determine what
and how much is purchased from the organisationo
Cultural
norms,
forces are reflected in
and traditionso They
values, customs, habits,
and will influence the
structure and functioning of the company as well as the way
organisational members feel and act towards each other and
the environment (Webster & Wind 1972; Hutt & Speh 1992)o
The public policy sector refers to the legal constraints
which may influence the purchase such as pollution standards

which dictate the use of certain products
manufacturing process (Busch & Houston 1985:262).
55
in the
Collectively, environmental influences determine the general
business conditions, political and legal setting, the
availability of products and services, as well as the values
and norms that constrain the purchasing actions (Hutt & Speh
1992:100).
Organisational Forces
The purchasing function exists within the organisation and
its purpose is to assist in the achievement of the
organisational goals (Busch & Houston 1985). The
organisational factors of importance in buying decisions
include goals and objectives, organisational structure,
resources, policies and procedures (Morris 1988:117).
Organisational goals and objectives such as sales, profits,
inventory turnover, costs and market share, are interrelated
with purchasing goals which include price negotiations,
product quality, and timeous deli very. These objectives
will determine the attributes stressed in the purchasing
decision, and indirectly affect the composition, of the
buying centre (Morris 1988).
56
The organisational structure refers to the design of the
organisation and the position of the purchasing function
(Morris 1988:117). It consists of the communications
network, authority, status, reward and work flow. The
organisational structure determines the extent to which
members of different departments communicate with each other
about a purchasing situation, which tactics they rely on to
influence one another, and the information flow regarding
products and suppliers (Busch & Houston 1985; Morris 1988).
An important structural issue is the degree to which the
purchasing function is centralised or decentralised. In a
centralised structure, all purchasing decisions are taken at
a corporate level with corporate resources. Goods are then
allocated to divisions and plants. Decentralisation permits
complete autonomy at each facility or location. According
to Morris (1988:118) decentralised purchasing tends to
attract more individuals in the buying decision and social
influences and informal interdepartmental relationships may
influence the purchase decision at each location.
Centralisation, in turn, results
specialisation and in greater
purchasing strategy.
in increased purchasing
emphasis on long-term
The organisational structure may also be related to the
policies and procedures for purchasing decisions. Policies
and procedures provide structure to the buying function by

57
governing the work flow. They determine which organisation
needs t'o be included in the buying centre, and may determine
the importance of various product attributes. Policies and
procedures also provide the framework for the formal
resolution of conflict that may arise during the purchasing
process (Morris 1988:118).
The organisation 1 s resources are the basis for its
purchasing requirements and capabilities (Morris 1988).
Resources include the size of the company, nett assets,
technologies, product lines, inventories, cash flow as well
as the technical and managerial capabilities of its
personnel.
limit its
purchases,
from whom.
Resource constraints force an organisation to
inventory, seek external financing for large
and to be conservative about what it buys and
G:rroup Fo:rrces
Environmental and organisational forces create the scenario
in which the buying centre functions. According to Hutt and
Speh ( 1992 ~ 104) purchasing managers seldom conclude buying
decisions independently of the influence of other
organisational members. The degree of involvement of
members in the buying centre will vary from routine
purchases, in which the purchasing manager simply takes the

58
preferences of others into account, to complex new-task
purchasing situations, in which the buying centre members
assume an active role in the decision-making process.
Whenever more than one individual is involved, decisions are
reached through group interaction, where members of the
buying centre need to reach some form of consensus (Morris
1988). Anderson and Chambers (1985) explain that such
consensus is unlikely to evolve automatically as buying
centres usually originate from different functional areas
inside the organisation, with differing experiences, and
reward and measurement systems. Morris (1988:118) supports
this finding and indicates that the individuals involved in
the purchasing process are members of both a departmental or
functional area, and the buying centre. As buying centres
are likely to be informal and temporary groups, the
individuals tend to demonstrate loyalty towards their
department 8 s values and norms and thereby influence the
decision-making process.
Individual Forces
Organisational buying decisions result from the interactions
of several members in the buying centre. The resulting
organisational buying behaviour is thus determined by the
interacting individuals and their psychological

59
characteristics (Busch & Houston 1985:257). The individual
forces · that influence the buying process include needs,
goals, habits, past experiences,
attitudes that each member brings
(Morris 1988:121).
information and the
to the buying centre
Because organisational buying is work-related behaviour, the
motivation of each individual involved in the decision
making process becomes an important variable for explaining
the organisation's buying behaviour (Morris 1988:121).
Anderson and Chambers ( 1985) explain that the motivation
underlying individual behaviour can be related to the theory
of expectancy. This theory postulates that the effort a
person exerts towards a specific task is a function of his
or her perception of the probability that the effort will
result in the successful completion of the required task.
The belief that successful performance will result in
desired outcomes such as rewards, and the attractiveness and
importance of these results to the individual influences the
individualus behaviour.
Anderson and Chambers (1985) indicate that individual
decision-makers are largely motivated by intrinsic and
extrinsic rewards during the organisational decision-making
process. Intrinsic rewards are those such as the feeling
of accomplishment, whereas extrinsic rewards such as salary

60
increases and promotion are distributed by the organisation.
Hutt and Speh ( 1992:114) explain that purchasing managers
will show preference to those suppliers that will allow them
to achieve the maximum extrinsic reward. The attributes
individual members will emphasise · in evaluating
organisational suppliers are likely to reflect the reward
and measurement systems of their work group. Organisational
buyers ·may then be rewarded for reducing material costs,
whereas the technical personnel may be rewarded for
improving the product. Morris ( 1988) concludes that, in
order to capitalise on individual characteristics, the
supplier may try to ensure that decision-makers will view
his product as instrumental in ensuring a successful task
performance. The marketer can assist the buyer to fulfil a
specific role or project an image such as a problem solver,
good negotiator, or ~hrewd decision-maker.
While the influences on organisational
provide insight into the buying centre,
general models available that attempt
integrated picture of the major factors
explain organisational buying behaviour.
frameworks will now be reviewed.
buying behaviour
there are several
to provide an
that combine to
Four of these

61
3o7 ~ODELS OF ORGANISATIONAL BUYING BEHAVIOUR
Organisational buyer behaviour models attempt to provide an
integrated and comprehensive scenario of the major factors
that combine to explain buyer behaviour (Morris 1988). Four
of the best known models, considered by many (Johnston 1981<
Hill & Hillier 1982; Moriarty 1983) to present well
developed, comprehensive approaches to industrial buying
are:
o The Robinson, Faris and Wind Buy Grid Model (1967).
o The Webster and Wind Organisational Buying Model (1972).
o The Choffray and Lilien Industrial Market Response Model
(1978).
o The Sheth Industrial Buying Behaviour Model (1973).
These organisational buying behaviour models will now be
reviewed.
The Buy Grid Model
The buy grid model was developed by Robinson, Faris and Wind
(1967) in a descriptive study of three organisations and a

62
large number of buying situations actually experienced by
them.
An eight stage model of the purchasing process was combined
with three types of purchase situations, the new task, the
modified rebuy, and the straight rebuy. The three types of
purchasing situations were defined in three different
dimensions (Johnston 1981:20). Firstly, the recentness of
the purchasing problem, secondly, the amount and kind of
information required, and thirdly, the extent to which new
alternatives were considered.
A new task buying situation is created when the organisation
has no previous purchasing experience, requires additional
information, and considers various alternatives to solve the
purchasing problem. (Eckles 1990; Johnston 1981). The
modified rebuy situation occurs when the need to replace an
existing product or service arises (Johnston 1981; Reeder et
a1 o 1987) o The situation is not completely new to the
organisation. However, new information or alternatives may
be considered. In a straight rebuy situation, previous
purchasing experience is available to the organisation and
buyers simply reorder from the existing supplier as no new
alternatives are considered (Hutt & Speh 1992; Johnston
1981) 0
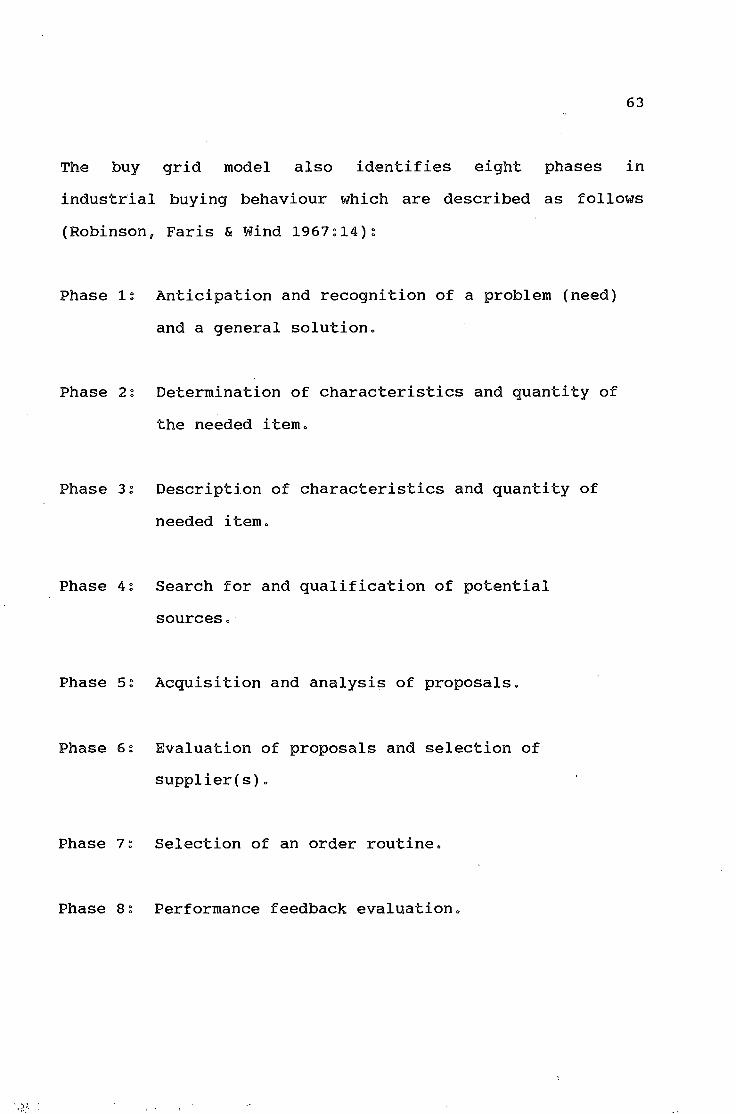
63
The buy grid model also identifies eight phases in
industrial buying behaviour which are described as follows
(Robinson, Faris & Wind 1967~14)~
Phase 1~ Anticipation and recognition of a problem (need)
and a general solutiono
Phase 2~ Determination of characteristics and quantity of
the needed itemo
Phase 3: Description of characteristics and quantity of
needed itemo
Phase 4~ Search for and qualification of potential
sourceso
Phase 5~ Acquisition and analysis of proposalso
Phase 6~ Evaluation of proposals and selection of
supplier(s)o
Phase 7~ Selection of an order routineo
Phase 8~ Performance feedback evaluationo

64
According to Robinson, Faris and Wind (1967:14), the
existence and duration of the eight buying phases depend
upon the purchase situation o
phases may exist.
In a new task situation all
When the situation is a straight rebuy, the organisation may
pass quickly through the phases, perhaps even missing one
(Johnston 1981) o Figure 3o3 shows the Robinson, Faris and
Wind model combining the buy classes and buying phases into
the two dimensional buy grid model.
JFJ[GUJRE JoJ THE ROB][NSON 0 JFAR][S and W][ND BUV GRID WODEL
!.Anticipation or recognition of a problem (need) and a general solution.
B 2.Determination of characteristics and u quantity of needed item. y 3.Description of characteristics and
quantity of needed item. P 4.Search for and qualification of h potential source. a 5.Acquisition and analysis of proposals. s 6.Evaluation of proposals and selection e of supplier(s). s ?.Selection of an order routine.
8.Performance feedback and evaluation.
BOY CLASSES
New !Ylodi.fi<!!!d Straight Task Rebuy Rebuy
Source Robinson, P.J., Faris, c.w., & Wind, Y. 1967.
Industrial Buying and Creative Marketing.
Boston : Allyn and Bacon.

65
The buy grid model was a major advancement in understanding
the buying process and a useful analytical tool for both
academic and marketing practitioners interested in
organisational buying behaviour (Moriarty 1983). A further
merit of the model is that it suggests that the purchasing
process is incremental and that the buying centre
composition and behaviour will be related· to the problems
which the purchase presents the buying organisation (Hill &
Hillier 1977:140)9 The buy grid model has, however, several
limitations which made it unsuitable for this study.
Johnston ( 1981:20) points out that the purchase typology
presents a problem in that it confounds a minimum of three
separate dimensions of the purchase situation. The relative
importance of the purchase, the newness of the product to
the organisation, and the complexity or difficulty of
evaluating the buying alternatives all seem to be grouped
together. For example, in the case of an organisation
contemplating the purchase of minor office supplies such as
pencils which were not bought before (new task), the buy
grid would predict a more drawn-out process than a pu!chase,
for instance, if the same company would be replacing its
fleet vehicles (Johnston 1981:20).
According to Hill and Hillier (1977:140) another limitation
is that the buying phases tend to indicate a static rather
than a dynamic situation, and are procedural or activity-

66
orientated rather than decision orientated"
An additional criticism is that the model is empirically
based (Johnston 1981:20) It seems to be a near impossible
task for a marketer to identify the actual and potential
customers that would fall into each of the three buying
situations, unless a detailed analysis on an individual
basis was conducted.
The organisational buying behaviour model developed by
Webster and Wind (1972) was an attempt to integrate a large
variety of individual, interpersonal, interorganisational,
and environmental variables into a single framework" The
Webster and Wind model shown in figure 3o4 implies that all
these determinants affect individual and group decision
making processes and the purchasing decision (Moriarty
1983)o
The model identifies the environmental influences as
economic, technological, physical, political, legal and
cultural factors" Webster and Wind (1972) point out that
these forces tend to be subtle in established markets and
may act as constraints on the buying goals of the
organisation"

FIGURE Jo4 THE WEBSTER AND WIND MODEL OF BUYING
Ill. The buying center
tlntergersonal determinants ol buying behavior!
BEHAVIOUR I. The environment {environmental determinanu ol buying behaviorl
Phy1ical environment Technological environment
Economic environment Political environment
legal environment Cultural environment
II. The organilation (organiational determinants ol buying behavior!
The organilational climate; physical, technological, economic. cultural
Organizational technology
Technology relevant for purchasing
Technological cons!taims and technoloq·f available to the group
Organizational structure
Organiation of the buying center and the purchasing function
Grouo structure
Organizational goals and tasks
Buying tasks
Group task
Grouo processes
IV. The individual participants
Organizational factors
Members or the buying center
Member characteristics and goals, leadership
Motivation. cognitive strucrure, personality, learning process. perceived roles
Buying decision process I. Individual decision· making unit
2 Group decision· making unit
source Webster, F.E. & Wind, Y. 1972.
Buying Behaviour. New York
Organizational
Prentice Hall.
67

68
The organisation is in itself a source of influence on the
buying behaviour process also. Members "of the
organisational buying centre, defined as all individuals and
groups who are involved in the buying decision-making
process, are motivated and directed by the organisation's
goals, and constrained by the financial, technological, and
human resources of the company (Johnston 1981:21).
The third source of variables in the model is the internal
interpersonal dynamics of the decision-making unit. The
individuals in the unit may have different responsibilities
and may play different roles in the purchasing process. The
model describes the five buying roles as users,
influencers, buyers, deciders and gatekeepers. Webster and
Wind (1972) point out that an individual may play more than
one role, and that each role may be performed by more than
one individual.
The section of the model that deals with individual
influences includes psychological factors such as
personality, motivation, cognition, learning processes,
decision rules, and perceived risk (Moriarty 1983). Webster
and Wind (1972) see organisational buying as a decision
making process which is carried out by individuals in
interaction with others inside the formal organisation.
69
The model succeeds in providing some indication of how
buying ·decisions originate from combinations of individual
and group decision processes, each of which can be
influenced by individual, group, organisational, and
environmental factors. The model also attempts to indicate
the difficulties involved in portraying th·e complex nature
of organisational buying behaviour (Hill & Hillier
1982:142). The Webster and Wind model, however, fails to
establish how to identify the individuals within the
organisation that play the various roles in the buying
centre, yet it emphasises the need to understand the
psychological characteristics of the members involved in the ,
buying centre (Johnston 1981:21).
Viewed in its entirety, this model has made a significant
contribution to describing organisational buying behaviour
(Moriarty 1983). According to Johnston (1981:21), the model
allows a retrospective explanation of the purchasing
decision. Webster and Wind ( 1972.), however, do not claim
that their model is prescriptive and admit that they have
not established precisely how buying decisions are made.
This limits the model's use for this study.

70
The Industrial Warket Response Wadel
The industrial market response model was developed in 1978
by Choffray and Lilien. The major components of the model
shown in figure 3.5 are broken down into: controllable
variables, the decision process, and external measures. The
controllable variables are the marketing support given to
the product to be marketed and its design characteristics.
The decision process is divided into four sub-models
depicting awareness, acceptance, individual evaluation, and
the group decision process. External measures include the
communication consumption for each individual participant of
the purchasing process, environmental constraints and
organisational requirements, individual perceptions and
evaluation criteria, and group process variables (Johnston
1981).
The model is based on two assumptions (Moriarty 1983:38).
o The composition of the organisational buying centre may be
characterised by functions of the individuals involved in
the purchasing process.
o Decision participants who are members of the same category
share the same set of product evaluation criteria and the
same sources of information.

71
FIGURE 3o5 THE CHOJli'FRAY-LILIEN MODEL OF BUYER BEHAVIOUR
I Evoked set of I r----------------------------
I alternatives I I Individual responsibilities
I
+ I comprising the buying center
f I t I I I
Environmental I constraints Organizational I
4-- Sources Physical requirements of Evaluation Interaction Technological Technical I information criteria structure Economic Financial I Social
L _______________ ----------1----
t t t
Feasible set of alternatives
t Formation of
individual preferences
t Formation of
organizational preferences
t Organizational
choice
Source Choffray, J. & Lilien, G.L. 1978. Assessing
response to industrial marketing strategy.
Journal of Marketing. vol. 42:22.
--, I I I I I I I I I I I I I I
_j

72
Based on these assumptions, the model has several
shortcomings which limit its use for this study. The first
assumption constrains the model to an non-dimensional
category which does not allow for variation within functions
as a result of job grades or vice versa (Moriarty 1983).
The second assumption does not allow for individual
differences and it excludes educational background, age, and
the experience of individuals in the same or similar
functional areas of the organisation (Johnston 1981;
Moriarty 1983). Later studies show that individual motives
may differ extensively within the same functional areas and
they may change over time (Hutt & Speh 1992; Johnston 1981).
The Indust~ial Buyer Behaviour Wedel
The industrial buyer behaviour model shown in figure 3. 6,
was developed by Sheth ( 19 7 3 ) ·and represents a stimulus
response model of the purchasing process. The model can be
broken down into four components :
o The expectations of the individual decision making
participants.
o The industrial buying process~
o The decision-making process.
o Situational factors.

73
FIGURE 3o6 THE SHl!.."'rH INTEGRATIVE MODEL OF BUYER BEHAVIOUR
Specialized I Role I Life-style I (4) (lb) education orientation Situational
Information l I l factors
sources
v Salespeople
(lei (lal (lei
1-4--- Active ~ Background Satisfaction
~---------------------, search of the with I Exhibitions and I individuals purchase I
trade shows I I
l v : ~ ~ Direct mail (1) I Autonomous I I Expectations of decisions 1
I I
...p 1. Purchasing agents I
Press releases 2. Engineers
I Supplier or I 3. Users 4. Others brand choice
t Journal (2) advertising Industrial
I ~ buying Joim (31 process decisions Conflict
Professional resolution and technical 1. Problem solving conferences 2. Persuasion
3. Bargaining (2al (2b) 4. Politicking
Trade news Product specific Company-specific factors factors
Word-of-mouth
(ld) Others !--? Perceptual
distortion
I I I I I I l Time II Perceived II Type of I I or.ganiz~tion II Organization ~ [ Degree of I
pressure ris~ purchase onentauon SIZe centralization
source Seth, J.H. 1973. A model of industrial buying
behaviour. Journal of Marketing. vol. 37:52.

74
The model explains the expectations of the individual
decision participants as a function of the background of
individuals, sources of information and the result of an
active search, perceptual distortion, and satisfaction with
past purchases.
In describing the industrial buying process, the model
indicates two types of determinants . 0 product specific
factors (time pressure, perceived risk, and type of
purchase) and company specific factors (organisational
orientation, size and degree of centralisation). The
industrial buying process is then split into autonomous
decisions and joint decisions. The model identifies four
methods of conflict resolution during joint decision making:
problem solving, persuasion, bargaining and politicking.
Finally, the industrial buyer behaviour model indicates
situational factors as an influence of supplier choice.
The Sheth model does have limitations in that it does not
elaborate much on the industrial buying process and how the
relationships between the variables may change during that
process (Moriarty 1983:40). In addition, as a stimulus
response model it gives only a vague description of the
various conflict resolution methods used in group decision
making (Moriarty 1983!40).

75
The Sheth model of industrial buyer behaviour was selected
as a basis for the research for this dissertation for the
following reasons :
o The model includes time pressure in the product-specific
factors, and indicates that situational factors may
influence the decision-making process. Furthermore, the
information-gathering activities linked with the buying
decision process are shown as being continuous, although
variable, rather than occurring at a set time in the
decision-making process (Hill & Hillier 1977:142).
o The model recognises that differences between individual
members of the buying organisation exist with regard to
their expectations about product characteristics and
suppliers. Empirical research pertaining to purchasing
policies and practices of buyers, observations of
industrial buyers, theories,
industrial buying have been
(Johnston 1981; Moriarty 1983).
models, and reports on
inc! uded in the model
o Sheth's model considers product specific, company
specific, and individual difference variables to reconcile
and connect empirical and conceptual studies thereby
attempting to describe the complexities of organisational
buying behaviour.

76
o The model succeeds in describing the most important
explanatory variables in a systematic, yet generalised
stimulus response models of industrial buyer behaviour
(Moriarty 1983:41).
By selecting Sheth's model as a basis for the research for
this dissertation, it is hoped that further information on
industrial buyer behaviour in the South African leather
industry will emerge, and that Sheth's model may be tested
in the local industry segment.
Chapter 3 discusses the background to organisational buying
behaviour. Organisational buying motives have been
identified as both rational .and emotional which may
influence the organisational memberPs buying behaviour.
Rational motives have been described as mainly the economic
needs of the company, whereas emotional motives refer to
human factors (Eckles 1990). Organisational buying is
viewed as a process, rather than as a series of isolated
acts, and consists of several phases. Morris (1988) points
out that the decision-making process may not be the same for
all types of products. The same product may elicit
different buying patterns in different companies that have

77
different levels of experience and information (Hutt & Speh
1992). · Three types of buying situations were identified and
related to the sequential buying phases. In each of the
buying situations, various members of the organisation may
be involved in the decision-making process, forming the
buying centre. Members lnvolved in the organisational
buying centre usually adopt one or more of the five distinct
roles : users, influencers, buyers, deciders and gatekeepers
(Eckles 1990).
The organisational buyer may be influenced by forces from
within or outside the organisation. Hutt and Speh ( 1992)
identified four buying behaviour influences ~ environmental,
organisational, group and individual forces.
The four models of organisational buying behaviour reviewed
in this chapter provide some understanding of the industrial
buying process. The buy grid model shows how the decision
process varies according to the type of purchase. The
Webster and Wind m6del identifies many of the :complex
variables that affect industrial buying. Choffrey and
Lilienus model attempts to operationalise some of the
behavioural concepts of industrial buying and Sheth depicts
in diagrammatic form, the interrelationships between the
many complex variables affecting organisational buying
behaviour (Moriarty 1983).
78
Although each of the four models discussed in this chapter
have their strengths and weaknesses, the Sheth model was
selected a basis for the research for this dissertation.
The Sheth model succeeded in demonstrating the complexity of
industrial buying behaviour in an explanatory and systematic
way, and provided a descriptive yet generalised stimulus
response model which unified a wide variety of theories 1
concepts, and empirical research.

79
IRES:EARCJH[ J?.mTJHIOOOLOGY
This chapter discusses the research methodology for the
investigation of organisational buying behaviour in the
South African leather industry. As the objective of this
study is to find answers to the expectations of individual
decision-makers about the dyes and chemicals they use, their
sources of information, the extent of joint decision making,
possible conflicts that may arise, and to test a model of
organisational buying behaviour in the South African leather
industry, various available sources of data need to be
.consultedQ Secondary data in the form of trade journals and
magazines specific to the leather. industry, as well as books
on marketing and survey research are reviewed with reference
to this study.
The three types of primary research, namely observation,
survey research and experimentation are reviewed and
evaluated. The available data collection methods such as
personal interviews, postal questionnaires and telephone
interviews are discussed with regard to their suitability
for this research. This is followed by a discussion on

80
the design of the questionnaire, the type of questions and
the sequencing of the questions. Attention is then given to
the covering letter and methodological limitations that may
affect this research.
Secondary data involves data that has already been
researched and collected for purposes other than the
specific research requirements of this study (Dillon, Madden
& Firtle 1993 ~ 78). The existing data is in the form of
published or semi-published
magazines and books (Hague
research of the available
information such as
& Jackson 1990).
literature revealed
journals,
Secondary
sufficient
background information on industrial buying behaviour to
form the basis for this study. A review of trade journals
and magazines specific to the leather industry such as the
s. A. Shoemaker, Leather Review, Shoes and Views, Leather,
and World Leather provided information on the South African
tanning industry, its structures, its production orientation
and the development of the industry.
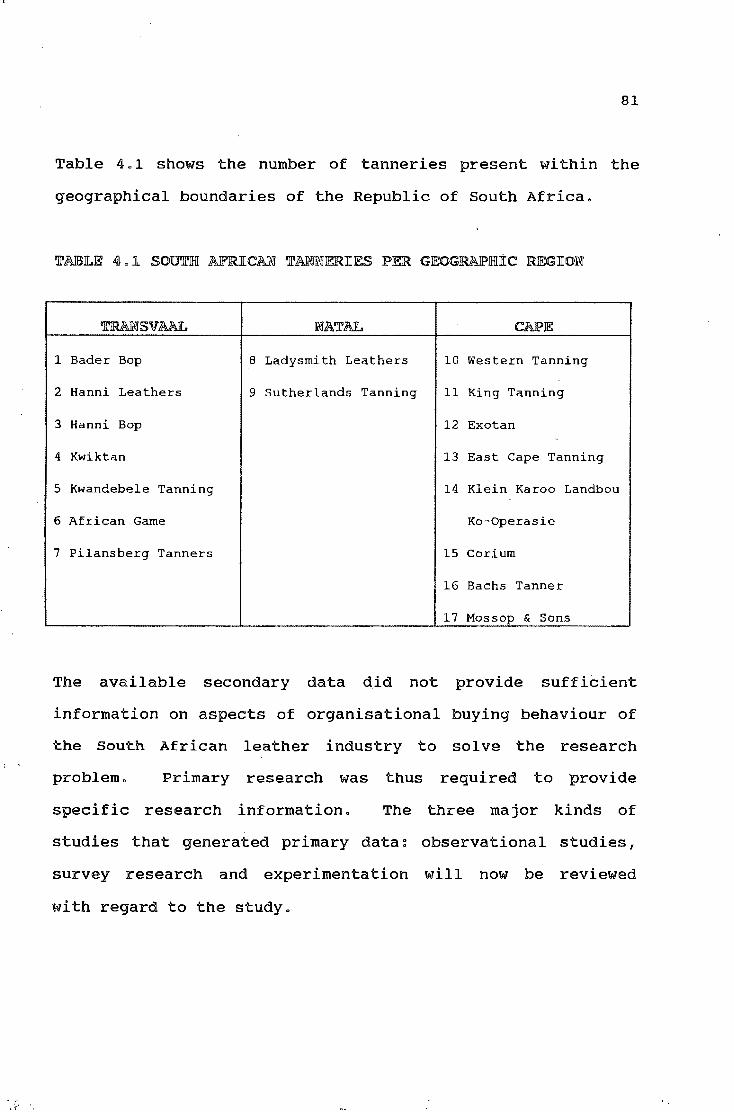
·.r
81
Table 4.1 shows the number of tanneries present within the
geographical boundaries of the Republic of South Africa.
TlRAJNrSVMJI. ~ATAJL CAPE
1 Bader Bop 8 Ladysmith Leathers 10 Western Tanning
2 Hanni Leathers 9 Sutherlands Tanning 11 King Tanning
3 Hanni Bop 12 Exotan
4 Kwiktan 13 East Cape Tanning
5 Kwandebele Tanning 14 Klein Karoo Landbou
6 African Game Ko-Operasie
7 Pilansberg Tanners 15 Corium
16 Bachs Tanner
17 Mossop & Sons
The available secondary data did not provide sufficient
information on aspects of organisational buying behaviour of
the south African leather industry to solve the research
problem. Primary research was thus required to provide
specific research information. The three major kinds of
studies that generated primary data: observational studies,
survey research and experimentation will now be reviewed
with regard to the study.

82
Secondary data on aspects of organisational buying behaviour
in the South African leather industry was not available
through published data, statistics or studies. The research
problem could not. be solved without 'initiating primary
research into the selected topic.
Primary data can be defined as original data
specifically tailored to the problem on hand
Houston 1985:794; Nel, Radel & Loubser 1990:21).
which is
(Busch &
Observational studies, survey research and experimentation
are the three major types of studies that generate primary
data (Busch & Houston 1985; Dillon et al. 1993).
Table 4. 2 summarises the three types of primary research,
the options available as well as the advantages and
disadvantages of each type of research.

-_' .. ,
83
TABLE 4.2 THREE TYPES OF PRIMARY RESEARCH
TYPE OF STUDY DESCRIPTION OPTIONS ADVANTAGES DISADVANTAGES
Observation Study phenomenon in its Direct observation. Valid measures. Limited scope of
natural setting. Participation- variables.
observation.
Mechanical observation.
Physical traces.
Survey research Study characteristics of Personal interviews. Wide scope of Costly.
population through Telephone interviews. information can be Wide scope of
questionnaire. Mail questionnaires. gathered. expertise needed.
Drop-off questionnaires.
Experimentation Test causal relationship Field experiments. Deep level of Realism difficult to
between variables. Laboratory experiments. inquiry that achieve in
contributes to laboratory.
understanding. Control difficult to
achieve in field. -- -----
Source Busch, P.S., Houston, M.J. 1985. Marketing: Strategic Foundations.
Irwin: Homewood: 794.
84
Observational studies attempt to study a phenomenon in its
natural ·environment. Four observational approaches are
available (Busch & Houston 1985; Dillon et al. 1993).
The first method relies on direct observation re-studying a
phenomenon as it occurs without disturbing it, for example the
observation of automot.i ve traffic volume patterns. The second
method involves the researcher observing a phenomenon by
actually participating in it, such as posing as a potential
customer in order to study the tactics of retail sale_s people.
The third method employs mechanical devices in the measurement
of the phenomenon, for example counting traffic volume patterns
by placing a cable across the road. The fourth method involves
the measurement of a phenomenon by examining its physical
residues u for example measuring a town 1 s alcohol consumption
not by monitoring the sales of alcohol, but by investigating
the contents of rubbish deposited at the town's dump.
The major advantage of the observational research study,
according to Busch and Houston (1985:795), is that the
phenomenon is investigated in its natural environment and
thereby provides valid measures. Barker (1983:54) also
indicates that this method is appropriate in gathering facts.
However, the observational method proves inefficient when a
phenomenon occurs sporadically that when the f ieldworker may
encounter periods of idleness. Furthermore, the researcher
. ··.;t;:. •. . '

85
who uses the observation method, must resolve·ethical and legal
.questions of an individual 1 s right to privacy especially when
observations are undertaken without the subjectus consent.
Busch and Houston (1985:795) indicate that variables of
interest in marketing research such as consumer beliefs and
attitudes are not observable. This limits the usefulness of
this type of study as the aim of this dissertation is the
testing of a model of industrial buying behaviour in which the
respondents beliefs and attitudes are important to the validity
of the research. The observational method for the collection
of primary data is thus not sui table as a data collection
method for this study.
The second type of primary research is experimentation. Busch
and Houston ( 1985 ~ 796) define this method as an attempt to
isolate and test the effects of an independent variable on a
dependant variable by manipulating the levels of the
independent variable, measuring the dependent variable, and
controlling the effects of any extraneous variable. The scope
of information required in an experiment is much more specific
than in other sources of data. An experiment examines
information on cause and effect relationships, thereby
contributing to the understanding of the phenomenon. The two
types of experiments available are field and laboratory
experiments. According to Busch and Houston (1985:796) a field
experience test course affects relationships in a natural
86
environment. A successful field experiment may provide
realistic information on what will happen when, for example, a
change in the marketing decision variable occurs. The drawback
is, however, the lack of control over the effect of extraneous
variables on the dependant variable. Laboratory experiments
resolve this problem by testing for causation in highly
controlled laboratory environments, but lose the realism of the
field. This results in the tenuous transfer of the
generalisation of laboratory findings to the market place.
Both Barker (1983:60) and Busch and Houston (1985:797) indicate
that. field experiments must trade off close control of the
environment for external validity. Laboratory experiments
achieve internal validity by the maintenance of a controlled
environment but lack external validity. The major application
for the experimental method would be in areas such as the test
marketing of new products or an advertising campaign. As it is
t.he objective of this research to test an industrial buying
behaviour model in the South African leather industry, external
validity and application is of particular importance :to this
study. The experimental method of collecting primary research
data is thus not suitable for this study.

87
The final type of primary research is research by survey. This
method of research studies the characteristics of a population
through questionnaires (Busch & Houston 1985:794).
Questionnaire administration can be divided into two types,
namely interviewer-administrated and self administrated
questionnaires. Interviewer-administrated questionnaires can
be presented in two ways. Firstly, a personal interview is
undertaken by an interviewer who deals with the questionnaire
and the respondent personally. The second interviewer
administrated survey is the telephone interview. This option
requires the interviewer to deal with the questionnaire by
telephone. Thirdly, the self-administered questionnaire is
mailed to the respondent who then completes 'it and returns it
to the researcher (Busch & Houston 1985; Dillon et al. 1993).
The advantage of a survey is that it can gather a wide range of
information at one time about an individual respondent. The
data may include depth and extent of knowledge, attitudes,
interest and opinions, behaviour, past present or future, and
classification variables such as demographic and socio-economic
measures of income, occupation, and age (Baker & Day 1990:187;
Busch & Houston 1985:796). These advantages together with its
adaptability to the research objectives (Baker & Day 1990) make
the survey method suitable for collecting primary research data
for this research.

,n..,.
88
The objective of this study is to test a model of
organisational buying behaviour and to draw conclusions about
the South African leather industry.
The success of the research design will be partly determined by
how well the population of interest to this study is
represented by the tanneries included (Busch & Houston_1985).
One method of ensuring representation is to conduct a census
survey of the entire south African leather industry. Usually
the costs associated with a census survey prohibit this
approach (Dillon et al. 1993). However, only 17 tanneries that
use dyestuffs and chemicals in their manufacturing process were
identified. This limited population makes the
compilation/drawing of a sample very difficult and likely to be
non-representative should one of the larger and important
tanneries not be included in the sample (Barker 1983).
To ensure the representation and validity of this study, all
members within the limited population in question had, of
necessity to be included in the study. With the selection of
an appropriate data collection method, the costs associated
with a census could be limited and executed cost-effectively.
Before the collection of data, the scope of the study needs to
be defined and discussed.
89
The scope of this study comprised tanneries that convert raw or
semi-processed (wet-blue or vegetable tanned) hides andjor
skins into finished leather. The geographical boundary was
limited to the Republic of South Africa. For the purpose of
this research, the former self-governing/homeland states were
included in the greater South Africa area, as most of the major
tanneries such as Bader Bop, Hanni Bop and Sutherlands Tannery
fell within these areas. Exclusion of these tanneries could
affect the results of this study. A total of 17 tanneries were
found to operate within the geographical boundaries of South
Africa (see table 4.1).
This research concentrates on the aspects of organisational
buying behaviour in the South African leather industry, with
specific reference to the purchasing of dyestuffs and
chemicals. The target population which can be defined as a
defined set of organisations holding information of interest to
the researcher (Dillon et al. 1993) included the following~
90
o The selected organisations had to use dyestuffs and
chemicals in their manufacturing process.
o All organisations included in this study had to be located
within the boundaries of the Republic of South Africa.
o Each organisation in the target population converted raw or
semi-processed hides andjor skins into a finished leather.
o The technical manager of each tannery was selected as a
respondent. Pre-testing of the questionnaire took the
assumption that the specified person would be involved in the I
decision~making process regarding dyestuffs and chemicals.
The identified characteristics of the target population now
serve as criteria for the selection of an appropriate data
collection method which will now be reviewed.
Data may be collected be means of observation using the
following options ~ personal interviews, mail questionnaires
and telephone interviews. Each of these available options had
unique advantages and disadvantages with regard to this study
and will now be discussed.

91
Personal interviewing is the most versatile method of data
collection as it allows both audible and visual contact with
the respondent (Babbie 1990:171; Busch & Houston 1985:795).
Through personal interaction, the researcher is usually able to
extract not only additional comments, but also a full
disclosure of attitude. This advantage, coupled with a
generally achievable response rate of 80 percent and a fast
completion rate ranked the personal
telephone interview (Babbie 1990:71;
interview second to the
Barker 1983:242). This
made this method of data collection an attractive alternative.
This option, however, had several limitations. Firstly, due to
the wide-spread geographic distribution of the tanneries
included in this survey, the costs associated with data
collection, such as airfares, hotels, and car rentals,
presented a severe financial limitation. Secondly, the
alternative to recruiting a field force of interviewers in each
of the selected provinces, would also have proven costly and
time consuming as training would have to be provided in order
to prevent possible interviewer bias. Interviewer bias may
occur when the interviewer gives some indication of an approval
or disapproval of a respondent's answer which may in turn
influence the response to subsequent questions (Dillon et al.
1993:164).
92
The limitations of the personal interview method, in this
study, outweighed its advantages and therefore it was not
suitable as a data collection method for this study.
Wail Questionnaires
This method of data collection allows the questionnaire to be
posted directly to the respondents included in the study. The
respondents would be asked to complete the questionnaire in
their own time and return it by the same means in a self
addressed envelope (Babbie 1990:160). This approach
represented the least expensive alternative of data collection
since the population was widely dispersed throughout South
Africa (Alreck & Settle 1985). The mailed questionnaire allows
the respondent to seek .and find information he cannot furnish
by memory. The questionnaire method also means minimal
administration for the respondent as it may be completed at a
time chosen by the respondent rather than the interviewer.
Barker (1983:240) points out however, that there is no
assurance that the respondent will complete the questionnaire.
The most serious limitation of the mail questionnaire method is
the relatively low response rate. According to many authors
(Alreck & Settle 1985:45; Barker 1983g241; Nel et al. 1990:187)
mail surveys often produce a response rate of below 50 percent.

93
Dillon, et al. (1993), indicate that with prior notification
and follow-up mailing such as sequence of mailings, non
responses may be significantly/successfully reduced" Nel, et
al. (1990:195), however, conclude that follow-up techniques
extend the data collection period and do not accelerate the
speed of completion and returning of the questionnaire, nor do
they affect the quality of the response.
The possibility of a low response rate was a limitation as far
as this study is concerned. The identified population numbered
only 17 tanneries and a high response is therefore important.
A low response rate of below 50 percent would have lead to the
strong possibility of a non response bias and a disproportional
representation of the leather industry. This would undoubtedly
have affected the vali?ity of the study.
The limitations of the mailed questionnaire method of data
collection were greater than the advantages.
thus not selected for this dissertation.
This option was
This data collection method allowed the questionnaire to be
administered over the telephone. Thus there was no need to
venture into the field, nor to establish, train, or monitor a
field force. While the personal interview method or the mail

94
questionnaire method may take weeks or months to be completed,
telephone interviews can be completed in much shorter period of
time (Alreck & settle 1985; Barker 1983). A telephone
interview only allows aural contact with the respondent as
opposed to both aural and visual contact possible in the
personal interview method. According to · Alreck and settle
( 1985) this may mean . a possible limitation in the telephone
interview method, as eye contact coupled with the physical
presence of another individual may affect the respondent 0 s
attitudes, moods and co-operation. In a later study by Babbie
( 1990:72), it is, however, indicated that the interviewer 11 s
presence should neither affect the respondent o s perception of
the question nor the answer given. Interviewer bias may even
be created if the interviewer does not project a neutral medium
through which questions and answers may be transmitted. Barker
(1983:246) found that respondents would be more willing to
disclose information to an impersonal voice over the telephone
as they feel they have greater anonymity when responding.
According to Babbie (1990~171), a properly designed and
executed telephone interview survey is likely to achieve a
response rate of between 80 and 85 percent. This is supported
by Dillon, et al. (1993:168), who indicates that frequently a
response rate of up to 80 percent may be attained with
telephone interviews.

. ~'" ' ... ;. ::.~
95
The high response rate of the telephone interview method
compares favourably with the personal interview method,
however it costs much less. Of all the applicable methods for
collecting research data on the south African leather industry,
the telephone interview method was selected as it is relatively
cost-effective, and can be completed within a short period of
time with a probable high response rate.
As the purpose of a properly designed interview is to achieve a
high response rate (Babbie 1990) the questionnaire design will
now be discussed.
In preparing the questionnaire, the researcher must_ envisage
the respondent replying to the questions and the conditions
under which the questionnaire is administered (Dillman 1978).
Responding to a telephone call may be difficult. The
respondent is called to the telephone unexpectedly. Feelings
of reluctance, anxiety, or even excitement may be prevalent.
Respondents may be contacted in the middle of their daily
activities. A misinterpreted question could give rise to an
incorrect answer and lead to a recording error. Furthermore,
the respondent 1 s concentration may be impaired by the location
of the telephone which may make the task of responding

96
inconvenient, for example inside the production area of the
tannery. Dillman (1978:202) indicates that these
considerations have several implications for the design of the
telephone questionnaire. From the onset, subtle ways must be
found to persuade the respondents, to discontinue activities
that may distract their attention from the interview. One
example is the insertion of open-ended questions that require
the respondent to formulate their own responses.
During the actual data collection it was found that respondents
had to be contacted several times, and specific times arranged
for the telephone interview. Most respondents were not willing
to answer questions during the first contact mainly due to time
pressure.
To introduce and lend credibility to the questionnaire, a
letter sanctioned by UNISA was mailed to each respondent prior
to the telephone interview (see appendix c) • This served to
inform the respondent that he could expect a call from the
researcher within the next week (see appendix C). The
researcher conducting the interviews was himself actively
involved in the South African leather industry, and a member of
the South African Leather Technicians Association.

97
At the beginning of the interview, the researcher gave a short
description of the purpose of the studyo The prospective
respondent was also informed that all the information given
would remain completely confidential (see appendix B).
The compilation of the questionnaire took into consideration
the alternative types of questions available. According to
various sources (Aaker & Day 1990> Barker 1983) three types of
questions need to be considered:
o Open-ended questions with no classification'
o Open-ended questions with precoded classifications:
o Closed or structured questions.
First, open-ended questions, with no classification, where the
researcher attempts to record the response verbatim. Secondly,
open-ended questions where the researcher makes use of precoded
classifications to record responses. Thirdly, a closed or
structured format that presents the respondent with a question
or supplementary information to be considered. These, options
will now be reviewed with regard to the research requirements
for this study.

98
Open-ended questions that allow the respondent to choose any
response deemed appropriate (Dillon et alo 1993~309) were used
in three questions such as ~ aawhat do you think other members
of the production department's selection criteria for dyestuffs
and chemicals would be?~ This type of open-ended question was
used to obtain the respondent's wide range of experiences,
interests, sentiments and motives (Aaker & Day 1990; Dillon et
al o 1993) o A disadvantage of this type of question is the
researcher's possible inability to record verbatim answers
quickly, or summarise the response accuratelyo
Furthermore,
during the
1993g310)o
open-ended questions
interview and during
These limitations were
are time
tabulation
overcome
consuming, both
(Dillon et alo
by limiting the
open-ended question format to three questions, and by asking
dichotomous filter questions which enable responses to be
grouped into yesjno categorieso
The limitations of accurately summarising or recording verbatim
responses were overcome by the researcher's active involvement
in the leather industry which improved data collection as
industry specific terms and information are more easily
understood and recordedo
· .. ~

·'<>''
99
Open-ended questions that make use of precoded classifications
to record responses can be defined as a more structured form of
this sort of question. Respondents are free to choose their
answers but the question itself is direct and to the point
(Barker 1983~229).
Three directed response questions and sixteen questions of the
checklist type were included in the questionnaire such as ~
QF2) How many years have you been with your present company ---
QF3) What type of specialised education do you have
National Diploma (Leather/SA)
University Degree (BSc)
Local Technical Diploma (Leather)
International Technical Diploma (Leather)
Certificate of Competence (SA)
Other, please specify
---------------------------------=---==-c=
Several answer options were put before the respondent.
1
2
3
4
5
6
If no
suitable answer was selected, the respondent had a further
opportunity to specify his own response. This question format
facilitates coding and analysis and provides additional
information in the open-ended specific section, as well as
measuring knowledge and possible attitudes (Barker 1983).
'!.,,

100
Close-ended questions provide the respondents with
predetermined choices within which they are asked to select one
t.hat best describes their feelings (Dillon et al. 1993 ~ 310).
Three basic forms of close-ended or structured questions namely
dichotomous 1 and multiple choice questions were used for this
research. Fifteen dichotomous (yesjno) questions were used in
this research. This is the most restricted and structured form
of question as there are only two answers possible.
Dichotomous questions serve as efficient gatherers of facts
(Barker 1983~225) such as :
QA4a) Do you think that time pressure may affect your
decision :
No ------ 1
Yes ------ 2
The second form of close-ended or structured questions used was
the multiple choice.
structured 1 with the
The multiple choice question is highly
question itself and all the possible
answers presented to the respondent. There is only one correct
answer which the respondents need to recall. Eight multiple
choice questions were included in this questionnaire to obtain
facts and classification data 1 and to ascertain attitudes
(Barker 1983) such as :

101
Q2c) What role does your colleague play in the decision ?
Decision-maker ------- 1
Advisor ------- 2
Discussion partner ------- 3
Supervisor ------- 4
Other,pls specifY. ------- 5
The order and sequence of the questions is initially determined
by the need to obtain and maintain the respondent's co
operation and to design a questionnaire which facilitates
administration for the researcher (Aaker & Day 1990~251). When
designing the flow of the questionnaire, the following
procedure was selected (Aaker & Day 1990; Dillon et al. 1993).
The interview was introduced and the nature and purpose of the
study briefly explained to dispel any initial suspicions or
fears the respondent might have at.being interviewed. For the
purposes of this research a letter sanctioned by UNISA was
addressed to the respondent and mailed prior to the interview.
A short introduction to explain the purpose of the study was
given to the respondent prior to the actual start of the
telephone interview (see appendix C).

102
The type of questions included in the questionnaire used in
this study are categorised in Table 4o3o
QU:ES'li."IIOJW QUEST IOW QUJES'JL'IIOJOO QU:ESTIIOJW
~m 'JL'Yl?JE: Wlr.JWlB:EJR 'JL'Yl?:E
Al Dichotomous Cl Checklist
Ala Directed response C2 ChecklJ.st
A2 Dichotomous C3 Dl.chotomous
A2a Checklist C3a Checklist
A2b Checklist C4 ChecklJ.st
A2c Checklist C5 ChecklJ.st
A3 Dichotomous
A3a Open-ended Dl Dichotomous
A3b Open-ended D2 Multl.ple choice
A4 DJ.chotomous D3 Multiple choJ.ce
A4a Open-ended D4 Multiple choJ.ce
A5 Multiple choice D5 Dichotomous
A6 ChecklJ.st
El Checklist
Ela ChecklJ.st
81 Dichotomous E2 DJ.chotomous
Bla Multiple choice E3 ChecklJ.st
81b Multiple choJ.ce
B2 Dichotomous Fl Dl.rected response
83 Multiple choice F2 Dl.rected response
84 Dl.chotomous F3 D1chotomous
84a Checklist F3a Checklist
B4b Checklist F4 Multiple choice
B4c Dichotomous F5 DJ.chotomous
B4d ChecklJ.st F6 DJ.chotomous

103
The questionnaire was opened with an easy dichotomous question
to establish the confidence of the respondent in his ability to
answer the questionnaire. In this study, the first question
the respondents were asked was whether they were personally
involved in the decision-making with regard to the type of
dyestuffs and chemicals purchased. Only a yes or no was
required. If the respondent answered 'uno'', a structured open
ended question followed in which the respondent was asked to
indicate which person in the company would qe involved. The
interview was then terminated and the respondent thanked for
his timeQ The right person was then contacted after a pre-
mailed introductory letter was sent to him for his attention.
Sensitive and difficult demographic questions concerning
personal ability and income should generally be asked towards
the end of the questionnaireQ If such questions are' left for
near the end of the questionnaire, .other questions will not be
affected by a refusal and the respondent is also given time to
develop trust and confidence in the interviewer and the study
(Aaker & Day 1990; Dillon et al. 1993). In this questionnaire,
the demographic questions formed the final section and the
personal income question was left to the third last question.
The questions were generously spaced with arrows and boxes used
to guide the interviewer through the questionnaire.
104
The introductory covering letter mailed to the respondents
prior to the telephone interview will now be discussed.
A covering letter was. mailed to all potential respondents and
served to notify the individuals of the impending telephone
call. Dillon, et al. (1993~166), indicates that advance
letters appear to have a positive effect on response rates.
The reason for this method is that respondents may often react
with caution when they receive an unexpected telephone call.
The advance letter attempts to relieve wariness and create a
positive and co-operative disposition. With regard to this
study, an advance letter was addressed to the tannery manager,
explaining that a telephone call could be expected within the
next week (see appendix C). The respondents were informed that
the information received would be treated as confidential and
would be used for the purpose of a Master of Commerce Degree at
the University of South Africa. It was hoped that with the
pre-notification a higher response rate would be obtained.
105
The selection of a research design, the data collection method
and the characteristics of
methodological limitations.
regard to this study.
the universe resulted in several
These will now be reviewed with
The study was limited to aspects of organisational buying
behaviour of the South African leather industry with specific
reference to the purchase of dyestuffs and chemicals. A total
of 17 organisations were identified to be pertinent to the
study. It would thus be questionable whether this study could
be generalised to the remaining industries that require
dyestuffs and chemicals in their manufacturing processes.
The geographical area for this research was limited to the
borders of the Republic of South Africa excluding the Republics
of Lesotho and Swaziland. This imposed limitation allowed
specific information to be gathered about the industry· and was
therefore relevant to organisational buying behaviour in the
South African leather industry in specific.
The study was further limited to the leather industry only.
Although several manufacturing industries make use of dyestuffs
and chemicals, the study was restricted to the population of
106
this particular industry in order to gain specific information
on buying behaviour in the selected industry o Two purchasing
classes were examined, namely dyestuffs and chemicals o Both
purchasing classes were combined in the questionnaireo
Bias factors or errors that may affect research results will
now be reviewed.
OOo~-Respo~se Bias
Low response rates, caused by the refusal of respondents to be
interviewed may give rise to the potential for non-response
biaso Alreck and Settle (1985) indicate that the non-response
bias may have nothing to do with the actual content of the
survey o This results in the respondent not completing the
questionnaire because he does respond to the interviewer.
Alreck and Settle (1985) conclude that if individuals respond
purely on a random basis, there is no non-response bias. In
order to avoid this type of non-response bias, the
questionnaire was pretested with three tanneries (see appendix
D)o
The questionnaire was pretested to disclose major shortcomings
(Baker 1983~233)o The questionnaire was then revised and
retested. Weaknesses such as unclear instructions, words and
questions that were misunderstood by respondents and recording
107
spaces that were initially omitted were identified and
corrected~
The telephone interview method of data collection was selected
as an additional means of avoiding a low response rate which
could have affected the validity of this study.
Aff.imdLt.y JB.ias
When the selection of individual respondents within each
selected organisation is effected to a set plan by the
interviewer, an affinity bias may exist.
Alreck and Settle (1985:76) indicate that this may be relevant,
if the plan fails to identify precisely which individuals in
the company are to be selected. This may indicate bias on the
part of the interviewer. In order to avoid affinity bias in
this study, at the onset the respondent was identified as the
tannery manager in charge of the organisation. In the
pretesting of the questionnaire (see appendix D) it was found
that where a buying department existed, no decisions regarding
the type of dyestuffs and chemicals were taken by the tanneryus
buying department. In fact the buying department merely
executed orders and requisitions which emanated from the
tannery manager. The assumption that these managers took a
108
direct part in the decision-making process is tested in the
questionnaire.
During a lengthy interview, accuracy of response can decrease.
Respondents who were initially reluctant to participate because
t.hey were busy, become anxious about the length of time that
seemed to be required to answer the questionnaire. Aaker and
Day (1990:195) indicate that the resulting bias is likely to be
random. To avoid the time pressure and fatigue bias, the
telephone questionnaire was kept as short as 'possible.
Although a total of 45 questions were included in the
questionnaire, the majority of questions were short
dichotomous, checklists and multiple choice questions which
facilitated speedy completion. In the pretesting (see appendix
D) of the questionnaire an average of 19 minutes was needed to
complete a questionnaire. According to the pretested
respondents, the time allocation was acceptable.
Coll.ll.JCtesy !Bias
The tendency t.o limit answers to pleasantries to cause minimum
discomfort or embarrassment to the interviewer, or to avoid
appearing uncooperative may inflate responses to aided recall
(Aaker & Day 1990:195). The respondent's anonymity and

109
confidentiality in this questionnaire may have reduced the
possibility of courtesy bias and obtain realistic results.
Prestige Seeki~g a~d Social Desi~ability Respo~se
JBias
According to Aaker and Day (1990:195) respondents will distort
their answers to enhance their prestige in the eyes of the
interviewer and will not put themselves at odds with their own
perception of prevailing norms. Consequently, questions that
have prestige implications concerning income and education
level may be biased to reflect well on the respondent. Aaker
and Day (1990~195) also indicate that respondents may suppress
their own attitudes to mention inappropriate behaviours such as
violating environmental norms. It was hoped that by granting
the respondent anonymity and keeping his responses confidential
this bias would be limited.
The sampling bias can be described as the difference between
the results of sampling and a complete enumeration or census of
a defined population using the same data collection methods.
Bias is inherent in sampling as only a small part of the
available population is examined (Barker 1983:96).

110
The sampling bias was avoided in this study by conducting a
census of the entire population which consisted of 17
organisations.
I~tervieeer Bias
Interaction between the interviewer and the respondent can lead
to bias o If the interviewer should give an indication of
approval or disapproval of a response, subsequent responses may
be influenced. The interviewer may also misreport or even
falsify answers to questions (Dillon et al. 1993~164). To
limit interviewer bias, the questionnaire was administered via
the telephone which reduced the interaction between respondent
and the interviewer to aural contact only o Furthermore, the
interviewer 11 s aim must be to remain neutral to ensure valid
research results. The interviewer must be aware that
falsification of answers will affect the validity of the study
and render research results useless.
Chapter 4 discusses the research methodology for this study.
Secondary data sources of the South African leather industry
were reviewed and information gathered on the structure and
composition of the industry.

111
There was insufficient data to solve the research problem and
primary data needed to be generated. The researched universe
comprised a total of 17 tanneries which made the design of the
research extremely important in obtaining a representative and
valid study. A census method of research was chosen to ensure
maximum representation. To ensure that the high costs usually
associated with a census (Dillon et al. 1993) did not prohibit
its use in this study, careful evaluation and selection of the
data collection methods are done.
The telephone interview method was chosen because of its high
response rate which compared favourably with the personal
interview method (Babbie 1990~71i Dillon et al. 1993:168) and
because of its relatively low cost of telephone calls. A good
response rate is important to ensure the external validity of
the study.
Following the selection of the data collection method, the
questionnaire was designed with specific
telephone interview method. Finally
regard to the
methodological
limitations were identified and their possible effect on the
validity of this study discussed.
In the following chapter the research results will be
presented.

112
In chapter 4 the research methodology was described and a
method of data collection selected. The questionnaire was
administered by telephone and a 100 percent response rate
achieved.
The primary objective of the study is to test the Sheth
model of organisational buying behaviour in the South
African leather industry.
The secondary objectives include
o determining the level of joint decision making in South
African tanneries;
o identifying which methods of conflict resolution are used
during joint decision-making;
o identifying the degree of formalisation of the purchasing
policies of the individual tanneries;
o to establish selection criteria used for dyestuffs and
chemicals;

113
o to determine the information sources consul ted during a
new purchase situation;
and
o to determine whether tanneries have become
environmentally conscious.
The questionnaire was structured in six broad categories to
achieve the primary and secondary objectives.
Each category was based on the Sheth model of industrial
buyer behaviour.
The six categories include
o The purchasing decision
o Environmental and economic considerations
o Company orientation
o Product information sources and selection criteria
o Joint decision-making and product/supplier loyalty
o Demographic indications
Each category will be individually evaluated and related to
the stated objectives. These will now be discussed.

114
5.2.1 Purchasing Decisions
The first category of the questionnaire concentrates on the
purchasing decision as identified in the Sheth model. The
first question serves as a filter question and establishes
whether or not the selected respondent is involved in the
decision-making process when dyestuffs and chemicals are
involved.
Specific questions
respondents decide
were then
jointly
asked to
or alone,
determine if
and what
the
the
designation of the other members participating in the
decision-making process are. The respondents were asked
whether or not they would be held responsible for their
decisions and if time pressure affected their decisions.
Respondents were also asked whether they would consider
changing the product and/or the supplier in the event of not
being satisfied with their dyestuff or chemical purchase.
The last question in this section presented the respondent
with four buying situations. With specific reference to the
purchasing of dyestuffs and chemicals, the respondents were
asked to indicate in which situation they would decide :

115
autonomous or jointly with another member of the
organisation.
Question A1 served as a dichotomous filter question at the
beginning of the questionnaire. The respondent was asked
whether he was involved in the decision about which
dyestuffs or chemicals were to be purchased by the company.
In the event of the respondent answering negative, the
researcher had been given instructions to ask the respondent
whether he could indicate the person involved in such
decisions in the tannery.
The interview would then be terminated and the indicated
person contacted.
FIGllmE 5oJl. RESPONDENTS INVOLVED IN THE DECISIOOO-~IWG
PROCESS
Decision-Making Respondents

116
Figure 5.1 shows that all respondents indicated that they
were involved in the decision-making process about dyestuffs
and chemicals.
Question A2 is a dichotomous question requiring a single
answer. The respondent was asked whether he decided on
purchasing dyestuffs or chemicals alone, or whether he
needed the approval of another department(s).
The results of the question are shown in figure· 5.2 and
indicate that 33 percent of all respondents decide alone on
dyestuffs or chemical purchases, and 67 percent require
another member's or department's approval.
Jli"JIGlUJRJE 5a2
67%
Joint Decision Makers
AUTOWO~OUS AWD JOIWT DECISIOW MAKERS
33%
Autonomous Decision Makers
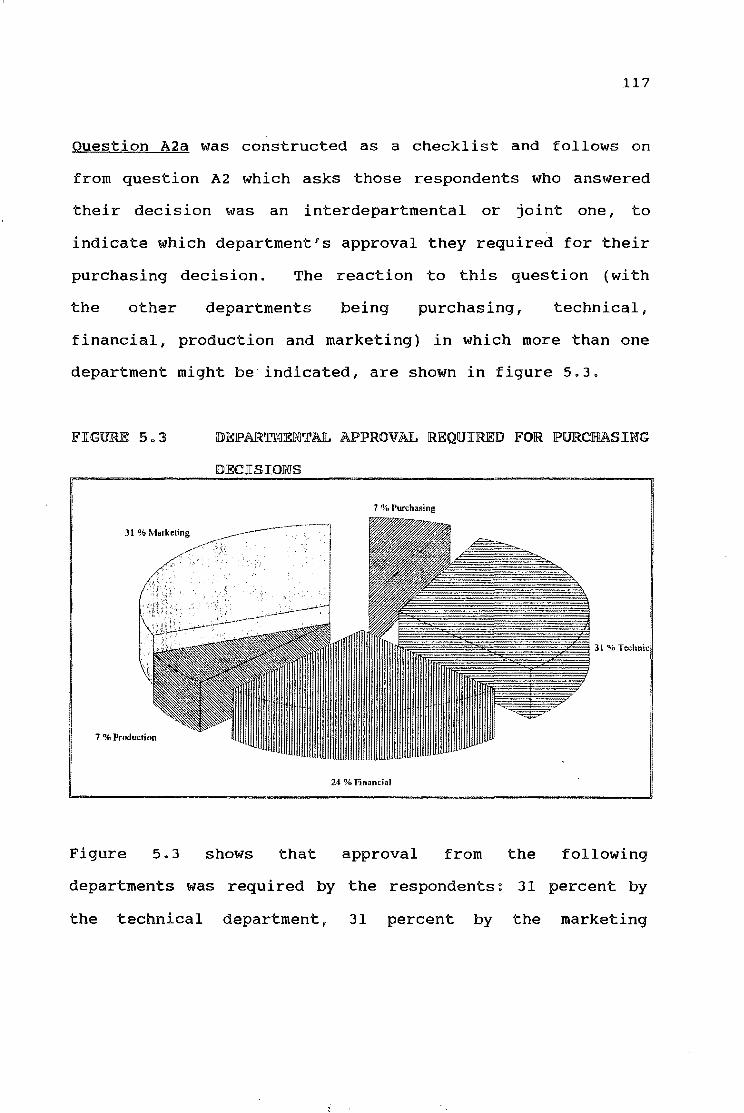
117
Question A2a was constructed as a checklist and follows on
from question A2 which asks those respondents who answered
their decision was an interdepartmental or joint one, to
indicate which department's approval they required for their
purchasing decision. The reaction to this question (with
the other departments being purchasing, technical,
financial, production and marketing) in which more than one
department might be indicated, are shown in figure 5.3.
JPIG1I.JJRE 5oJ
31% Marketing
7 %Production
DEPARTMENTAL APPROVAL REQUIRED FOR PURCHASING
DECISIONS
7 %Purchasing
31% Technic
24 ~h Financial
Figure 5. 3 shows that approval from the following
departments was required by the respondents: 31 percent by
the technical department, 31 percent by the marketing

118
department, 24 percent by the financial department, 7
percent by the production department and 7 percent by the
purchasing department.
Question A2b follows on from question A2a and provides a
checklist from which the respondent is asked to indicate the
individual's designation in the company with whom a
purchasing decision is taken. The results of the question
(with the alternatives being the managing, technical,
financial and marketing director or the technical,
financial, purchasing and marketing manager) are illustrated
in figure 5.4.
!FIGURE 5o4 POSITION OF INDIVIDUALS WHOSE APPROVAL IS
10% Marketing Manager
18 %Technical Manager
18 <!:~ fina:nci. Manager

119
Figure 5.4 shows that 36 percent require the technical
director's approval for purchasing dyestuffs or chemicals,
18 percent the managing director's, 18 percent the financial
manager's, 18 percent the technical manager's, and 10
percent the marketing manager's approval.
Question A2c provides the respondent with a checklist and
follows question A2b.
In this question the respondent is asked what the other
member's role in the purchasing of dyestuffs and chemicals
is.
The reaction to this question which included the following
alternatives of the decision maker, advisor, discussion
partner, supervisor, or other specific role, is shown in
figure 5.5.

120
FIGJURE 5.5 THE WEMBKR 0 S ROLE IW THE PURCHASING DECISION
Figure 5.5 shows that 36 percent of the respondents indicate
that the role the organisational member plays in the
purchasing decision is that of a discussion partner, 36
percent a decision maker and 18 percent an advisor.
Question A3 is structured as a dichotomous question in which
the respondent was asked whether he would be held
responsible if the dyestuffs or chemicals he purchased did
not perform as expected.
this question.
Figure 5.6 shows the reaction to

121
THE RESPONSIBILITY OF RESPONDENTS IN THE
EVENT OF THE SELECTED PRODUCTS NOT PERFORMING
TO EXPECTATIONS
Would be held responsible
Would not be held responsible
The figure above indicates that 76 percent of all
respondents feel that they would be held responsible for the
non-performance of the dyestuffs or chemicals, and 24
percent not.
Question A3a follows on from question A3 and enquires from
the respondents, who indicated they would not be held
responsible for their decisions, why they felt this way.
Although this question was structured as an open-ended
question, all responses could be classified either into pre
trial work successfully concluded or a joint decision.
Successful pre-trial work proves that the selected products
perform in large scale production.

JFIG1L1JRE 5o7 REASONS RESPONDENTS WOULD NOT BE HELD
RESPONSIBLE FOR NON PERFO~CE
Joint decision
Pre-trial work successfully completed
122
Figure 5o 7 illustrates that 75 percent of the respondents
feel they would not be held responsible as the purchase of
dyestuffs or chemicals had been a joint decisiono 25
Percent of the respondents feel they would not be held
responsible for the dyestuffs or chemical~ non-performance
as successful pre-trial work would have been concludedo
Question A3b follows question A3 and asks those respondents
who answered that they would be held responsible for their
non-performance of the selected dyestuffs or chemicals, why
this was so.

lFIGlUR.JE 5o8
123
REASOWS RESPOWDENTS WOULD BE ~ELD RESPOWSIBLE
lFOR WOW-PERlFORMANCE
Technical responsibility
Own decision
Figure 5. 8 shows that 62 percent of the respondents felt
that they would be held responsible for the dyestuffs or
chemicals non-performance because they were responsible for
the technical side of the tannery's production, and 38
percent felt responsible because it was their own decision.
Although this question was structured as an open-ended
question only two types of response were received, which are
illustrated in figure 5.8.
Question A4 is constructed as a dichotomous question and
asks the respondent whether time pressure is a factor when
deciding on which dyestuffs or chemicals to purchase.

124
Figure 5.9 indicated that 65 percent of all respondents felt
that they were not usually under time pressure when deciding
on which dyestuffs or chemicals to purchase. 35 Percent
felt that they were usually under time pressure.
FIGU1IU: 5o9 RESPOWDENTS UNDER TIWE PRESSURE
Respondents usually not under time ::::::'""'"'' pressure
Respondents usually under time pressure
Question A4a follows question A4 as an open-ended question
and asks the 35 percent of respondents, who answered that
time pressure was a factor, how this affected their
purchasing decision.
Only two types of response were received from the
respondents (three respondents fell into this category) .
Figure 5.10 illustrates the answers that were received to
the above question.
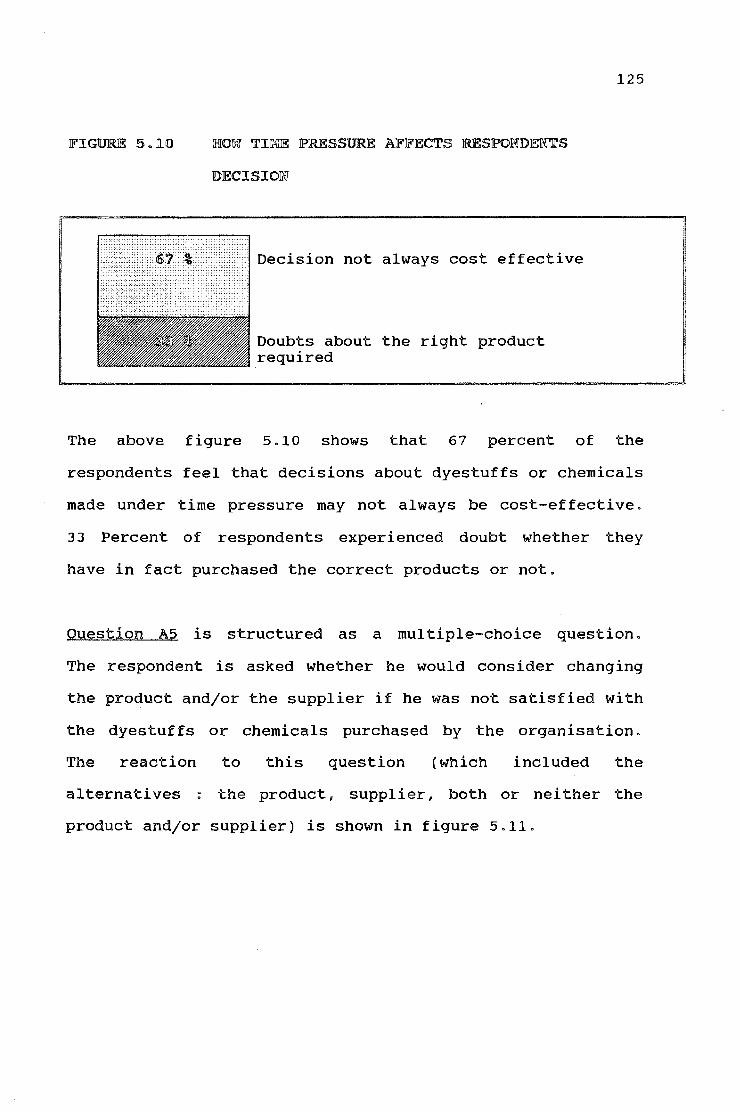
FIGURE 5610 ~OW TINE PRESSURE AFFECTS RESPOWDENTS
DECISION
Doubts about the right product required
125
The above figure 5.10 shows that 67 percent of the
respondents feel that decisions about dyestuffs or chemicals
made under time pressure may not always be cost-effective.
33 Percent of respondents experienced doubt whether they
have in fact purchased the correct products or not.
Question A5 is structured as a multiple-choice question.
The respondent is asked whether he would consider changing
the product andjor the supplier if he was not satisfied with
the dyestuffs or chemicals purchased by the organisation.
The reaction to this question (which included the
alternatives : the product, supplier, both or neither the
product andjor supplier) is shown in figure 5.11.

ACTIONS TAKEN BY RESPONDENTS WHEN
DISSATISFIED WITH DYESTUFF AND CHEWICAL
PURCHASES
Would change both product if not satisfied with present purchase
126
The majority or 53 percent of respondents would change both
the product and or supplier in the event of not being
satisfied with their purchase. 47 Percent of all
respondents would only change the product in the event that
they were not satisfied with the dyestuffs or chemicals they
purchased.
Question A6 is a checklist in which the respondent is
presented with four buying situations, and asked to indicate
in which of these situations he would be the sole decision-
maker and in which situation the decision would be a joint
one.

127
TAJBLJE 5ol AUTONOWOUS AND JOINT DECISION SITUATIONS
JBUYIWG SITUATION AJLOWJE JOINT
1. A once off purchase. 76 % 24 %
2. Repetitive, routine buying. 88 % 12 %
3 0 Buying new products from the 65 % 35 %
same supplier.
4. Buying new products from a 47 % 53 %
new supplier.
Table 5.1 indicates that the majority, i.e. 76 percent of
respondents decide alone in one-off purchase situations
compared to only 24 percent that take joint decisions with
another member of the organisation.
In the second situation concerning repetitive routine
purchasing, 88 percent do so on their own, versus 12 percent
that do so with another member's approval.
The third situation shows that 65 percent of the respondents
decide alone when purchasing a new product from the same
supplier as opposed to 35 percent that decide together with
another member.
128
The fourth situation indicates that only 47 percent decide
alone as compared to 53 percent of the respondents that
decide together with another organisational member when new
products are bought from new suppliers.
Environmental and Economic Influences
This questionnaire category refers to situational factors
affecting the Sheth model. The first question concerned the
company 8 s environmental awareness and respondents were asked
to indicate whether or not their company had become
environmentally conscious in the last few years.
Respondents also had to indicate in what way their company
had become environmentally conscious, or for what reason
their company had not.
Respondents were also asked whether or not environmental
considerations influenced their purchasing criteria of
dyestuffs or chemicals.
With reference to the politically motivated stay-away action
in August 1992, respondents indicated the percentage of
their labour turnout. This question illustrated to what
extent the South African leather industry was affected by
the labour unrest.

129
The last question referred to the partial lifting of
economic sanctions and whether or not their company had
benefited from this. Those respondents who had benefited
were asked to indicate how, to which countries they
exported, and whether or not they had exported to these
countries prior to the lifting of sanctions.
Question Bl is structured as a dichotomous question in which
the respondent is asked whether his tannery had become
environmentally conscious from 1991 onwards or not.
JFIGUIR:E 5.12 ~lim OJF TAWN:ERI:ES TJH!AT lHlA V:E IB:ECOJi!JE
:ENVIRONMENTALLY CONSCIOUS SINCE 1991
Yes, organisation has become environmentally conscious
No, Organisation has not become environmentally conscious
Figure 5.12 clearly shows that the large majority, i.e. 77
percent of all tanneries included in the census have become
environmentally conscious within the last three years. Only
23 percent of all tanneries have not become environmentally
conscious.

130
Question B1a follows on question B1 and is in the form of a
multiple choice question. In question B1a the respondent is
asked in which way his company had become environmentally
conscious. The response to this question (which included
the alternatives: effluent treatment, emission filters,
recycling waste, environmentally friendly products, and
other specific methods) is illustrated in figure 5.13.
ALTERNATIVES USED BY ENVIRO~~EWTAL COWSCIOUS
1
2
3
4
TANWERIES'fr
5 0 %
1 = Effluent Treatment 2 = Emission Filters 3 = Recycling Waste 4 = Environmentally Friendly Products 5 = Other
*Multiple answers were available to the respondents
69 %
Figure 5.13 shows that of the 77 percent of environmentally
conscious tanneries found in question Bl, 69 percent use
effluent treatment alternatives to conserve the environment,
15 percent use emission filters, 61 percent use a method of
recycling their own waste, and 20 percent use

I
I I.
131
environmentally friendly products. No other methods of
environmental consciousness were indicated by the
respondents.
Question B1b follows on question B1 and is structured as a
multiple choice question. The question forms the second
part of question B1 and asks the respondents who indicated
that their tanneries had not become environmentally
conscious, why they had not yet done so. The question had
the following alternatives : not required by law, no funds
available to implement recycling measures, not required from
customers of the tannery, and other specific reasons. The
results of this question are shown in figure 5.14.
REASONS TANNERIES HAVE WOT BECOME
ENVIROWWEWTALLY CONSCIOUS
1
2
3 0 %
4 0 %
1 = Not required by law 2 = No funds available, too expensive 3 = Not required from customer 4 = Other
80 %
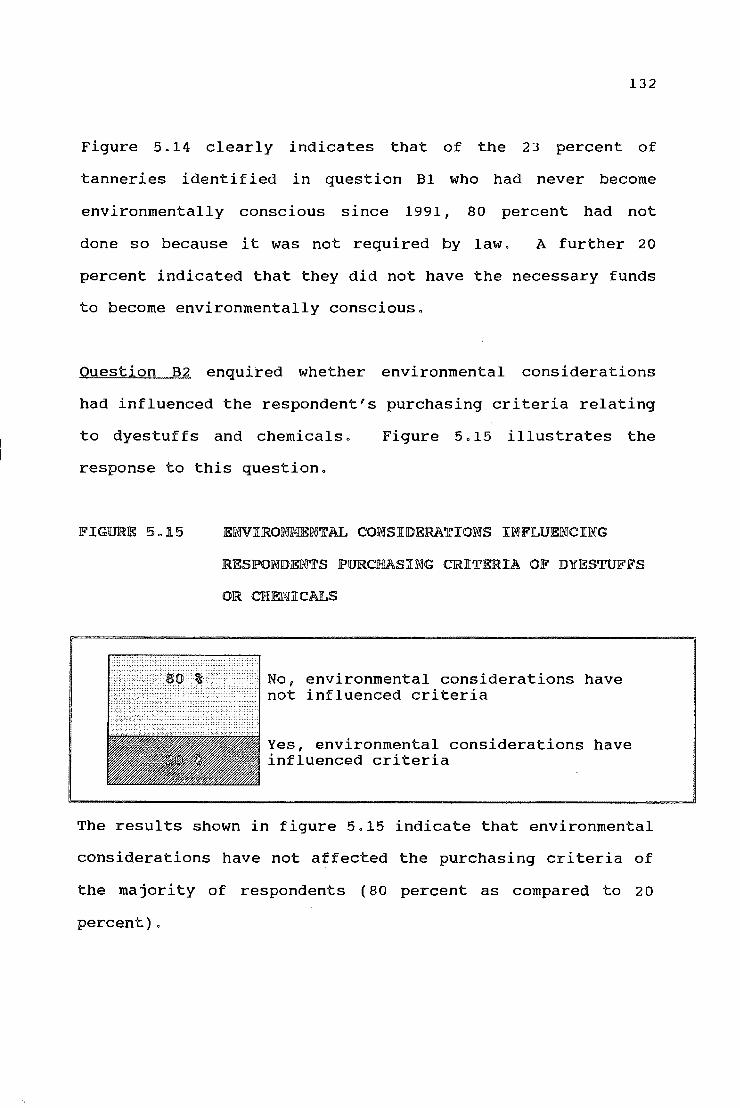
132
Figure 5.14 clearly indicates that of the 23 percent of
tanneries identified in question B1 who had never become
environmentally conscious since 1991, 80 percent had not
done so because it was not required by law. A further 20
percent indicated that they did not have the necessary funds
to become environmentally conscious.
Question B2 enquired whether environmental considerations
had influenced the respondent's purchasing criteria relating
to dyestuffs and chemicals. Figure 5.15 illustrates the
response to this question.
FIG1!1l!U: !5a.l5 ENVIRO~NTAL COWSIDERATIOWS INFLUENCING
RESPONDENTS PURCHASING CRITERIA OF DYESTUFFS
OR ClHIEJt!iiiCALS
Yes, environmental considerations have influenced criteria
The results shown in figure 5.15 indicate that environmental
considerations have not affected the purchasing criteria of
the majority of respondents ( 80 percent as compared to 20
percent).

133
Question B3 is constructed as a multiple-choice question and
asks the respondent what the company's labour turnout was
during the politically motivated stay-away action in August
1992.
Labour turnout was defined as the percentage of employees
arriving at their workplace during the stay-away action
commencing from August 1992. Figure 5.16 indicates the
labour turnout. Alternatives in this question were limited
to five options in increments of 20 percent.
LABOUR TURNOUT DURING THE AUGUST 1992
STAY-AWAY ACTION
% 100 7
80
60
40
20
0 3 4 5 6 7 8 9 10
NUMBER OF TANNERIES
134
Figure 5.16 illustrates that 7 tanneries (41 percent) had a
labour turnout of between 80-100 percent, during the stay
away action, 2 tanneries had a turnout of between 60-80
percent (12 percent), 3 tanneries a turnout of 40-60 percent
{8 percent), 1 tannery a turnout of 20-40 percent (5
percent) and 4 tanneries a turnout of below 20 percent (24
percent).
The high labour turnout at the majority of tanneries may be
attributed to their geographical location and to the size of
the company.
homelands that
action.
Many of the tanneries are located in former
did not support the political stay-away
The size of the tannery may also indirectly influence the
results as smaller tanneries employ less staff and may be
less susceptible to labour unrest.
Question B4 was structured
question and concerned the
in the form of a dichotomous
partial lifting of economic
sanctions against South Africa.
Respondents were asked whether or not the lifting of
sanctions had created export opportunities.

135
The results of this question are shown in figure 5.17 and
indicate that the majority (71 percent vs. 29 percent) of
respondents found that the lifting of sanction had improved
business opportunities in export markets.
FIG1lJR.ll!: 5ol7 THE EFFECT OF THE LIFTING OF SANCTION OM
SOUTH AFRICAN TANNERIES
No, partial lifting of economic sanctions have not created export opportunities.
Question B4a follows on to question B4 and was structured as
a checklist question. The respondents who answered that
they had benefited from the partial lifting of sanctions
(question B4) were asked how they had benefited. The
reaction from this question (with the alternatives being:
increased turnover, larger production capacity,
technological information transfer, and other specific
benefits) is shown in figure 5.18.

JFIGUJRJ& 5.18
27 % Increased Prod. Capacity
13% Technological Info. Transfer
136
BEOOEJFITS OJF THE PARTIAL LIFTING OF ECONOMIC
SANCTIONS
Figure 5.18 shows that 60 percent of the tanneries had
experienced an increase in turnover since the lifting of
partial sanctions, 27 percent had increased their production
capacity due to improved export opportunities, and 13
percent had benefited through the transfer of technological
information. The increase in turnover may certainly be the
direct result of increased production capacity and improved
technological information as indicated in figure 5.18. It
seems clear, however, that many of the tanneries that have
improved their turnover, have done so with their existing
production capacity.

137
Question B4b follows on to question B4a and provides the
respondent with a checklist of countries to which his
tannery exports. The results of the question (with
alternatives North America, South America, Asia, Europe
and the East block countries) are shown in figure 5.19.
:FIGURE 5ol9 COUNTRIES EXPORTED TO BY SOUTH AFRICAN
TANNERIES
America
52 %Europe
Figure 5.19 shows that 52 percent of those tanneries
benefiting from the lifting of sanctions export to Europe,
29 percent to Asia, 14 percent to North America and 5
percent to South America. No south African tannery was
exporting to the Eastern block countries at the time of the
research.

138
Question B4c asks the respondent whether or not the tannery
had exported to the indicated countries listed in question
B4b before the lifting of partial sanctions against South
Africa.
TANNERIES EXPORTING PRIOR TO THE LIFTING OF
ECONONIC SANCTIONS
Exported to countries prior to the partial lifting of economic sanctions
Had not exported to countries prior to the partial lifting of economic sanctions
Figure 5.20 indicates that 54 percent of South African
tanneries, that had benefited from the partial lifting of
sanctions, had exported to other countries before the actual
easing of trade restrictions. However, 46 percent of
tanneries had found new markets.
Question B4d follows on to question B3b and asks the
respondent in what stage of production the company exports
its products. The respondent is provided with a checklist
which includes the alternatives . . wet-blue hides, semi-
finished leather, finished leather, semi-finished articles,

and other specific forms of production.
illustrates the result.
FIGURE 5,21 STAGE OJF PRODUCTION OJF EXPORTS
8 % Finsihed Articles
8 % Semi-Finished Articles
139
Figure 5.21
44% Finishe•
Amongst the tanneries that had benefited from the lifting of
sanctions to export their products 44 percent did so as
finished leather, 40 percent as wet-blue hides, 8 percent as
finished articles and 8 percent as semi-finished articles.

140
!5 .. 2.3 Company orientation
The aim of this section was twofold, firstly it tried to
identify the size of the organisation and'secondly it tried
to establish whether the buying department of each tannery
was centralised, decentralised or split between head office
and plant.
Respondents were asked whether or not their company had an
established purchasing policy and how formalised this policy
was.
In order to obtain an estimate of the relative size of the
company, a question relating to the number of employees was
included.
The last question concerned the tannery's personnel
orientation, and enquired whether the company was dominated
by technical, commercial or production personnel.
Question Cl provides the respondent with a checklist in
which he is asked how many tanneries were affiliated to his
organisation. Figure 5.22 shows the results of this
question.

141
The findings shown in figure 5. 22 are consistent with the
review of the South African leather industry in Chapter 2.
AFFILIATED TANNERIES BELONGING TO OWE GROUP
Number of subsidiary tanneries.
1
2
3
4
10
10 Tanneries
Of the tanneries included in the census, 10 tanneries (59
percent) are single organisations without affiliates. It
must be noted that this, however, does not preclude the
tannery's involvement in a larger, non-leather,
organisation.
Of the remaining tanneries, 4 indicated that they belonged
to another subsidiary tannery (24 percent) and 3 tanneries
indicated that 3 tanneries were included in their group (17
percent).
Question C2 presents the respondent with a checklist
question. The respondent is asked to describe the buying
department's position in the company.
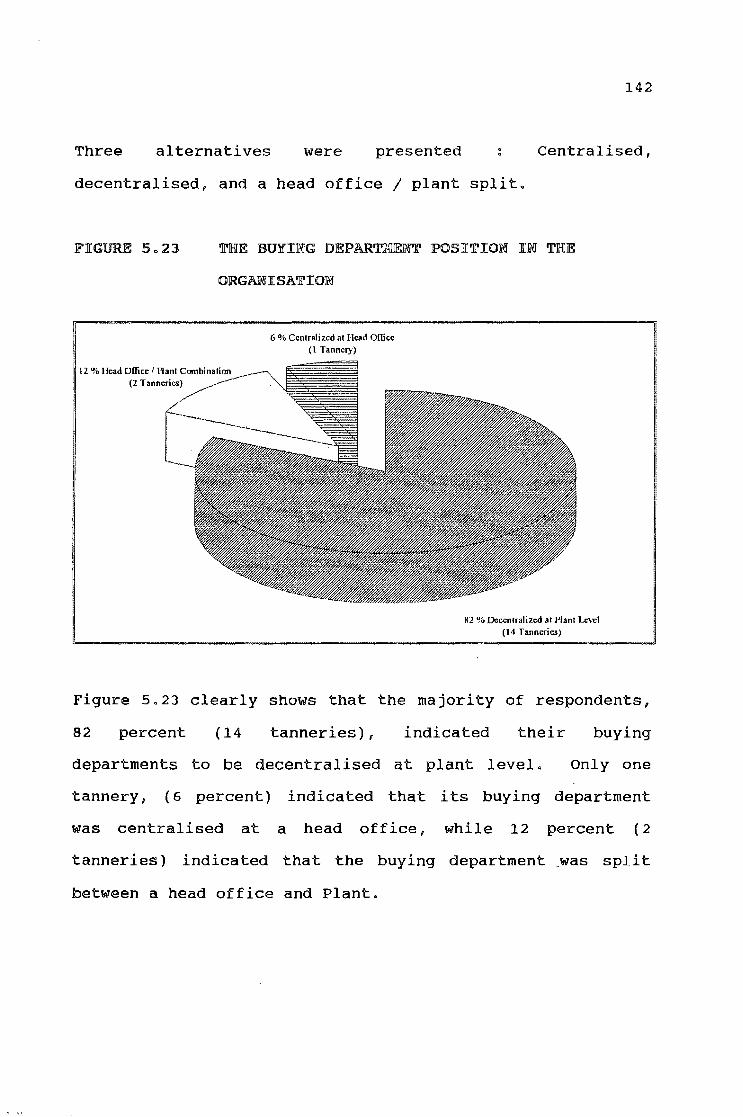
142
Three alternatives were presented Centralised,
decentralised, and a head office j plant split.
THE BUYIWG DEPARTMEWT POSITIOW IN T~E
ORGANISATIOW
6 'Yo Centralized at Head Oflicc (l Tannery)
82 %Decentralized at Plant Level (14 Tanneries)
Figure 5.23 clearly shows that the majority of respondents,
82 percent {14 tanneries), indicated their buying
departments to be decentralised at plant level. Only one
tannery, { 6 percent) indicated that its buying department
was centralised at a head office, while 12 percent {2
tanneries) indicated that the buying department was split
between a head office and Plant.

143
These findings indicate the importance of the influence of
the individual tanneries on buying.
Question C3 asks the respondent whether or not his company
has an established purchasing policy.
FIGURE 5.24. TANNERIES WITH AN ESTABLISHED PURCHASING
POLICY
No, established purchasing policy.
The results of this question are shown in figure 5. 24 in
which 35 percent of all tanneries have no established
purchasing policy, whereas 65 percent of the respondents
indicated that their company had an established purchasing
policy.
Question C3a follows on to question C3 and asks those
respondents, that had indicated that their companies did
have an established purchasing policy, to rate on a scale of
1 to 4 how formalised they would regard their company's
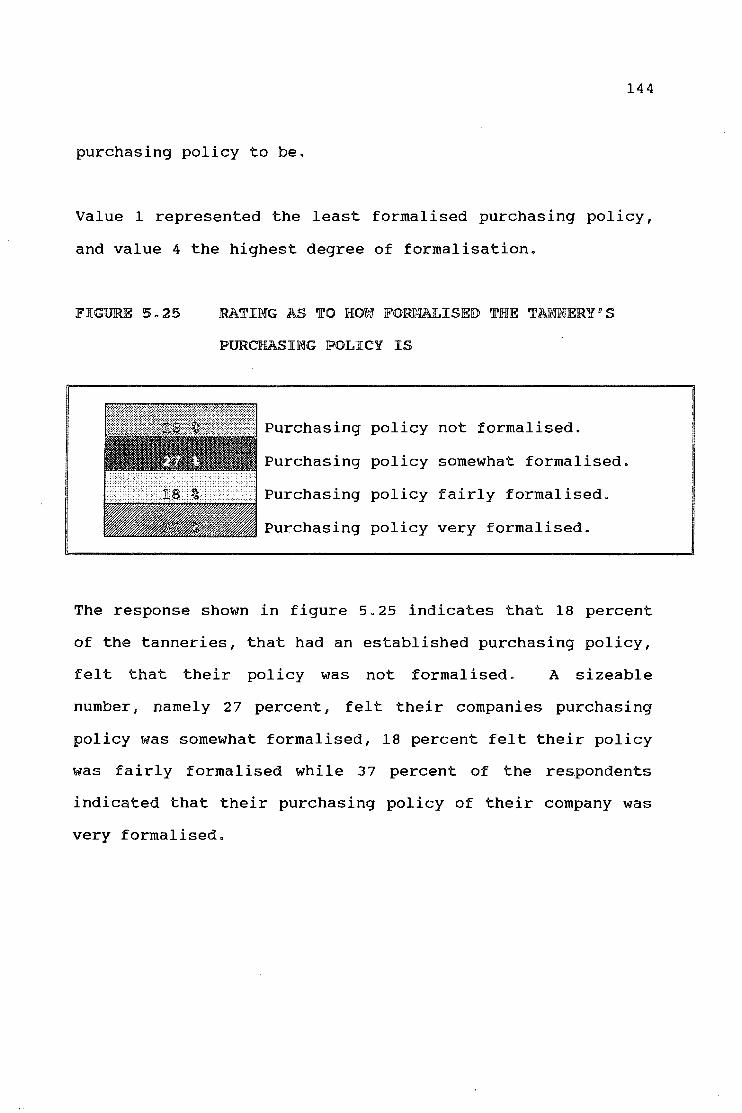
144
purchasing policy to be.
Value 1 represented the least formalised purchasing policy,
and value 4 the highest degree of formalisation.
RATING AS TO HOW FORMALISED THE TAWNERYus
PURCHASING POLICY IS
Purchasing policy not formalised.
Purchasing policy somewhat formalised.
~ThiT]IT]GfG[IT]IT]}j Purchasing policy fairly formalised.
Purchasing policy very formalised.
The response shown in figure 5.25 indicates that 18 percent
of the tanneries, that had an established purchasing policy,
felt that their policy was not formalised. A sizeable
number, namely 27 percent, felt their companies purchasing
policy was somewhat formalised, 18 percent felt their policy
was fairly formalised while 37 percent of the respondents
indicated that their purchasing policy of their company was
very formalised.

145
Question C4 asks the respondent how many employees their
company has. Ten increments of 40 units each were presented
to the respondent in the form of a checklist question.
TAJBlLE 5.,2 lNJ'U'OOJBER OF El/41PlLOYEES IW SOU'JL'lHI A.JPJRICAN
TANNERIES
WOo OF EM:PlLOYEES wo .. OF TA.W'NERIES ll?JE:RCJE:NTA.GE
1-40 5 28
41-80 2 12
81-120 3 18
121-140 2 12
141-180 - -181-200 - -201-240 2 12
241-280 - -281-320 1 6
321-360 - -361 + 2 12
TOTAL 17 100 %
Table 5.2 shows that five tanneries included in the study
employ between 1 and 40 individuals, two tanneries employ
between 41 and 80 employees, three tanneries employ between
81 to 120, and two tanneries employ between 121 and 140.

146
Two tanneries employ between 201 and 240 employees, one
tannery between 281 to 320 employees, and two tanneries more
than 360 employees.
It is likely that the tanneries employing more than 360
employees represent major players in their respective
markets. Twelve tanneries, however, employ less that 141
indi victuals indicating that most tanneries are compact in
size.
Question C5 requires the respondent to describe his
company's personnel orientation. The question was
structured as a checklist question. The alternatives, based
on the Sheth model (1972) included : technical, commercial
and production personnel. The results of this question are
shown in figure 5.26.

FIGURE 5~26 PERSONNEL ORIENTATION IN SOUTH AFRICAN
TANNERIES
147
Figure 5.26 clearly shows that 59 percent of all tanneries
have production-orientated personnel, while 35 percent are
technically oriented {leather technologists), and only 6
percent commercially orientated.
5~2~4 Pro&uct Information Sources and Selection Criteria
Section D of the questionnaire concerns the search for
relevant information during the purchasing process for
dyestuffs and chemicals and the sources of information
consulted. Specific questions are aimed at identifying the
selection criteria of dyestuffs and chemicals respectively.

148
In the last question of this section respondents are asked
whether or not other members of the production department
have similar product expectations to their own or what their
expectations were 1 might be.
Question 01 asked the respondent whether or not he actively
searched for production information on new dyestuffs or
chemicals not purchased before. As shown in figure 5.27 all
respondents indicated that during a new purchase situation
information on the product would be actively sought.
INFORMATION SEARCH DURING A NEW PRODUCT
DECISION
Respondents searching for product information on new products not purchased before.
Question 02 requested the respondent to identify the type of
information sources he would consult, if he should require
information about dyestuffs or chemicals. The response to
this question (with alternatives being trade journals,
supplier information, trade fairs, newspapers and other

149
specific information sources) is shown in figure 5.28.
Figure 5.28 indicates that 85 percent of the required
information is obtained from the supplier of dyestuffs or
chemicals, 9 percent from trade journals, and 6 percent from
trade fairs. No newspapers or any other specific
information source were indicated by the respondent.
JFIGUJRE 5.28 INFORMATION SOURCES CONSULTED
9 %Trade Journals
6% Trade Fairs
85 %Supplier Information
From the above results, it is clear that suppliers are the
main source of information to the tanner, with trade
journals and trade fairs serving as minor information
sources.
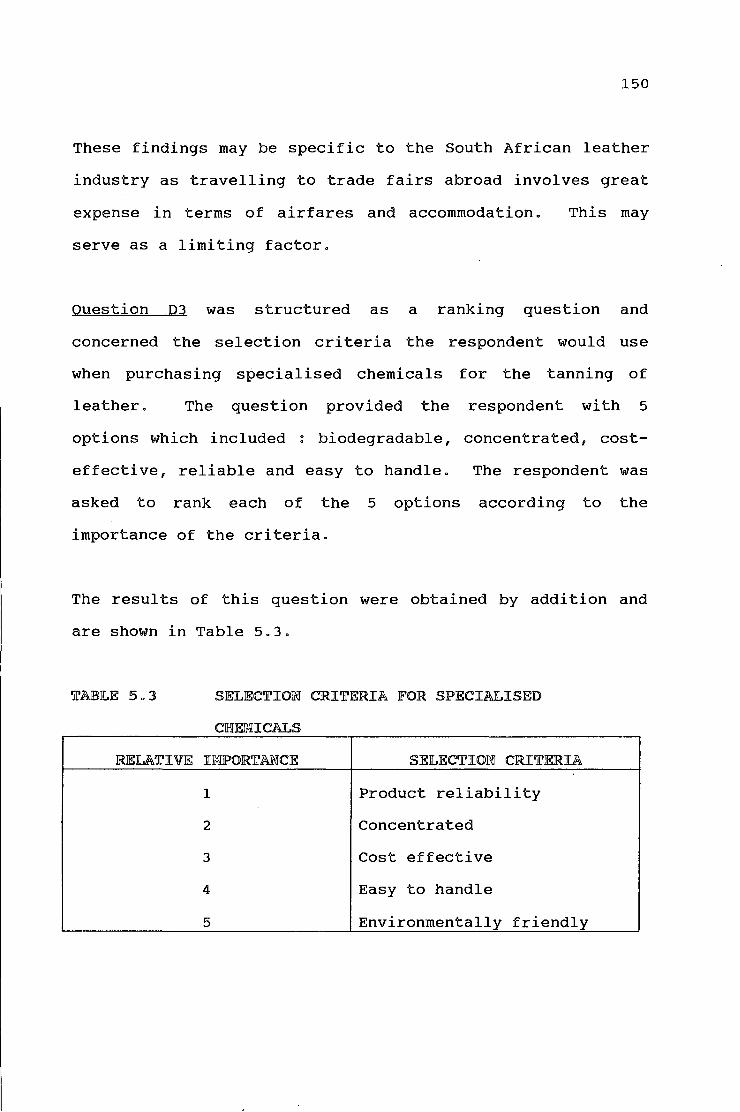
150
These findings may be specific to the South African leather
industry as travelling to trade fairs abroad involves great
expense in terms of airfares and accommodation.
serve as a limiting factor.
This may
Question 03 was structured as a ranking question and
concerned the selection criteria the respondent would use
when purchasing specialised chemicals for the tanning of
leather. The question provided the respondent with 5
options which included : biodegradable, concentrated, cost
effective, reliable and easy to handle. The respondent was
asked to rank each of the 5 options according to the
importance of the criteria.
The results of this question were obtained by addition and
are shown in Table 5.3.
TABLE 5.J
RELATIVE
SELECTION CRITERIA FOR SPECIALISED
CJH!JE:WICALS
IWJPORTANCE SELECTION CRITERIA
1 Product reliability
2 Concentrated
3 Cost effective
4 Easy to handle
5 Environmentally friendly

151
Product reliability i.e. ensuring consistent results was
found to be the most important selection criterion followed
by product concentration, cost-effectiveness, ease of
handling and environmental friendliness.
Question 04 concerned the selection criteria the respondent
would use when purchasing dyestuffs. The question was
structured as a ranking question in the same way as question
03 and provided the respondent with 5 options.
The options included biodegradable, concentrated, cost-
effective, reliable and easy to handle. The respondent was
asked to rank these criteria according to importance.
Table 5.4 illustrates the response to this question.
'JL'A!BLJE! 5o4 SJE!LJE!C'JL'IOOO CRITERIA FOR DYESTUFFS
RJE!L.A'JL'IVJE! IWPOR'JL'AJNJCJE! SELEC'JL'IOOO CRITERIA
1 Product reliability
2 Cost-effective
3 Concentrated
4 Easy to handle
5 Environmentally friendly

152
As in question 03, which concerned the selection criteria
for specialised chemicals, product reliability i.e. ensuring
consistent results was found to be the most important
selection criterion, followed by the cost-effectiveness of
the product, product concentration, ease of handling and
environmental friendliness.
Table 5.5 shows th~ ranking of criteria to be similar for
both dyestuffs and chemicals. However, there is a
difference.
TABLE 5.5 SELECTION CRITERIA FOR DYESTUFFS AND
ClHIJEli.1ICALS
RELATIVE SELECTION RELATIVE SELECTION IMPORT AN CRITERIA FOR IMPORTAN CRITERIA FOR
CE SPECIALISED CE SPECIALISED CHEMICALS DYESTUFFS
1 Product reliability 1 Product reliability 2 Concentrated 2 Cost-effective 3 Cost-effective 3 Concentrated 4 Easy to handle 4 Easy to handle 5 Enviro. friendly 5 Enviro. friendly
The findings show that the most important selection criteria
for both dyestuffs and chemicals are the product's
reliability which helps to ensure consistent production
outputs. This is followed by concentration of specialised
chemicals and the cost-effectiveness of dyestuffs.

153
In third place, the cost-effectiveness of chemicals is
important as opposed to dye concentration. Ease of handling
and environmental friendliness are ranked next and are of
the same importance in the selection of dyestuffs and
chemicals.
It is interesting to note, that although 77 percent of all
tanneries have become environmentally conscious (as shown in
question Bl) (figure 5.12), the environmentally friendly
product criterion was ranked last in both the selection of
dyestuffs and chemicals. This may be attributed to the
results found in question Bla (figure 5.13) that indicate
that effluent treatment allowed by the recycling of waste
was the most commonly used alternative for tanneries that
had become environmentally conscious. The importance of the
environmentally friendly product criterion may be directly
linked to the ability of tanneries to treat their own
effluent and waste products effectively.
The results of this question are also consistent with the
finding of question B2 and indicate that environmental
considerations
respondents.
have not influenced the majority of

154
Question 05 was structured as a dichotomous question and
asked the respondent's opinion whether or not other members
of the production department would have similar selection
criteria. Figure 5.29 shows that all respondents felt that
other members of the production department shared the same
or similar selection criterion for dyestuffs or chemicals.
JPIG1I.1lRE 5.29 PRODUCT CRITERIA OF PRODUCTION DEPAR~ENT
Joint Decision ~aking and Product/Supplier Loyalty
The purpose of this section was to investigate possible
conflict that could arise during the joint decision-making
process and how differences are solved by the respondents.
This section also researches supplier and product loyalty.
The first question asks the respondent whether he would
approach an existing or new supplier if a new production
process were developed involving a new product.

155
Question E1 concerned the joint decision-making process.
The respondent is asked whether he is always, usually,
occasionally or never in agreement with his colleagues on
the choice of product or supplier. Figure 5.30 illustrates
the response to this question.
LEVEL OF AGREEWENT DURING JOINT DECISION
17 % Occassionally in Agreement
As shown in figure 5.30 the large majority of respondents
(71 percent) are usually in agreement with their colleagues
in a joint decision-making situation, followed by those that
are occasionally in agreement ( 17 percent) and those are
always in agreement (12 percent).
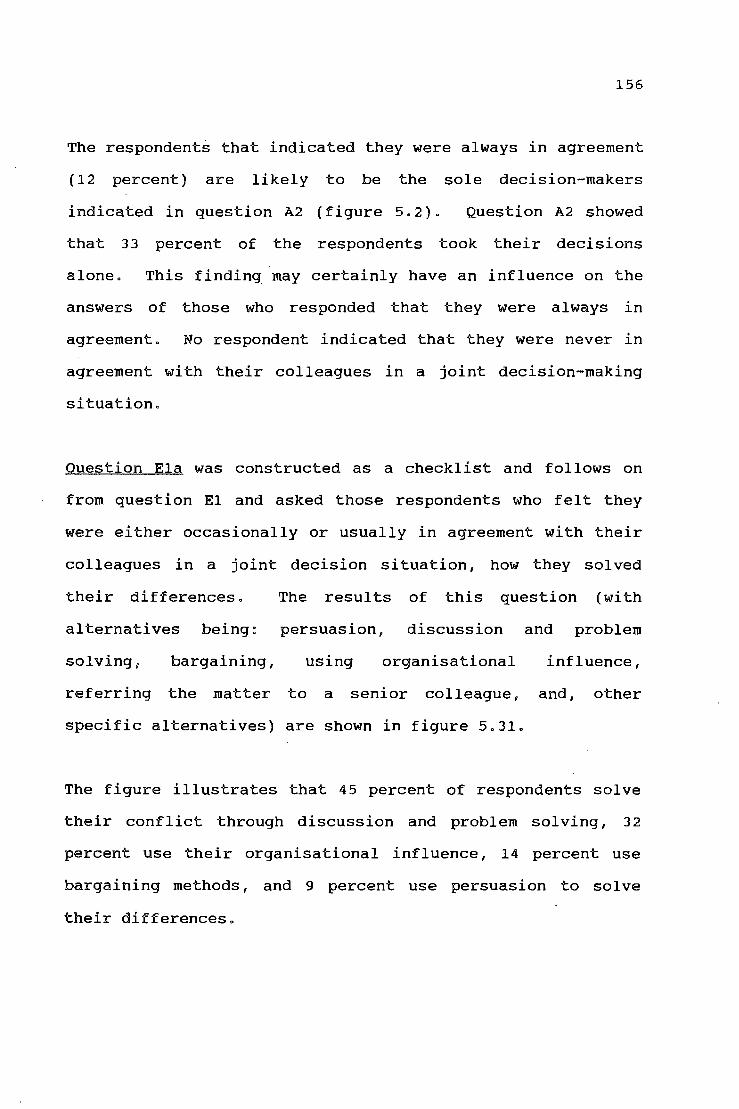
156
The respondents that indicated they were always in agreement
(12 percent) are likely to be the sole decision-makers
indicated in question A2 (figure 5.2). Question A2 showed
that 33 percent of the respondents took their decisions
alone. This finding may certainly have an influence on the
answers of those who responded that they were always in
agreement. No respondent indicated that they were never in
agreement with their colleagues in a joint decision-making
situation.
Question E1a was constructed as a checklist and follows on
from question E1 and asked those respondents who felt they
were either occasionally or usually in agreement with their
colleagues in a joint decision situation, how they solved
their differences. The results of this question (with
alternatives being: persuasion, discussion and problem
solving, bargaining, using organisational influence,
referring the matter to a senior colleague, and, other
specific alternatives) are shown in figure 5.31.
The figure illustrates that 45 percent of respondents solve
their conflict through discussion and problem solving, 32
percent use their organisational influence, 14 percent use
bargaining methods, and 9 percent use persuasion to solve
their differences.

FIGURE 5.31
14%
157
CONFLICT RESOLUTION DURING JOINT DECISION
WAKIWG
9 ~it Persuasion
45 ~~ I)iscu~ and Problem S
32 %Organisational Influence
Question E2 concerns the loyalty of the respondent to
established suppliers and their products. Figure 5.32 shows
the result of this question.
FIGURE 5o32 LOYALTY TO ESTABLISHED SUPPLIERS AWD THEIR
PRODUCTS
No, are not loyal to established suppliers

Figure 5. 32 indicates that 59 percent of all
consider themselves to be loyal to their
158
respondents
established
suppliers and products, and 41 percent feit they were not
loyal to suppliers and their products.
An inference between this question and question A5 (figure
5.11) may be suspected. The results of question A5 showed
that 47 percent of all respondents indicated that they would
only change the product if not satisfied with its
performance. This shows a fairly high degree of product
loyalty. These results seem consistent with the results of
question E2 which showed that the majority of respondents
consider themselves to be loyal to their existing suppliers.
Question E3 concerns the possibility of developing a new
production process which involves purchasing a new product.
The respondent was provided with a checklist and asked
whether he would first approach his existing supplier to
assist him with new developments, or whether he would
approach a new supplier, or use a combination of new and
existing suppliers to develop a new production process.
The results of this question (with alternatives being : the
existing supplier, new supplier and several suppliers) are
shown in figure 5.33.

WEW PROCESS DEVELOPNENT INVOLVING A WEW
PRODUCT
12% New Suppliers
159
As shown in figure 5.33, 47 percent of all respondents
indicated that they would approach several suppliers when
developing a new process which involves new products. 41
Percent noted that they would contact their existing
suppliers that provide the products for the section of
production in question, and only 12 percent indicated they
would approach a new supplier.
160
Demographic Indications
The final section of the questionnaire concerned the
demographic factors of the respondents.
Respondents were asked how many years they had been in the
leather industry working for their present company 1 their
qualification level and annual financial package. The
respondents were also asked to indicate whether or not they
actively participated in sport or whether they had any
hobbies.
Question Fl was constructed as a directed response and asked
the respondents how many years they had been in the leather
industry. A wide range of answers were received 1 ranging
from 3 to 25 years. The average number of years the
respondents had been exposed to the industry was 14.8 years
as shown in figure 5.34.
This result indicates that the respondents were mature and
experienced and has a bearing on question A4 (figure 5. 9)
which indicates that the majority of respondents (65
percent) do not experience any time pressure in their
work environment. This may be a result of their personal
level of experience.

FIGURE 5o34
Years 25 24 23 22 21 20 19 18 17 liS 15
NUMBER OJF YEARS RESPOWDEWTS HAD BEEW
ASSOCIATED WITJH! TJB!E LEATJHIER IWDUSTJRY
161
14 ~--~~--~~--~----~-------+----------------~--+--+------==~ 13 12 11 10
9 8 7 6 5 4 3 2 1 0 ~--~1---2~--3---4~~5---6~~7---8~~9---1~0~-1-1--1~2~-1~3--1~4~-1~5--1-6-=-1~7--~
RESPONDENTS
Question F2 asked the respondent how many years he had been
employed by his company. The results of this question are
shown in figure 5.35 and indicate an average of 6.8 years.
The results of this question reflect a moderate degree of
company loyalty from the respondents. This may influence
the loyalty of the respondent towards his dyestuff or
chemical supplier. Results of question E2, which asked
whether or not the respondent perceives himself to be
supplier and product loyal, showed that 59 percent of
respondents versus 49 percent of respondents considered

NUMBER OF YEARS RESPONDENTS HAVE BEEN
EMPLOYED BY THEIR PRESENT COWPANY
Years with present company 20 a 18 17 16 15 u 13 12 11 10
9 8 7 6
5 4 3 2 1
162
AVERAGE 6.8
V\ 8 9 10 11 12 13 14 15 16 17 0 ~--~1--~2--~3--~4--~5~-6~~--~--~--~~~---~~--~~~---~~--~1
RESPONDENTS
The 6. 8 year average indicates a fair amount of personnel
movement within the leather industry and may possibly
influence supplier and product loyalty.
Question F3 asked the. respondent whether or not he possessed
any special leather· qualifications. The results of this
question are illustrated in figure 5.36.
The figure shows that the majority of 71 percent of
respondents do have a specialised leather qualification
versus 29 percent that do not.
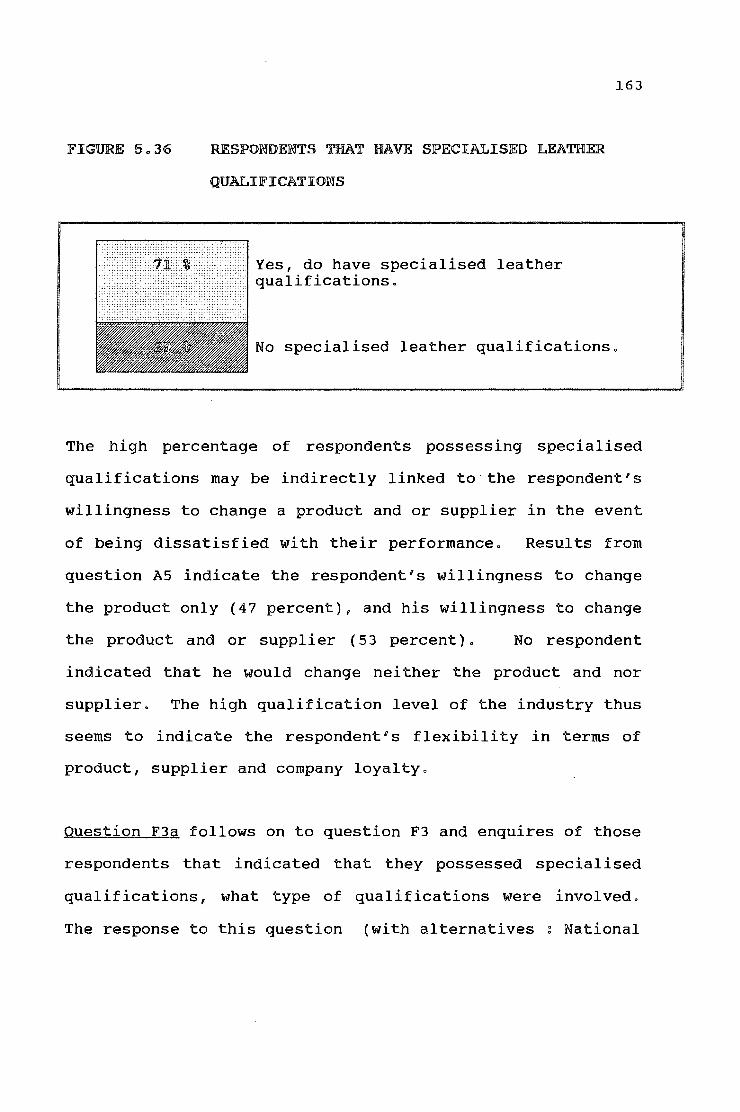
FIGURE 5o36 RESPONDENTS THAT HAVE SPECIALISED LEATHER
QUALIFICATIONS
Yes, do have specialised leather qualifications.
163
No specialised leather qualifications.
The high percentage of respondents possessing specialised
qualifications may be indirectly linked to the respondent's
willingness to change a product and or supplier in the event
of being dissatisfied with their performance. Results from
question AS indicate the respondent's willingness to change
the product only (47 percent), and his willingness to change
the product and or supplier (53 percent) • No respondent
indicated that he would change neither the product and nor
supplier. The high qualification level of the industry thus
seems to indicate the respondent's flexibility in terms of
product, supplier and company loyalty.
Question F3a follows on to question F3 and enquires of those
respondents that indicated that they possessed specialised
qualifications, what type of qualifications were involved.
The response to this question (with alternatives : National

164
Diploma Leather SA, University Degree BSc, Local
Technical Diploma - Leather, International Technical Diploma
- Leather, Certificate of Competence - SA, and any other
specialised leather qualifications) is shown in figure 5.37.
25 % National Diploma
SPECIALISED LEATHER QUALIFICATIONS OF
RESPONDENTS
R % University Degree
50 %Internal Technical Di1
The results of question F3a indicate that the majority of
respondents, 50 percent, possess an International Technical
Diploma, 25 percent, a National Diploma for Leather
( N3 level), 17 percent, a Local Technical Diploma and 8
percent, a university degree (Bachelor of Science).

165
Question F4 asked the respondent how they would rate their
annual financial package.
this question.
Table 5. 6 shows the response to
TABLE 5.6 AJNIWUAI.. FINANCIAL PACKAGE
JRANDS Pllm ANNUJi!1 RESPONDEJNJTS PllmCEJNJTAGE
< R80.000 3 18
R 80.000-R100.000 6 36
RlOO.OOO-Rl20.000 5 28
Rl20.000-R140.000 2 12
R140.000 + 1 6
TOTAL .17 100
The above table illustrates that 3 respondents earn below
R80.000 per annum, 6 respondents earn below RlOO.OOO, 5 earn
below R120.000, 2 earn below R140.000 and only 1 respondent
earns more than R140.000 per annum. The majority of
respondents, (11 percent) however, earn between RSO.OOO and
R120.000 (65 percent).
Question F5 asked the respondent whether or not he actively
played any sport. Figure 5.38 indicates that the majority
of respondents do not take part in any sport.
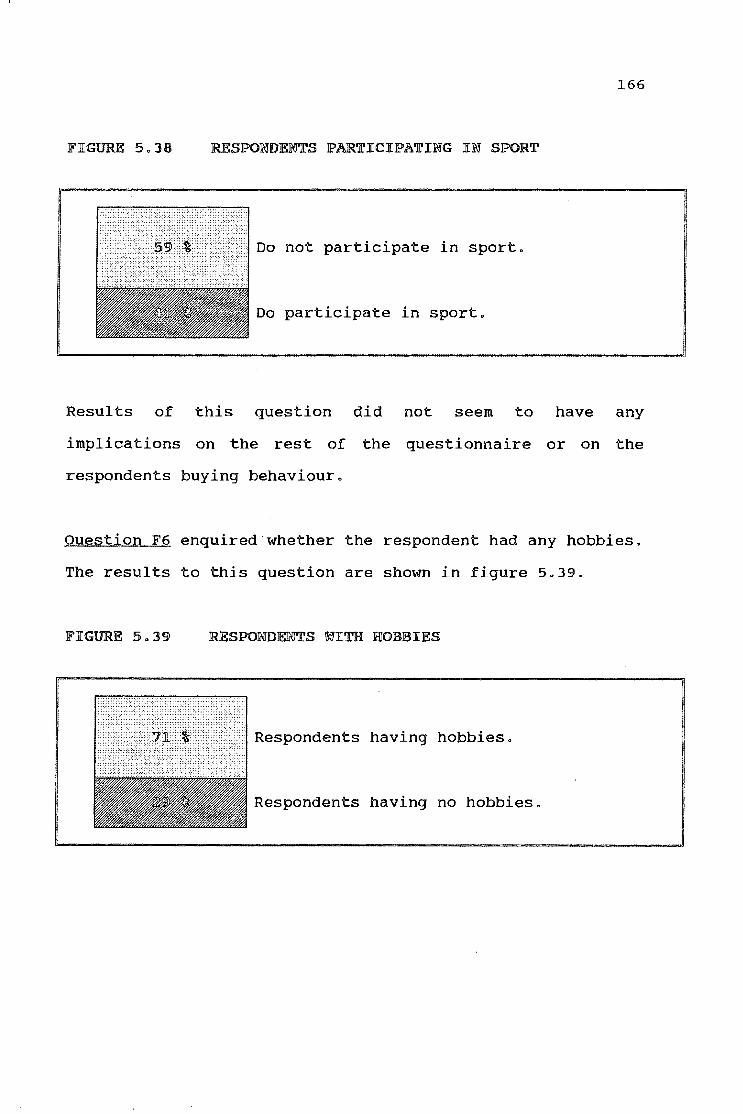
166
JFIGURE 5.38 RESPONDENTS PARTICIPATING IN SPORT
Do not participate in sport.
Do participate in sport.
Results of this question did not seem to have any
implications on the rest of the questionnaire or on the
respondents buying behaviour.
Question F6 enquired whether the respondent had any hobbies.
The results to this question are shown in figure 5.39.
RESPONDENTS WITH HOBBIES
Respondents having no hobbies.

167
Results of question F6 seem inconclusive as to their effect
on the rest of the questionnaire besides the fact that 71
percent of all respondents entertain a hobby activity.
5.3 SUMMARY
This chapter concerned the evaluation of the research
results. The research data were discussed according to the
specified sections of the questionnaire. The first section,
section A, concentrated on the purchasing decision.
Specific questions were asked to determine whether the
respondent decided jointly or alone on dyestuffs and
chemical purchases. Questions were also asked to identify
the designation of those members who participated in joint
decision-making and their role in the decision-making
process.
Respondents were asked to indicate whether or not they would
be held responsible for incorrect decisions and whether or
not time pressure affected their decision-making. A
question was also specifically directed towards establishing
whether the respondent would consider changing the product
and or supplier if he should be dissatisfied with his
purchase.

Section B
considerations
168
investigates environmental and economic
that may affect the organisational buying
behaviour. Questions were put to respondents to establish
the environmental awareness of the tannery and whether
respondents felt that environmental factors influenced their
purchasing behaviour. Respondents were asked whether the
politically motivated stay-away action had affected their
labour turnout. Most of the tanneries, i.e. 71 percent
indicated that their labour turnout was in excess of 40
percent.
Specific questions were also directed to the partial lifting
of economic sanctions and whether individual tanneries had
benefited from this and to ascertain to which countries they
export and whether they had done so before the lifting of
sanctions.
Section c of the questionnaire looks at the orientation of
the company and identifies the size of the organisation,
whether there is a buying department, and whether this
department is centralised, decentralised or a split between
head office and plant. Respondents were specifically asked
whether their company had an established purchasing policy
and how formalised the respondents felt it was.
169
The last question in this section concerned the personnel
orientation of the individual tannery and whether it was
dominated by technical, commercial or production personnel.
In section D, the questionnaire aims to identify the types
of information sources the respondent would consult when
purchasing new dyestuffs or chemicals. Questions were asked
about which specific selection criteria concerning dyestuffs
and chemicals were important to the respondent and whether
other production members had similar expectations or not.
The fifth section, section E, investigated the joint
decision-making process and identified the level of
product andjor supplier loyalty. Specific questions were
directed to the respondent to ascertain how differences or
conflict situations were resolved in joint decision-making.
The final section, section F, of the questionnaire concerned
the demographic features of the respondents. Respondents
were asked to indicate how many years they had participated
in the leather industry and how long they had been with
their specific company. An average amount of years were
derived and certain conclusions could be drawn about the
industry's experience and employee loyalty.

170
The level of specialised education was also determined and
whether or not respondents participated in sport or had
hobbies.
In chapter 6, the research results will be investigated, the
relevant conclusions drawn, and recommendations made about
the suitability of the Sheth model of organisational buyer
behaviour.

171
CHAPTER 6
CONCLUSIONS AND RECOMMENDATIONS
6ol INTRODUCTION
All formal organisations are involved in some degree of
organisational buying. Goods and services have to be
purchased to further organisational goals and objectives, or
bought for resale to other organisational users. The buying
process usually involves the specification of needs, the
personal interaction between decision-makers, the evaluation
of alternatives, and contractual negotiations. This process
may be performed by various individuals or groups within the
company and is influenced by numerous internal and external
forces ( Hutt & Speh 1992; Vinson & Sciglimpaglia 1975).
Organisational buying behaviour models attempt to provide an
integrated and comprehensive scenario of the many factors
that explain buying behaviour(Morris 1988).
This study was undertaken to test an organisational buying
behaviour model in the South African leather industry, and
to provide an insight into its buying habits. It focuses on
the purchasing of dyestuffs and chemicals for use in
tanneries.
172
The review of literature pertaining to the South African
leather industry, organisational buying behaviour, and
research methodology were used as the foundation for this
study"
The research method employed was that of telephone
interviews. The universe for this study was defined as 17
tanneries located within the geographical boundaries of
South Africa.
A census was conducted and a 100 percent response rate
achieved. Respondents were required to reply to questions
that were designed to meet both the primary and secondary
objectives of the study"
In analysing the results, it was established that the
information obtained was accurate and useful. It is
considered that conclusions derived from the findings may be
made with confidence, and can be applied to the South
African leather industry.
The subsequent paragraphs summarise the findings of this
study and give recommendations in terms of the primary and
secondary research objectives. This chapter concludes with
a recommendation for further research into the field of
organisational buying behaviour.

173
6o2 SUWOOARY OF MAIN FINDINGS AND INTERPRETATIONS
The primary objective of this study was to test a model of
organisational buying behaviour in the South African leather
industry. Four behaviour models were reviewed in Chapter 3.
The Sheth model of industrial buying behaviour was selected
for this study.
The model commences by explaining the expectations of the
individual decision-maker as a function of the individual's
background, active search for information, the sources of
information, perceptual distortion, and the satisfaction
with purchases.
Sheth (1973:53) indicates that the background of the
individual may be a significant factor in the buying
process. The different educational backgrounds of the
various individuals that may be involved in the buying
decision may generate substantially different goals and
values. The research in this study was limited to a single
individual involved in the buying process within each
tannery. Research findings indicate that 71 percent of the
respondents have specialised training in leather (versus 29
percent that do not have any specialised training). Of the
respondents that have specialised training in leather,

174
50 percent have completed an international leather diploma,
25 percent, a national (South African) leather diploma at an
N3 level, 17 percent, a local industry based leather
qualification, and 8 percent, a university degree (Bachelor
of Science).
The research results indicate that a high degree of
technical qualification is present in the local tanning
industry. It was also found that the majority of
respondents (71 percent) that have specialised training
would change both supplier and product if they were not
satisfied with the purchase (65 percent versus 35 percent).
This is significant to marketers in the dyestuff and
chemical industry. Not only will their sales
representatives need to be technically qualified to service
the leather industry, but continuous monitoring of their
customers product and service satisfaction is required to
maintain their market share.
With regard to the respondents
research results indicate that
financial package,
the majority of
respondents earn in excess of R80 000 (82 percent).
the
the

175
The relatively moderate income levels of the individuals can
be related to the finding that 67 percent of the respondents
do not take decisions on dyestuffs and chemical purchases
alone.
Research results indicate that tannery ;technical managers
often have to refer to a senior colleague as a decision
maker (36 percent), a discussion partner (36 percent), or as
an advisor (28 percent).
Marketers to this industry thus need to identify the
decision-makers, discussion partners, and advisors in order
to include them in discussions, and to optimise their
marketing approach.
No consistent correlation of data could be found that the
respondents participation in sport or hobbies, had any
effect on the buying behaviour of individuals.
Research findings show that the respondents had an average
of 14.8 years association with the industry. This indicates
a relatively high level of experience. Respondents that had
more than the average years of tannery experience (53
percent) tended to be autonomous decision-makers. Therefore
it is important that sales representatives approaching these
customers be technically trained and secure in their product

176
knowledge in order to effectively communicate with the
identified respondents.
With regard to the respondents' loyalty to their employer,
it was found that respondents remain an average of 6. 8
years with a particular tannery. This finding may be
related to the loyalty towards a particular supplier. The
majority (59 percent) of the respondents indicated that they
considered themselves to be loyal to established suppliers.
However, they indicated that several suppliers (existing and
non existing suppliers) would be approached when developing
new processes involving new products. Although marketers in
this industry may enjoy a certain amount of customer
loyalty, they should not become complacent. Research
findings indicate that the respondents are flexible with
regard to suppliers when new products and new production
processes are involved.
The second and third factors in the model of industrial
buyer behaviour (Sheth 1973) concern the information sources
and the active search for information. Sheth (1973) reasons
that the purchasing staff has a greater exposure to
commercial sources of information, and that the information
may tend to be biased and biased towards a supplier or
particular brand. Pre-testing of the questionnaire,
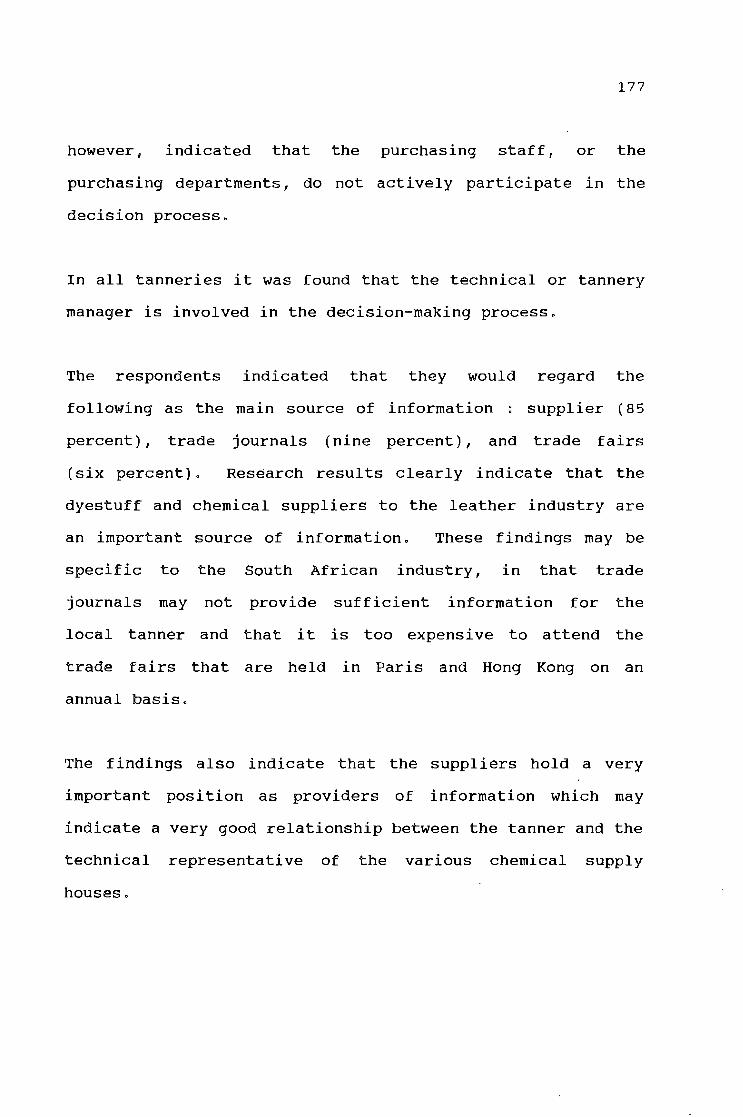
177
however, indicated that the purchasing staff, or the
purchasing departments, do not actively participate in the
decision process.
In all tanneries it was found that the technical or tannery
manager is involved in the decision-making process.
The respondents indicated that they would regard the
following as the main source of information : supplier (85
percent) , trade journals (nine percent), and trade fairs
(six percent). Research results clearly indicate that the
dyestuff and chemical suppliers to the leather industry are
an important source of information. These findings may be
specific to the South African industry, in that trade
journals may not provide sufficient information for the
local tanner and that it is too expensive to attend the
trade fairs that are held in Paris and Hong Kong on an
annual basis.
The findings also indicate that the suppliers hold a very
important position as providers of information which may
indicate a very good relationship between the tanner and the
technical representative of the various chemical supply
houses.

Marketers need to maintain their position
information suppliers to the industry. Their
approach may be successfully influenced by
178
as main
marketing
providing
pertinent and timeous information to their customers.
The fourth factor that is indicated in Sheth's model
(1973:53) concerns the selective distortion and retention of
information. Indi victuals attempt to make objective
information consistent with their own prior knowledge and
expectations by systematically distorting it. Sheth (1973)
reasons that there may be substantial differences in the
goals and values of the purchasing, production, and
technical personnel of the organisation.
This research was limited to only one individual in the
organisation, namely the tannery manager. Pre-testing of
the questionnaire indicated that in some of the smaller
tanneries, there was no purchasing department and that
production, technical, and purchasing responsibilities were
handled by the tannery manager. Research results show that
all respondents felt that their colleagues held similar
views about the selection criteria of dyestuffs and
chemicals. This result is supported by the findings about
the level of agreement during the joint decision-making
process.

179
Research results indicate that 71 percent of the respondents
are usually in agreement 1 17 percent occasionally 1 and 12
percent are always in agreement. It is interesting to note
that while many respondents do not decide_ autonomously on
dyestuffs and chemicals, a high degree of agreement does
exist when decisions are taken jointly. It is thus
important for marketers to impress and convince at least one
organisational member involved in the decision-making
process to market and sell their products.
The fifth factor that influences the expectations of
individuals is the satisfaction with past purchasing
experiences. Research findings indicate that the majority
of respondents (59 percent) would change both the product
and the supplier if not satisfied with past purchases.
Marketers need to monitor the performance of their products
and ensure that they meet the customers expectations.
The next section of the Sheth model of industrial buying
behaviour concerns the determinants of joint versus
autonomous decisions.

180
Sheth (1973:54) indicates that there are six primary factors
which determine whether a specific purchasing decision will
be joint or autonomous. Three of the factors can be related
to the product or service, and the other three to
characteristics of the purchasing organisation.
The three product specific factors are : perceived risk, the
type of purchase, and time pressure. Perceived risk can be
described as the magnitude of adverse consequences felt by
the decision-maker if the wrong decision is made, and the
uncertainty under which a decision has to be taken (Sheth
1973:54).
Research findings indicate that the majority of respondents
felt that they would be held directly accountable if the
selected dyestuffs or chemicals did not perform according to
expectations ( 76 percent versus 24 percent) . Of those
respondents that felt they would be held responsible, the
majority indicated that the technical responsibility lay
with them ( 62 percent), and that they had made their own
decisions ( 38 percent). With regard to those respondents
that indicated that they would not be held responsible, 75
percent felt that this was due to the decisions being taken
jointly, whereas 25 percent felt that successful pre trial
work, before decision-making, minimised the responsibility

181
and the perceived risk. Marketers can help the decision
making process in this way by supervising and monitoring
pre-trials. Astute marketers may even exchange products or
modify the process to satisfy customer requirements during
the pre-trial work.
This might not only be of assistance to the decision-maker,
but may also help to establish and maintain effective
customer
approach.
relationships which optimise the marketing
The second product specific variable refers to the type of
purchase. Sheth ( 1973) reasons that first purchases may
lead to joint decision-making, whereas repetitive or routine
decisions are likely to be delegated to one individual. The
research for this study presented four purchasing situations
to the respondents.
The first situation referred to a one-off purchase, in which
the majority of respondents indicated that they would decide
autonomously (76 percent versus 24 percent). This finding
may be seen as contradictory to Sheth's reasoning that one
off purchase decisions are usually taken jointly. This may
in fact be so when capital equipment is involved. However,
this research was limited to the purchasing of dyestuffs and
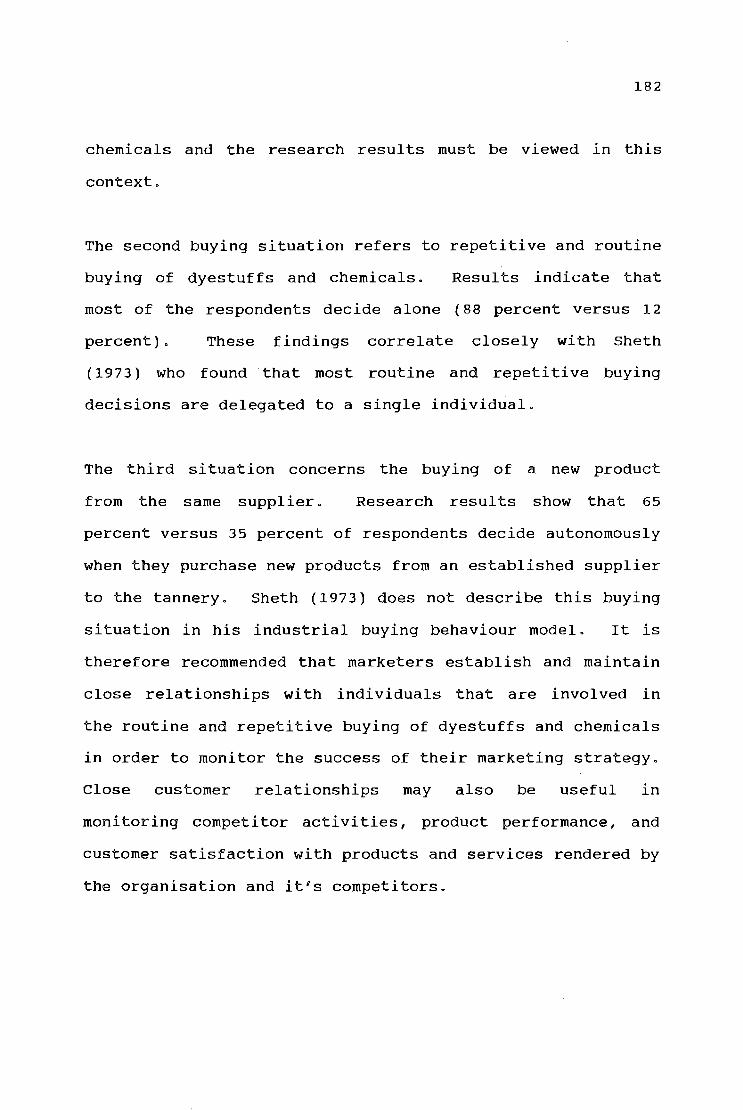
182
chemicals and the research results must be viewed in this
context.
The second buying situation refers to repetitive and routine
buying of dyestuffs and chemicals. Results indicate that
most of the respondents decide alone (88 percent versus 12
percent). These findings correlate closely with Sheth
( 1973) who found that most routine and repetitive buying
decisions are delegated to a single individual.
The third situation concerns the buying of a new product
from the same supplier. Research results show that 65
percent versus 35 percent of respondents decide autonomously
when they purchase new products from an established supplier
to the tannery. Sheth (1973) does not describe this buying
situation in his industrial buying behaviour model. It is
therefore recommended that marketers establish and maintain
close relationships with indi victuals that are involved in
the routine and repetitive buying of dyestuffs and chemicals
in order to monitor the success of their marketing strategy.
Close customer relationships may also be useful in
monitoring competitor activities, product performance, and
customer satisfaction with products and services rendered by
the organisation and it's competitors.
183
The fourth situation put to the respondents, refers to the
buying of new products from a new supplier. Research
findings indicate that, in this situation, most of the
respondents decide jointly with other members of the
organisation. Sheth ( 1973) does not describe this buying
situation. Mention is, however, made to the magnitude of
perceived risk the buying situation holds. Sheth ( 1973)
hypothesises that the greater the perceived risk and
uncertainty of the buying situation, the greater the
likelihood that the decision will be made jointly.
The research for this study indicated that the majority of
respondents (67 percent versus 33 percent) decide jointly on
dyestuffs and chemicals. This indicates high perceived risk
to purchasing the wrong or unsuitable dyestuff or chemical.
Marketers need to be aware of the perceived risk their
products may hold and assist the decision-makers by
demonstrating product attributes through pre-trial work if
necessary.
It is interesting to note that in three of the four
purchasing situations, namely, one-off purchases, repetitive
and routine buying, and buying new products from an
established tannery supplier, the majority of respondents
decide alone.
184
This high degree of autonomy may indicate that tannery
managers are competent to take the necessary decisions for
running the tannery on a day-to-day basis, and that only
when new products from an non-established supplier are
involved, joint decision-making is undertaken.
The third product-related variable
Research findings show that only
is time pressure.
35 percent of the
respondents consider themselves to be under time pressure
when deciding on dyestuffs or chemicals. The majority of
respondents (65 percent) feel they are not under any time
constraints when decisions are taken. The respondents
experiencing time pressure are affected in two ways : most
of the individuals feel that time pressure leads to
decisions that are not always cost-effective ( 67 percent),
and some experience doubts about whether the right product
has been purchased (33 percent). Astute marketers need to
be aware of possible time pressure and reassure the customer
by stressing the products positive attributes such as
dyestuff concentration, and tannin content of chemicals
which are suited to the specific production process.
Sheth's ( 1973) reasoning that decisions taken under time
pressure are usually those that have been delegated to one
individual is acknowledged by this research.

185
It was found that respondents experiencing time pressure are
usually involved in an autonomous decision making situation
(82 percent versus 18 percent).
The three company specific factors are company
orientation, company size, and degree of centralisation.
According to Sheth ( 1973), companies that are
technologically orientated tend to be dominated by
engineering or technical personnel. Similarly, production
orientated companies tend to be dominated by production
personnel.
This research indicates that most South African tanneries
are production-oriented {59 percent), followed by those that
are technically orientated (35 percent), and those that are
commercially orientated companies (six percent).
It is apparent that most tanneries concentrate on production
output. This may relate closely to the shoe-upper tanneries
that provide a relatively basic product and require a volume
throughput of material to remain viable. On the other hand,
a significant proportion of respondents indicated that their
tannery is technically orientated. This may relate to the
automotive tanneries that also require a large throughput of
material but provide a finished product to the automotive

186
industry which has to comply to strict requirements. These
requirements stipulate that upholstery leather must meet
certain standards before it can be accepted for
incorporation into motor vehicles. Requirements include: a
high degree of rubbing and light fastness, good print
retention, non yellowing and softness. It is therefore
important for marketers to establish which exact product
requirements are important to the tannery and formulate
their marketing approach accordingly.
The second company-specific variable refers to the company's
size. According to Sheth (1973), decision-making in a large
organisation is more likely to be joint. This is partially
supported by the study. Although there is no direct
correlation between the number of respondents that indicated
that they were joint decision-makers (67 percent), and the
size of the organisation, it was interesting to note that 47
percent of the joint decision-makers were employed in
companies that had more than one affiliated tannery. The
remaining 53 percent of respondents were employed by
individual tanneries.
The third company-specific variable concerns the degree of
centralisation of the purchasing function. The majority of
respondents (82 percent) indicated that the purchasing

187
function was decentralised at plant level, for 12 percent, a
shared responsibility existed between head office and plant,
and six percent responded that the purchasing function was
centralised at a head office. It is apparent that in most
of the tanneries the decision to purchase is taken at the
tannery itself.
The process of joint decision making is central to the Sheth
industrial buying behaviour model. It includes the
initiation of the decision to purchase, collection of data,
the evaluation of alternative suppliers, and the resolution
of conflict among the joint decision-makers (Sheth 1973:54).
The purchasing decision is mostly initiated because of a
continuing need for supply, or the outcome of long-range
planning. According to Sheth, ( 1973) the most important
aspects of joint decision-making is the collection of
information, the deliberation on it, and the conflict which
arises in most joint decisions. Conflict is invariably
present when the buying motives and expectations about
products and suppliers differ within the decision-making
group (Sheth 1973:55). The resulting conflict may not
necessarily be detrimental. What is of importance, however,
is how the conflict is resolved.

188
Sheth (1973) indicates that four conflict-resolution methods
may be used by joint decision-makers problem solving,
persuasion,
show that
bargaining,
45 percent
and politicking. Research results
of the respondents solve their
differences through discussion and problem solving. In this
manner, conflict is minimised by the active search for
additional information. 32 Percent of respondents indicated
that their differences were solved by using their influence
in the organisation. According to Sheth, (1973) this form
of conflict-resolution is common in industrial purchasing.
14 Percent of respondents felt that they resolved their
conflict during joint decision-making by bargaining with
their colleagues. Sheth (1973) found that the conflict is
not resolved by changing the differences in the relative
importance of the purchasing goals but that a concept of
distributive justice applied. Sheth (1973:55) indicates
that both politicking and bargaining are non rational and
inefficient methods for resolving conflict situations. Nine
percent of the respondents use persuasion to solve
differences in which an attempt is made to convince the
dissenting member(s) by pointing out 'general corporate
objectives and how individual criteria are likely to achieve
these goals (Sheth 1973:55). The majority of respondents,
( 45 percent) apply discussion and persuasion methods for
resolving conflict.
189
Marketers can assist the decision-making process and reduce
or avoid the amount of conflict by providing pertinent and
timeous information whenever a conflict situation is
perceived.
In addition to the resolution of conflict, the level of
agreement during joint decision-making was researched. It
was found that 71 percent of the respondents are usually in
agreement, 17 percent, occasionally, and 12 percent, always
in agreement. This indicates a high level of agreement when
decisions are taken about purchasing dyestuffs and
chemicals. Research for this study shows that when approval
is required for a purchasing decision concerning dyestuffs
and chemicals, most respondents indicated that the technical
director's approval (36 percent) was sought, followed by an
equal distribution amongst managing directors, and
financial, and technical managers ( 18 percent each). Ten
percent of the respondents indicated that the marketing
manager's approval was required. The relatively senior
position of the technical director is likely to be the
reason for the high degree of agreement that exists when
purchasing decisions are taken. To support this finding,
respondents were asked to indicate the role the above
members played in the actual purchasing decision.

190
Research findings showed that 36 percent played the role of
decision-maker, 36 percent the role of a discussion partner,
and 28 percent the role of an advisor. It is apparent that
the high level of agreement, during dyestuff and chemical
purchasing decisions, is interdependent with the joint
decision-makers position in the organisation as well as the
role he plays during the actual decision process.
The Sheth model of
that the supplier
industrial buying behaviour indicates
or product choice results from the
decision making process. In new process developments
research results indicated that most of the respondents (47
percent) would approach several suppliers for technical
assistance and information, 41 percent would approach the
established tannery suppliers, and 12 percent, new and
unestablished suppliers. The findings suggest that
competition exists amongst tannery suppliers of dyestuffs
and chemicals as most tannery managers would approach more
than one supplier for advice and information when faced with
a new purchase situation. Many tanneries also display a
certain amount of loyalty towards their exist~ng and
established suppliers ( 41 percent). This indicates that
several chemical houses have succeeded in establishing close
ties to tanneries which is reflected in the respondents'
loyalty to their supplier.
191
The last section of the Sheth model of industrial buying
behaviour describes situational factors as influencing the
supplier or brand choice. Ad-hoc situational factors which
may intervene between the actual choice and any prior
decision-making process may include economic or political
situations such as sanctions, strikes, and environmental
regulations.
With regard to the economic sanctions imposed against south
Africa, 71 percent of the respondents felt that since the
partial lifting of trading restrictions, their companies had
benefited from export opportunities.
that no benefits had materialised.
29 Percent indicated
Most tanneries (60 percent) found that export opportunities
had increased their turnover, followed by increased
production capacity (27 percent), and the transfer of
technological information (13 percent). From these findings
it is apparent that the majority of tanneries have directly
benefited by the lifting of economic sanctions.
With regard to export countries, Europe was the most
favoured destination for South African exports (52 percent,
followed by Asia (29 percent), North America (14 percent),
and South America (five percent).
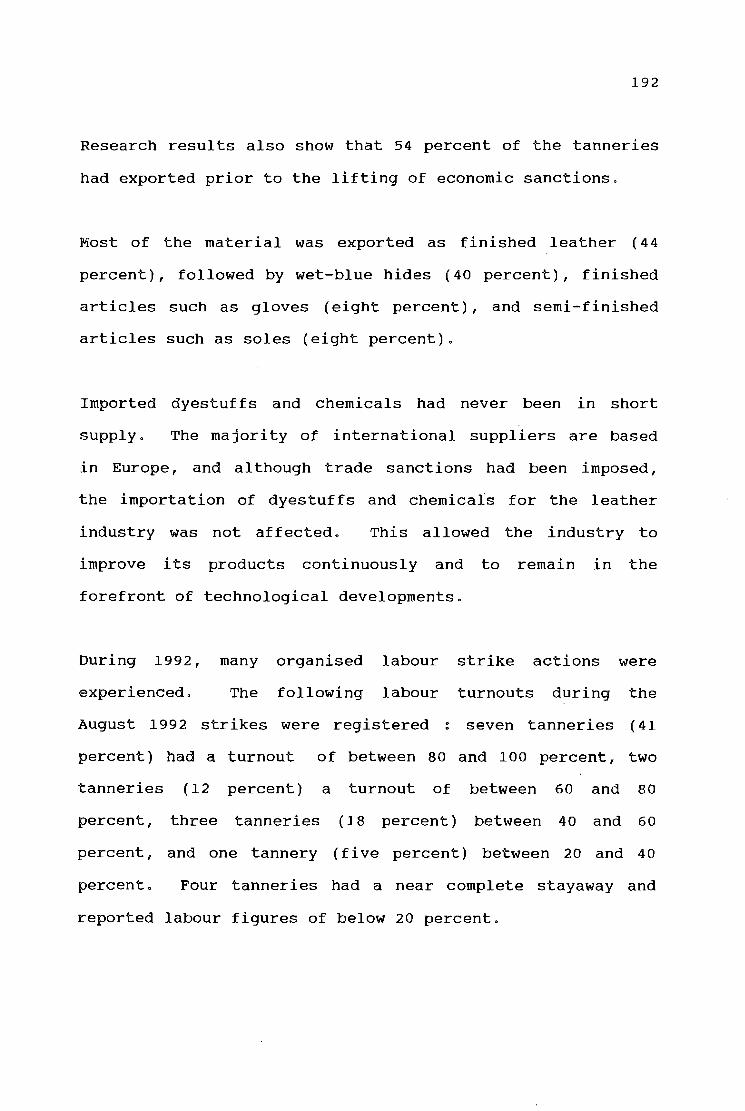
192
Research results also show that 54 percent of the tanneries
had exported prior to the lifting of economic sanctions.
Most of the material was exported as finished leather ( 44
percent), followed by wet-blue hides (40 percent), finished
articles such as gloves (eight percent), and semi-finished
articles such as soles (eight percent).
Imported dyestuffs and chemicals had never been in short
supply. The majority of international suppliers are based
in Europe, and although trade sanctions had been imposed,
the importation of dyestuffs and chemicals for the leather
industry was not affected. This allowed the industry to
improve its products continuously and to remain in the
forefront of technological developments.
During 1992, many organised labour strike actions were
experienced. The following labour turnouts during the
August 1992 strikes were registered : seven tanneries ( 41
percent) had a turnout of between 80 and 100 percent, two
tanneries (12 percent) a turnout of between 60 and 80
percent, three tanneries ( 18 percent) between 40 and 60
percent, and one tannery (five percent) between 2 0 and 4 o
percent. Four tanneries had a near complete stayaway and
reported labour figures of below 20 percent.

193
Most tanneries were thus not severely afflicted by the mass
stay-away campaigns and were able to continue production.
The environmental consciousness of both the consumer and the
industry as a whole has resulted in regulations that have
affected most organisations. Research findings indicated
that most South African tanneries ( 77 percent versus 23
percent) have become environmentally conscious since 1991.
Alternatives used by environmentally conscious tanneries
include effluent treatment (69 percent), recycling and re
using waste water (61 percent), the use of environmentally
friendly products ( 20 percent) , and the use of emission
filters (15 percent).
From these results, it is apparent that most tanneries are
environmentally conscious and use a combination of
alternatives to reduce their impact on the-environment.
The research also indicated that those tanneries (23
percent) that had not become environmentally conscious had
reasons for not doing so. It was found that 80 percent of
the respondents indicated that environmental regulations
were not required nor enforced by law, and 20 percent stated
that they did not have sufficient funds to implement
environmental measures.

194
Although only a few tanneries have not implemented
environmental measures, it is likely that additional
legislation enforced by regional government will result in
those tanneries which do not conform to the requirements
being financially penalised, closed down, or forced to
comply. This is becoming evident in that large tanneries are
already being monitored for the electrolyte and solid
content in their effluent. At this stage, financial
penalties are already being implemented if regulations are
not met.
In spite of the environmental consciousness present in the
South African leather industry, respondents did not indicate
that an environmentally friendly product was the most
important selection criterion.
The research shows that in order of importance the selection
criteria for dyestuffs were ranked as follows :
o Product reliability
o Cost-effectiveness
o concentration of dyestuffs
o Ease of handling
o Environmental friendliness of product
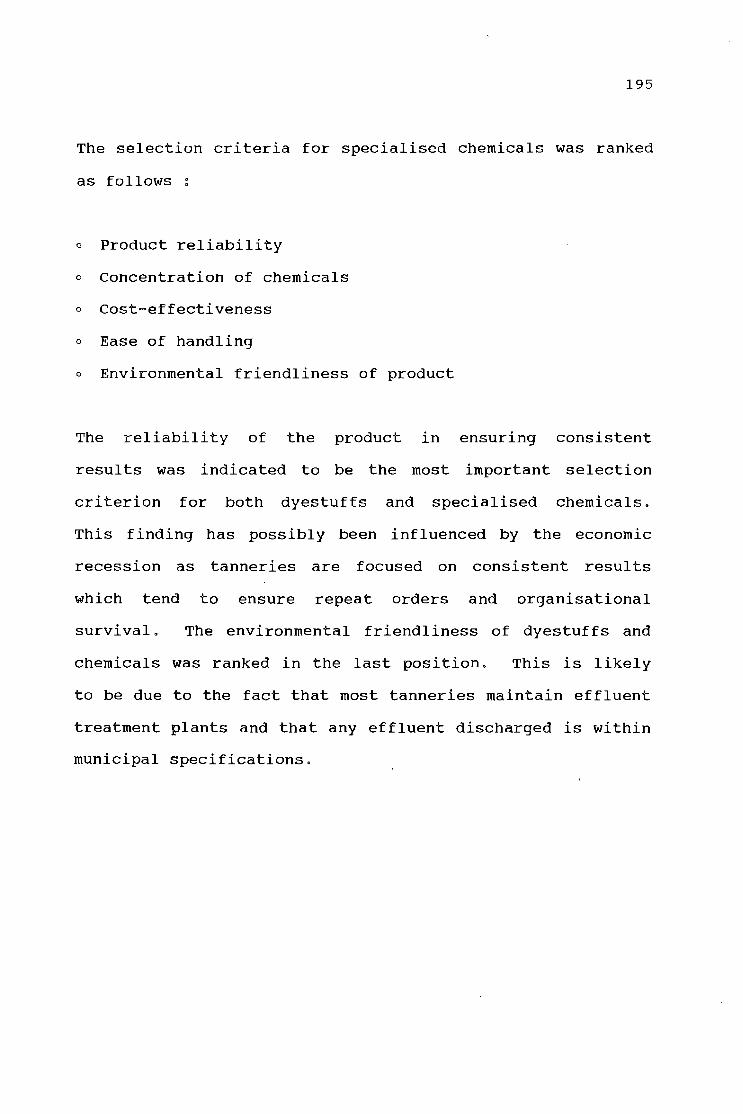
195
The selection criteria for specialised chemicals was ranked
as follows :
o Product reliability
o Concentration of chemicals
o cost-effectiveness
o Ease of handling
o Environmental friendliness of product
The reliability of the product in ensuring consistent
results was indicated to be the most important selection
criterion for both dyestuffs and specialised chemicals.
This finding has possibly been influenced by the economic
recession as tanneries are focused on consistent results
which tend to ensure repeat orders and organisational
survival. The environmental friendliness of dyestuffs and
chemicals was ranked in the last position. This is likely
to be due to the fact that most tanneries maintain effluent
treatment plants and that any effluent discharged is within
municipal specifications.

196
6.3 CONCLUSIONS IN TERMS OF STATED OBJECTIVES
The foregoing paragraphs are a summary of the main findings
of the research conducted in the South African leather
industry. From the preceding discussion, it is now possible
to draw conclusions in terms of the set objectives.
The primary objective of this study was to establish whether
a model of industrial buying behaviour could be applied to
the South African leather industry, and to obtain pertinent
information about the industry's purchasing behaviour. The
primary objectives set for this study have been achieved.
The study determined that the Sheth industrial model of
buyer behaviour can successfully be applied to the industry
selected. Through the application of the model, valuable
and useful information was gathered that reflected the
purchasing behaviour of
application of the model
objectives.
the selected respondents. The
also achieved the set secondary
The secondary objective of
conflict-resolution during
identified and corresponded
industrial buying behaviour.
determining the methods of
joint decision-making were
with the Sheth model of
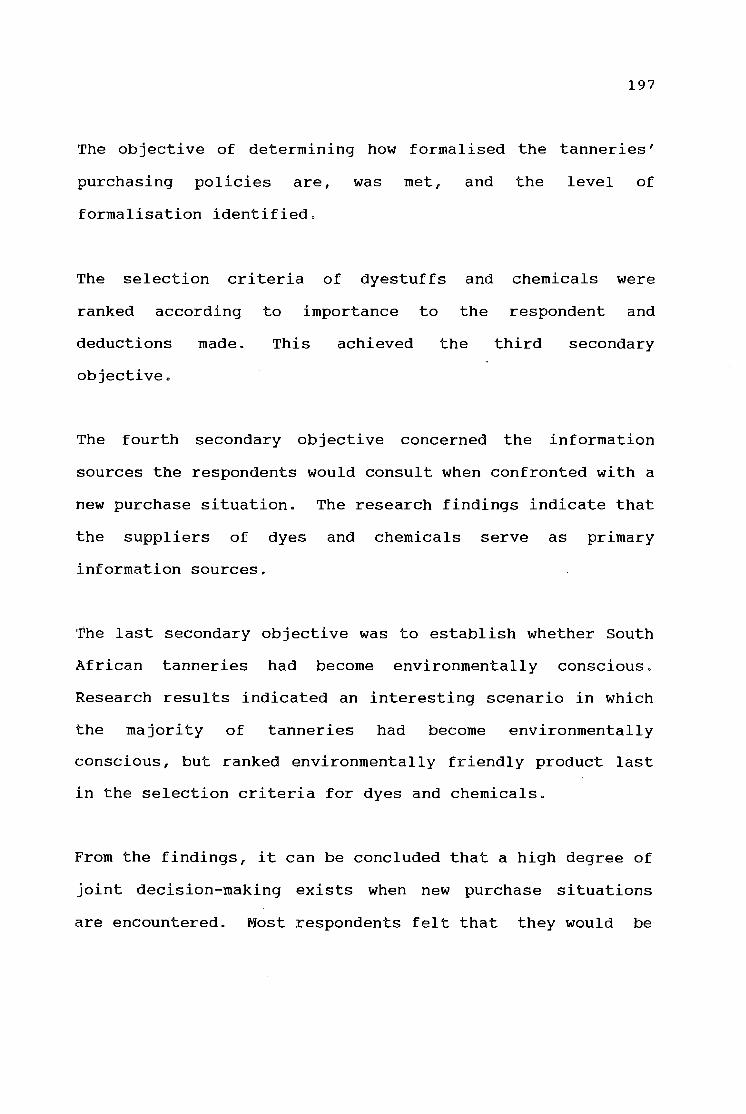
197
The objective of determining how formalised the tanneries'
purchasing policies are, was met, and the level of
formalisation identified.
The selection criteria of dyestuffs and chemicals were
ranked according
deductions
objective.
made.
to importance to the
This achieved the
respondent and
third secondary
The fourth secondary objective concerned the information
sources the respondents would consult when confronted with a
new purchase situation.
the suppliers of dyes
information sources.
The research findings indicate that
and chemicals serve as primary
The last secondary objective was to establish whether South
African tanneries had become environmentally conscious.
Research results indicated an interesting scenario in which
the majority of tanneries had become environmentally
conscious, but ranked environmentally friendly product last
in the selection criteria for dyes and chemicals.
From the findings, it can be concluded that a high degree of
joint decision-making exists when new purchase situations
are encountered. Most respondents felt that they would be

198
held responsible for their decisions, and that time pressure
did not affect their decision-making. With regard to
conflict resolution during joint decision-making,
respondents indicated that discussion and problem solving
methods were the most viable alternative in reaching
consensus.
The impression gained from this study is that the majority
of tanneries have become environmentally conscious, and
apply at least one method of pollution and effluent control.
It has also become evident that municipal effluent
regulations are impacting on tanneries, as stricter measures
and controls are being implemented.
The study showed that many tanneries had exported either
their finished leather or wet-blue hides prior to the
lifting of sanctions. Europe was indicated as the largest
market for South African leather and hides.
The development of the automotive leather sector has
undoubtedly benefited the local leather industry. Several
tanneries have established themselves as major players in
the supply of leather for the automotive market and produce
large quantities destined mainly for the export markets.

199
It is apparent that most of the larger tanneries belong to
one of the five groups of companies that dominate the South
African leather industry. Although strong affiliations
exist among the various group members, decision-making is
taken at individual plant levels. The study also showed
that many tanneries have an established and formalised
purchasing policy.
The study indicated that the majority of tanneries were
production and technically orientated and that most
respondents had an average of 14.8 years experience in the
industry. It was also found that respondents remained an
average of 6.8 years with a particular company, and regarded
themselves as being loyal to their established suppliers.
All respondents indicated that they engaged in an active
search for information when confronted with a new purchasing
situation, and that the supplier of dyestuffs and chemicals
served as a major source of information.
The study found that the majority of respondents have a
specialised qualification in leather and feel that they are
technically responsible for the tannery's production.
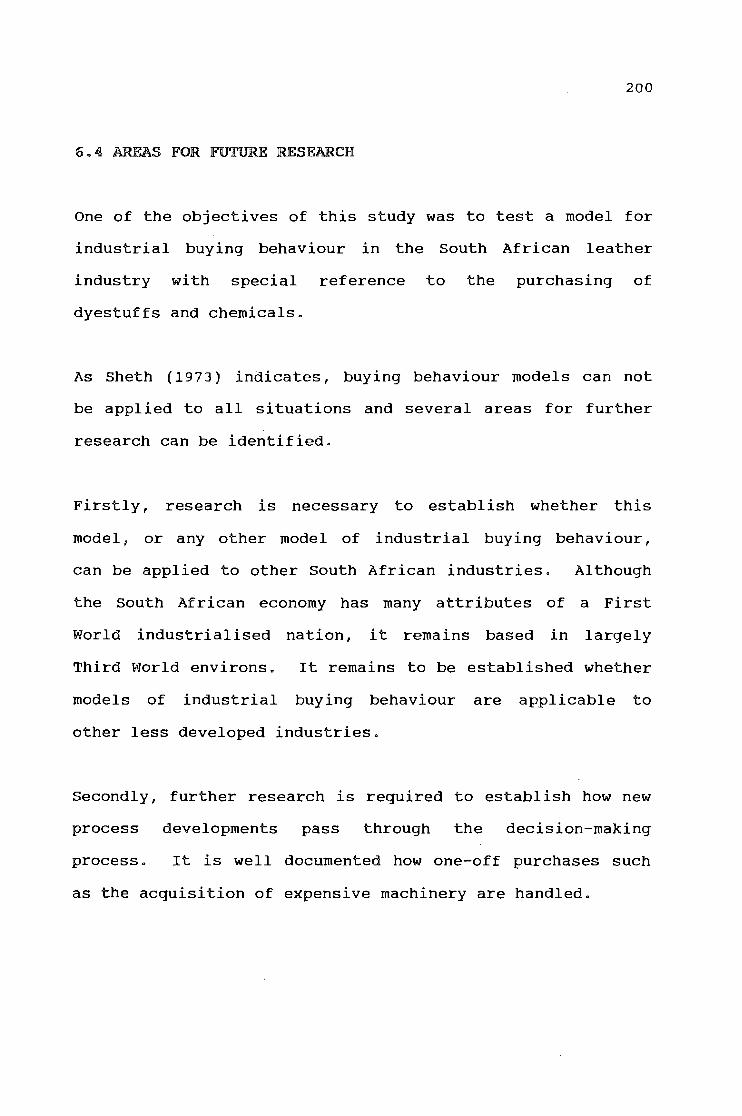
200
6o4 AREAS FOR FUTURE RESEARCH
One of the objectives of this study was to test a model for
industrial buying behaviour in the south
industry with special reference to the
dyestuffs and chemicals.
African leather
purchasing of
As Sheth (1973) indicates, buying behaviour models can not
be applied to all situations and several areas for further
research can be identified.
Firstly, research is necessary to establish whether this
model, or any other model of industrial buying behaviour,
can be applied to other South African industries. Although
the south African economy has many attributes of a First
World industrialised nation, it remains based in largely
Third World environs.
models of industrial
It remains to be established whether
buying behaviour are applicable to
other less developed industries.
Secondly, further research is required to establish how new
process developments pass through the decision-making
process. It is well documented how one-off purchases such
as the acquisition of expensive machinery are handled.

201
However, insufficient reference is made to the development
of new production processes, which may influence the
organisation's profitability and ultimately its survival.
Thirdly, the influence of purchasing policy on the decision
maker, whether this may be beneficial or restrictive,
warrants further research in terms of its impact on
suppliers and products.
6 .. 5 COJllSCLUSION
It is contended that this study has made a start to the
above and has provided information on organisational buying
behaviour in a section of the South African industry. A
model for buying behaviour was selected and tested in the
South African leather industry. Although it was possible to
apply the model successfully, several areas for future
research have been identified.
202
APPENDIX A
JBIBLIOGRAPJH!Y

203
BIBLIOGRAPHY
Aaker, D.A. & Day, G.S. 1990. Narketing researcha 4th
edition. New York: John Wiley & Sons.
Alreck, P.L. & Settle, R.B. 1985. The survey research
handbook. Boston: Richard D. Irwin.
Anderson, P.F. & Chambers, T.M. 1985. A reward measurement
model of organisational buying behaviour. Journal of
Narketing. vol. 49.
Babbie, E.R. 1990. Survey research methodsa
Wadsworth Publishing Company.
Belmont:
Barker, R.F. 1988. Marketing research. Reston: Prentice
Hall.
Berkowitz, M. 1986. New product adoption by the buying
organisation. Industrial marketing management. vol. 15.

204
Bingham, F. B. & Raffield, B. T. 1990. Business to business
marketing management. Homewood: Richard D. Irwin.
Busch, P.S. & Houston, M.J. 1985. Marketing: strategic
foundations. Homewood: Richard D. Irwin.
Choffrey, J. & Lilien, G.L.
industrial marketing strategy.
42.
1978. Assessing response to
Journal of Narketing. vol.
Dillman, D.A. 1978. Mail and! telephone su:rveys. New York:
John Wiley & Sons.
Dillon, W.R., Madden, T.J. & Firtle, N.H. 1993. Essentials
of marketing research.. Boston: Richard D. Irwin.
Doyle, P., Woodside, A.G. & Mitchell, P. 1979. Organisations
buying in new task and rebuy situations. Industrial
marketing research.. vol. a.
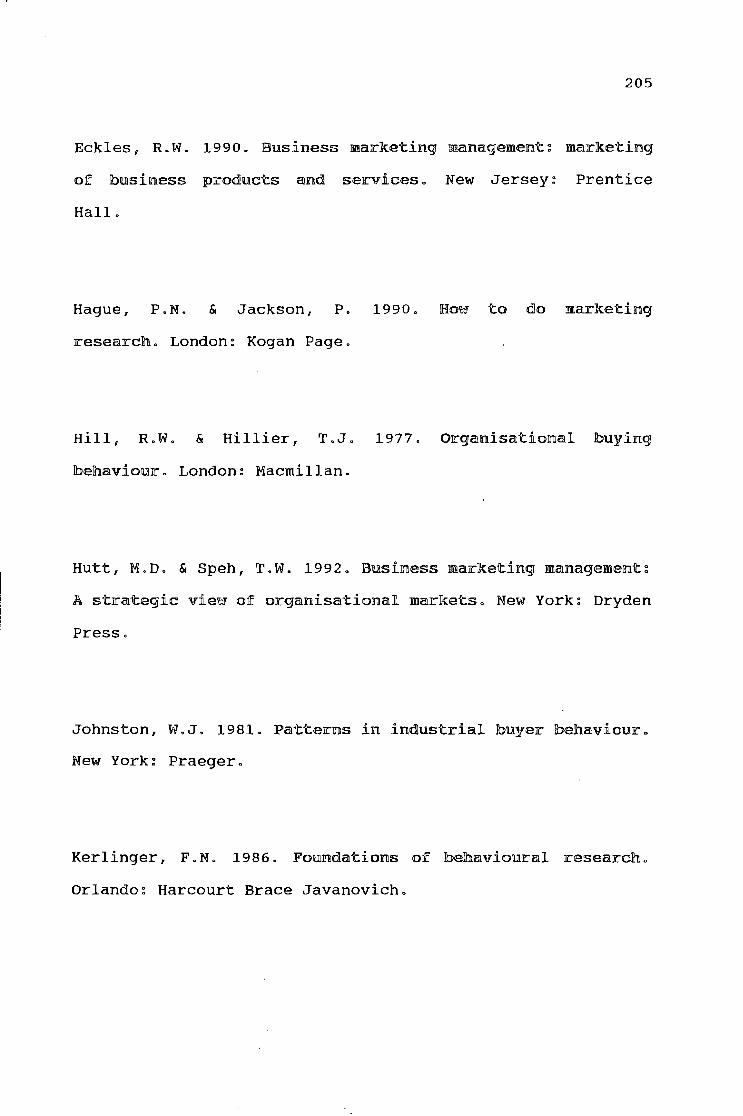
205
Eckles, R.W. 1990. Business marketing management: marketing
of business products and services. New Jersey: Prentice
Hall.
Hague, P.N. & Jackson, P. 1990. Ho~ to do marketing
research. London: Kogan Page.
Hill, R.W. & Hillier, T.J. 1977. Organisational buying
behaviour. London: Macmillan.
Hutt, M.D. & Speh, T.W. 1992. Business marketing management:
A strategic vie~ of organisational markets. New York: Dryden
Press.
Johnston, W.J. 1981. Patterns in industrial buyer behaviour.
New York: Praeger.
Kerlinger, F.N. 1986. Foundations of behavioural research.
Orlando~ Harcourt Brace Javanovich.

206
Kinnear, T.C. & Taylor, J.R. 1987. Marketing researcho 3rd
edition. New York: McGraw-Hill.
Leathero 1993. Trade: South Africa. vol. 195
Lilien, G.L. & Wong, M.A. 1984. Exploratory investigation of
the structure of the buying centre in the metalworking
industry. Journal of Marketing Researcho vol. 21.
Moriarty, R.T. 1983. Industrial buying behaviouro Lexington:
Lexington Books.
Morris, M.H. 1988. Industrial and organisational marketingo
Columbus: Merril Publishing Company.
Nel, P.A., Raedel, F.E. & Loubser, M. 1990. Researching the
South African marketo Pretoria: University of South Africa.
Reeder, P.R., Brierty, E.G. & Reeder, B.H. 1987. Industrial
marketing~ analysisu planning and controlo New Jersey:
Prentice Hall.
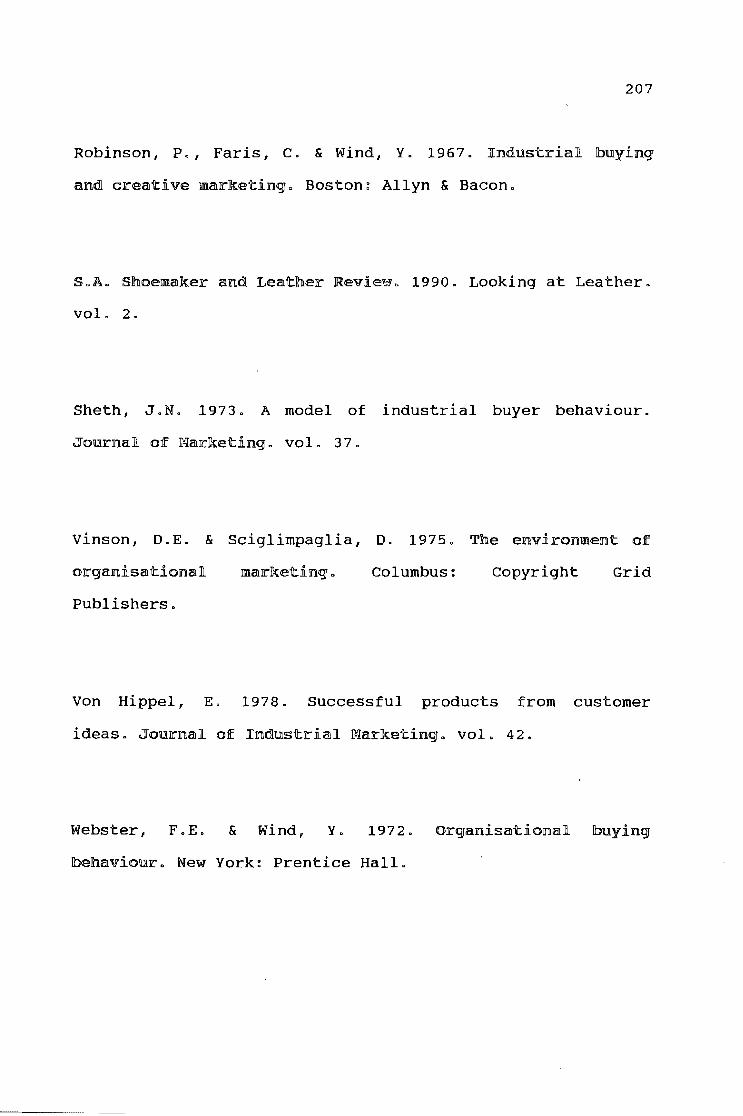
207
Robinson, P., Faris, c. & Wind, Y. 1967. Industrial buying
and creative marketing. Boston: Allyn & Bacon.
S.A. Shoemaker and Leather Revie~. 1990. Looking at Leather.
vol. 2.
Sheth, J.N. 1973. A model of industrial buyer behaviour.
Journal of Warketing. vol. 37.
Vinson, D.E. & Sciglirnpaglia, D. 1975.
organisational marketing. Columbus:
Publishers.
The environment: of
Copyright Grid
Von Hippel, E. 1978. successful products from customer
ideas. Journal of Industrial Narketing. vol. 42.
Webster, F.E. & Wind, Y. 1972. Organisational buying
behaviour. New York: Prentice Hall.

208
Worla Leather. 1991. Regional Focus: South Africa. vol. 4.
Worla Leather. 1992. Upholstery Leather. val. 5.

209
AlPPEWDI:X lB
TELEPHONE QUESTIOWWAIRE
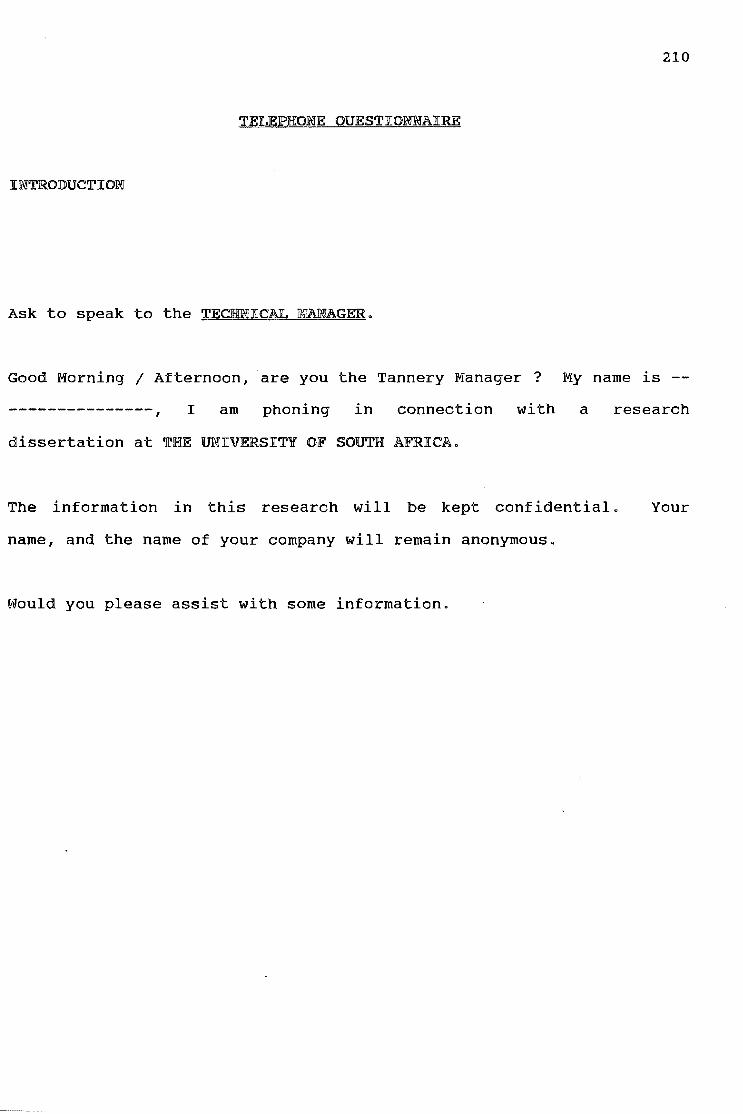
210
TELEPHONE QUESTIONNAIRE
IJin'ROJl)UCTION
Ask to speak to the TECHNICAL MANAGER.
Good Morning 1 Afternoon, are you the Tannery Manager ? My name is -
--------------- I am phoning in connection with a research
dissertation at THE UNIVERSITY OF SOUTH AFRICA.
The information in this research will be kept confidential.
name, and the name of your company will remain anonymous.
Would you please assist with some information.
Your
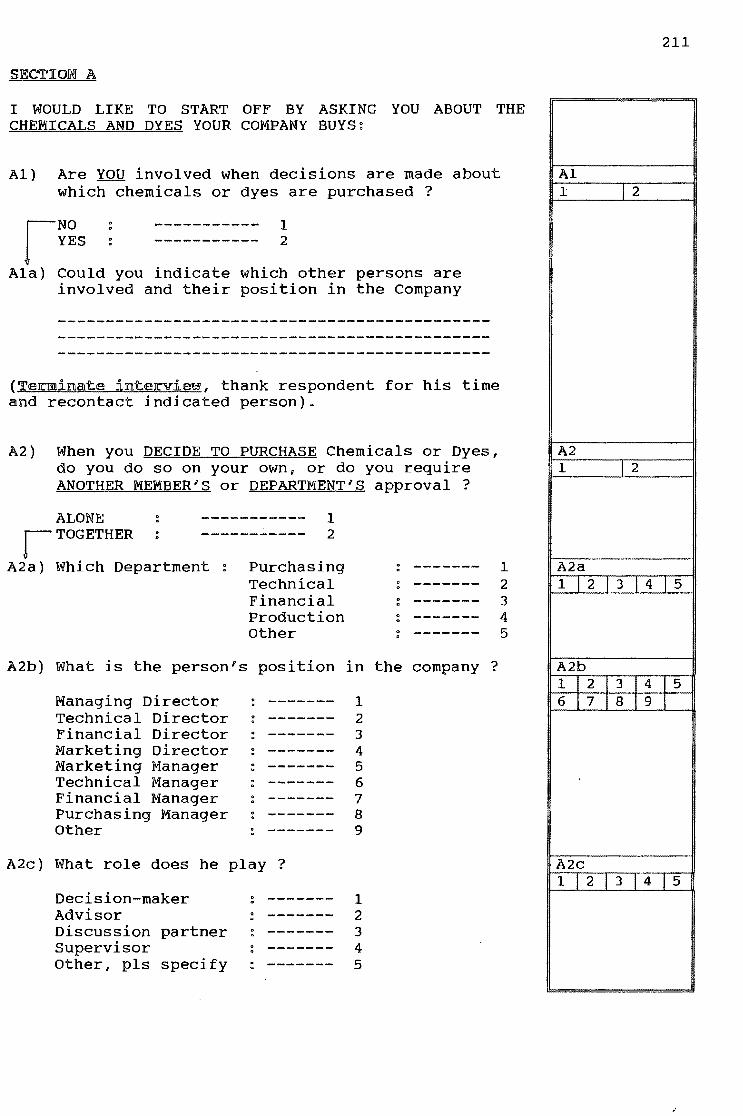
SECTION A
I WOULD LIKE TO START OFF BY ASKING YOU ABOUT THE CHEMICALS AND DYES YOUR COMPANY BUYS:
Al) Are YOU involved when decisions are made about which chemicals or dyes are purchased ?
~NO • ----------- 1 ! YES . ----------- 2
Ala) Could you indicate which other persons are involved and their position in the Company
(Terminate intervie~, thank respondent for his time and recontact indicated person).
A2) When you DECIDE TO PURCHASE Chemicals or Dyes, do you do so on your own, or do you require ANOTHER MEMBER'S or DEPARTMENT'S approval ?
ALONE -----------~ TOGETHER -----------
1 2
A2a) Which Department : Purchasing Technical Financial Production Other
A2b) What is the person's position
:Managing Director -------Technical Director -------Financial Director -------:Marketing Director -------Marketing Manager -------Technical Manager -------Financial Manager -------Purchasing Manager -------Other -------
A2c) What role does he play ?
Decision-maker -------Advisor -------Discussion partner -------Supervisor -------Other, pls specify -------
----------------------------. -------0
in the company ?
1 2 3 4 5 6 7 8 9
1 2 3 4 5
1 2 3 4 5
211
Al 1 j2
IA2 1 12
A2a 1 I 2 1 3 I 4 I 5
A2b 1 1 2 I 3 I 4 I~ 6 I 7 I 8 I 9 I
A2c 1!2131415
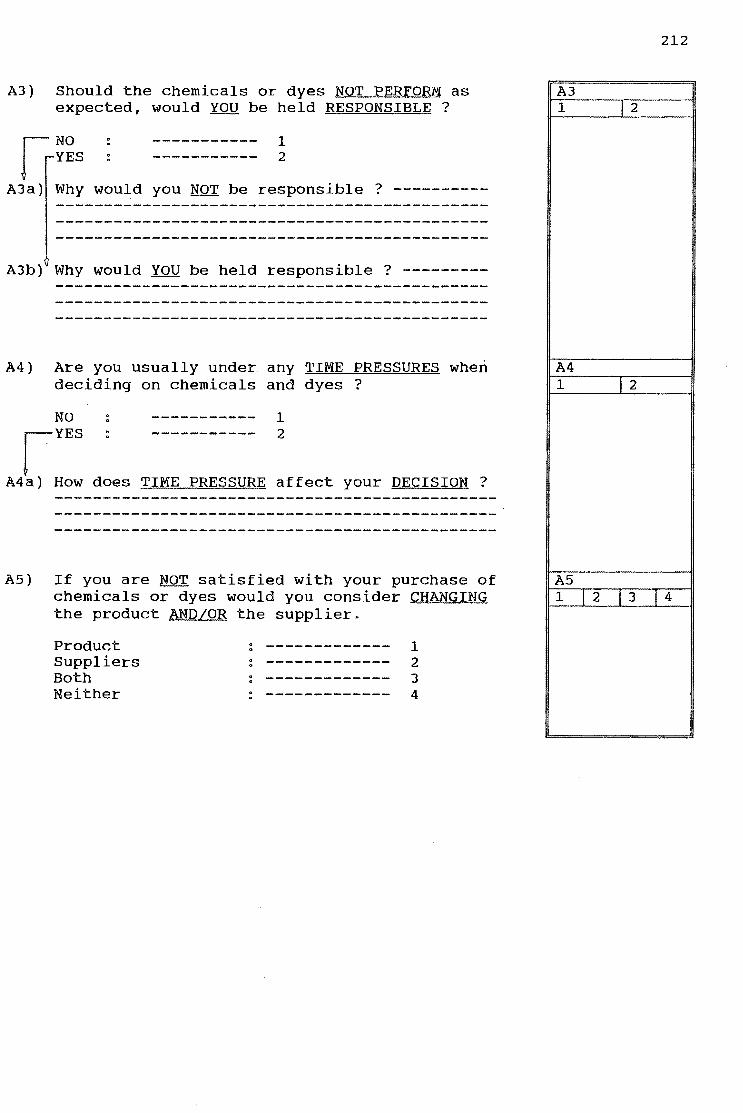
A3) Should the chemicals or dyes NOT PERFORM as expected, would YOU be held RESPONSIBLE ?
~ NO ----------- 1 J I YES ----------- 2
A3a) Why would you NOT be responsible ? ----------
A3b) Why would YOU be held responsible ? ---------
A4) Are you usually under. any TIME PRESSURES when deciding on chemicals and dyes ?
NO
~YES ----------- 1 ----------- 2
A4a) How does TIME PRESSURE affect your DECISION ?
A5) If you are NOT satisfied with your purchase of chemicals or dyes would you consider CHANGING the product AND/OR the supplier.
Product Suppliers Both Neither
------------- 1 ------------- 2 ------------- 3 ------------- 4
212
A3 1 12
A4 1 12
A5 1 12 13 14

A6
a b c
i d
I will read to you 4 BUYING SITUATIONS, please indicate in which of these situations you DECIDE ALONE or TOGETHER with another member of your company. These situations SPECIALLY REFER to your CHEMICALS AND DYES PURCHASES.
A one-off purchase. Repetitive, routine buying. Buying new products from the same supplier. Buying new products from a new supplier.
213
1 1 1 1
ALONE TOGETHER 1 2 1 2 1 2 1 2
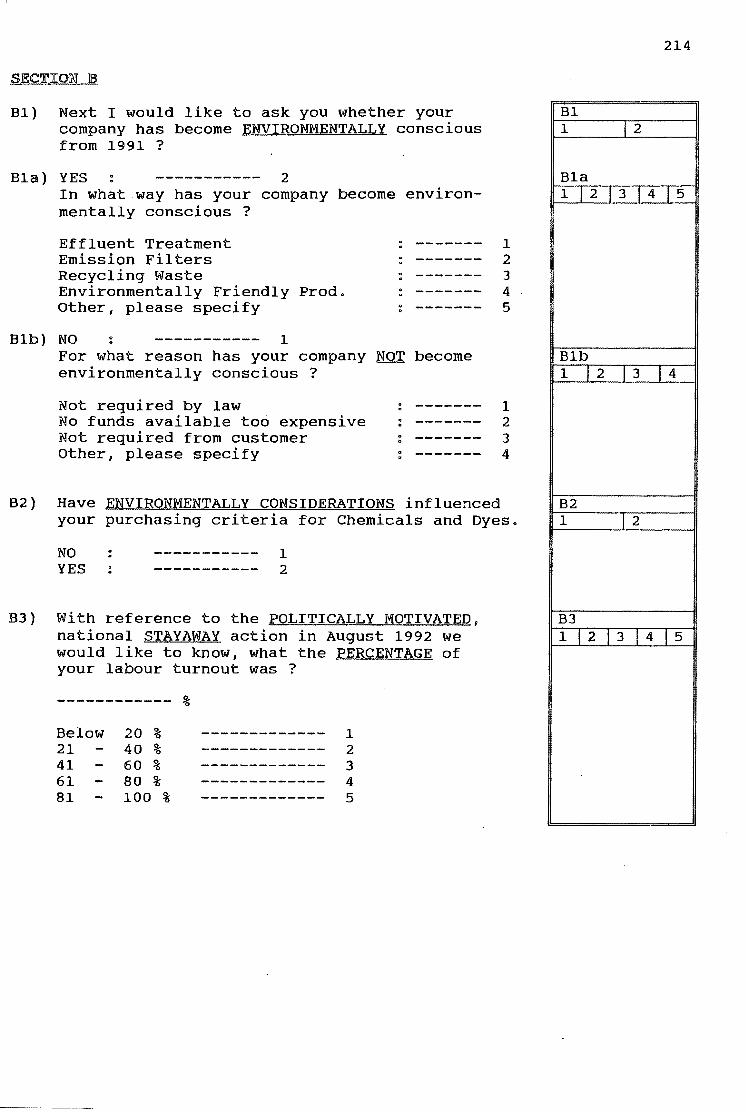
SECT][OW lB
Bl) Next I would like to ask you whether your company has become ENVIRONMENTALLY conscious from 1991 ?
Bla) YES ----------- 2 In what way has your company become environmentally conscious ?
Effluent Treatment Emission Filters Recycling Waste Environmentally Friendly Prod. Other, please specify
Blb) NO ----------- 1
------- 1 ------- 2 ------- 3 ------- 4 ------- 5
For what reason has your company NOT become environmentally consdious ?
Not required by law No funds available too expensive Not required from customer Other, please specify
------- 1 ------- 2 ------- 3
: ------- 4
B2) Have ENVIRONMENTALLY CONSIDERATIONS influenced your purchasing criteria for Chemicals and Dyes.
NO ----------- 1 YES ----------- 2
BJ) With reference to the POLITICALLY MOTIVATED, national STAYAWAY action in August 1992 we would like to know, what the PERCENTAGE of your labour turnout was ?
------------ %
Below 20 % ------------- 1 21 40 % ------------- 2 41 60 % ------------- 3 61 80 % ------------- 4 81 100 % ------------- 5
214
Bl 1 12
Bla 112131415
Blb 1 I 2 13 14
B2 1 12
B3 1 ! 2 I 3 I 4 I 5

B4) The partial LIFTING OF ECONOMIC SANCTIONS have created export opportunities for many South African companies. Has your company been able to BENEFIT from the lifting of sanctions ?
NO rYES :
B4a) How have
----------- 1 ----------- 2
you benefited ?
Increased turnover Increased production capacity Technological Infoo transfer Other, please specify
---------- 1 ---------- 2 ---------- 3 ---------- 4
B4b) To which countries do you export ?
North America South America Asia European East Block Countries
---------- 1 ---------- 2 ---------- 3 ---------- 4 ---------- 5
B4c) Did you export to these countries, before the official lifting of sanctions ?
NO ----------- 1 YES ----------- 2
B4d) In what stage of production do you export your products ?
Wet-Blue hides Semi-finished leather Finished leather Semi-finished articles Finished articles Other, please specify
---------- 1 ---------- 2 ---------- 3 ---------- 4 ---------- 5 ---------- 6
215
B4 1 12
B4a 1 J 2 13 14
B4b 112131415
B4c 1 12
B4d 1 12 13 4 J 5 16
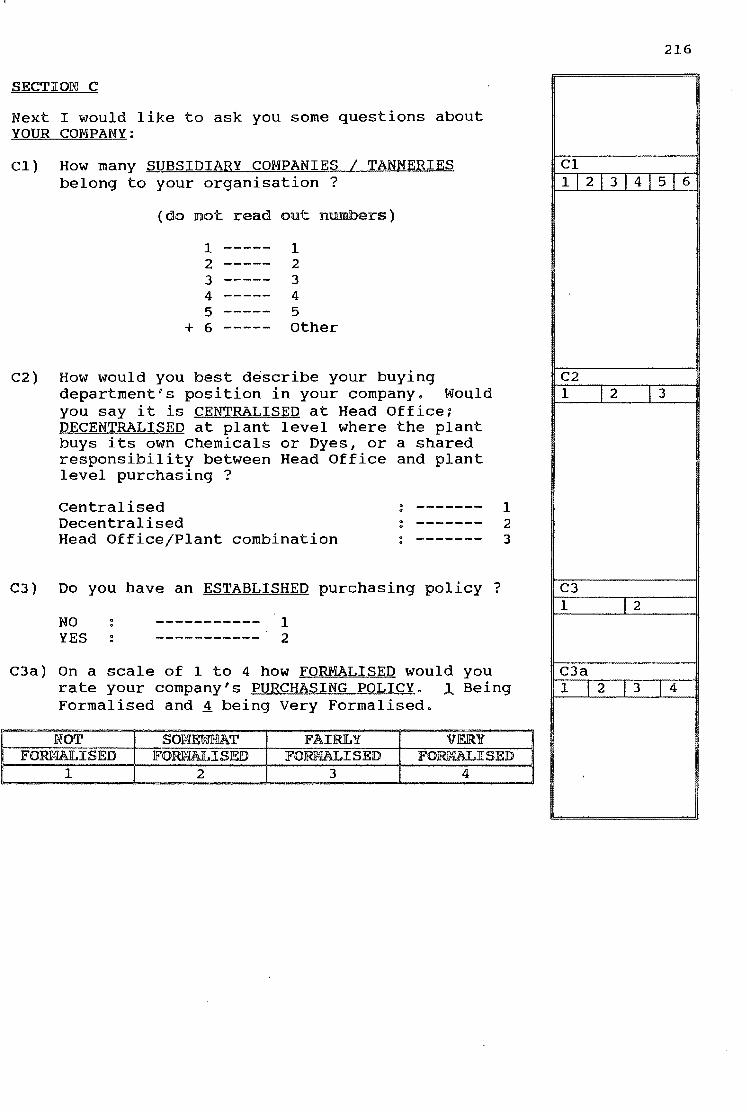
SECTION C
Next I would like to ask you some questions about YOUR COMPANY:
C1) How many SUBSIDIARY COMPANIES I TANNERIES belong to your organisation ?
(do not read out numbers)
1 ----- 1 2 ----- 2 3 ----- 3 4 ----- 4 5 ----- 5
+ 6 ----- Other
C2) How would you best describe your buying departmentgs position in your company. Would you say it is CENTRALISED at Head Office; DECENTRALISED at plant level where the plant buys its own Chemicals or Dyes, or a shared responsibility between Head Office and plant level purchasing ?
Centralised Decentralised Head Office/Plant combination
------- 1 ------- 2 ------- 3
C3) Do you have an ESTABLISHED purchasing policy ?
NO ----------- 1 YES ----------- 2
C3a) On a scale of 1 to 4 how FORMALISED would you rate your company's PURCHASING POLICY. 1 Being Formalised and ~ being Very Formalised.
N'OT SOJNEWJHIAT FAIRLY VERY FORlliiA][.ISED FORWALISED FOROOALISED FOJRII!llU.ISED
1 2 3 4
216
C1 1I21314I51:I:
C2 1 12 13
C3 1 12
C3a 1 I 2 13 14

C4) How many EMPLOYEES does your company have ?
----------- (specific number)
1) 1 40 2) 41 - 80 3) 81 - 120 4) 121 - 160 5) 161 - 200 6) 201 - 240 7) 241 - 280 8) 281 - 320 9) 321 - 360 a) 361 +
C5) How would you best describe your company's PERSONNEL ORIENTATION. Is it DOMINATED by TECHNICAL Personnel, COMMERCIAL Personnel or by PRODUCTION Personnel ?
1) 2) 3)
Technical Commercial Production
---------- 1 ---------- 2 ---------- 3
217
C4 112 I 3 I 4 I 5 I 6 7 18 19 Ia
C5 1 12 13
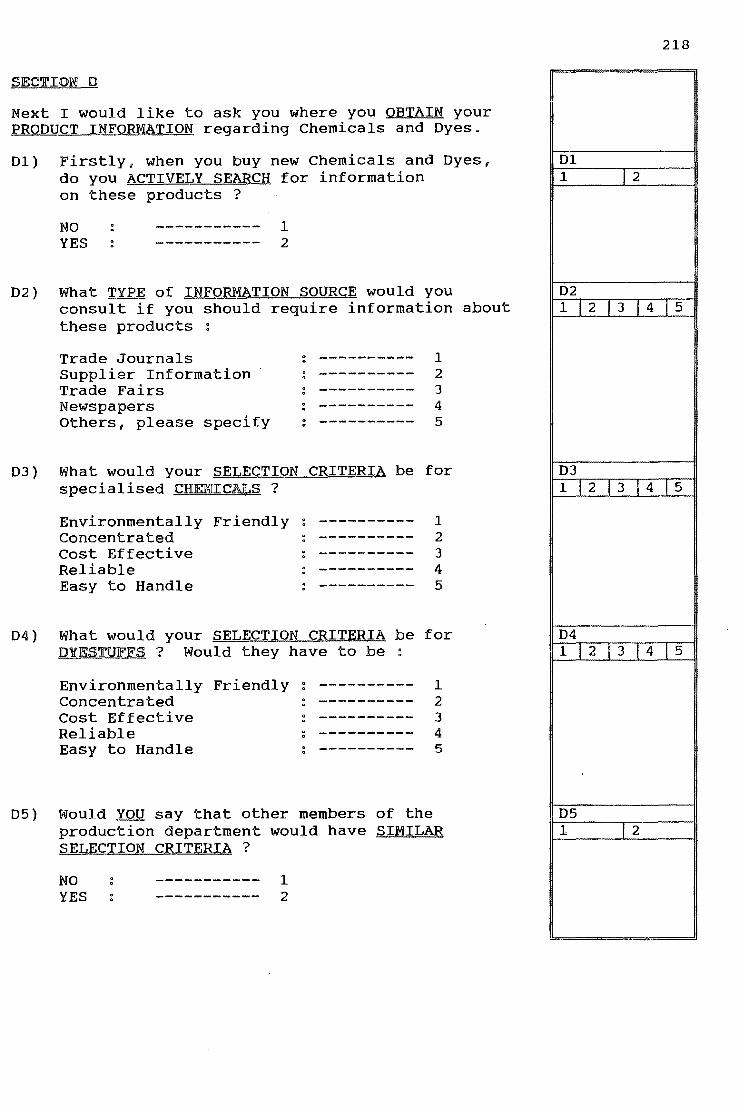
I
SJEC'!'J[Oii.\!f D
Next I would like to ask you where you OBTAIN your PRODUCT INFORMATION regarding Chemicals and Dyes.
D1) Firstly, when you buy new Chemicals and Dyes, do you ACTIVELY SEARCH for information on these products ?
NO ----------- 1 YES ----------- 2
D2) What TYPE of INFORMATION SOURCE would you consult if you should require information about these products :
Trade Journals Supplier Information Trade Fairs Newspapers Others, please specify
---------- 1 ---------- 2 ---------- 3 ---------- 4 ---------- 5
D3) What would your SELECTION CRITERIA be for specialised CHEOOJrChLS ?
Environmentally Friendly Concentrated cost Effective Reliable Easy to Handle
---------- 1 ---------- 2 ---------- 3 ---------- 4 ---------- 5
D4) What would your SELECTION CRITERIA be for DYESTUFFS ? Would they have to be
Environmentally Friendly Concentrated Cost Effective Reliable Easy to Handle
---------- 1 ---------- 2 ---------- 3 ---------- 4 ---------- 5
05) Would YOU say that other members of the production department would have SIMILAR SELECTION CRITERIA ?
NO ----------- 1 YES ----------- 2
218
D1 1 T2
D2 112131415
D3 1121314!5
04 112T314I5
05 1 12
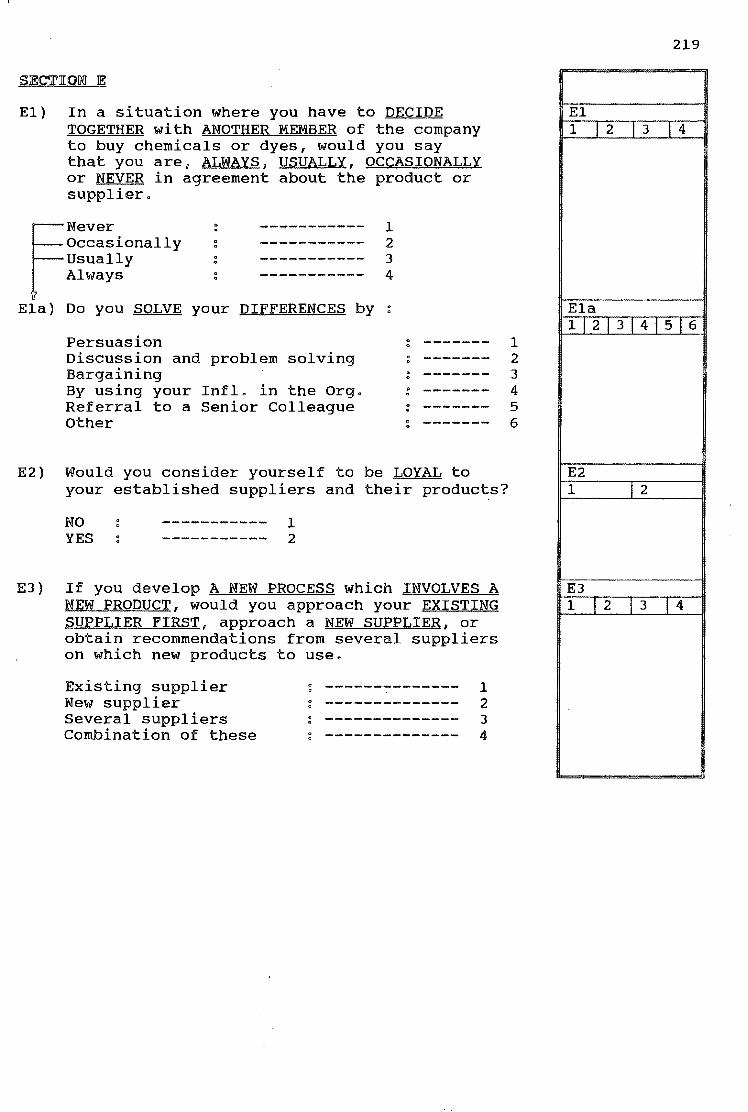
SECTIOW E
E1) In a situation where you have to DECIDE TOGETHER with ANOTHER MEMBER of the company to buy chemicals or dyes, would you say that you are, ALWAYS, USUALLY, OCCASIONALLY or NEVER in agreement about the product or supplier.
Occasionally Usually Always rNever
E1a) Do you SOLVE
Persuasion
. .
your DIFFERENCES by
Discussion and problem solving Bargaining By using your Infl. in the Org. Referral to a Senior Colleague Other
1 2 3 4
------- 1 ------- 2 ------- 3
: ------- 4 ------- 5 ------- 6
E2) Would you consider yourself to be LOYAL to your established suppliers and their products?
NO ----------- 1 YES ----------- 2
E3) If you develop A NEW PROCESS which INVOLVES A NEW PRODUCT, would you approach your EXISTING SUPPLIER FIRST, approach a NEW SUPPLIER, or obtain recommendations from several suppliers on which new products to use.
Existing supplier New supplier Several suppliers Combination of these
-------------- 1 -------------- 2 -------------- 3 -------------- 4
219
E1 1 12 I 3 I 4
E1a 11213141516
E2 1 12
E3 1 I 2 13 14

SJE:CTIOW JEi'
I would like to conclude this questionnaire by asking you some questions about YOURSELF :
F1) How many years have you been in this INDUSTRY ? --------- Years.
F2) How many year have you been with this COMPANY ? --------- Years.
F3) Do you have any SPECIALISED QUALIFICATIONS ?
NO ----------- 1 r---YES ----------- 2
F3a) What type of qualification: National Diploma (Leather/SA) University Degree (BSc) Local Technical Diploma (Leather) Intn. Technical Diploma (Leather) Certificate of Competence (SA) Other please specify
------------------------------
F4) How would you rate your ANNUAL financial package Below R 80 000 ------ 1 R 80 000 R100 000 ------ 2 R100 000 R120 000 ------ 3 R120 000 R140 000 ------ 4 R140 000 ------ 5
F5) Do you ACTIVELY take part/participate in any SPORT ?
NO ----------- 1 YES ----------- 2
F6) Do you have any HOBBIES ?
NO ----------- 1 YES ----------- 2
This concludes the interview.
Thank you for your time and co-operation.
1 2 3 4 5 6
220
F1
F2
F3 1 12
F3a 1 12 13 14 5 T6 T I
F4 1 I 2 I 3 I 4 l 5
F5
1 12
F6 1 12

221
APPJE:OODIX C
COVJE:RIOOG LJE:T"''llm

LLL
NIVERSITEIT VAN SUID-AFRIKA UNIVERSITY OF SOUTH AFRICA , 392 01 f'f1EH)fliA
TTX JF,(JQ6B TA UNISA
'Iff. (0 17.) "2!1,3111 FAX (012) 429·3221
(012) 1129,2533
INTERNASIONAAL12H12 r\29~!111 INTEBNATIONAL
VEHV\.'YSING
un nu£nENCE ONS VF.flWYStNH OtJf! HF.f(!~fcNCE
NAVHAfi
ENOUIHIES ®NI\VHM
ENOIJHllt:s
429-4020 0
3 September 1992
.TO WHOM IT MAY CONCERN
You will shortly be receiving a call from a Unisa student who is doing research for his Masters in Commerce thesis in Business Economics. Your response to this request for information will be of great importance to the validity of the results and the thesis itself. There will be no sensitive information requested, and confidentiality will be protected at all times. We ask for your support. If there are any questions p 1 ease contact me at the number listed below:
Your sincerely
R Machado
R Machado Department of Business Economics Phone: 012 429-4020
DEPARTMENT OF BUSINESS ECONOMICS

223
Al!?l!?ENIDIX ID
QUESTIONNAIRE PRETESTING
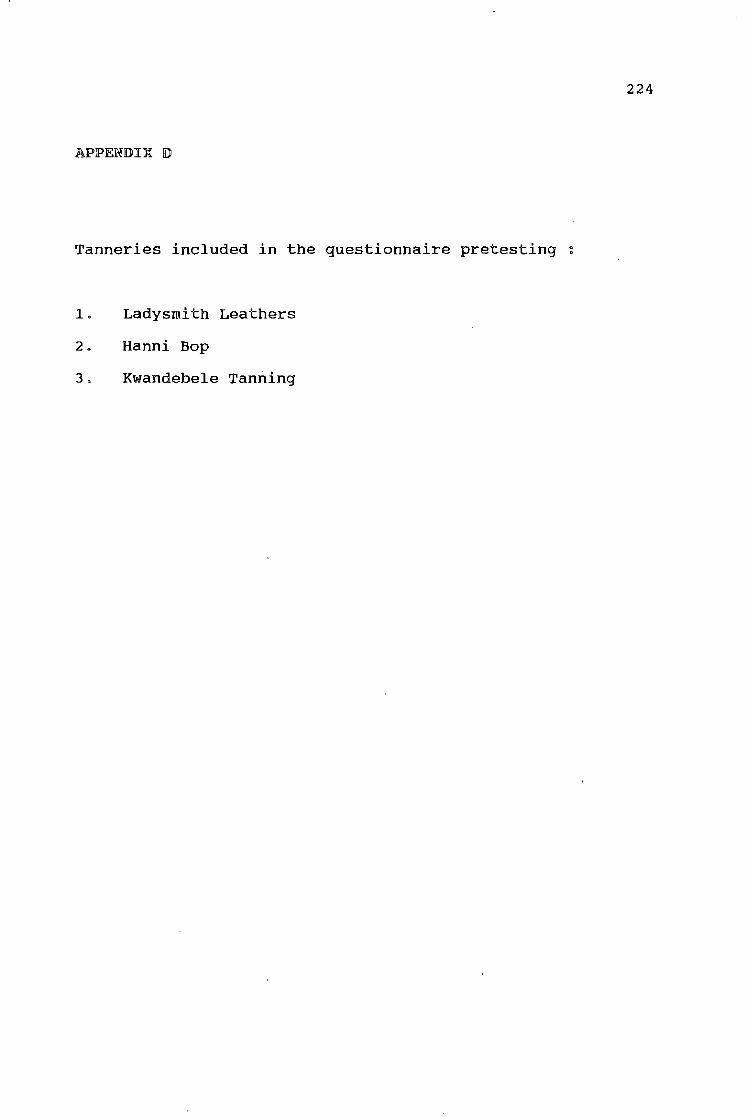
224
AJPJPEWIDIX lD
Tanneries included in the questionnaire pretesting
1. Ladysmith Leathers
2. Hanni Bop
3. Kwandebele Tanning

225
APPE!I!DIX E
I!I!TERVIEWS

226
APPENDIX E
Interviews held with knowledgeable persons regarding their
tanneries production output and market segment.
Western Tanning
King Tanning
Mossop Leathers
Exotan
Ladysmith Leathers
Hanni Leathers (Nigel)
Hanni Bop
sutherlands Tannery
East cape Tanning
Bader Bop
Kwiktan
Kwandebele Tanning
Klein Karoo Landbou Koop.
Corium Leathers
African Game Industries
Bachs Tanners
Pilanssberg Tanners
Mr. P. van Niekerk
Mr. R. Hensman
Mr. A. Hakimi
Mr. D. Boast
Mr. I. Stopforth
Mr. R. Delfel
Mr. A. Basi
Mr. B. Wyss
Mr. B. Plaaitjies
Mr. s. Wells
Mr. J. Lewis
Mr. F. van Rensburg
Mr. P. Swanepoel
Mr. G. Tutt
Mr. A. Pienaar
Mr. A. Ferreira
Mr. T. Ranzoni