Aspects of asphaltene aggregation obtained from coarse- grained ...
13
Aspects of asphaltene aggregation obtained from coarse- grained molecular modelling Julio F. Jover a,b , Erich A. Müller a , Andrew J. Haslam a,c , Amparo Galindo a , George Jackson a , Hervé Toulhoat b , Carlos Nieto-Draghi b ,* a Department of Chemical Engineering, Imperial College London, South Kensington Campus, London SW7 2AZ, U.K. b IFP Energies Nouvelles, 1 et 4, Avenue de Bois-Préau, 92852 Rueil-Malmaison, France. c Qatar Carbonates and Carbon Storage Research Centre (QCCSRC), Imperial College London, London SW7 2AZ, U.K. KEYWORDS: molecular dynamics, crude oil, fouling Supporting Information : SI.m4v; movie of simulations of a Coarse grained asphaltene model in Heptane and Toluene ABSTRACT: We have performed a molecular-simulation-based study to explore the some of the underlying mecha- nisms of asphaltene aggregation. The daunting complexity of the crude-oil + asphaltene system precludes any type of meaningful molecular simulation unless some assumptions are made with respect to the key physical and chemical properties that must be explicitly described. In the present work we focus on molecular simulations of a coarse-grained (CG) model of asphaltene molecules in pure solvents, which are based on the assumption that the general size asym- metry and asphaltene morphology play a key role in the aggregation process. We use simple single isotropic Lennard- Jones sites to represent paraffinic and aromatic C6 segments, which are used as building blocks for the description of continental asphaltene models and solvent moieties. Parameters for the intermolecular models (ε and σ) for solute and solvent molecules are chosen to reproduce the experimental density of the liquid phase for different mixtures. An ex- plicit pure solvent has been considered and the relationship between the aggregation mechanism and the solvent nature has been investigated through direct simulation of the aggregation process. The results reproduce accurately expected trends observed for more-complex models as well as experiments, e.g., strong aggregation of asphaltene molecules in n- heptane and high solubility in toluene. Different asphaltene models based on different geometries reveal that even at this level of simplification the topology of the molecules (number and position of aliphatic branches) does affect the way molecules aggregate. 1. INTRODUCTION Asphaltenes have been studied for well over 50 years 1 , yet remain one of the least-understood components of crude oil. They are formally defined as a solubility class 2,3 ; specifically they are classified as soluble in toluene but insoluble in n-heptane (although in some cases they are defined instead with reference to insolu- bility in n-hexane or n-pentane). This definition, how- ever, does not suffice to provide any insight into the nature of the molecules themselves. The quantity and properties of asphaltenes ex- tracted from a single source vary according to the pre- cipitant, the temperature, the pressure and the length of time elapsed between mixing and precipitation 1 . Accordingly, early in the studies of asphaltenes the need for standardising the procedures used to engineer precipitation was identified. In the late seventies Dickie and Yen 4 introduced a hierarchical approach to the study of asphaltene precipitation. Two levels of aggre- gation were proposed: a first level in which asphaltene molecules adhere forming a “nano-aggregate”, and a second level wherein the nano-aggregates themselves aggregate forming clusters. Interestingly more empha- sis was put on the structures of the two levels of aggre- gates than on the actual molecular detail. A modern version of this model is still used as the reference for asphaltene deposition 5 .With the reduction of light-oil reserves around the world, crudes previously discarded as problematic are now considered to be economically viable. Consequently more effort and resources are being put into improving our understanding of why and how asphaltenes, once called the cholesterol of oil 6 , aggregate and precipitate, causing all kinds of serious extraction and production problems. Yet, in
Transcript of Aspects of asphaltene aggregation obtained from coarse- grained ...
Aspects of asphaltene aggregation obtained from coarse-grained molecular modelling
Julio F. Jovera,b, Erich A. Müllera, Andrew J. Haslama,c, Amparo Galindoa, George Jacksona, Hervé Toulhoatb, Carlos Nieto-Draghib,* aDepartment of Chemical Engineering, Imperial College London, South Kensington Campus, London SW7 2AZ, U.K. bIFP Energies Nouvelles, 1 et 4, Avenue de Bois-Préau, 92852 Rueil-Malmaison, France. c Qatar Carbonates and Carbon Storage Research Centre (QCCSRC), Imperial College London, London SW7 2AZ, U.K.
KEYWORDS: molecular dynamics, crude oil, fouling
Supporting Information : SI.m4v; movie of simulations of a Coarse grained asphaltene model in Heptane and Toluene
ABSTRACT: We have performed a molecular-simulation-based study to explore the some of the underlying mecha-nisms of asphaltene aggregation. The daunting complexity of the crude-oil + asphaltene system precludes any type of meaningful molecular simulation unless some assumptions are made with respect to the key physical and chemical properties that must be explicitly described. In the present work we focus on molecular simulations of a coarse-grained (CG) model of asphaltene molecules in pure solvents, which are based on the assumption that the general size asym-metry and asphaltene morphology play a key role in the aggregation process. We use simple single isotropic Lennard-Jones sites to represent paraffinic and aromatic C6 segments, which are used as building blocks for the description of continental asphaltene models and solvent moieties. Parameters for the intermolecular models (ε and σ) for solute and solvent molecules are chosen to reproduce the experimental density of the liquid phase for different mixtures. An ex-plicit pure solvent has been considered and the relationship between the aggregation mechanism and the solvent nature has been investigated through direct simulation of the aggregation process. The results reproduce accurately expected trends observed for more-complex models as well as experiments, e.g., strong aggregation of asphaltene molecules in n-heptane and high solubility in toluene. Different asphaltene models based on different geometries reveal that even at this level of simplification the topology of the molecules (number and position of aliphatic branches) does affect the way molecules aggregate.
1. INTRODUCTION
Asphaltenes have been studied for well over 50 years1, yet remain one of the least-understood components of crude oil. They are formally defined as a solubility class2,3; specifically they are classified as soluble in toluene but insoluble in n-heptane (although in some cases they are defined instead with reference to insolu-bility in n-hexane or n-pentane). This definition, how-ever, does not suffice to provide any insight into the nature of the molecules themselves.
The quantity and properties of asphaltenes ex-tracted from a single source vary according to the pre-cipitant, the temperature, the pressure and the length of time elapsed between mixing and precipitation1. Accordingly, early in the studies of asphaltenes the need for standardising the procedures used to engineer precipitation was identified. In the late seventies Dickie
and Yen4 introduced a hierarchical approach to the study of asphaltene precipitation. Two levels of aggre-gation were proposed: a first level in which asphaltene molecules adhere forming a “nano-aggregate”, and a second level wherein the nano-aggregates themselves aggregate forming clusters. Interestingly more empha-sis was put on the structures of the two levels of aggre-gates than on the actual molecular detail. A modern version of this model is still used as the reference for asphaltene deposition5.With the reduction of light-oil reserves around the world, crudes previously discarded as problematic are now considered to be economically viable. Consequently more effort and resources are being put into improving our understanding of why and how asphaltenes, once called the cholesterol of oil6, aggregate and precipitate, causing all kinds of serious extraction and production problems. Yet, in
2
spite of the number of publications devoted to asphal-tenes, there remains much debate concerning their molecular weight and structure, as the technique that is employed in their elucidation usually influences the results that are obtained and the conclusions that can be drawn7.
A consequence of its definition as a solubility class is that the term “asphaltene” represents a family of compounds rather than a single molecule. Moreover, the inherent difficulty of determining the composition and structure of asphaltene molecules has led to con-troversy in our understanding of both. Notwithstanding this, most proposed asphaltene structures fall into one of two classes: continental asphaltenes, consisting of a central dense aromatic region, formed from several fused aromatic rings (usually around 20) with aliphatic chains connected to the outer rings; and archipelago asphaltenes, consisting of a reduced number (3-4) of small aromatic clusters (4-7 fused rings) linked by short aliphatic chains. Irrespective of the class of mod-el, it is generally agreed that hetero-atoms, e.g., sulfur and oxygen, are present in these structures, although their role in determining properties is less clear.
Through the years asphaltenes have been modeled and simulated in different ways; representations of asphaltenes have ranged from colloid-like entities1,8,
discotic molecules9, to full-atom models10,11 and even surrogate molecules with similar features as expected in asphaltene structures12,13. In theory, the asphaltene problem could be attacked by performing large-scale atomistic molecular simulations, however, even with current state-of-the-art computing facilities, the length and time-scales required remain inaccessible to this brute-force approach. This difficulty is especially acute in relation to the study of aggregation phenomena. Recently Maqbool et al14. have studied experimentally the temporal evolution of stable and unstable asphal-tene-solvent systems. Their results established that the time required for asphaltene precipitation can be sub-ject to enormous variation, even for the same precipi-tant, highlighting the importance of encompassing long time-scales when simulating asphaltenes. To access the length and time scales required, it is necessary to make approximations in order to speed up the simulation of such systems.
Coarse graining allows one to reduce the degrees of freedom in a simulation, opening a window in terms of accessible length and time scales. This technique has been successfully used to model other complex mole-cules, such as proteins15 and bolaamphiphiles16; here we adopt this approach in our simulation study of asphal-tene aggregation. Our aim is to create simple asphal-tene models starting with basic building blocks and to study their aggregation behavior, thereby identifying characteristics of real asphaltene precipitation that can be explained without atomic-level molecular detail. It is our hope that this study can provide insight into the general behaviour of asphaletene-containing fluids.
This paper is organized as follows: first, parame-ters for the coarse-grained molecules are defined and tested, then different asphaltene molecule models are presented and lastly a cluster analysis of asphaltenes in different solvents is performed.
2. BUILDING A COARSE-GRAINED MODEL OF ASPHALTENE
For simplicity, as a case study we choose to study con-tinental-type molecules (as opposed to archipelago or island morphologies). In a traditional united-atom simulation, each carbon centre (or hetero-atom centre) would be represented using a site, described by a cen-tro-symmetric potential such as the Lennard-Jones (LJ) potential; in general, only hydrogen atoms would be neglected. The LJ potential between two particles (or sites) a distance r apart is expressed as
, where ε is an energetic parame-
ter and σ is a parameter representing particle size. Here, however, following most of the current coarse-graining approaches17,18,19,20, and in order to keep com-plexity to a minimum, several atoms are grouped into single LJ sites. These coarse-grained (CG) sites are in turn used as building blocks for constructing more-complex molecules. In this way, we treat asphaltenes in a generalized fashion by means of coarse-graining asphaltene molecules into aromatic and aliphatic sites, joined together in appropriate fashion to create either continental or archipelago structures.
A suitable choice for the aliphatic site is n-heptane. This is convenient since n-heptane is the paraffinic solvent that is used in our simulations of the phase behaviour of asphaltene mixtures (as a link to ASTM D6560/D3279/D4124 standards for asphaltene extraction); thereby the complexity of our simulations is kept to a minimum. On the same basis, one could choose toluene to represent the aromatic site, since this is the aromatic solvent to be employed in our sim-ulations of mixture phase behaviour. However, since toluene also incorporates an alkyl group (i.e., an ali-phatic constituent), we choose instead benzene, the purely aromatic molecule most-closely resembling toluene. Thereby both our aliphatic and aromatic sites represent moieties comprising similar numbers of carbon centres (seven and six), providing better con-sistency than, for example, a choice of the next-smallest purely aromatic molecule, naphthalene.
2.1. Model development
It is common practice when performing molecular simulation (especially when dealing with LJ fluids) to express properties in dimensionless units21: T* = TkB ⁄ ε, P* = σ3P ⁄ ε and ρ* = ρ ⁄ σ3; here T represents the abso-lute temperature, P is the pressure, ρ is the density, and kB is Boltzmann’s constant. A simple way of ob-taining the value of ε / kB is to relate the LJ reduced critical temperature, Tc-LJ*, to the critical temperature
φ r( ) = 4ε σ r( )12 − σ r( )6( )
3
Tc of the fluid of interest; in reduced units the critical properties for the LJ fluid are22: Tc-LJ* = 1.312; Pc-
LJ* = 0.1279 and ρc-LJ* = 0.316. (Care has to be taken as the critical values obtained in simulation are known to vary with the methodology and the cutoff radius used23,24.) In consequence, a simple way of obtaining the appropriate value of ε is to relate the LJ critical reduced temperature to the critical temperature of the fluid of interest. This allows ε, the energy parameter, to be calculated as:
εkB
= TcTc-LJ*
. (1)
The size parameter, σ, can be obtained in two different ways following an analogous approach using either the critical density or the critical pressure. The former gives rise to
�
σρc = ρc-LJ*
ρc
⎛
⎝ ⎜
⎞
⎠ ⎟
13, (2)
and the latter yields
�
σ Pc = Pc-LJ*
Pc
⎛
⎝ ⎜
⎞
⎠ ⎟
13; (3)
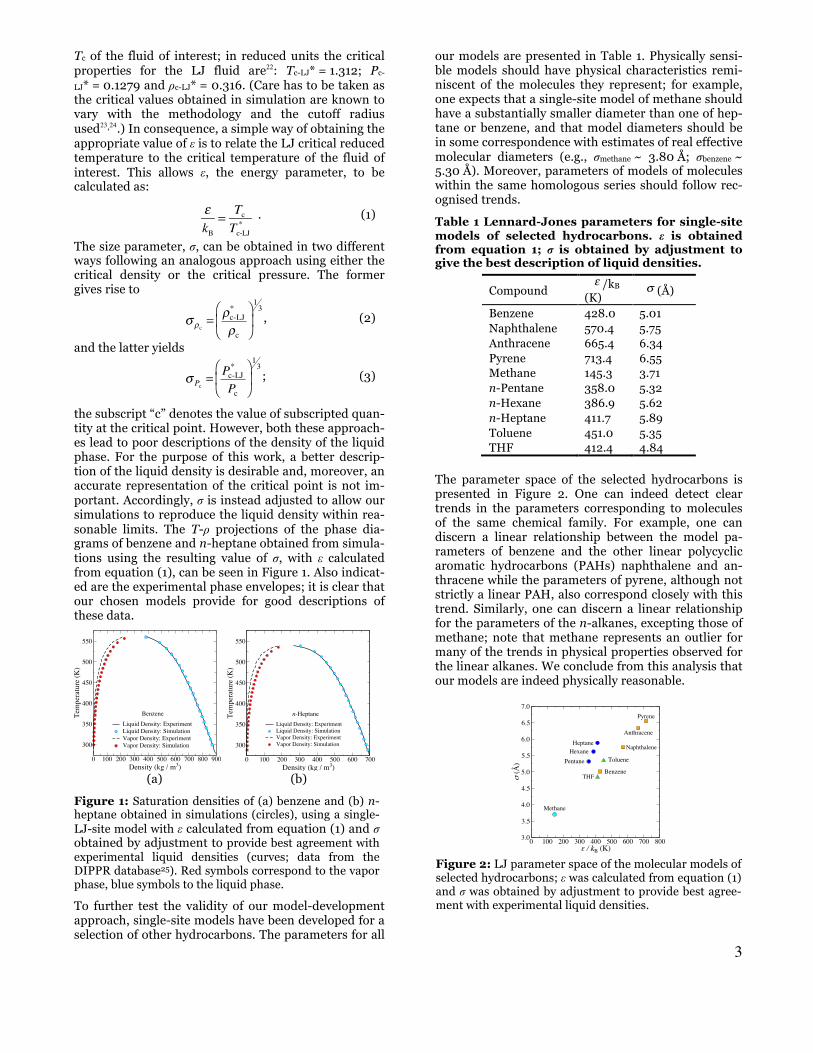
the subscript “c” denotes the value of subscripted quan-tity at the critical point. However, both these approach-es lead to poor descriptions of the density of the liquid phase. For the purpose of this work, a better descrip-tion of the liquid density is desirable and, moreover, an accurate representation of the critical point is not im-portant. Accordingly, σ is instead adjusted to allow our simulations to reproduce the liquid density within rea-sonable limits. The T-ρ projections of the phase dia-grams of benzene and n-heptane obtained from simula-tions using the resulting value of σ, with ε calculated from equation (1), can be seen in Figure 1. Also indicat-ed are the experimental phase envelopes; it is clear that our chosen models provide for good descriptions of these data.
(a) (b)
Figure 1: Saturation densities of (a) benzene and (b) n-heptane obtained in simulations (circles), using a single-LJ-site model with ε calculated from equation (1) and σ obtained by adjustment to provide best agreement with experimental liquid densities (curves; data from the DIPPR database25). Red symbols correspond to the vapor phase, blue symbols to the liquid phase.
To further test the validity of our model-development approach, single-site models have been developed for a selection of other hydrocarbons. The parameters for all
our models are presented in Table 1. Physically sensi-ble models should have physical characteristics remi-niscent of the molecules they represent; for example, one expects that a single-site model of methane should have a substantially smaller diameter than one of hep-tane or benzene, and that model diameters should be in some correspondence with estimates of real effective molecular diameters (e.g., σmethane ~ 3.80 Å; σbenzene ~ 5.30 Å). Moreover, parameters of models of molecules within the same homologous series should follow rec-ognised trends.
Table 1 Lennard-Jones parameters for single-site models of selected hydrocarbons. ε is obtained from equation 1; σ is obtained by adjustment to give the best description of liquid densities.
Compound ε /kB (K)
σ (Å)
Benzene 428.0 5.01 Naphthalene 570.4 5.75 Anthracene 665.4 6.34 Pyrene 713.4 6.55 Methane 145.3 3.71 n-Pentane 358.0 5.32 n-Hexane 386.9 5.62 n-Heptane 411.7 5.89 Toluene 451.0 5.35 THF 412.4 4.84
The parameter space of the selected hydrocarbons is presented in Figure 2. One can indeed detect clear trends in the parameters corresponding to molecules of the same chemical family. For example, one can discern a linear relationship between the model pa-rameters of benzene and the other linear polycyclic aromatic hydrocarbons (PAHs) naphthalene and an-thracene while the parameters of pyrene, although not strictly a linear PAH, also correspond closely with this trend. Similarly, one can discern a linear relationship for the parameters of the n-alkanes, excepting those of methane; note that methane represents an outlier for many of the trends in physical properties observed for the linear alkanes. We conclude from this analysis that our models are indeed physically reasonable.
Figure 2: LJ parameter space of the molecular models of selected hydrocarbons; ε was calculated from equation (1) and σ was obtained by adjustment to provide best agree-ment with experimental liquid densities.
0 100 200 300 400 500 600 700 800 900Density (kg / m3)
300
350
400
450
500
550
Tem
pera
ture
(K)
Liquid Density: ExperimentLiquid Density: SimulationVapor Density: ExperimentVapor Density: Simulation
Benzene
0 100 200 300 400 500 600 700Density (kg / m3)
300
350
400
450
500
550
Tem
pera
ture
(K)
Liquid Density: ExperimentLiquid Density: SimulationVapor Density: ExperimentVapor Density: Simulation
n-Heptane
PentaneHexane
Pyrene
Toluene
Methane
0 100 200 300 400 500 600 700 800¡ / kB (K)
3.0
3.5
4.0
4.5
5.0
5.5
6.0
6.5
7.0
m (Å
)
Heptane
THFBenzene
Anthracene
Naphthalene

4
2.2 Mixtures of Lennard-Jones molecules.
Before describing the construction of our CG mole-cules, it is important to demonstrate the efficacy of our modeling in respect of mixtures of the constituent moi-ties, i.e., toluene, n-heptane and benzene.
Simulations of binary mixtures comprising these moi-ties were performed in the isothermal-isobaric ensem-ble (constant number of particles, pressure and tem-perature). Simulations at T = 293 K and 473 K were performed for each mixture, with molar compositions of either component of 0.25, 0.5 and 0.75. The unlike (or cross) parameters, which define the interaction between unlike molecules of species i and j were ob-tained using standard modified Lorentz-Berthelot combining rules,
(4)
where sub-indices ii and jj indicate parameters for the interactions of species i and j with themselves and the sub-index ij denotes parameters used when calculating interactions between a site of species i with a one of species j. ξij is an adjustable parameter; for these mix-tures, the simulations were performed without adjust-ment (i.e., ξben-hep = ξben-tol = ξtol-hep = 1). Density-composition phase diagrams from these simulations are provided in Figure 3; our simulations (symbols) provide good descriptions of the experimental data.
(a)
(b) (c)
Figure 3: Density-composition phase diagrams for binary mixtures of (a) benzene + n-heptane, (b) n-heptane + toluene and (c) benzene + toluene; symbols represent our simulation results, while the curves rep-resent experimental data (from the DIPPR database 25).
2.3 Constructing multiple-site CG molecules.
For the sake of simplicity, henceforth parameters or variables referring to the aromatic sites will be denoted with the subscript A while those of the paraffinic sites will be written with the subscript P.
(a) (b)
Figure 4: Pictorial representation of the coarse-graining scheme. (a) The CG units used in our current work as “building blocks”, or sites, are benzene and n-heptane; the CG n-heptane and toluene models are used as sol-vents. (b) Larger molecules are constructed from the CG sites as illustrated; the bond distance (degree of overlap) can be fine-tuned to provide the best description of ex-perimental data. (Note that the models of naphthalene, anthracene and pyrene do not correspond to the single-site models presented in Table 1.)
We now assess how our single-site models of benzene and n-heptane are best used as “building blocks” to create models of larger molecules. The basic strategy is illustrated in Figure 4. In the case of large molecules comprising more than two sites, where appropriate (e.g., representing conjugated aromatic rings), sites can be constrained to be co-planar. The bond lengths, i.e., separations between the centres of connected sites, are treated as adjustable; allowing neighbouring sites to overlap permits the models to better capture the properties of real molecules. However, a single value of the bond length lAA between connected aromatic sites is used for all the CG molecules and, similarly, a single value of the bond length lAP between connected aro-matic and paraffinic sites.
Simulations of naphthalene, represented as two aro-matic (benzene) sites, were used to fine-tune the bond length lAA, which is defined graphically in Figure 5(a).
(a) (b)
Figure 5: Pictorial representation of molecular parame-ters (a) σAA and lAA, and (b) σPP and lAP.
Simulations were carried out using three different bond lengths, lAA = σben, 0.95 σben and 0.90 σben (where the subscript “ben” indicates the value corresponding to the benzene model); the latter two correspond to
0 0.2 0.4 0.6 0.8 1xn-heptane
500
600
700
800
900
Liqu
id D
ensit
y (k
g/m
3 )
T = 293.15 K
T = 473.15 K
Symbols: simulationCurves: experiment
0 0.2 0.4 0.6 0.8 1xtoluene
500
600
700
800
900
Liqu
id D
ensit
y (k
g/m
3 )
T = 473.15 K
Symbols: simulation
T = 293.15 K
Curves: experiment
; ε ij = ξij ε iiε jj σ ij =
σ ii +σ jj
2⎛⎝⎜
⎞⎠⎟

5
overlapping (“fused”) spheres. The results, together with experimental data can be seen in Figure 6.
Figure 6: Effect of the bond length, lAA, on the density of naphthalene modeled as a benzene dimer. Diamonds, circles, and squares represent the simulation results for bond-lengths lAA = σben, 0.95 σben and 0.90 σben (respec-tively). The continuous curve represents experimental data (from the DIPPR database25).
It is apparent from this figure that although (as one would intuitively expect) the simulated liquid density increases when lAA is reduced, the slope of the curves, ∂ρ ⁄ ∂T, is insensitive to lAA. The value lAA = 0.9 σben was selected, since it provides the best representation of the experimental densities over the lower part of the tem-perature range (which is of more relevance for our study).
Simulations of heptylbenzene, represented as an aro-matic (benzene) and an aliphatic (n-heptane) site linked together, were used to fine-tune the bond length lAP, which is defined graphically in Figure 5(b). The unlike (or cross) parameters, which define the interac-tion between A and P-type sites, were obtained using the modified Lorentz-Berthelot combining rules given in Equation 4. These simulations allowed for the fine-tuning of not only the aromatic-paraffinic bond length lAP, but also the cross energy parameter εAP (through the modification of the parameter ξAP in Equation 4); the size parameter σAP is given simply by σben-hep. While the behavior of the density with changes in lAP was, as ex-pected, qualitatively the same as that observed for naphthalene (with changes in lAA), varying ξAP did alter the temperature dependence of the density, as can be seen in Figure 7. The combination ξAP = 0.85 and lAP = 0.90 σben-hep was selected, as this pair gave the best results at lower temperatures.
Figure 7: Effect of the bond length, lAP, and the cross energy interaction parameter, ξAP, on the density of hepty-lbenzene modeled as benzene and an n-heptane site linked. Red symbols correspond to results for the simulations using lAP = 0.90 σben-hep, and blue symbols to those using lAP = σben-hep. The continuous curve represents experi-mental data (from the DIPPR database25).
2.3. Asphaltene molecules.
Our work represents a proof-0f-concept study to ascer-tain whether one can capture essential features of the behaviour of asphaltenic fluids using CG models fea-turing only the essence of the topology of asphaltenes, i.e., flat aromatic regions linked to flexible paraffinic ones. It is important to reiterate that we were not con-cerned with molecular-level detail such as the influ-ence of hetero-atoms, which are usually accounted for when studying asphaltenes2,3,8. Our CG models mimic so-called island or continental-type ashpaltenes, fea-turing a conjugated aromatic core, constructed as a “daisy-like” configuration of seven fused aromatic sites; a central site is surrounded by six sites forming a regular hexagon. Attached to the periphery of this core is either a single or a pair of paraffinic sites; these are not constrained to lie in the plane of the core. Models with a single paraffinic site are referred to as “Cont1” and those with two as “Cont2”; ortho, meta and para isomers of Cont2 are considered. The molecular weight of these isomers is 747.2g/mol. Ideally, one would prefer somewhat larger molecules, however by choos-ing this geometry the explicit inclusion of solvent mol-ecules in our simulations remains computationally tractable. The full geometry of our models is defined in Figure 8 and 9.

6
(a)
(b)
Figure 8: Continental “Cont1” asphaltene; aromatic sites are represented by (smaller) orange spheres and the paraffinic site by the (larger) blue sphere. The paraffinic site is free to rotate out of the plane of the core, but not within the plane, as illustrated in (a); the angle so sub-tended is denoted by α. The angle subtended by the planes of two molecules is denoted by θ as illustrated in (b); this is defined independently of α (the case α = 0 is depicted). The distance between the centres of the aro-matic cores is denoted by dAA.
3. SIMULATIONS
Molecular-dynamics simulations of solutions of each asphaltene were carried out using DL_POLY26. This code can handle rigid structures, and also rigid and flexible units bonded together, which allowed the mole-cules to be defined as rigid aromatic sheets with flexible paraffinic sites, as defined in Figures 8 and 9. To achieve this, the program uses different algorithms: a combination of the SHAKE algorithm by Ryckaert et al27 for the distance constraint used in the bonds, with the Fincham implicit quaternion algorithm28 for the rigid bodies.
Each simulation comprised a minimum of 100 asphal-tene molecules (regardless of type). The size of the simulation box and the number of solvent molecules were calculated to provide an asphaltene concentration of 50g of asphaltene per liter of solvent. This concen-tration corresponds to roughly 7% by weight, which is the higher limit of concentrations observed in stable heavy crudes (e.g., Venezuelan crudes). Details of the characteristics of the simulated systems can be seen in Table 2. In each case, at least 25 million time-steps (of 1 fs) were performed.
(a) (b)
(c)
(d) (e)
(f)
Figure 9: Continental “Cont2” asphaltenes in (a) ortho, (b) meta and (c) para configurations. Aromatic sites are represented by (smaller) orange spheres and paraffinic ones by (larger) blue spheres. The paraffinic sites of all three conformers are free to rotate out of the plane of the core, but not within the plane. The angle subtended by a line through the plane of the core and the line between the centres of a paraffinic site and its bonded aromatic site is denoted by α; this is illustrated in (c) for the para configuration. The projected distance on the plane of the core between paraffinic sites on the same core is denoted by dPP. The relative misorientation between two mole-cules is denoted by φ, as illustrated in (d) for the para configuration. This is most conveniently obtained as the angle subtended by the projections of the orientation vector ω of each molecule; this is illustrated for the meta configuration in (e). The angle subtended by the planes of two molecules is denoted by θ, as illustrated in (f); this is defined independently of the relative orientations of the paraffinic sites (the case α = α´= 0 is depicted). The distance between the centres of the aromatic cores is denoted by dAA.
7
Table 2: Simulation parameters for the different asphaltenes in toluene and n-heptane at two dif-ferent temperatures, T = 293.15 K and 473.15 K. lsim-box denotes the length of the simulation box.
Parameter Solvent T (K) Molecule Cont1 Cont2
No. Molecules 100 100 lsim-box (Å) 135.38 135.38 Solvent sites toluene 293 6098 7043 Solvent sites toluene 473 9473 10940 Solvent sites n-heptane 293 4428 5113 Solvent sites n-heptane 473 6366 7352
4. RESULTS AND DISCUSSION
To follow the evolution of the simulations, the energy and pressure of the system, as well as the average clus-ter distribution (cn(t)) were analyzed. Each simulation was analysed in four successive time intervals with the aim of studying the temporal evolution of the average cluster distribution. The models developed had the expected solubility behavior without the need of any further adjustment, e.g. they clustered in heptane while remaining soluble in toluene. In the supplementary material we present a movie in which Cont1 type mole-cules are placed in simulation box with heptane and toluene; the aggregation in heptane is evident visually. Qualitatively, the behaviour of both types of asphal-tenes (“Cont1” and “Cont2”) were similar; in the inter-ests of brevity, we therefore restrict our discussion to the latter type.
4.1. Continental “Cont2” asphaltenes.
To study the aggregation a basic cluster analysis was performed using an algorithm, originally developed by Stoddard29, that is based on the Stillinger criterion30: particles which find themselves within a specified dis-tance, hereafter called the clustering distance (rsamp), belong to the same cluster. This algorithm does not consider the relative orientation of the molecules as a criterion (in contrast to those used for analyses of crys-tals, e.g., Steinhardt31) nor does it keep track of time-dependent variables, such as average cluster life. The implementation of the criterion of Stoddard is rather simple. A molecule i is selected and the distance be-tween this molecule and all the other molecules calcu-lated. Each molecule j positioned within the clustering distance is classified as belonging to the same cluster, thereby identifying a first shell of molecules. In turn, each of the molecules in this shell is then checked against the particles not associated with the cluster; again molecules within a distance rsamp are classified as belonging to the same cluster. This procedure is repeat-ed until no further molecules are added to the cluster. The remaining clusters are identified in the same fash-ion, each time beginning with a molecule not yet as-signed to an existing cluster, until all molecules have been assigned (note that within this procedure, any
remaining isolated molecules are formally classed as clusters comprising just a single molecule).
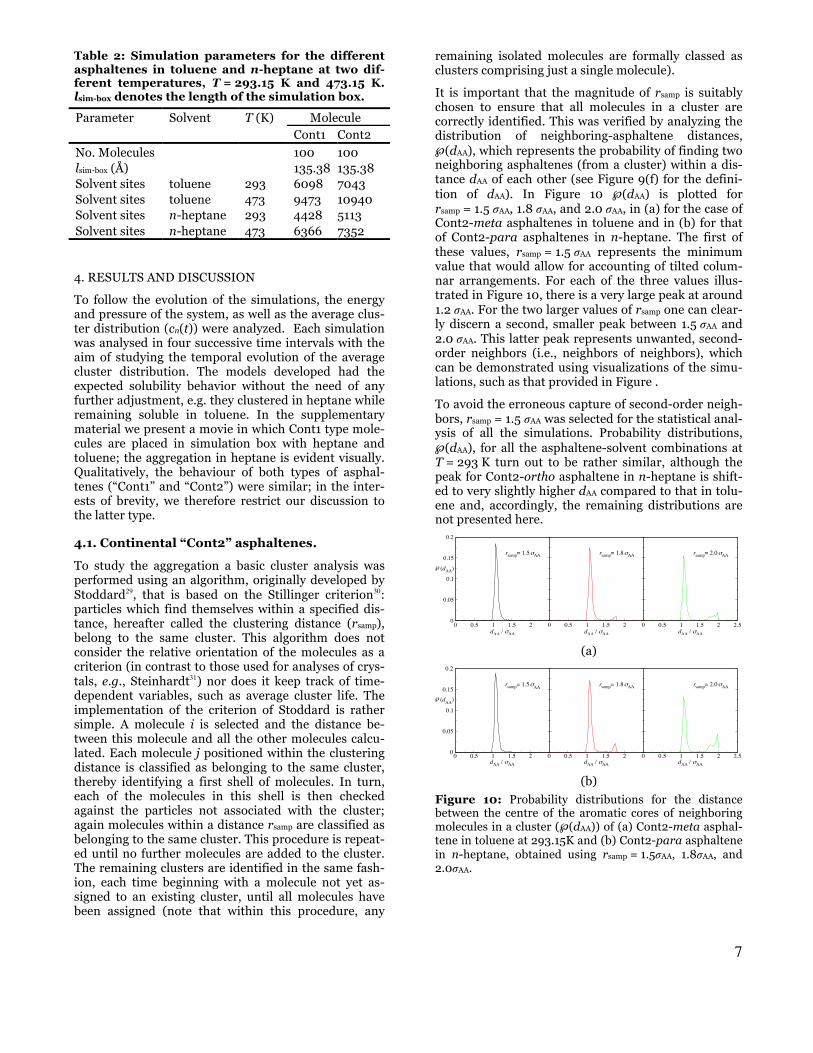
It is important that the magnitude of rsamp is suitably chosen to ensure that all molecules in a cluster are correctly identified. This was verified by analyzing the distribution of neighboring-asphaltene distances, ℘(dAA), which represents the probability of finding two neighboring asphaltenes (from a cluster) within a dis-tance dAA of each other (see Figure 9(f) for the defini-tion of dAA). In Figure 10 ℘(dAA) is plotted for rsamp = 1.5 σAA, 1.8 σAA, and 2.0 σAA, in (a) for the case of Cont2-meta asphaltenes in toluene and in (b) for that of Cont2-para asphaltenes in n-heptane. The first of these values, rsamp = 1.5 σAA represents the minimum value that would allow for accounting of tilted colum-nar arrangements. For each of the three values illus-trated in Figure 10, there is a very large peak at around 1.2 σAA. For the two larger values of rsamp one can clear-ly discern a second, smaller peak between 1.5 σAA and 2.0 σAA. This latter peak represents unwanted, second-order neighbors (i.e., neighbors of neighbors), which can be demonstrated using visualizations of the simu-lations, such as that provided in Figure .
To avoid the erroneous capture of second-order neigh-bors, rsamp = 1.5 σAA was selected for the statistical anal-ysis of all the simulations. Probability distributions, ℘(dAA), for all the asphaltene-solvent combinations at T = 293 K turn out to be rather similar, although the peak for Cont2-ortho asphaltene in n-heptane is shift-ed to very slightly higher dAA compared to that in tolu-ene and, accordingly, the remaining distributions are not presented here.
(a)
(b)
Figure 10: Probability distributions for the distance between the centre of the aromatic cores of neighboring molecules in a cluster (℘(dAA)) of (a) Cont2-meta asphal-tene in toluene at 293.15K and (b) Cont2-para asphaltene in n-heptane, obtained using rsamp = 1.5σAA, 1.8σAA, and 2.0σAA.
0 0.5 1 1.5 2dAA / mII
0
0.05
0.1
0.15
0.2
§(dAA)
0 0.5 1 1.5 2dAA / mII
0 0.5 1 1.5 2 2.5dAA / mII
rsamp= 1.5mII rsamp= 1.8mII rsamp= 2.0mII
0 0.5 1 1.5 2dAA / mII
0
0.05
0.1
0.15
0.2
§(dAA)
0 0.5 1 1.5 2dAA / mII
0 0.5 1 1.5 2 2.5dAA / mII
rsamp= 1.5mII
rsamp= 1.8mII rsamp= 2.0mII

8
Figure 11: The final configuration of the simulation of Cont2-ortho asphaltene in n-heptane at T = 293 K, illus-trating the nature of the clustering of the asphaltene mol-ecules. The solvent and paraffinic sites of the asphaltenes are not shown and individual molecules are presented in different colors to ease visualization of the stacking.
In Figure 12 we present the temporal evolutions of the total system energy (plotted as a running average per hundred time steps), together (on alternate axes) with those of the cluster-size probability distribution ℘(cn), representing the probability of occurrence of a cluster of n molecules, for simulations at T = 293 K of Cont2-para asphaltene in (a) toluene and (b) n-heptane. From Figure (a) one can discern that the energy is oscillating about a constant value, while the cluster-size probabil-ity distribution in each quarter of the simulation is very similar and indicates a preponderance of “clusters” comprising just a single molecule (i.e., isolated mole-cules); no large clusters are present. In contrast, in (b), for the simulation of asphaltene in n-heptane, the ener-gy oscillates around a steadily decreasing value, while the cluster-size probability distribution indicates the presence of progressively larger clusters in each quarter of the simulation. During the first quarter, isolated asphaltene molecules are the most probable, although still significantly less probable than for the simulation of asphaltenes in toluene depicted in (a). In the second quarter, asphaltene dimers are the most probable, while tetramers are more probable than trimers. In the third quarter, pentamers are seen to be more probable than tetramers, themselves still more probable than trimers. Pentamers may be formed by the coalescence of dimers and trimers, or by that of tetramers and monomers, whereas tetramers will arise from the coa-lescence of dimers with dimers or trimers and mono-mers. Interestingly, in the final quarter of the simula-tion, the probability of both tetramers and pentamers has dropped, while the probability of decamers has sharply increased, and the probability of clusters as large as ~ 30 monomers is significant. This latter ob-servation could indicate that, above a certain size, clus-ters are more likely to meet and coalesce with other clusters, forming larger clusters still. It is noticeable, however, that the probability of monomers remains approximately constant after the first quarter of the simulation. These observations are consistent with the continual coalescence of smaller clusters into bigger clusters; given unlimited time for the simulation, such
a pattern of behaviour could lead to a system contain-ing only very large clusters, together with monomers (or very small clusters), which could be interpreted as a phase separation wherein an asphaltene-rich phase would be in equilibrium with a solvent-rich (or asphal-tene-poor) phase. However, to confirm this, the simu-lation would need to be extended to observe the system over a significantly longer timescale, which was not feasible due to the prohibitive computational expense. Nevertheless, the behaviour is consistent with and suggestive of insolubility of the asphaltene in n-heptane, while that illustrated in (a) is consistent with and suggestive of solubility of the asphaltene in tolu-ene.
(a)
(b)
Figure 12: Running average of the system energy, and average cluster distribution in each quarter of the simula-tion (alternate axes), for the Cont2-para asphaltene at 293K in: (a) toluene and (b) n-heptane. In (a) the energy oscillates about an approximately constant value through-out the entire simulation, and the cluster distribution is almost identical in the two last quarters of the simulation; in (b), the n-heptane case, a continuous decrease in energy is seen, while the size of the aggregates increases.
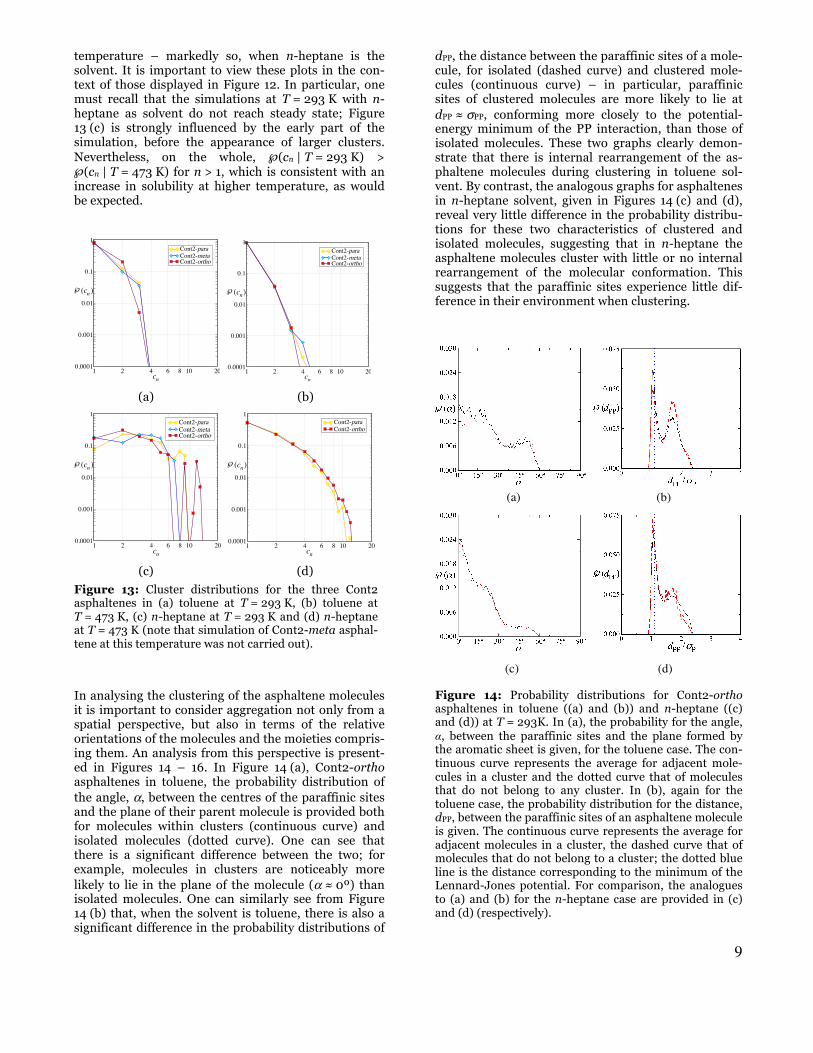
The influence of temperature on the asphaltene mo-lecular aggregation is displayed in Figure 13. In (a) and (b) cluster-size probability distributions are given for the three “Cont2” asphaltenes in toluene, at T = 293 K and 473 K, respectively; in (c) and (d) analogous plots for “Cont2” asphaltenes in n-heptane are provided. One can discern from the figure that the differences in topology of the model asphaltenes play a role in their aggregation, particularly at the lower of the two tem-peratures. Noting the logarithmic nature of the vertical axis it is apparent that, regardless of topology, the probability of isolated molecules increases at higher
9
temperature – markedly so, when n-heptane is the solvent. It is important to view these plots in the con-text of those displayed in Figure 12. In particular, one must recall that the simulations at T = 293 K with n-heptane as solvent do not reach steady state; Figure 13 (c) is strongly influenced by the early part of the simulation, before the appearance of larger clusters. Nevertheless, on the whole, ℘(cn | T = 293 K) > ℘(cn | T = 473 K) for n > 1, which is consistent with an increase in solubility at higher temperature, as would be expected.
(a) (b)
(c) (d)
Figure 13: Cluster distributions for the three Cont2 asphaltenes in (a) toluene at T = 293 K, (b) toluene at T = 473 K, (c) n-heptane at T = 293 K and (d) n-heptane at T = 473 K (note that simulation of Cont2-meta asphal-tene at this temperature was not carried out).
In analysing the clustering of the asphaltene molecules it is important to consider aggregation not only from a spatial perspective, but also in terms of the relative orientations of the molecules and the moieties compris-ing them. An analysis from this perspective is present-ed in Figures 14 – 16. In Figure 14 (a), Cont2-ortho asphaltenes in toluene, the probability distribution of the angle, α, between the centres of the paraffinic sites and the plane of their parent molecule is provided both for molecules within clusters (continuous curve) and isolated molecules (dotted curve). One can see that there is a significant difference between the two; for example, molecules in clusters are noticeably more likely to lie in the plane of the molecule (α ≈ 0º) than isolated molecules. One can similarly see from Figure 14 (b) that, when the solvent is toluene, there is also a significant difference in the probability distributions of
dPP, the distance between the paraffinic sites of a mole-cule, for isolated (dashed curve) and clustered mole-cules (continuous curve) – in particular, paraffinic sites of clustered molecules are more likely to lie at dPP ≈ σPP, conforming more closely to the potential-energy minimum of the PP interaction, than those of isolated molecules. These two graphs clearly demon-strate that there is internal rearrangement of the as-phaltene molecules during clustering in toluene sol-vent. By contrast, the analogous graphs for asphaltenes in n-heptane solvent, given in Figures 14 (c) and (d), reveal very little difference in the probability distribu-tions for these two characteristics of clustered and isolated molecules, suggesting that in n-heptane the asphaltene molecules cluster with little or no internal rearrangement of the molecular conformation. This suggests that the paraffinic sites experience little dif-ference in their environment when clustering.
(a) (b)
(c) (d)
Figure 14: Probability distributions for Cont2-ortho asphaltenes in toluene ((a) and (b)) and n-heptane ((c) and (d)) at T = 293K. In (a), the probability for the angle, α, between the paraffinic sites and the plane formed by the aromatic sheet is given, for the toluene case. The con-tinuous curve represents the average for adjacent mole-cules in a cluster and the dotted curve that of molecules that do not belong to any cluster. In (b), again for the toluene case, the probability distribution for the distance, dPP, between the paraffinic sites of an asphaltene molecule is given. The continuous curve represents the average for adjacent molecules in a cluster, the dashed curve that of molecules that do not belong to a cluster; the dotted blue line is the distance corresponding to the minimum of the Lennard-Jones potential. For comparison, the analogues to (a) and (b) for the n-heptane case are provided in (c) and (d) (respectively).
1 2 4 6 8 10 20cn
0.0001
0.001
0.01
0.1
1
§(cn )
Cont2-paraCont2-metaCont2-ortho
1 2 4 6 8 10 20cn
0.0001
0.001
0.01
0.1
1
§(cn )
Cont2-paraCont2-metaCont2-ortho
1 2 4 6 8 10 20cn
0.0001
0.001
0.01
0.1
1
§(cn )
Cont2-paraCont2-metaCont2-ortho
1 2 4 6 8 10 20cn
0.0001
0.001
0.01
0.1
1
§(cn )
Cont2-paraCont2-ortho

10
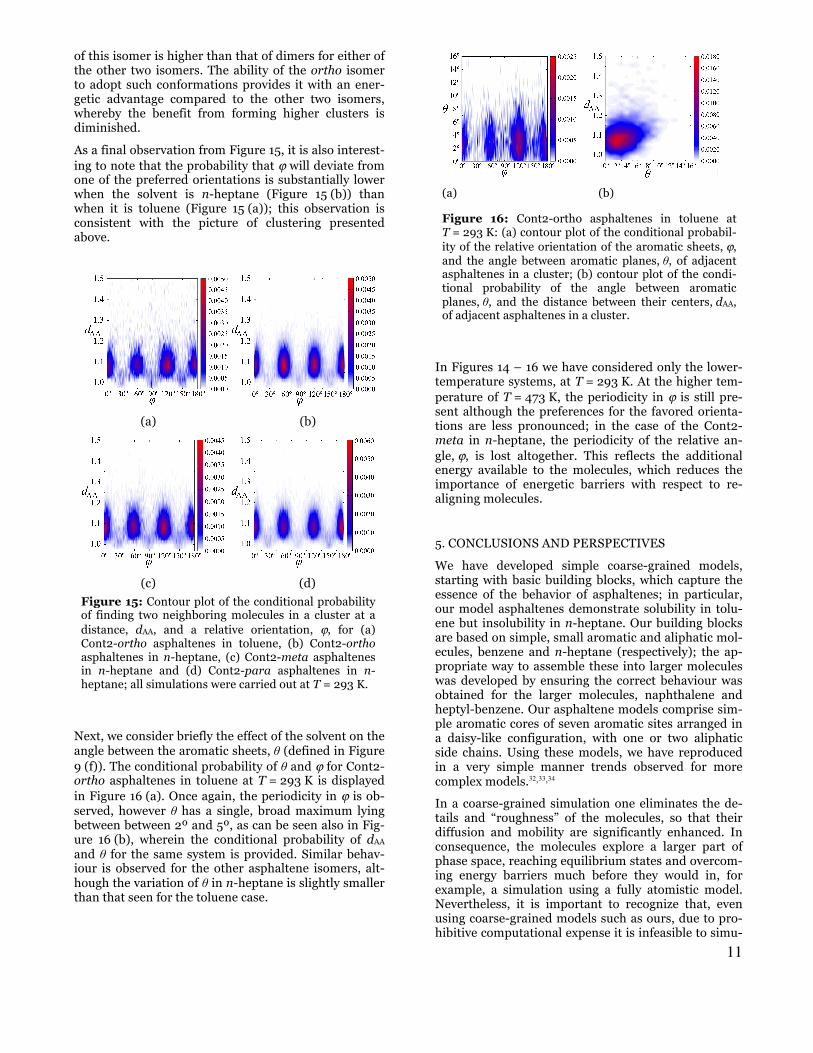
One can clearly discern from the contour plots of Fig-ures 15 and 16, which feature the relative orientation ϕ of neighboring molecules in clusters, that there are preferred orientations for the asphaltenes within clus-ters; this behaviour was also seen by Rakotondradany et al.32 who performed energetic analyses on clusters of two and three model-asphaltene molecules. Consistent with the observations of these authors, results from our work also suggest that the probability of finding mole-cules in certain orientations is linked to the topology and, in particular, to the symmetry of the molecule.
It is interesting to consider in more detail how the mol-ecules align when situated in a cluster, in order to clari-fy the influence of the subtle differences in the shape of the molecules on their aggregation. The conditional probability at T = 293 K of finding two neighboring Cont2-ortho asphaltene molecules in a cluster at a distance, dAA, and a relative orientation, ϕ, is given, in the form of a contour plot, in Figure 15 (a) for the case that the solvent is toluene, and in (b) when the solvent is n-heptane. Periodicity of the preferred angle can be seen in both graphs, with peaks appearing at intervals of ϕ = 60º; these are the orientations at which the aro-matic sites align. (We note that, of course, this particu-lar periodicity is an artefact of the symmetry of the model and is by no means representative of a naturally-occurring asphaltene.) On close inspection, one can discern that the probability distribution varies with the solvent. In toluene the peaks at ϕ = 120º and 180º are stronger than those at ϕ = 0º and 60º indicating a pref-erence for orientations in which the paraffinic sites do not align, even though such alignment would seem to decrease the number of close PA interactions between paraffinic and solvent sights. On the other hand, it is apparent from Figure 15 (b) that when the solvent is n-heptane, there appears to be far less preference among any of the orientations corresponding to peaks in the conditional probability while, in contrast to the toluene case, ϕ = 60º (corresponding to alignment of the paraf-finic sites) appears to be marginally favored. At first sight the behavior of each of the three Cont2 asphaltene isomers in n-heptane at T = 293.15 K (Figure 15 (b), (c) and (d)) is rather similar, all of them displaying a 60º periodicity in ϕ. However, on closer inspection, it can be seen that actually each of the three isomers favour different orientations. The ortho asphaltenes, as men-tioned already, evidence a marginal preference for the 60º orientation, while the para asphaltenes show greater preference for alignment at 180º (which is equivalent to 0º due to the symmetry of the molecules). The Cont2-meta asphaltenes show two regions with similarly higher probabilities at 0º and 120º. Consid-ering all three cases, it is clear that each isomer favours orientations in which the paraffinic sites lie at close distances to those of neighboring asphaltene molecules, albeit that the preference is not strong.
In summary, it emerges from examination of Figure 15 that the asphaltenes in toluene cluster in such a way that the paraffinic sites avoid aligning, while in n-heptane the asphaltenes cluster in a manner that pro-
motes alignment of the paraffinic sites. This apparently counterintuitive behaviour can be explained as follows. The primary driving force in clustering in both cases is the alignment of the aromatic sites in the cores of the asphaltene molecules. This is not surprising, since each molecule has seven such sites, but only two paraf-finic sites. In order to maximise the energetic benefit to the system brought about by aligning the aromatic sites, the separation of the core of the molecules (i.e., the aromatic sites) is close to that corresponding to the minimum in the AA Lennard-Jones interaction (see Figure 10); this separation is sufficiently small that, depending on geometry of the paraffinic sites on the neighboring molecules (i.e., the tilt angles, α, and the separation between paraffinic sites, dPP) it may bring aligned paraffinic sites within a separation less than that corresponding to the minimum in the PP interac-tion and, thereby, lying on the steep (repulsive) part of the PP potential curve. This would be manifested as steric hindrance of the paraffinic sites.
The close association of paraffinic sites provides a secondary driving force during the clustering of as-phaltene molecules. When the solvent is n-heptane, there is no benefit to the system should an asphaltene molecule adopt a conformation in which its paraffinic sites are close together, since these sites are already surrounded by sites of the same nature. Accordingly, in n-heptane, the paraffinic sites are more likely to lie close to the plane of their parent asphaltene molecule (i.e., α ≈ 0º; see Figure 14 (a) and (c)); there is no need for rearrangement of these sites during clustering and there is no barrier to the system gaining this extra secondary benefit from the alignment of paraffinic sites on neighboring molecules. On the other hand, when the solvent is toluene, there is a benefit to the system when an asphaltene molecule adopts a confor-mation with the paraffinic sites close together, which can be achieved by the Cont2-ortho isomer. For this isomer in particular one expects, therefore, to find more sites out of alignment with their molecular plane, as is confirmed by comparison of Figures 14 (a) and (c). During clustering, some of these out-of-plane sites will be pushed into alignment with the plane, while those that are too far from alignment will be pushed closer together – perhaps becoming a “terminating” member of the stack of molecules; evidence for this behaviour is found by comparing ℘(α) and ℘(dPP) for clustered molecules with the equivalent probability distributions of isolated molecules, in Figures 14 (a) and (b). One can imagine that a conformation of a molecule with the paraffinic sites close together will, when part of a cluster, increase the likelihood of steric hindrance between the paraffinic sites on neighboring molecules; this may explain why such steric hindrance is encountered when the solvent is toluene, but not when it is n-heptane.
The ability of the Cont2-ortho isomer to adopt con-formations with its paraffinic sites close together can also add insight to the interpretation of Figure 13. It is evident from this figure that the probability of dimers
11
of this isomer is higher than that of dimers for either of the other two isomers. The ability of the ortho isomer to adopt such conformations provides it with an ener-getic advantage compared to the other two isomers, whereby the benefit from forming higher clusters is diminished.
As a final observation from Figure 15, it is also interest-ing to note that the probability that ϕ will deviate from one of the preferred orientations is substantially lower when the solvent is n-heptane (Figure 15 (b)) than when it is toluene (Figure 15 (a)); this observation is consistent with the picture of clustering presented above.
(a) (b)
(c) (d)
Figure 15: Contour plot of the conditional probability of finding two neighboring molecules in a cluster at a distance, dAA, and a relative orientation, ϕ, for (a) Cont2-ortho asphaltenes in toluene, (b) Cont2-ortho asphaltenes in n-heptane, (c) Cont2-meta asphaltenes in n-heptane and (d) Cont2-para asphaltenes in n-heptane; all simulations were carried out at T = 293 K.
Next, we consider briefly the effect of the solvent on the angle between the aromatic sheets, θ (defined in Figure 9 (f)). The conditional probability of θ and ϕ for Cont2-ortho asphaltenes in toluene at T = 293 K is displayed in Figure 16 (a). Once again, the periodicity in ϕ is ob-served, however θ has a single, broad maximum lying between between 2º and 5º, as can be seen also in Fig-ure 16 (b), wherein the conditional probability of dAA and θ for the same system is provided. Similar behav-iour is observed for the other asphaltene isomers, alt-hough the variation of θ in n-heptane is slightly smaller than that seen for the toluene case.
(a) (b)
Figure 16: Cont2-ortho asphaltenes in toluene at T = 293 K: (a) contour plot of the conditional probabil-ity of the relative orientation of the aromatic sheets, ϕ, and the angle between aromatic planes, θ, of adjacent asphaltenes in a cluster; (b) contour plot of the condi-tional probability of the angle between aromatic planes, θ, and the distance between their centers, dAA, of adjacent asphaltenes in a cluster.
In Figures 14 – 16 we have considered only the lower-temperature systems, at T = 293 K. At the higher tem-perature of T = 473 K, the periodicity in ϕ is still pre-sent although the preferences for the favored orienta-tions are less pronounced; in the case of the Cont2-meta in n-heptane, the periodicity of the relative an-gle, ϕ, is lost altogether. This reflects the additional energy available to the molecules, which reduces the importance of energetic barriers with respect to re-aligning molecules.
5. CONCLUSIONS AND PERSPECTIVES
We have developed simple coarse-grained models, starting with basic building blocks, which capture the essence of the behavior of asphaltenes; in particular, our model asphaltenes demonstrate solubility in tolu-ene but insolubility in n-heptane. Our building blocks are based on simple, small aromatic and aliphatic mol-ecules, benzene and n-heptane (respectively); the ap-propriate way to assemble these into larger molecules was developed by ensuring the correct behaviour was obtained for the larger molecules, naphthalene and heptyl-benzene. Our asphaltene models comprise sim-ple aromatic cores of seven aromatic sites arranged in a daisy-like configuration, with one or two aliphatic side chains. Using these models, we have reproduced in a very simple manner trends observed for more complex models.32,33,34
In a coarse-grained simulation one eliminates the de-tails and “roughness” of the molecules, so that their diffusion and mobility are significantly enhanced. In consequence, the molecules explore a larger part of phase space, reaching equilibrium states and overcom-ing energy barriers much before they would in, for example, a simulation using a fully atomistic model. Nevertheless, it is important to recognize that, even using coarse-grained models such as ours, due to pro-hibitive computational expense it is infeasible to simu-
12
late systems large enough and for sufficiently long times to unequivocally establish phase separation into two distinct phases. Instead, solubility and insolubility are demonstrated by examination of the clustering behaviour of asphaltene molecules. The major driving force for this clustering is for the system to increase the number of aromatic–aromatic site-site interactions and reduce the number of aromatic–solvent interactions, which are less favorable. When the solvent is toluene, this energetic benefit is small and no large clusters are formed during the entire simulations; moreover, fol-lowing minor evolution early in the simulations, the probability distributions of cluster sizes remain essen-tially the same. However, when the solvent is n-heptane, the clustering behaviour is in stark contrast. The energetic benefit to clustering is much larger and, throughout the course of the simulations, increasingly large clusters are observed; moreover, the cluster-size probability distributions continue to evolve.
In this article we have featured the asphaltene models with two side chains (designated “Cont2”); the behav-iour of the single-side chain asphaltenes (“Cont1”) is very similar, although we have observed that Cont1 asphaltenes form slightly larger aggregates than Cont2. This can be attributed to steric effects of the aliphatic chains that interfere with the asphaltene stacking.
The nature of these steric effects depends on the sol-vent. In toluene, the Cont2 asphaltene molecules have a greater tendency to adopt conformations in which the paraffinic side chains are closer together, thereby re-ducing their exposure to the solvent. These confor-mations make it more difficult for the asphaltene mole-cules to stack with their aromatic cores adjacent to each other. This effect combines with the lower energetic advantage from stacking of the asphaltenes obtained when the solvent is toluene; as a result, no large clus-ters are formed and the asphaltenes remain “in solu-tion”. By contrast, in n-heptane, the tendency to adopt such conformations is lower, while the energetic ad-vantage of stacking is greater; as a result, progressively larger clusters are formed and the asphaltenes “precipi-tate out”. It is well known35 that residual asphaltenes after thermal cracking of hydroconversion of heavy crudes or coal liquid residues, are both more dealkylat-ed and more insoluble in the more paraffinic liquid, which determines significant practical limits, especially to processing temperature. The picture emerging from these simulations (comparing behaviors of Cont-1 and Cont-2, second paragraph of page 12 indeed gives in-sight to why dealkylation contributes promotes insolu-bility).
It is evident that the model presented is very simple in nature and lacks, among others, important details in terms of the plausible molecular morphologies and chemical heterogeneities. Notwithstanding this simple CG model is capable of describing with a remarkable predictive capacity the overall behavior expected for continental-type asphaltene molecules. Further re-search is required to make the most of this kind of models in order to widen our understanding of the
different aspects playing a role in the aggregation of asphaltenes. In particular, the use of more sophisticat-ed CG mappings, based on the SAFT equation of state36,37 will lead to improved models and enhanced understanding. This work is in progress.
ASSOCIATED CONTENT Supporting Information. A short movie depicting two contrasting simulations of model Cont1 in pure n-heptane and pure toluene at 293.15K is provided. Color scheme as in Fig. 9. Solvent molecules are drawn at a smaller scale to improve visualization. This material is available free of charge via the Internet at http://pubs.acs.org.
AUTHOR INFORMATION
Corresponding Author * E-mail: [email protected]
Present Addresses
ACKNOWLEDGMENT J. Jover thanks French agency EGIDE for financial sup-port. EAM and GJ acknowledge generous funding from the U.K. Engineering and Physical Sciences Research Council (EPSRC) through grants (EP/E016340, EP/I018212, EP/J010502 and EP/J014958).
REFERENCES
1 J. Ph. Pfeiffer and R. N. J. Saal. Asphaltic bitumen as col-loid system. J. Phys. Chem., 44(2):139–149, 1940.
2 J. G. Speight. The Chemistry and Technology of Petroleum. Marcel Dekker, 4th edition, 2007.
3 O. C. Mullins, E. Y. Sheu, A. Hammami, and Marshall A. G., editors. Asphaltenes, Heavy Oils and Petroleomics. Springer, 2007.
4 J. P. Dickie and T. F. Yen. Macrostructures of the asphaltic fractions by various instrumental methods. Anal. Chem., 39(14):1847–1852, 1967.
5 O.C. Mullins, A.E. Pomerantz, J.Y. Zuo, J. Y., and C. Dong. Downhole Fluid Analysis and Asphaltene Science for Pe-troleum Reservoir Evaluation. Annu. Rev. Chem. Bio-molec Eng, 5(1): 325–345, 2014
6 S. L. Kokal and S. G. Sayegh. Asphaltenes: The cholesterol of petroleum. Petroleum Recovery Institute, Calgary, CANADA, 1995. Middle East Oil Show.
7 O. C. Mullins, B. Martínez-Haya, and A. G. Marshall. Con-trasting perspective on asphaltene molecular weight. This Comment vs the Overview of A. A. Herod, K. D. Bartle, and R. Kandiyoti. Energ. Fuel, 22(3):1765–1773, 2008.
8 E. Buenrostro-Gonzalez, C. Lira-Galeana, A. Gil-Villegas, and J. Wu. Asphaltene precipitation in crude oils: Theory and experiments. AIChE J., 50(10):2552–2570, 2004.
9 B. Aguilera-Mercado, C. Herdes, J. Murgich, and E. A. Müller. Mesoscopic simulation of aggregation of asphal-tene and resin molecules in crude oils. Energ. Fuel, 20(1):327–338, 2006.
10 J. Murgich, J. Rodriguez M., and Y. Aray. Molecular recognition and molecular mechanics of micelles of some

13
model asphaltenes and resins. Energ. Fuel, 10(1):68–76, 1996.
11 T. Takanohashi, S. Sato, I. Saito, and R. Tanaka. Molecular dynamics simulation of the heat–induced relaxation of as-phaltene aggregates. Energ. Fuel, 17(1):135–139, 2003.
12 T. Kuznicki, J. H. Masliyah, and S. Bhattacharjee. Molecu-lar dynamics study of model molecules resembling asphal-tene–like structures in aqueous organic solvent sys-tems. Energ. Fuel, 22(4):2379–2389, 2008.
13 E. S. Boek, D. S. Yakovlev, and T. F. Headen. Quantitative molecular representation of asphaltenes and molecular dynamics simulation of their aggregation. Energ. Fuel, 23(3):1209–1219, 2009.
14 T. Maqbool, A. T. Balgoa, and H. S. Fogler. Revisiting as-phaltene precipitation from crude oils: A case of neglected kinetic effects. Energ. Fuel, 23(7):3681–3686, 2009.
15 G. A. Voth. Coarse–graining of condensed phase and bio-molecular systems. CRC Press, 2008.
16 A. J. Crane, F. A. Martínez-Veracoechea, F. J. Escobedo, and E. A. Müller. Molecular dynamics simulation of the mesophase behaviour of a model bolaamphiphilic liquid crystal with a lateral flexible chain. Soft Matter, 4(9):1820–1829, 2008.
17 S. J. Marrink, A. H. de Vries, and A. E. Mark. Coarse grained model for semiquantitative lipid simulations. J. Phys. Chem. B, 108(2):750–760, 2004.
18 S. J. Marrink, H. J. Risselada, S. Yefimov, D. P. Tieleman, and A. H. de Vries. The martini force field: Coarse grained model for biomolecular simulations. J. Phys. Chem. B, 111(27):7812–7824, 2007.
19 M. L. Klein and W. Shinoda. Large-scale molecular dy-namics simulations of self-assembling systems. Science, 321(5890):798–800, 2008.
20 W. Shinoda, R. DeVane, and M. L. Klein. Zwitterionic lipid assemblies: Molecular dynamics studies of monolayers, bi-layers, and vesicles using a new coarse grain force field. J. Phys. Chem. B, 114(20):6836–6849, 2010.
21 D. Frenkel and B. Smit. Understanding molecular simula-tion. From algorithms to applications.Computational Sci-ence Series. Academic Press, 2nd edition, 2002.
22 J. J. Potoff and A. Z. Panagiotopoulos. Critical point and phase behavior of the pure fluid and a Lennard–Jones mixture. J. Chem. Phys., 109(24):10914–10920, 1998.
23 W. Shi and J. K. Johnson. Histogram reweighting and finite-size scaling study of the Lennard–Jones fluids. Fluid Phase Equilib., 187-188:171 – 191, 2001. ISSN 0378-3812.
24 J. Perez-Pellitero, P. Ungerer, G. Orkoulas, and A. D. Ma-ckie. Critical point estimation of the Lennard–Jones pure fluid and binary mixtures. J. Chem. Phys., 125(5):054515, 2006.
25 DIPPR database, design institute of physical property data version 8.01.
URL http://apps.isiknowledge.com. 26 W. Smith and T. R. Forester. DL_POLY_2.0: A general–
purpose parallel molecular dynamics simulation package. J. Mol. Graphics, 14(3):136–141, 1996.
27 J. P. Ryckaert, G. Ciccotti, and H. J. C. Berendsen. Numer-ical–integration of cartesian equations of motion of a sys-tem with constraints – Molecular-dynamics of n-alkanes. J. Comput. Phys., 23(3): 327–341, 1977.
28 D. Fincham. Leapfrog rotational algorithms. Mol. Simul., 8(3): 165–178, 1992.
29 S. D. Stoddard. Identifying clusters in computer experi-ments on systems of particles. J. Comput. Phys., 27(2):291 – 293, 1978.
30 F. H. Stillinger. Rigorous basis of the frenkel–band theo-ry of association equilibrium. J. Chem. Phys., 38(7):1486–1494, 1963.
31 P. J. Steinhardt, D. R. Nelson, and M. Ronchetti. Bond-orientational order in liquids and glasses. Phys. Rev. B, 28(2): 784–805, 1983.
32 F. Rakotondradany, H. Fenniri, P. Rahimi, K. L. Gawrys, P. K. Kilpatrick, and M. R. Gray. Hexabenzocoronene model compounds for asphaltene fractions: Synthesis & characterization. Energ. Fuels, 20(6): 2439–2447, 2006.
33 T. F. Headen, E. S. Boek, and N. T. Skipper. Evidence for Asphaltene Nanoaggregation in Toluene and Heptane from Molecular Dynamics Simulations. Energ. Fuels 23: 1220-1229, 2009.
34 E. S. Boek, A. D. Wilson, J. T. Padding, T. F. Headen, and J. P. Crawshaw. Multi-scale Simulation and Experimental Studies of Asphaltene Aggregation and Deposition in Ca-pillary Flow. Energ. Fuels 24: 2361–2368, 2010
35 J. Verstraete. Catalytic Residue Hydroprocessing, Chap 3.5.3, pages 701-737, in Catalyis by Transition metal Sul-phides, from molecular theory to industrial applications, H. Toulhoat and P. Raybaud, Eds, Technip , Paris, 2013.
36 E.A. Müller and G. Jackson, G. Force-Field Parameters from the SAFT-� Equation of State for Use in Coarse-Grained Molecular Simulations. Annu. Rev. Chem. Bio-molec. Eng., 5(1):405–427, 2014.
37 A. Mejía, C. Herdes, and E.A. Müller. Force Fields for Coarse-Grained Molecular Simulations from a Corre-sponding States Correlation. Ind. Eng. Chem. Res, 53(10): 4131–4141, 2014.
.
.