ASP b2b Technology Business Plan
41
Thanks for downloading a sample plan from Bplans.com A sample plan is a great way to get started, but you can’t just print this plan out and turn it into the bank. You’re still going to have to put in all your own information and do all of your own financial forecasts. With LivePlan, you can easily use this sample as inspiration and create your own plan, complete with financial tables and graphs. You’ll also be able to: • Save time with linked financial tables (the formulas are built in, so you don’t have to do the calculations!) • Benefit from tons of help, advice, and resources. • Present your plan with confidence, with automatic charts and graphs corresponding to your financial data. • Work on your plan anywhere, on any computer. “For 20 dollars I ended up getting a quarter of a million dollars of funding. That’s worth it!” – Todd C. Tablegate Click here to save 50% off the first month of LivePlan!
-
Upload
stp-design -
Category
Documents
-
view
218 -
download
0
description
Business Plan sample format
Transcript of ASP b2b Technology Business Plan

Thanks for downloading a sample plan from Bplans.com
A sample plan is a great way to get started, but you can’t just print this plan out and turn it into the bank. You’re still going to have to put in all your own information and do all of your own financial forecasts. With LivePlan, you can easily use this sample as inspiration and create your own plan, complete with financial tables and graphs. You’ll also be able to: • Save time with linked financial tables (the formulas are built in, so you don’t have to do the calculations!) • Benefit from tons of help, advice, and resources. • Present your plan with confidence, with automatic charts and graphs corresponding to your financial data. • Work on your plan anywhere, on any computer. “For 20 dollars I ended up getting a quarter of a million dollars of funding. That’s worth it!” – Todd C. Tablegate Click here to save 50% off the first month of LivePlan!

Cover Page
This sample business plan has been made available to users of Business Plan Pro, business planning software published by Palo Alto Software. Names, locations and numbers may have been changed, and substantial portions of text may have been omitted from the original plan to preserve confidentiality and proprietary information.
You are welcome to use this plan as a starting point to create your own, but you do not have permission to reproduce, resell, publish, distribute or even copy this plan as it exists here.
Requests for reprints, academic use, and other dissemination of this sample plan should be emailed to the marketing department of Palo Alto Software at [email protected]. For product information visit our Website: www.paloalto.com or call: 1-800-229-7526.
Copyright Palo Alto Software, Inc., 1995-2009 All rights reserved.

Legal Page
Confidentiality Agreement
The undersigned reader acknowledges that the information provided by _________________________ in this business plan is confidential; therefore, reader agrees not to disclose it without the express written permission of _________________________.
It is acknowledged by reader that information to be furnished in this business plan is in all respects confidential in nature, other than information which is in the public domain through other means and that any disclosure or use of same by reader, may cause serious harm or damage to _________________________.
Upon request, this document is to be immediately returned to _________________________.
___________________ Signature
___________________ Name (typed or printed)
___________________ Date
This is a business plan. It does not imply an offering of securities.

Table of Contents
1.0 Executive Summary ......................................................................................................................... 1 1.1 Mission ................................................................................................................................................ 2 1.2 Keys to Success ............................................................................................................................. 2
Chart: Highlights................................................................................................................................ 2 2.0 Company Summary .......................................................................................................................... 3
2.1 Company History ........................................................................................................................... 3 Table: Past Performance ................................................................................................................ 3 Chart: Past Performance ................................................................................................................ 5
3.0 Products and Services ..................................................................................................................... 5 3.1 Product and Service Description ............................................................................................ 5 3.2 Future Products and Services .................................................................................................. 6
4.0 Market Analysis Summary............................................................................................................. 7 4.1 Market Segmentation .................................................................................................................. 9
Table: Market Analysis .................................................................................................................... 9 Chart: Market Analysis (Pie) ...................................................................................................... 10
4.2 Target Market Segment Strategy ........................................................................................ 10 4.3 Market Trends ............................................................................................................................... 11
4.3.1 Forrester Research ............................................................................................................. 11 4.4 Service Business Analysis ....................................................................................................... 12
4.4.1 Main Competitors ................................................................................................................ 12 4.4.2 Positioning Statement ....................................................................................................... 13
5.0 Strategy and Implementation Summary.............................................................................. 13 5.1 Competitive Edge ........................................................................................................................ 14 5.2 Marketing Strategy ..................................................................................................................... 14
5.2.1 Marketing Programs ........................................................................................................... 15 5.3 Sales Strategy............................................................................................................................... 16
5.3.1 Sales Forecast ...................................................................................................................... 16 Chart: Sales by Year .................................................................................................................. 17 Table: Sales Forecast ................................................................................................................ 17 Chart: Sales Monthly ................................................................................................................. 18
6.0 Management Summary ................................................................................................................ 18 6.1 Organizational Structure .......................................................................................................... 18 6.2 Quality Assurance Program .................................................................................................... 19 6.3 Personnel Plan .............................................................................................................................. 19
Table: Personnel .............................................................................................................................. 20

Table of Contents
Chart: Profit Yearly ......................................................................................................................... 26 7.2 Projected Cash Flow ................................................................................................................... 27
Chart: Cash ........................................................................................................................................ 27 Table: Cash Flow ............................................................................................................................. 27
7.3 Balance Sheet ............................................................................................................................... 29 7.3 Balance Sheet ............................................................................................................................... 29
Table: Balance Sheet ..................................................................................................................... 29 7.4 Business Ratios ............................................................................................................................ 30 7.4 Business Ratios ............................................................................................................................ 30
Table: Ratios ...................................................................................................................................... 30 Table: Personnel....................................................................................................................................... 31 Table: Sales Forecast ............................................................................................................................. 32 Table: Sales Forecast ............................................................................................................................. 32 Table: General Assumptions ............................................................................................................... 33 Table: General Assumptions ............................................................................................................... 33 Table: Cash Flow ...................................................................................................................................... 34 Table: Cash Flow ...................................................................................................................................... 34 Table: Profit and Loss ............................................................................................................................ 35 Table: Profit and Loss ............................................................................................................................ 35 Table: Balance Sheet ............................................................................................................................. 36 Table: Balance Sheet ............................................................................................................................. 36

Appendix
Page 1
1.0 Executive Summary
Discover Productions, Inc. (Discover Productions) is a Business-to-Business (B2B) technology consulting company supplying turn-key computing solutions based upon the latest technology and utilizing Web-based applications. Utilizing state-of-the-art software and hardware in their 24x7 computing facility, Discover Productions also offers e-commerce solutions, Web hosting, Web development, remote help desk support, customer training, and systems support. Looking further into the future, the company plans to develop their own B2B Web-based applications. The company's first product is expected to be released in June 2000.
Discover Productions is a Cleveland, Ohio based company, whose mission is to provide businesses with the technology they need to compete in a Web-based world. By utilizing state-of-the-art equipment and providing the necessary technical expertise, Discover Productions brings to the market a fresh perspective on B2B Technology Consulting.
Services Plan
Turn-key B2B Computing Solutions. The company is currently providing small to mid-sized businesses with Web-based computing solutions utilizing state-of-the-art technology.
Hosting Services. The company is developing hosting services to ASP companies and generate $200,000 plus in revenue. Internet Sales. We currently generate more than $300,000 in Internet sales from hosting, e-commerce, and Web development for
small to mid-sized businesses. Computing Solutions. We will increase our computing sales revenue from computer sales, service, and support to more than $450,000. Web-based Applications. Develop, market, and sell our own Web-based B2B applications.
Marketing The company's marketing strategy rests on the belief that its products and services represent a value-added approach to interpreting, qualifying, and understanding the complexities of the computer industry and technology markets. To implement this strategy, the company intends to place paid advertising banners on strategic websites in the computer fields and to utilize search engine portal and general media advertising.
Management Discover Productions has a world-class management team with direct knowledge of the industry, extensive research experience, and a unique perspective that B2B technology needs. Its team includes Mr. Edward Jones, CEO, and Mr. Jacob Manuel, CIO.
Financials The company is seeking first round funding in the amount of $914,900 for staffing purposes, purchasing software and hardware computing equipment, office costs, and other Internet related costs. The company is also seeking second round funding in the amount of $3 million for developing B2B Web-based applications, and their Educational Application Software. Projected revenues for 2000 to 2002 are $1 million, $16 million, and $45 million, respectively.

Appendix
1.1 Mission
The mission of Discover Productions is to provide businesses with turn-key computing solutions based upon the latest technology utilizing Web-based applications and providing superior customer support and training to take a company's infrastructure into the futurebeyond.
1.2 Keys to Success
Strong technical experience Effective management leadership High quality service and support
Chart: Highlights

Appendix
Page 3
2.0 Company Summary
Founded in 1979, Discover Productions began in November 1992 to provide a new innovative role in the ASP technology market. The company began marketing turn-key Web-based Internet computing solutions to businesses entering the fast paced ever-changing World Wide Web.
Discover Productions is a privately held Ohio C-Corporation, with principal offices located in Cleveland, Ohio. This facility of 10,000 square feet serves as an administration and development facility. It includes two development offices, a conference room, a computer center, and a reception area. This new facility was opened in November 1999 and helps to provide customers with state-of-the-art networks and backup facilities. With the additional funding, the company plans to open a marketing and sales office in Cleveland, Ohio, and begin developing new Web-based applications.
2.1 Company History
Discover Productions provides its customers with the necessary tools to maximize their company efficiency and increase their profitability. These include Web-based technologies such as e-commerce, Web development, a co-location computing facility, software integration, disaster recovery, and other Web applications that are critical to a customer's business. Discover Productions also provides remote support in maintaining networks and software for customers as needed.
In today's growing business, companies need computer and Internet service to increase growth, Discover Productions works with companies providing turn-key computing solutions for their office environment and Internet access. Management of Web services and a customer's office computing environment can be done remotely from the Discover Productions head office allowing a cost effective solution for small to mid-size companies who need computing management.
Table: Past Performance
Past Performance FY 1998 FY 1999 FY 2000 Sales $0 $0 $500,000 Gross Margin $0 $0 $400,000 Gross Margin % 0.00% 0.00% 80.00% Operating Expenses $0 $0 $200,000 Collection Period (days) 0 0 18
Balance Sheet FY 1998 FY 1999 FY 2000
Current Assets Cash $0 $0 $30,000 Accounts Receivable $0 $0 $40,000 Other Current Assets $0 $0 $5,000

Appendix
Page 4
Total Current Assets $0 $0 $75,000
Long-term Assets Long-term Assets $0 $0 $100,000 Accumulated Depreciation $0 $0 $20,000 Total Long-term Assets $0 $0 $80,000
Total Assets $0 $0 $155,000
Current Liabilities Accounts Payable $0 $0 $30,000 Current Borrowing $0 $0 $5,000 Other Current Liabilities (interest free) $0 $0 $0 Total Current Liabilities $0 $0 $35,000
Long-term Liabilities $0 $0 $50,000 Total Liabilities $0 $0 $85,000
Paid-in Capital $0 $0 $25,000 Retained Earnings $0 $0 $45,000 Earnings $0 $0 $0 Total Capital $0 $0 $70,000
Total Capital and Liabilities $0 $0 $155,000
Other Inputs Payment Days 0 0 30 Sales on Credit $0 $0 $400,000 Receivables Turnover 0.00 0.00 10.00

Appendix
Page 5
Chart: Past Performance
3.0 Products and Services
Discover Productions is developing its own B2B Web-based applications with their first product expected to be release in June 2000 and additional products to follow every six to eight months.
3.1 Product and Service Description
The following is a list of products and services offered by Discover Productions.
1. Web applications. Discover Productions provides Web applications development for both internal and external customer websites that need dynamic site and business process flow automation.
2. E-commerce solutions. Utilizing a combination of Discover Productions' Web design services and Goldwin's e-commerce software the company is able to provide quality e-commerce solutions. Discover Productions offers a selection of products that allow customers to build an online store or add catalogs and shopping cart functions to a pre-existing site.

Appendix
Page 6
3. Web hosting solutions. Discover Productions provides Web hosting solutions for customers needing high availability servers. Discover Productions offers cost effective solutions and competitive pricing to grow a customer's presence on the Web. From its Basic Hosting Plan to its Gold Star Plan, Discover Productions offers reliable technology and customer support utilizing high speed networks and 24x7 servers.
4. Co-location. Discover Productions provides co-location of Internet servers for customers needing high speed Internet access but wanting to manage their own equipment.
5. Web design services. Discover Productions provides Web design services for customers seeking to establish a Web presence. Discover Productions can design and develop a company's Web presence in order for them to be competitive in today's industry, as well as helping them to automate their business process flow. Discover Productions offers cost effective solutions and competitive pricing by offering Web development packages from a basic site plan to a full company site. Discover Productions can provide a quote based upon development of internal or external Web applications.
6. Disaster recovery solutions. Utilizing its in-house backup methodology, Discover Productions provides disaster recovery solutions.
7. Network design solutions. Discover Productions uses its in-house expertise to provide network design solutions.
8. Computing design solutions (Unix and NT). Discover Productions uses its in-house expertise to provide computing design solutions for NT, Windows 2000 and Unix.
9. Equipment service. Discover Productions provides equipment service by reselling a 24x7 strategic alliance partner's services.
10. Software and hardware. Discover Productions sells computer software and hardware using public and private e-commerce solutions.
3.2 Future Products and Services
Discover Productions plans on developing its own B2B Web-based applications this year. Utilizing a strong think-tank development team, the company will release smaller products every 6 to 8 months with their first product to launch in June, 2000. Discover Productions' main product offering will be a complete line of educational Web-based programs and will release in 2001. These programs will feature the latest in XML, Web, and multi-media technology. The educational learning programs will utilize the latest in artificial intelligence and neural network programming to be marketed to home, educational institutes, government, and commercial sectors.
Key components of Discover Productions's initial product development strategy can be summarized as follows.
1. Employee/Employer Web E-portal. This Web-based application will target strategic industries to bring employees and employers together. Current sites target only the technology market whereas Discover Productions will market to blue-collar industries. The release date for their first site is June 1, 2000, and will target the Waste Industry with the Oil Industry to follow next. Additional market targets will be released every six months.

Appendix
Page 7
2. CPA/Business E-portal. Although several accounting packages exist today both Web and computer based, no application is currently bringing together the accountant and small to mid-sized business. Discover Productions plans on bringing to market a Web-based accounting application that will simultaneously bring together both the customer and their accountant/CPA with all the information being available to both parties through the secure Discover Productions computing facility. Discover Productions will target strategic alliances with companies such as Intuit, PeachTree, and Solomon, makers of current accounting packages.
3. Educational E-portal. Today's educational programs, although full of rich multi-media and loads of information, still teach to students in the same manner that has been utilized for years. The biggest failing of education programs today is that they teach the same information the exact same way to every student. Discover Productions realizes that every student is different, and their new suite of educational applications will be designed utilizing state-of-the-art artificial intelligence driven neural network programming. This will allow the Educational Program to modify itself to teach to each student based upon each student's comprehension and ability. The software will be marketed with Educational Modules that can be downloaded or accessed via the Internet directly from the Discover Productions hosting facility. Companies can also design their own Educational Modules and have their own corporate e-portal by purchasing the core AI program and development kit. This revolutionary new concept in education can be marketed to all industries, companies, schools, and institutes. Discover Productions plans on marketing this product to company training programs initially, and then marketing to schools and institutes.
4. R&D, Think Tank. Discover Productions utilizes a think tank model in their approach to developing products. Utilizing the latest in state-of-the-art technology, development groups are organized to discuss and develop new products. Staff are encouraged and rewarded for bringing to the table new and innovative product ideas. Revenue is generated from these new ideas as well as companies contracting services for the use of the Discover Productions think tank.
4.0 Market Analysis Summary
Business-to-Consumer e-commerce Estimates for the amount of online spending by consumers in 1998 range from $7 billion to $13 billion, with at least 25% occurring during the Christmas shopping season. Forrester Research, an information technology research firm in Cambridge, Massachusetts, believes that online spending will hit $108 billion in 2003.
B2B e-commerce Although there are very few pure B2B e-commerce firms, this segment dwarfs the business to consumer sector. Forrester believes that this market, which totaled $43 billion in 1998, should rise to $1.3 trillion by 2003.
The Internet As of year-end 1998, almost 160 million users accessed the Internet regularly, up from approximately 101 million at the end of 1997, according to IDC. Clearly, the Internet is in an exceptional growth phase. This growth has pushed the capacity of existing networking infrastructure to its limits, resulting in frustration by Internet users.

Appendix
Page 8
Still, consumers have found the Internet to be a useful tool in the research and purchase of goods and services. Corporations have found that while the Internet is challenging traditional business models, it also offers significant advantages to companies that fully embrace the medium.
Exceptional growth By any measure, the Internet is one of the fastest-growing commercial phenomena ever witnessed by society. Host computers, or servers, have exploded from 3.2 million in 1994 to roughly 56.2 million as of July, 1999. During the same time period, the number of websites roared to more than 5 million from only approximately 3,000.
A key factor in the recent growth of the Internet is the popularity of the sub-$1,000 PC. Rapidly falling component prices have allowed PC manufacturers to pass cost savings on to their customers, resulting in a more attractively priced product. Computers sold at or below the $1,000 level have appealed to first-time PC users and lower income families. Because of the more affordable prices, PC penetration in the United States is now approximately 50%, according to Dataquest, a market research firm based in San Jose, California.
As a result of the Internet's historical roots in the U.S. Department of Defense, as well as the rising penetration of PCs, the United States accounts for more than half of the world's total Internet users. The European market, by contrast, has been held back by the high cost of Internet access. Consumers are typically billed twice in these markets, once by the ISP and once by the phone company. However, the forces of telecommunications deregulation in Europe finally appear to be having an effect, as several phone companies have recently eliminated access fees and now bill only on a per-minute basis. Such moves should eventually increase the penetration of the Internet in Europe.
In the United States, less than one-third of the population is connected, leaving plenty of room for growth. In 1996, people asked colleagues and friends if they had an electronic mail address. In 1997, people were asked what their electronic mail address was. When consumers today are asked why they purchased a personal computer, the most common answer is to connect to the Internet to get their email.
The explosive growth of the Internet, as a tool for global communications, has enabled millions of people to interact electronically. International Data Corporation, or IDC, estimates that there were 142 million Web users worldwide at the end of 1998, and expect this number will grow to approximately 502 million by the end of the year 2003. Rapid acceptance of the Internet as a communications platform by both businesses and consumers has created the foundation for significant growth in B2B and business-to-consumer e-commerce. IDC estimates that worldwide commerce over the Internet will increase from approximately $50 billion in 1998 to $1.3 trillion in the year 2003.
The Small Business Administration estimates that more than 98% of all businesses in the United States have fewer than 100 employees. These businesses often lack the size and financial resources to create economies of scale. In particular, these organizations typically do not maintain dedicated procurement departments and often do not achieve significant purchasing leverage. The Internet can provide small businesses and consumers with a number of advantages when making purchases, including:
Convenience Wider selection of products and services

Appendix
Page 9
Competitive pricing
Small businesses are taking advantage of the opportunities the Internet affords. IDC estimates that the number of small businesses engaged in e-commerce will increase 47.1% annually, from 400,000 at the end of 1998 to almost 2.8 million at the end of the year 2003, signaling the broad adoption of the Internet by these small enterprises.
The widespread adoption of the Internet as a purchasing vehicle has created a wealth of opportunities for businesses that offer products and services to small businesses and consumers. Simultaneously, it has given both small businesses and consumers a wider variety of products from which to choose at competitive prices.
4.1 Market Segmentation
The company's target customers are as follows:
Small to Mid-size Businesses (50-500 employees) Businesses that are consolidating operations or merging Military and government agencies Others (accounting, medical, insurance, waste industry, associations, real estate, and new crafts market)
Table: Market Analysis
Market Analysis 2000 2001 2002 2003 2004 Potential Customers Growth CAGR Small to Mid-Sized Businesses 20% 25,000 30,000 36,000 43,200 51,840 20.00% Consolidations and Mergers 15% 15,000 17,250 19,838 22,814 26,236 15.00% Military and Government Agencies 10% 10,000 11,000 12,100 13,310 14,641 10.00% Other 5% 8,000 8,400 8,820 9,261 9,724 5.00% Total 15.28% 58,000 66,650 76,758 88,585 102,441 15.28%

Appendix
Page 10
Chart: Market Analysis (Pie)
4.2 Target Market Segment Strategy
Small to Mid-size Businesses. All business of 50 to 500 employees are ideal regardless of industry. They purchase website, E-commerce, data networks, computers, and Web services such as Discover Productions provides. New feeder business within the semi-conductor, insurance, accounting, medical, and manufacturing industries are prime targets.
Consolidations and Mergers. They look for outsourcing and new ways for implementing Web-based applications, intranet hosting and development, e-portals, e-markets and support to grow their business while cutting cost. Golf Smith, Nevada Bob, and Dyer Electronics purchases products/services such as Discover Productions provides.
Military and government agencies. The company sells to government contractors, and government agencies such as the Advanced Research Program Agency (ARPA), Airforce, Navy, Army and other such agencies.
Others. The company also sells to accounting, medical, insurance, waste industry, associations, real estate, and new crafts market.

Appendix
Page 11
4.3 Market Trends
Identifiable market sectors. Forrester Research estimates that there are approximately 70 identifiable vertical market sectors (i.e., manufacturing, banking, insurance, stock-brokerage, pharmaceutical, engineering, etc.) in the commercial business world today.
High growth in e-commerce. Forrester also reports that B2B e-commerce will be a $1.3 trillion market by the year 2003 (Red Herring, December 1999). This will surpass the business-to-consumer market by five to seven times.
E-commerce market value. IDC, another market intelligence firm, predicts the market to be $633 billion by the year 2001. IDC also believes that the largest portion of business's new technology investments will be devoted to studies and implementations of e-commerce B2B initiatives. Compounded growth between the years 2001 and 2003 is expected to be 35%. IDC claims that those entrepreneurs that set their banner in to e-commerce sectors will be the ones that reap the greatest profits and growth from the year 2001 and beyond.
Internet services market. Gartner calls B2B e-commerce, "the new millennium's killer application." The Internet services market will grow at a cumulative annual growth rate of 60% through the year 2003. IDC also claims that revenue in the worldwide Internet services market grew 71% in 1998 and is expected to grow at a cumulative annual growth rate of 60% through the year 2003 with revenues for Internet services approaching $80 billion.
IDC predicts that of the estimated 7.1 million small businesses in the United States, the percentage connected to the Internet will grow from about 40% in 1996 to about 70% in the year 2000. IDC estimates the number of users in the U.S. accessing the World Wide Web will increase from approximately 63 million at the end of 1998 to 177 million by the end of the year 2003.
Cahners indicates that "At least 50% of networking hardware revenue in the first half of 1999 came from small to mid-size companies."
4.3.1 Forrester Research
Recent research conducted by Forrester research has shown that B2B will be $2.7 trillion by the year 2004.
The research shows that e-marketplaces will be responsible for 53% of all online business trade. Research also shows that more companies are moving to make purchases and sales on the Internet and are looking to build deeper relationships with business partners. This research has also shown:
The B2B arena is reshaping e-marketplaces. The initial wave of B2B e-commerce has been dominated by extranets that automate off-line processes between partners. However, the Internet is now moving to a new business venue, e-marketplaces, where the dynamic many-to-many interactions will supplant stagnant one-to-one relationships. These new trading arenas will flourish because:
Industry inefficiencies run rampant. In today's business environment, comparing offerings across suppliers requires multiple phone calls to various suppliers or enlisting the costly support of a broker. Time-consuming practices like these are easy targets for

Appendix
Page 12
the Internet--where purchasing agents can gain instant access to comparisons of many different products.
E-marketplace vendors will lower technology barriers. Someone had to build the first e-marketplace, but now the technology landscape is maturing. Today, B2B entrepreneurs can acquire sophisticated marketplace software from firms like Tradex, Ariba, and Commerce One or entirely offload the building of their websites to a lengthening list of experienced e-commerce integrators like Vision Systems or Software Solutions Pakistan.
Venture funding is shifting to business trade. High-profile B2B players like VerticalNet--whose market cap currently exceeds $4 billion--have caught the investor community's attention. The result? Many venture capitalists are placing bigger bets on their business trade portfolio. CMGI, for instance, just announced its plans to raise $1 billion to invest in B2B firms.
E-marketplaces will face a changing business environment. As more and more companies compete in the B2B market, there are going to be companies that will either have to sell or simply go out of business due to:
Virgin markets disappearing. While most existing e-marketplaces are launched in a world devoid of serious competition, such as the printing business, these uncharted opportunities will quickly fade away. And even though there are a lot of untapped new markets, they will not be for long and soon everyone will want a piece of the pie.
Feature-function races escalate. Functionality is not a big issue currently. Many websites simply put together a transaction processing engine and issue a few press releases and declare they have a B2B website. But as these websites face stiff competition, basic service offerings won't be good enough. Firms will need to pump big bucks into expanding their online and offline capabilities just to satisfy the requirements of increasingly demanding participants.
Source: Forrester Research, Inc.'s e-marketplace report
4.4 Service Business Analysis
Discover Productions is part of the Web hosting industry.
4.4.1 Main Competitors
Specifically, competitors include Onramp, Saper Media Group, and Labnet which are detailed as follows:
Onramp, Cleveland, Ohio. Onramp is a publicly traded company that was founded in 1994. It is considered an industry leader in the field of Web page design. Onramp is a provider of products/services that help businesses with their websites and hosting.
Saper Media Group, Cleveland, Ohio. Saper Media Group is a publicly traded company that was founded in 1995. It is considered an industry leader in the field of websites. SMG is a provider of products/services that put businesses on the Web. The company's products/services include website design and maintenance, graphic design, and application programming.

Appendix
Page 13
Labnet, Cleveland, Ohio. Labnet is a publicly traded company that was founded in 1995. It is considered an industry leader in the field of Web page design. Labnet is a provider of products/services that creates websites and hosting. The company's products/services include Web page design, website hosting, database services, and CGI programming.
4.4.2 Positioning Statement
Discover Productions believes that to stay ahead of its competitors it has to define its vision; to be a B2B Web-based turn-key solutions provider, developing new and innovative Web-based applications and become an ally to its clients in this diverse field. The company offers various benefits including:
Lead with the best products and services in the industry. High quality service and support
The solutions provided by Discover Productions require serious technical knowledge and experience to develop. Many competitors only sell a single boxed product versus a custom solution. The company also offers incentive packages as well as finders’ fees for any employees who bring in new business.
Discover Productions keeps a close watch on the technological advances that take place in the industry so that it can effectively implement its solutions. The company sends representatives to regional and national seminars and offers training programs for its staff. All this is done to ensure Discover Productions becomes the leading provider of industry solutions. Discover Productions believes in passing cost savings on to its customers. As such, the company purchases from Tech-Data which offers 30-day net terms and overnight shipping.
5.0 Strategy and Implementation Summary
Strategic Alliances The company plans to rapidly develop marketing alliances with industry leaders and pursue new sales of turnkey computing solutions, systems support, Web hosting, e-commerce, Web development, and Web-based applications. The market strategy is to capitalize on Discover Productions's innovative, information technology applications by expanding into new market areas.
Marketing The company will run advertising banners on various websites that are visited by its target markets. The company anticipates that it will use several different forms of promotion to attract clients to its services. These promotions will include discounted packaged deals that are all inclusive. Customers will purchase the company's education materials, license the company's software, and join the chat room for "one low introductory price."
Sales The sales process involves several steps which include relationship building, customer requirements/needs, product presentation, demo, closure and implementation. This approach is used because with our technical products and services it is more effective than competitors' single product approach.

Appendix
Page 14
5.1 Competitive Edge
1. One-stop shopping for companies needing complete "from the ground up" Web-based applications and business solutions. Discover Productions delivers the most comprehensive, cost-effective information available.
2. Provide comprehensive, cost-effective Web development, hosting, e-commerce and Internet computing solutions that deliver results.
3. New innovative B2B Web-based applications that target and capture untapped industries bringing businesses together over the Internet, and expanding the learning potential of everyone with their own line of educational products.
5.2 Marketing Strategy
The company's marketing strategy rests on the belief that its products and services represent a value-added approach to interpreting, qualifying, and understanding the complexities of the computer industry and technology markets. To implement this strategy, the company intends to place paid advertising banners on strategic websites in the computer fields and to utilize search engine portal and general media advertising. Through these approaches, customers of the company will attain access to the company through its websites, where they will in turn access the company's advertiser driver browser, which the company expects will expose the customer the company's proprietary products and services, as well as to links with other online firms with which the company has strategic alliances and advertising relationships.
Discover Productions' marketing plan is developed in order to support the company's corporate goals and strategies. It is developed from knowledge gained from industry analysis, competitive intelligence, and what is known about customers and clients. It should be noted that every reasonable effort has been taken to develop the marketing plan from data and analysis. It is possible that some of the data could be interpreted in different ways, which could invariably lead others to arrive at different conclusions about how to approach the marketplace and promote the business.
The specific marketing goals for the company are:
Increase Discover Productions brand awareness. Develop new clients and markets. Develop strategic alliances (via marketing). Build Discover Productions co-brands and partners. Increase advertising revenues. Increase traffic to Discover Productions. Expand existing clients and markets. Develop marketing presentation materials. Identify opportunities for new products and services. Enhance Discover Productions offerings. Enhance public relations efforts.

Appendix
Page 15
5.2.1 Marketing Programs
The delivery channel for Discover Productions's marketing strategy is based on an integrated marketing model which utilizes a mix of communications media. The marketing programs are designed to increase brand recognition and attract new customers. They are diverse and include a range of marketing communications.
The Internet. The Internet will be the primary marketing tool. Site development will include:
Use of state-of-the-art graphics. Easy access to pages within the site. A menu that includes easy enrollment for membership or product purchases. Use of state-of-the-art execution platform for trading. Easy payment methods and secure online transaction processor.
The company will also advertise on various strategic sites on the Internet including:
Submitting URL for each page of the site to search engines. Banner ads on select search portals.
The website. Discover Productions currently has two websites and has received several inquiries from them. An additional site will be added to provide an online catalog and quote system. Plans are underway to upgrade the website with additional marketing material, as this is expected to be one of the company's primary marketing channels.
Print media. Inserts and/or ads in weekly and daily newspapers will be considered as the budget allows.
Broadcast media. Radio, television, and cable advertising will be considered as the budget allows.
Email. The company will use demographic profiles to send messages to potential members and to:
Provide a newsletter to all active accounts. Provide thank you notifications to all visitors, along with advantages that go with being a member.
Promotions. The company will use various promotion channels to reach its target markets.
Secure space at online trading expos. Secure space at business expos in West Palm Beach and Boca Raton. Presentations at various Chambers of Commerce gatherings. Newsletters. Special membership promotions.

Appendix
Page 16
Browsing site for free.
5.3 Sales Strategy
Discover Productions uses a direct sales force, relationship selling, subcontractors, direct marketing, and Internet marketing to reach its markets. These channels are most appropriate because they utilize the quickest path and time to the market place, reduced capital requirements, fast access to established distribution channels, and best of processes for relationship building. Sales and distribution are made by/through strategic alliances and partners with Fortune 500 companies.
5.3.1 Sales Forecast
Positioning and company image. The idea is to communicate to the investor community, the company's unique combination of capabilities, products, competencies, and investor relations programs. Management believes that its corporate image is distinguished from other ASP firms. Discover Productions's business model is designed to utilize its cumulative management experience in computer solutions, Web hosting, Internet sales, e-commerce solutions, new Web-based products, and technical & marketing experience to create an unbeatable marketing and sales strategy, consisting of these components:
Corporate image (and image enhancement). Marketing propositions. Solid advertising programs.

Appendix
Page 17
Chart: Sales by Year
Table: Sales Forecast
Sales Forecast FY 2001 FY 2002 FY 2003 Sales Hosting Services $249,992 $3,750,000 $10,750,000 Internet Sales $325,005 $4,875,000 $15,875,000 Computing Solutions $500,003 $7,500,000 $18,500,000 Total Sales $1,075,000 $16,125,000 $45,125,000
Direct Cost of Sales FY 2001 FY 2002 FY 2003 Hosting Services $23,253 $348,837 $714,681 Internet Sales $30,236 $453,488 $1,055,402 Computing Solutions $46,511 $697,675 $1,229,917 Subtotal Direct Cost of Sales $100,000 $1,500,000 $3,000,000

Appendix
Page 18
Chart: Sales Monthly
Apr
May Jun
Jul
Aug
Sep Oct
Nov
Dec Jan
Feb
Mar
6.0 Management Summary
The following topics discuss the management organization within Discover Productions.
6.1 Organizational Structure
Discover Productions's organizational structure is illustrated below.
President/CEO, Edward Jones
Vice-President/CIO, Jacob Manuel
Technical Support Manager (To Be Determined) Research/Product Manager (To Be Determined) Web Application Manager (To Be Determined)
Vice-President/Marketing (To Be Determined)

Appendix
Page 19
Sales Manager (To Be Determined) Strategic Alliance Manager (To Be Determined) Business Development Manager, Jennifer L.Jones Advertising Manager (To Be Determined)
CFO, (To Be Determined)
Accounts Manager (To Be Determined) Human Resources Manager (To Be Determined)
6.2 Quality Assurance Program
Quality excellence is the foundation for the management of our business and the keystone of the company's goal for customer satisfaction. It is, therefore, company policy to:
Consistently provide services that meet the quality expectations of our customers. Actively pursue improving quality through programs that enable each employee to do his or her job right the first time.
The Discover Productions Quality Assurance Program consists of new employee orientation on the Quality Assurance Plan, in-house training programs for all employees, and a formal certification training program. Quality Assurance checks are done on an ongoing basis, and on completed jobs to ensure quality workmanship to the company's customers.
At Discover Productions, the customer comes first. Putting the customer first involves learning about the customer's ever-changing needs and meeting their expectations for lasting quality.
The company strives to prevent problems by anticipating them. Prevention can be achieved through planning and can avoid the time and costs associated with rework.
Quality happens through people and it is the people that make the Discover Productions business successful. Within an environment that stimulates self-motivation and creativity, employees can take ownership of the processes that make our business, and therefore our clients' businesses, succeed.
6.3 Personnel Plan
Senior Management Team
Discover Productions' management is highly experienced and qualified. It's key management team includes: Mr. Edward Jones as President/CEO and Mr. Jacob Manuel, CIO.

Appendix
Page 20
Other key personnel at Discover Productions include:
Ms. Michelle Jackson, who is in charge of new business development. Mrs. Dana Beck, who has specialization in Web database programming. Mr. Michael Taylor, who is a database programmer. Ms. Mary Joseph, who is in charge of Web page design.
Table: Personnel
Personnel Plan FY 2001 FY 2002 FY 2003 All departments $434,783 $2,200,000 $3,600,000 Other $0 $0 $0 Total People 12 55 90
Total Payroll $434,783 $2,200,000 $3,600,000

Appendix
Page 21
7.0 Financial Plan
The company is seeking first round funding in the amount of $914,900 for staffing purposes, purchasing software and hardware computing equipment, office costs, and other Internet related costs. The company is also seeking second round funding in the amount of $3 million for developing B2B Web-based applications, and their educational application software.
The following sections outline the financial plan for Discover Productions.
Table: General Assumptions
General Assumptions FY 2001 FY 2002 FY 2003 Plan Month 1 2 3 Current Interest Rate 10.00% 10.00% 10.00% Long-term Interest Rate 10.00% 10.00% 10.00% Tax Rate 25.42% 25.00% 25.42% Other 0 0 0

Appendix
Page 22
7.1 Projected Profit and Loss
Discover Productions' estimated income statements for FY2000-2002 are outlined below.
Table: Profit and Loss
Pro Forma Profit and Loss FY 2001 FY 2002 FY 2003 Sales $1,075,000 $16,125,000 $45,125,000 Direct Cost of Sales $100,000 $1,500,000 $3,000,000 Other $38,000 $570,000 $600,000 Total Cost of Sales $138,000 $2,070,000 $3,600,000
Gross Margin $937,000 $14,055,000 $41,525,000 Gross Margin % 87.16% 87.16% 92.02%
Expenses Payroll $434,783 $2,200,000 $3,600,000 Sales and Marketing and Other Expenses $483,600 $3,780,000 $5,765,000 Depreciation $36,000 $100,000 $150,000 Utilities $3,600 $5,000 $6,000 Insurance $14,400 $40,000 $60,000 Rent $18,000 $40,000 $70,000 Utilities $24,000 $25,000 $25,000 Continuing Education $36,000 $518,000 $575,000 Payroll Taxes $65,217 $330,000 $540,000 Other $0 $0 $0
Total Operating Expenses $1,115,600 $7,038,000 $10,791,000
Profit Before Interest and Taxes ($178,600) $7,017,000 $30,734,000 EBITDA ($142,600) $7,117,000 $30,884,000 Interest Expense $5,452 $4,856 $3,782 Taxes Incurred $0 $1,753,036 $7,810,597
Net Profit ($184,052) $5,259,108 $22,919,621 Net Profit/Sales -17.12% 32.61% 50.79%

Appendix
Page 23
Chart: Gross Margin Monthly

Appendix
Page 24
Chart: Gross Margin Yearly

Appendix
Page 25
Chart: Profit Monthly

Appendix
Page 26
Chart: Profit Yearly

Appendix
Page 27
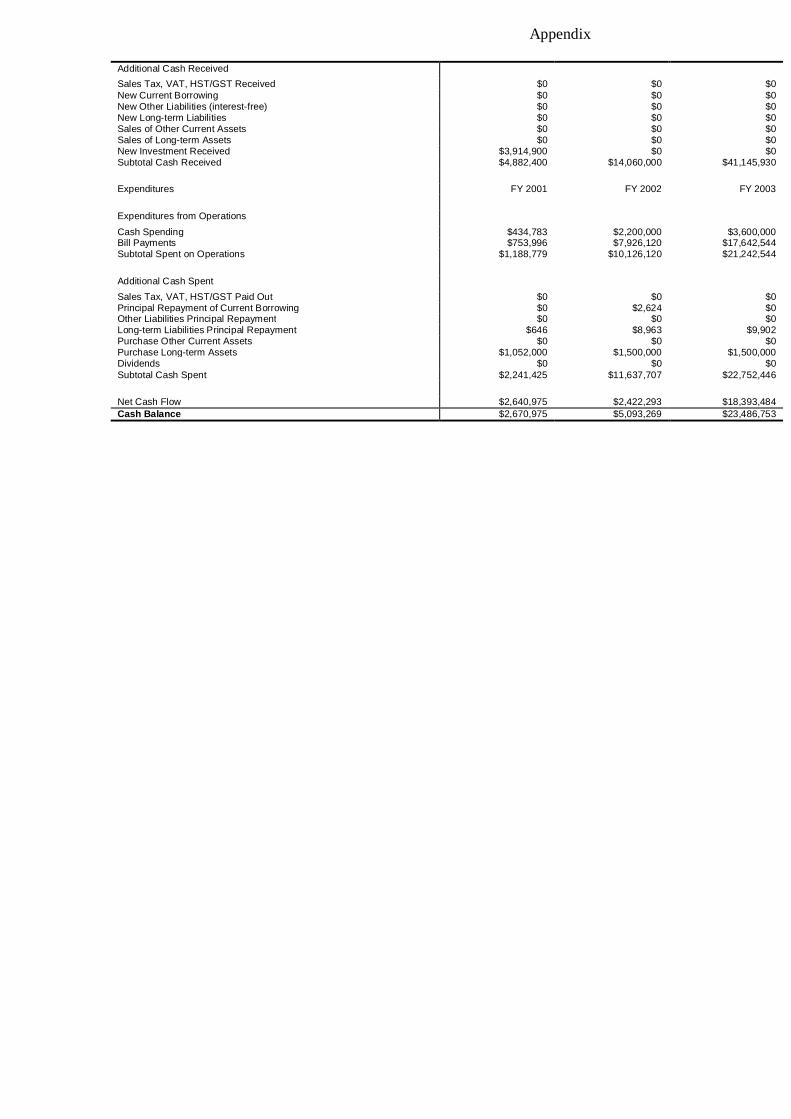
7.2 Projected Cash Flow
The table below provides the company's projected cash flow for FY2000-2002.
Chart: Cash
Apr
May Jun
Jul
Aug
Sep Oct
Nov
Dec Jan
Feb
Mar
Table: Cash Flow
Pro Forma Cash Flow FY 2001 FY 2002 FY 2003 Cash Received Cash from Operations Cash Sales $268,750 $4,031,250 $11,281,250 Cash from Receivables $698,750 $10,028,750 $29,864,680 Subtotal Cash from Operations $967,500 $14,060,000 $41,145,930
Appendix
Page 28
Additional Cash Received Sales Tax, VAT, HST/GST Received $0 $0 $0 New Current Borrowing $0 $0 $0 New Other Liabilities (interest-free) $0 $0 $0 New Long-term Liabilities $0 $0 $0 Sales of Other Current Assets $0 $0 $0 Sales of Long-term Assets $0 $0 $0 New Investment Received $3,914,900 $0 $0 Subtotal Cash Received $4,882,400 $14,060,000 $41,145,930
Expenditures FY 2001 FY 2002 FY 2003
Expenditures from Operations Cash Spending $434,783 $2,200,000 $3,600,000 Bill Payments $753,996 $7,926,120 $17,642,544 Subtotal Spent on Operations $1,188,779 $10,126,120 $21,242,544
Additional Cash Spent Sales Tax, VAT, HST/GST Paid Out $0 $0 $0 Principal Repayment of Current Borrowing $0 $2,624 $0 Other Liabilities Principal Repayment $0 $0 $0 Long-term Liabilities Principal Repayment $646 $8,963 $9,902 Purchase Other Current Assets $0 $0 $0 Purchase Long-term Assets $1,052,000 $1,500,000 $1,500,000 Dividends $0 $0 $0 Subtotal Cash Spent $2,241,425 $11,637,707 $22,752,446
Net Cash Flow $2,640,975 $2,422,293 $18,393,484 Cash Balance $2,670,975 $5,093,269 $23,486,753

Appendix
Page 29
7.3 Balance Sheet
The projected Balance Sheet is shown below.
Table: Balance Sheet
Pro Forma Balance Sheet FY 2001 FY 2002 FY 2003 Assets Current Assets Cash $2,670,975 $5,093,269 $23,486,753 Accounts Receivable $147,500 $2,212,500 $6,191,570 Other Current Assets $5,000 $5,000 $5,000 Total Current Assets $2,823,475 $7,310,769 $29,683,323
Long-term Assets Long-term Assets $1,152,000 $2,652,000 $4,152,000 Accumulated Depreciation $56,000 $156,000 $306,000 Total Long-term Assets $1,096,000 $2,496,000 $3,846,000 Total Assets $3,919,475 $9,806,769 $33,529,323
Liabilities and Capital FY 2001 FY 2002 FY 2003
Current Liabilities Accounts Payable $64,273 $704,046 $1,516,880 Current Borrowing $5,000 $2,376 $2,376 Other Current Liabilities $0 $0 $0 Subtotal Current Liabilities $69,273 $706,422 $1,519,256
Long-term Liabilities $49,354 $40,391 $30,489 Total Liabilities $118,627 $746,813 $1,549,745
Paid-in Capital $3,939,900 $3,939,900 $3,939,900 Retained Earnings $45,000 ($139,052) $5,120,056 Earnings ($184,052) $5,259,108 $22,919,621 Total Capital $3,800,848 $9,059,956 $31,979,577 Total Liabilities and Capital $3,919,475 $9,806,769 $33,529,323
Net Worth $3,800,848 $9,059,956 $31,979,577

Appendix
Page 30
7.4 Business Ratios
The following table contains important business ratios for the consulting industry, as determined by the Standard Industry Classification (SIC) Index code 8748.
Table: Ratios
Ratio Analysis FY 2001 FY 2002 FY 2003 Industry Profile Sales Growth 115.00% 1400.00% 179.84% 12.40%
Percent of Total Assets Accounts Receivable 3.76% 22.56% 18.47% 26.10% Other Current Assets 0.13% 0.05% 0.01% 44.70% Total Current Assets 72.04% 74.55% 88.53% 74.50% Long-term Assets 27.96% 25.45% 11.47% 25.50% Total Assets 100.00% 100.00% 100.00% 100.00%
Current Liabilities 1.77% 7.20% 4.53% 44.30% Long-term Liabilities 1.26% 0.41% 0.09% 16.00% Total Liabilities 3.03% 7.62% 4.62% 60.30% Net Worth 96.97% 92.38% 95.38% 39.70%
Percent of Sales Sales 100.00% 100.00% 100.00% 100.00% Gross Margin 87.16% 87.16% 92.02% 0.00% Selling, General & Administrative Expenses 104.28% 54.55% 40.95% 80.80% Advertising Expenses 11.16% 6.05% 2.77% 1.30% Profit Before Interest and Taxes -16.61% 43.52% 68.11% 2.20%
Main Ratios Current 40.76 10.35 19.54 1.75 Quick 40.76 10.35 19.54 1.38 Total Debt to Total Assets 3.03% 7.62% 4.62% 60.30% Pre-tax Return on Net Worth -4.84% 77.40% 96.09% 3.80% Pre-tax Return on Assets -4.70% 71.50% 91.65% 9.70%
Additional Ratios FY 2001 FY 2002 FY 2003 Net Profit Margin -17.12% 32.61% 50.79% n.a Return on Equity -4.84% 58.05% 71.67% n.a
Activity Ratios Accounts Receivable Turnover 5.47 5.47 5.47 n.a Collection Days 58 36 45 n.a Accounts Payable Turnover 12.26 12.17 12.17 n.a Payment Days 28 16 22 n.a Total Asset Turnover 0.27 1.64 1.35 n.a

Appendix
Page 31
Debt Ratios Debt to Net Worth 0.03 0.08 0.05 n.a Current Liab. to Liab. 0.58 0.95 0.98 n.a
Liquidity Ratios Net Working Capital $2,754,202 $6,604,347 $28,164,066 n.a Interest Coverage -32.76 1,445.00 8,127.25 n.a
Additional Ratios Assets to Sales 3.65 0.61 0.74 n.a Current Debt/Total Assets 2% 7% 5% n.a Acid Test 38.63 7.22 15.46 n.a Sales/Net Worth 0.28 1.78 1.41 n.a Dividend Payout 0.00 0.00 0.00 n.a
Table: Personnel
Personnel Plan Apr May Jun Jul Aug Sep Oct Nov Dec Jan Feb Mar All departments 0% $36,231 $36,232 $36,232 $36,232 $36,232 $36,232 $36,232 $36,232 $36,232 $36,232 $36,232 $36,232 Other 0% $0 $0 $0 $0 $0 $0 $0 $0 $0 $0 $0 $0 Total People 12 12 12 12 12 12 12 12 12 12 12 12
Total Payroll $36,231 $36,232 $36,232 $36,232 $36,232 $36,232 $36,232 $36,232 $36,232 $36,232 $36,232 $36,232

Appendix
Page 32
Table: Sales Forecast
Sales Forecast Apr May Jun Jul Aug Sep Oct Nov Dec Jan Feb Mar Sales Hosting Services 0% $13,953 $13,953 $16,279 $19,767 $23,255 $23,255 $23,255 $23,255 $23,255 $23,255 $23,255 $23,255 Internet Sales 0% $18,140 $18,140 $21,163 $25,698 $30,233 $30,233 $30,233 $30,233 $30,233 $30,233 $30,233 $30,233 Computing Solutions 0% $27,907 $27,907 $32,558 $39,535 $46,512 $46,512 $46,512 $46,512 $46,512 $46,512 $46,512 $46,512 Total Sales $60,000 $60,000 $70,000 $85,000 $100,000 $100,000 $100,000 $100,000 $100,000 $100,000 $100,000 $100,000
Direct Cost of Sales Apr May Jun Jul Aug Sep Oct Nov Dec Jan Feb Mar Hosting Services $1,298 $1,298 $1,514 $1,839 $2,163 $2,163 $2,163 $2,163 $2,163 $2,163 $2,163 $2,163 Internet Sales $1,687 $1,687 $1,969 $2,390 $2,813 $2,813 $2,813 $2,813 $2,813 $2,813 $2,813 $2,812 Computing Solutions $2,595 $2,595 $3,028 $3,677 $4,327 $4,327 $4,327 $4,327 $4,327 $4,327 $4,327 $4,327 Subtotal Direct Cost of Sales $5,580 $5,580 $6,511 $7,906 $9,303 $9,303 $9,303 $9,303 $9,303 $9,303 $9,303 $9,302

Appendix
Page 33
Table: General Assumptions
General Assumptions Apr May Jun Jul Aug Sep Oct Nov Dec Jan Feb Mar Plan Month 1 2 3 4 5 6 7 8 9 10 11 12 Current Interest Rate 10.00% 10.00% 10.00% 10.00% 10.00% 10.00% 10.00% 10.00% 10.00% 10.00% 10.00% 10.00% Long-term Interest Rate 10.00% 10.00% 10.00% 10.00% 10.00% 10.00% 10.00% 10.00% 10.00% 10.00% 10.00% 10.00% Tax Rate 30.00% 25.00% 25.00% 25.00% 25.00% 25.00% 25.00% 25.00% 25.00% 25.00% 25.00% 25.00% Other 0 0 0 0 0 0 0 0 0 0 0 0

Appendix
Page 34
Table: Cash Flow
Pro Forma Cash Flow Apr May Jun Jul Aug Sep Oct Nov Dec Jan Feb Mar Cash Received Cash from Operations Cash Sales $15,000 $15,000 $17,500 $21,250 $25,000 $25,000 $25,000 $25,000 $25,000 $25,000 $25,000 $25,000 Cash from Receivables $20,000 $21,500 $45,000 $45,250 $52,875 $64,125 $75,000 $75,000 $75,000 $75,000 $75,000 $75,000 Subtotal Cash from Operations $35,000 $36,500 $62,500 $66,500 $77,875 $89,125 $100,000 $100,000 $100,000 $100,000 $100,000 $100,000
Additional Cash Received Sales Tax, VAT, HST/GST Received 0.00% $0 $0 $0 $0 $0 $0 $0 $0 $0 $0 $0 $0 New Current Borrowing $0 $0 $0 $0 $0 $0 $0 $0 $0 $0 $0 $0 New Other Liabilities (interest-free) $0 $0 $0 $0 $0 $0 $0 $0 $0 $0 $0 $0 New Long-term Liabilities $0 $0 $0 $0 $0 $0 $0 $0 $0 $0 $0 $0 Sales of Other Current Assets $0 $0 $0 $0 $0 $0 $0 $0 $0 $0 $0 $0 Sales of Long-term Assets $0 $0 $0 $0 $0 $0 $0 $0 $0 $0 $0 $0 New Investment Received $914,900 $0 $0 $0 $0 $0 $0 $0 $3,000,000 $0 $0 $0 Subtotal Cash Received $949,900 $36,500 $62,500 $66,500 $77,875 $89,125 $100,000 $100,000 $3,100,000 $100,000 $100,000 $100,000
Expenditures Apr May Jun Jul Aug Sep Oct Nov Dec Jan Feb Mar
Expenditures from Operations Cash Spending $36,231 $36,232 $36,232 $36,232 $36,232 $36,232 $36,232 $36,232 $36,232 $36,232 $36,232 $36,232 Bill Payments $32,126 $63,773 $63,771 $63,750 $65,140 $66,491 $66,491 $66,491 $66,491 $66,491 $66,491 $66,491 Subtotal Spent on Operations $68,357 $100,005 $100,003 $99,982 $101,372 $102,723 $102,723 $102,723 $102,723 $102,723 $102,723 $102,723
Additional Cash Spent Sales Tax, VAT, HST/GST Paid Out $0 $0 $0 $0 $0 $0 $0 $0 $0 $0 $0 $0 Principal Repayment of Current Borrowing $0 $0 $0 $0 $0 $0 $0 $0 $0 $0 $0 $0 Other Liabilities Principal Repayment $0 $0 $0 $0 $0 $0 $0 $0 $0 $0 $0 $0 Long-term Liabilities Principal Repayment $0 $0 $0 $646 $0 $0 $0 $0 $0 $0 $0 $0 Purchase Other Current Assets $0 $0 $0 $0 $0 $0 $0 $0 $0 $0 $0 $0 Purchase Long-term Assets $22,000 $30,000 $100,000 $100,000 $100,000 $100,000 $100,000 $100,000 $100,000 $100,000 $100,000 $100,000 Dividends $0 $0 $0 $0 $0 $0 $0 $0 $0 $0 $0 $0 Subtotal Cash Spent $90,357 $130,005 $200,003 $200,628 $201,372 $202,723 $202,723 $202,723 $202,723 $202,723 $202,723 $202,723
Net Cash Flow $859,543 ($93,505) ($137,503) ($134,128) ($123,497) ($113,598) ($102,723) ($102,723) $2,897,277 ($102,723) ($102,723) ($102,723) Cash Balance $889,543 $796,038 $658,535 $524,407 $400,910 $287,312 $184,589 $81,866 $2,979,144 $2,876,421 $2,773,698 $2,670,975

Appendix
Page 35
Table: Profit and Loss
Pro Forma Profit and Loss Apr May Jun Jul Aug Sep Oct Nov Dec Jan Feb Mar Sales $60,000 $60,000 $70,000 $85,000 $100,000 $100,000 $100,000 $100,000 $100,000 $100,000 $100,000 $100,000 Direct Cost of Sales $5,580 $5,580 $6,511 $7,906 $9,303 $9,303 $9,303 $9,303 $9,303 $9,303 $9,303 $9,302 Other $4,000 $4,000 $3,000 $3,000 $3,000 $3,000 $3,000 $3,000 $3,000 $3,000 $3,000 $3,000 Total Cost of Sales $9,580 $9,580 $9,511 $10,906 $12,303 $12,303 $12,303 $12,303 $12,303 $12,303 $12,303 $12,302
Gross Margin $50,420 $50,420 $60,489 $74,094 $87,697 $87,697 $87,697 $87,697 $87,697 $87,697 $87,697 $87,698 Gross Margin % 84.03% 84.03% 86.41% 87.17% 87.70% 87.70% 87.70% 87.70% 87.70% 87.70% 87.70% 87.70%
Expenses Payroll $36,231 $36,232 $36,232 $36,232 $36,232 $36,232 $36,232 $36,232 $36,232 $36,232 $36,232 $36,232 Sales and Marketing and Other Expenses $40,300 $40,300 $40,300 $40,300 $40,300 $40,300 $40,300 $40,300 $40,300 $40,300 $40,300 $40,300 Depreciation $3,000 $3,000 $3,000 $3,000 $3,000 $3,000 $3,000 $3,000 $3,000 $3,000 $3,000 $3,000 Utilities $300 $300 $300 $300 $300 $300 $300 $300 $300 $300 $300 $300 Insurance $1,200 $1,200 $1,200 $1,200 $1,200 $1,200 $1,200 $1,200 $1,200 $1,200 $1,200 $1,200 Rent $1,500 $1,500 $1,500 $1,500 $1,500 $1,500 $1,500 $1,500 $1,500 $1,500 $1,500 $1,500 Utilities $2,000 $2,000 $2,000 $2,000 $2,000 $2,000 $2,000 $2,000 $2,000 $2,000 $2,000 $2,000 Continuing Education $3,000 $3,000 $3,000 $3,000 $3,000 $3,000 $3,000 $3,000 $3,000 $3,000 $3,000 $3,000 Payroll Taxes 15% $5,435 $5,435 $5,435 $5,435 $5,435 $5,435 $5,435 $5,435 $5,435 $5,435 $5,435 $5,435 Other $0 $0 $0 $0 $0 $0 $0 $0 $0 $0 $0 $0
Total Operating Expenses $92,966 $92,967 $92,967 $92,967 $92,967 $92,967 $92,967 $92,967 $92,967 $92,967 $92,967 $92,967
Profit Before Interest and Taxes ($42,546) ($42,547) ($32,478) ($18,873) ($5,270) ($5,270) ($5,270) ($5,270) ($5,270) ($5,270) ($5,270) ($5,269) EBITDA ($39,546) ($39,547) ($29,478) ($15,873) ($2,270) ($2,270) ($2,270) ($2,270) ($2,270) ($2,270) ($2,270) ($2,269) Interest Expense $458 $458 $458 $453 $453 $453 $453 $453 $453 $453 $453 $453 Taxes Incurred $0 $0 $0 $0 $0 $0 $0 $0 $0 $0 $0 $0
Net Profit ($43,004) ($43,005) ($32,936) ($19,326) ($5,723) ($5,723) ($5,723) ($5,723) ($5,723) ($5,723) ($5,723) ($5,722) Net Profit/Sales -71.67% -71.68% -47.05% -22.74% -5.72% -5.72% -5.72% -5.72% -5.72% -5.72% -5.72% -5.72%

Appendix
Page 36
Table: Balance Sheet
Pro Forma Balance Sheet Apr May Jun Jul Aug Sep Oct Nov Dec Jan Feb Mar Assets Starting Balances Current Assets Cash $30,000 $889,543 $796,038 $658,535 $524,407 $400,910 $287,312 $184,589 $81,866 $2,979,144 $2,876,421 $2,773,698 $2,670,975 Accounts Receivable $40,000 $65,000 $88,500 $96,000 $114,500 $136,625 $147,500 $147,500 $147,500 $147,500 $147,500 $147,500 $147,500 Other Current Assets $5,000 $5,000 $5,000 $5,000 $5,000 $5,000 $5,000 $5,000 $5,000 $5,000 $5,000 $5,000 $5,000 Total Current Assets $75,000 $959,543 $889,538 $759,535 $643,907 $542,535 $439,812 $337,089 $234,366 $3,131,644 $3,028,921 $2,926,198 $2,823,475
Long-term Assets Long-term Assets $100,000 $122,000 $152,000 $252,000 $352,000 $452,000 $552,000 $652,000 $752,000 $852,000 $952,000 $1,052,000 $1,152,000 Accumulated Depreciation $20,000 $23,000 $26,000 $29,000 $32,000 $35,000 $38,000 $41,000 $44,000 $47,000 $50,000 $53,000 $56,000 Total Long-term Assets $80,000 $99,000 $126,000 $223,000 $320,000 $417,000 $514,000 $611,000 $708,000 $805,000 $902,000 $999,000 $1,096,000 Total Assets $155,000 $1,058,543 $1,015,538 $982,535 $963,907 $959,535 $953,812 $948,089 $942,366 $3,936,644 $3,930,921 $3,925,198 $3,919,475
Liabilities and Capital Apr May Jun Jul Aug Sep Oct Nov Dec Jan Feb Mar
Current Liabilities Accounts Payable $30,000 $61,647 $61,647 $61,581 $62,924 $64,274 $64,274 $64,274 $64,274 $64,274 $64,274 $64,274 $64,273 Current Borrowing $5,000 $5,000 $5,000 $5,000 $5,000 $5,000 $5,000 $5,000 $5,000 $5,000 $5,000 $5,000 $5,000 Other Current Liabilities $0 $0 $0 $0 $0 $0 $0 $0 $0 $0 $0 $0 $0 Subtotal Current Liabilities $35,000 $66,647 $66,647 $66,581 $67,924 $69,274 $69,274 $69,274 $69,274 $69,274 $69,274 $69,274 $69,273
Long-term Liabilities $50,000 $50,000 $50,000 $50,000 $49,354 $49,354 $49,354 $49,354 $49,354 $49,354 $49,354 $49,354 $49,354 Total Liabilities $85,000 $116,647 $116,647 $116,581 $117,278 $118,628 $118,628 $118,628 $118,628 $118,628 $118,628 $118,628 $118,627
Paid-in Capital $25,000 $939,900 $939,900 $939,900 $939,900 $939,900 $939,900 $939,900 $939,900 $3,939,900 $3,939,900 $3,939,900 $3,939,900 Retained Earnings $45,000 $45,000 $45,000 $45,000 $45,000 $45,000 $45,000 $45,000 $45,000 $45,000 $45,000 $45,000 $45,000 Earnings $0 ($43,004) ($86,009) ($118,945) ($138,271) ($143,994) ($149,717) ($155,439) ($161,162) ($166,885) ($172,608) ($178,330) ($184,052) Total Capital $70,000 $941,896 $898,891 $865,955 $846,629 $840,906 $835,184 $829,461 $823,738 $3,818,015 $3,812,293 $3,806,570 $3,800,848 Total Liabilities and Capital $155,000 $1,058,543 $1,015,538 $982,535 $963,907 $959,535 $953,812 $948,089 $942,366 $3,936,644 $3,930,921 $3,925,198 $3,919,475
Net Worth $70,000 $941,896 $898,891 $865,955 $846,629 $840,906 $835,183 $829,461 $823,738 $3,818,015 $3,812,293 $3,806,570 $3,800,848