ASL & Plasticity - UCSD Cognitive Sciencecoulson/cogs179/ASL-and-Plasticity.pdf · Plasticity...
59
ASL & Plasticity
-
Upload
vuongkhuong -
Category
Documents
-
view
244 -
download
1
Transcript of ASL & Plasticity - UCSD Cognitive Sciencecoulson/cogs179/ASL-and-Plasticity.pdf · Plasticity...

ASL & Plasticity

PlasticityPlasticityFrom Wikipedia, the free encyclopedia
Plasticity has four meanings:• Plasticity (physics): In physics and engineering, plasticity is the
propensity of a material to undergo permanent deformation under load.
• Phenotypic plasticity: Describes the degree to which an organism's phenotype is determined by its genotype.
• Plasticity (brain): Entire brain structures can change to better cope with the environment. Specifically, when an area of the brain isdamaged and non-functional, another area may take over some of the function. This is known as plasticity.
• Synaptic plasticity: In neurobiology, plasticity is a property of a neuron or synapse to change its internal parameters in response to its history.

Altered Sensory Experience
• How does altered sensory experience affect brain organization?

Auditory Attention in Blind Humans
• Roder, Teder-Salejarvi, Sterr, Rosler, Hillyard & Neville (1999)
• Auditory discrimination ability better in blind than sighted adults
• Do the blind have better sound localization ability?– Central Locations– Peripheral Locations

Experimental Paradigm• Participants were either
sighted individuals wearing blindfolds or congenitally blind
• Brief noise bursts occurred randomly from each of the 8 speakers– Frequent Standard– Rare (higher-pitched) Target
• Two Conditions– Attend Center (detect targets
from speaker 1)– Attend Periphery (detect
targets from speaker 8)

Behavioral Results• Attend Center
– Slightly better target detection for sighted in position 1
– Spatial tuning no different in 2 populations
• Attend Periphery– Similar performance on target
detection at 8– Blind show significantly fewer
false alarms for targets originating from adjacent speakers
• What do these data suggest about how altered visual experience impacts auditory localization ability?

Standards: Attended vs. Unattended Locations
• Standards coming from central speakers 1-4– Speaker 1: N1 larger when
task involved targets at speaker 1
– Speaker 4: No N1 Task Effect• Standards coming from
peripheral speakers 5-8– Speaker 8: N1 larger when
task involved targets at speaker 8
– Speaker 5• N1 Task Effect in Sighted• No N1 Task Effect in Blind
• See next slide for N1 measurements

N1 to Standards & Spatial Tuning
• Attend Center– N1 largest at attended
location– N1 smallest at place
farthest from attended location (speaker 4)
– Gradual dropoff• Attend Periphery
– Blind: • Larger N1 than sighted at
speaker 8• Slight dropoff from 8 to 5
– Sighted: flat curve• Spotlight of Attention
– Who has a

Spotlight of Attention• How do behavioral data (top)
map onto N1 amplitude data (bottom)?
• Are good correct detection scores associated with big or small N1 amplitude?– Why?
• Are low false alarm rates associated with big or small N1 amplitude?– Why?
• Who has a more focused attentional spotlight in the periphery?
• What about the center?

Nd: Attended minus Unattended

Roder et al. (1999)• Blind individuals have similar auditory
localization ability for centrally located sounds• More precise localization for peripheral sounds –
area of space where sighted individuals have the most difficulty
• Posterior shift in scalp topography of auditory attention effect suggests different brain areas mediate localization in the blind
• Perhaps: recruitment of posterior multimodal brain areas that represent visual space in sighted individuals

Conductors• Besides sensory deprivation,
experience can also alter brain organization
• Orchestra conductors have to both listen to overall sound and be able to focus on particular individuals
• Does this experience affect their ability to localize sounds in the environment– Relative to other musicians,
e.g. pianists– Relative to non-musicians

Nager et al. (2003)• Set-up reminiscent of
Roder et al. (1999)• 84% (standards) pink
noise 500-5000 Hz• 16% (deviants) pink noise
500-15000 Hz• Attend Center
– Press button if deviant comes from C1 speaker
– Ignore all other stimuli• Attend Periphery
– Press button if deviant comes from P1 speaker
– Ignore all other stimuli

Those amazing components…• What component did Roder and colleagues examine in a
similar paradigm?– Functional significance?
• What difference component do you get if you subtract (N1) ERPs elicited by stimuli when its location is unattended from attended?– Functional significance?
• When auditory stimuli are ignored, what component is derived by subtracting the standard noises from the deviant noises?– Is it larger when the difference between the two sorts of stimuli is
easy to detect or hard to detect?• What ERP component are the auditory deviant stimuli
likely to elicit when they are the targets?

ERPs to Standard Tones• Is there an attention effect on the N1?
• Is there a gradation from C1 to C3?– Is it present in all the groups?
• Is there a gradation from P1 to P3?– Is it present in all the groups?– Are conductors more like sighted
people or like blind people?
• Do the topo maps of the Nd look similar in the 3 groups or different?
– Are conductors more like sighted people or like blind people?
• What does this imply about the impact of sensory deprivation versus enriched sensory experience on auditory localization ability?

ERPs to Target Stimuli
• What component do the attended targets elicit?• Why is it bigger for targets at C1 than P1?• What is the most obvious difference between the groups?• Muente interprets this as due to more confident decisions
– Is that consistent with any accounts of this component?– Does it seem to make sense?

Ignored Stimuli• Though it hasn’t actually been
derived here, what component is isolated by this comparison?
• Which group has the biggest and which the smallest effect?– Why do you think that’s the
case?• Which group has a
qualitatively different effect starting about 250 or 300 ms after tone onset?– Is this similar to any other
ERP effects (similar sort of paradigm) we’ve seen this quarter?

MMN & P3a
• Barely discernable MMN in controls• Big MMN in pianists• MMN in conductors followed by P3a
– P3a elicited by novel stimuli in oddball paradigm (e.g. dog bark vs. high/low tones)
– Signals involuntary shift of attention– May reflect conductors automatic orienting to contextually salient sounds

Nager et al. Discussion
• Conductors better than pianists at attentively focusing relevant auditory information in space– Dropoff in Nd effect at irrelevant locations in the
periphery– Same brain regions used as pianists, though
• Conductors better at “pre-attentive registration of deviant stimuli outside the attentional focus.”– P3a to ignored deviants observed only in conductors

Sign Languages• Full-fledged languages, created by hearing-
impaired people (not by Linguists):– Dialects, jokes, poems, etc.– Do not resemble the spoken language of the same
area (ASL resembles Bantu and Navaho)– Pinker: Nicaraguan Sign Language– Another evidence of the origins of language
(gestures)• Most gestures in ASL are with right-hand, or
else both hands (left hemisphere dominance)• Signers with brain damage to similar regions
show aphasia as well

Spoken and Sign Languages
• Neural mechanisms are similar• fMRI studies show similar activations for
both hearing and deaf• But in signers, homologous activation on
the right hemisphere is unanswered yet

LANGUAGE DEVELOPMENT American Sign Language
Sign constructed from a limited set of gestural components (same way that the spoken word is constructed from a finite number of distinctive sounds or phonemes).

LANGUAGE DEVELOPMENT American Sign Language
Sign constructed from a limited set of gestural components (same way that the spoken word is constructed from a finite number of distinctive sounds or phonemes).
Components of ASL:
1. Position of hands
2. Configuration of hands/fingers
3. Motions of hands/fingers

SEQUENCE OF LANGUAGE DEVELOPMENT
Universal Milestones in Language Devel.
Milestone Approx. Age
Cooing 2-3 mos.
Babbling 5 mos.
First Words 10-14 mos.
Ten Words 12 mos.
Two-word 21-24 mos. sentence
Two-hundred 24 mos.words

LANGUAGE DEVELOPMENT American Sign Language
Deaf children acquire ASL much like hearing children acquire their oral language.
When deaf children are raised with deaf parents:
Babbling – 7-11 mos.
Pointing – 8-9 mos.
Word/Sign – 12 mos.
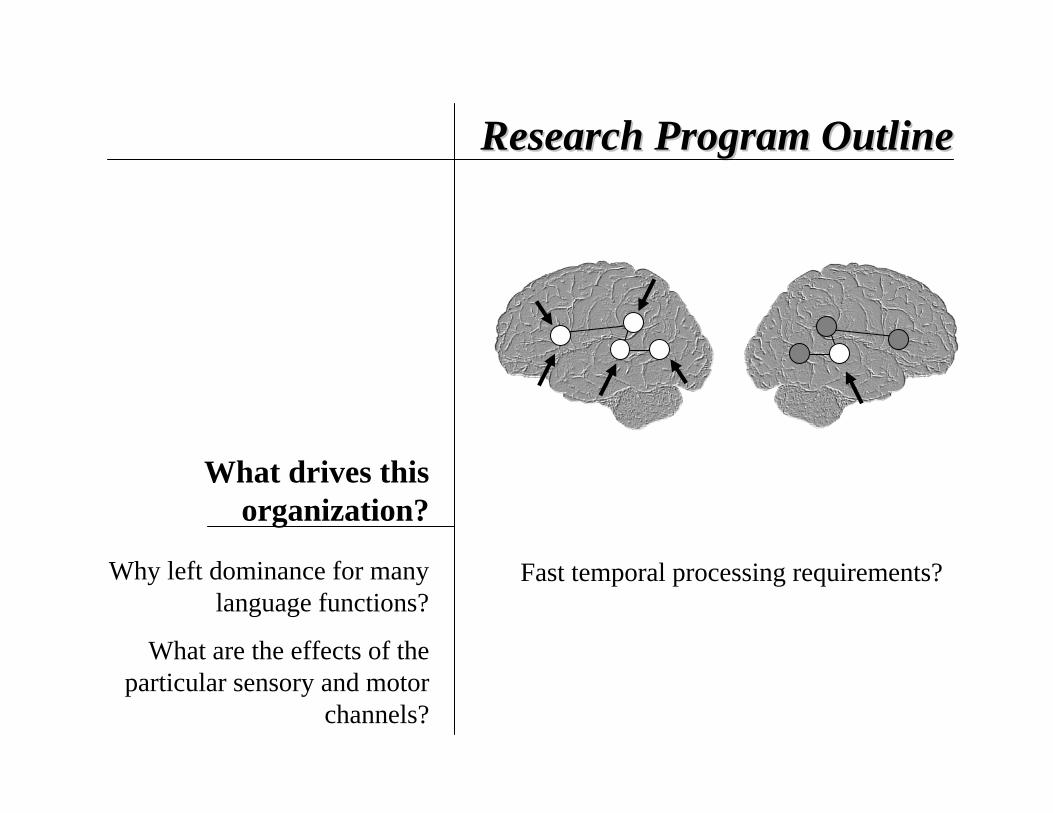
Research Program OutlineResearch Program Outline
What drives this organization?
Why left dominance for many language functions?
What are the effects of the particular sensory and motor
channels?
Fast temporal processing requirements?

ApproachApproach
Natural human languages
Sign Language
There are many signed languages throughout the world
They are not merely manual versions of the spoken language in the surrounding community
They are not merely elaborate mime-like systems, but rather have the same sorts of linguistic structuring found in the world’s spoken languages

SUMMER
UGLY
DRY
ApproachApproach
Natural human languages
…with different sensory and motor processing
requirements
Sign Language

ApproachApproach
Sign language and the brain
A natural experimental manipulation
Linguistic representation systems are held constant, while the sensory and motor modalities through which language is perceived and produced are varied.
How will this affect the anatomy of language?

ApproachApproach
Sign language and the brain
Lateralization Pattern?
Spoken Language
Signed Language

ApproachApproach
Sign language and the brain
Lateralization Pattern?
Within Hemisphere Organization?
Spoken Language
SensoryRepresentations
MotorRepresentations Sensory-Meaning
Interface
Sensory-MotorInterface
Signed Language?
Sensory-MotorInterface
SensoryRepresentations
Sensory-MeaningInterface
MotorRepresentations

ApproachApproach
Sign language and the brain
Lateralization Pattern?
Within Hemisphere Organization?
1. Lesion method:Left versus right brain damagedDeaf signers
2. Functional imaging:Native Deaf signers

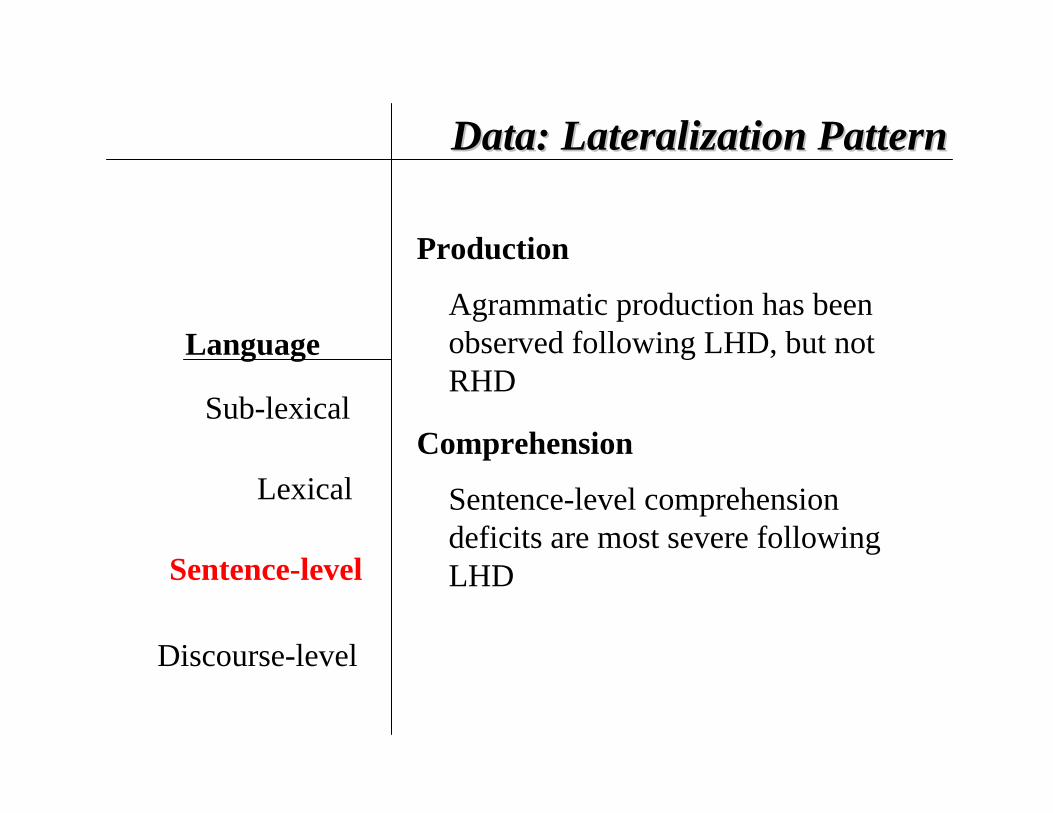
Data: Lateralization PatternData: Lateralization Pattern
Sub-lexical
Lexical
Sentence-level
Language
Discourse-level
LHD, but not RHD, signers often present with phonemic paraphasia in production
Production
FINE
correct handshape error

Data: Lateralization PatternData: Lateralization Pattern
Sub-lexical
Lexical
Sentence-level
Language
Discourse-level
FROG
correct location error
LHD, but not RHD, signers often present with phonemic paraphasia in production
Production

Data: Lateralization PatternData: Lateralization Pattern
Sub-lexical
Lexical
Sentence-level
Language
Discourse-level
Semantic paraphasias are fairly common following LHD but not RHD
Production
Single sign comprehension deficits have been found only following LHD
Comprehension
Data: Lateralization PatternData: Lateralization Pattern
Sub-lexical
Lexical
Sentence-level
Language
Discourse-level
Agrammatic production has been observed following LHD, but not RHD
Production
Sentence-level comprehension deficits are most severe following LHD
Comprehension

Data: Lateralization PatternData: Lateralization Pattern
Sub-lexical
Lexical
Sentence-level
Language
Discourse-level
Group Studies(Hickok, et al. 1996, Nature, 381:699-702)
13 LHD Deaf signers10 RHD Deaf signers
Administered a range of clinical aphasia assessment tests (ASL adapted)

Age of Sign Exposure
Onset Deafness Sex
Handed-ness
Age at Testing Lesion Size/Location Lesion Etiology
Left Lesioned:
LHD01 6 5 m r 81 lg/frontal-parietal Ischemic InfarctLHD02 5 5 f r 66 mod/inf parietal Ischemic InfarctLHD03 0 0 f r 37 lg/frontal Ischemic InfarctLHD04 6 1 f r 51 sm/inf-ant frontal Aneurism Rupture*LHD05 13 0 m r 45 lg/temp-par HematomaLHD06 0 0 m r 77 mod/frontal-temp-par Ischemic InfarctLHD07 0 0 m r 86 sm/sup frontal-parietal Ischemic InfarctLHD08 6 2 f r 64 mod/medial occ Ischemic InfarctLHD09 7 < 1 m r 29 mod/frontal-par Hematoma*LHD10 0 2 f r 79 mod/inf-post frontal Ischemic InfarctLHD11 9 < 1 f r 73 mod/frontal-par Ischemic InfarctLHD12 11 0 f r 79 lg/frontal-temp-par Ischemic InfarctLHD13 4 0 m r 71 mod/inf frontal-par Hematoma
Right Lesioned:
RHD01 12 0 f r 71 lg/front-temp-par Ischemic InfarctRHD02 9 5 m r 82 mod/temp-par Ischemic InfarctRHD03 5 0 m r 60 lg/front-temp-par Ischemic InfarctRHD04 0 0 f r 61 mod/sup front-par Tumor* RHD05 0 n/a f r 38 mod/sup par-occ Hematoma*RHD06 0 0 m r 74 lg/front-temp-par Ischemic InfarctRHD07 11 2 f r 78 mod/frontal-par Ischemic InfarctRHD08 7 <1 m r 74 lg/frontal-temp-par Ischemic InfarctRHD09 6 3 f r 83 mod/temp-par Ischemic InfarctRHD10 0 0 f r 78 mod/temp-par-occ Ischemic Infarct
* = surgical intervention
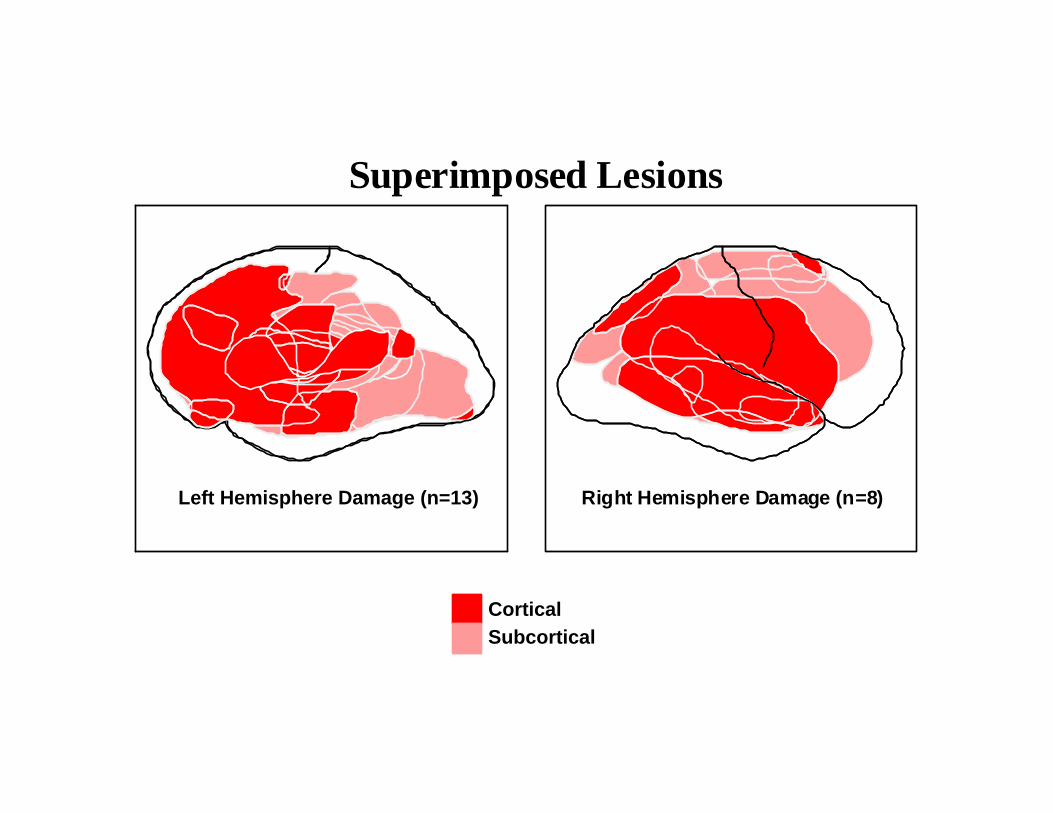
CorticalSubcortical
Left Hemisphere Damage (n=13) Right Hemisphere Damage (n=8)
Superimposed Lesions

Absent limited toshort phrases and
stereotyped expressions
runs throughentire sentence
Absent limited toshort phrases and
stereotyped expressions
runs throughentire sentence
Absent limited toshort phrases and
stereotyped expressions
runs throughentire sentence
Absent limited toshort phrases and
stereotyped expressions
runs throughentire sentence
MELODIC LINE
PHRASE LENGTH
ARTICULATORY AGILITY
GRAMMATICAL FORM
PARAPHASIA INRUNNING SIGN
SIGN FINDING
SIGN COMPREHENSION
1 2 3 4 5 6 7
Absent
1 sign
always impairedor impossible
none available
present in everyutterance
fluent withoutinformation
Absent(z = -2) (z = -1.5) (z = -1) (z = -.5) (z = 0) (z = +.5) (z = +1)
Normal
limited toshort phrases and
stereotyped expressions
runs throughentire sentence
4 signs 7 signs
normal only infamiliar signsand phrases
never impaired
limited to simpledeclaratives and
stereotypes
normal range
once per minute ofconversation
absent
information proportionalto fluency
exclusivelycontent signs
RATING SCALE PROFILE OF SIGN CHARACTERISTICS
Normal

Absent limited toshort phrases and
stereotyped expressions
runs throughentire sentence
Absent limited toshort phrases and
stereotyped expressions
runs throughentire sentence
Absent limited toshort phrases and
stereotyped expressions
runs throughentire sentence
Absent limited toshort phrases and
stereotyped expressions
runs throughentire sentence
MELODIC LINE
PHRASE LENGTH
ARTICULATORY AGILITY
GRAMMATICAL FORM
PARAPHASIA INRUNNING SIGN
SIGN FINDING
SIGN COMPREHENSION
1 2 3 4 5 6 7
Absent
1 sign
always impairedor impossible
none available
present in everyutterance
fluent withoutinformation
Absent(z = -2)(z = -1.5) (z = -1) (z = -.5) (z = 0) (z = +.5)(z = +1)
Normal
limited toshort phrases and
stereotyped expressions
runs throughentire sentence
4 signs 7 signs
normal only infamiliar signsand phrases
never impaired
limited to simpledeclaratives and
stereotypes
normal range
once per minute ofconversation
absent
information proportionalto fluency
exclusivelycontent signs
RATING SCALE PROFILE OF SIGN CHARACTERISTICS
Right Hemisphere Damaged (n=7)

MELODIC LINE
PHRASE LENGTH
ARTICULATORY AGILITY
GRAMMATICAL FORM
PARAPHASIA INRUNNING SIGN
SIGN FINDING
SIGN COMPREHENSION
1 2 3 4 5 6 7
Absent
1 sign
always impairedor impossible
none available
present in everyutterance
fluent withoutinformation
Absent(z = -2) (z = -1.5) (z = -1) (z = -.5) (z = 0) (z = +.5)(z = +1)
Normal
limited toshort phrases and
stereotyped expressions
runs throughentire sentence
4 signs 7 signs
normal only infamiliar signsand phrases
never impaired
limited to simpledeclaratives and
stereotypes
normal range
once per minute ofconversation
absent
information proportionalto fluency
exclusivelycontent signs
RATING SCALE PROFILE OF SIGN CHARACTERISTICS
Left Hemisphere Damaged (n=10)

Right-Lesioned Signers
Left-Lesioned Signers
deaf at birth, prelingual ASL exposure
deaf at birth, prelingual ASL exposure
all subjects
all subjects
0
5
10
15
20
25
30
35
ASL Production Scales
Tot
al S
core
0
0.3
0.6
0.9
1.2
1.5
1.8
2.1
ASL Paraphasias/min
Num
ber
Err
ors
/ M
in
0
10
20
30
40
50
60
70
80
90
100
ASL Comprehension Tests
Per
cent
Cor
rect
0
10
20
30
40
50
60
70
80
90
100
Per
cent
Cor
rect
ASL Naming Tests0
2
4
6
8
10
12
14
16
Num
ber
Cor
rect
ASL Phrase Repetition Test

Data: Lateralization PatternData: Lateralization Pattern
Sub-lexical
Lexical
Sentence-level
Language
Discourse-level
fMRI Study of ASL Comprehension(Neville, et al. 1998, PNAS, 95:922-929)
Studied healthy native Deaf signers watching videos of ASL sentences
“…the specific nature and structure of ASL results in the recruitment of the right hemisphere in the language system” p. 928

Data: Lateralization PatternData: Lateralization Pattern
Sub-lexical
Lexical
Sentence-level
Language
Discourse-level
Group Studies: Comprehension
11 LHD Deaf signers8 RHD Deaf signers
Three ASL comprehension measures1. Single sign-to-picture matching (BDAE)2. Simple commands (one clause, one step)3. Complex commands (multi-clause/-step)
Analysis looked at 1. Left vs. right hemisphere damage2. Temporal lobe lesioned vs. spared

Data: Lateralization PatternData: Lateralization Pattern
Sub-lexical
Lexical
Sentence-level
Language
Discourse-level
Group Studies: Comprehension
0
.2
.4
.6
.8
1
RHDLHD
Prop
ortio
n C
orre
ct
temporal lobe involved
temporal lobe spared
Single signs

Data: Lateralization PatternData: Lateralization Pattern
Sub-lexical
Lexical
Sentence-level
Language
Discourse-level
Group Studies: Comprehension
temporal lobe involved
temporal lobe spared
Simple sentences
0
.2
.4
.6
.8
1
RHDLHD
Prop
ortio
n C
orre
ct

0
.2
.4
.6
.8
1
RHDLHD
Prop
ortio
n C
orre
ct
Data: Lateralization PatternData: Lateralization Pattern
Sub-lexical
Lexical
Sentence-level
Language
Discourse-level
Group Studies: Comprehension
temporal lobe involved
temporal lobe spared
Complex sentences

ASL Comprehension
0
20
40
60
80
100
Single Signs Simple Sentences
ASL Comprehension
0
20
40
60
80
100
Single Signs Simple Sentences

"Simple" Token Test Items
0
0.1
0.20.3
0.4
0.5
0.6
0.7
0.8
0.9
1
Hearing Deaf
Prop
ortio
n Co
rrec
t
LHDRHD
"Complex" Token Test It ems
0
0.1
0.2
0.3
0.4
0.50.6
0.7
0.8
0.9
1
Hearing DeafPr
opor
tion
Corr
ect
LHDRHD
Similar Token Test Performance Levels AmongHearing and Deaf, LHD vs. RHD Subjects
Hearing data from: Swisher, L. P.; Sarno, M. T. (1969). Token Test Scores of Three MatchedPatient Groups: Left Brain-Damaged with Aphasia, Right Brain-Damaged Without Aphasia, Non-Brain-damaged. Cortex, 5:264-273

RHD has been associated with discourse-level deficits in hearing patients
The same appears to hold in the Deaf signing population
Data: Lateralization PatternData: Lateralization Pattern
Sub-lexical
Lexical
Sentence-level
Language
Discourse-level

Two types of discourse-level deficitsHickok et al. 1999. Brain Lang. 66:233-48
Data: Lateralization PatternData: Lateralization Pattern
Sub-lexical
Lexical
Sentence-level
Language
Discourse-level
1. Tangential utterances2. Spatial referential errors
Discourse Deficits in RHD Deaf Signers
AR SJ AR SJ
0.15
0.35
0.55
0.75
5
10
15
(0) (1)
Spatial Errors inASL Discourse
Ratio Tangential/On Topic Utterances

Neville et al. (1997)• Multiple populations differing
sensory experience and differing language experience watched videos of sentences in ASL
• Half congruous, half incongruous
• ERPs to sentence final words• ERPs to OC vs. CC words in
middle of sentence– Noun/Verb/Adjective– Pronouns/Conjunctions/Auxilia
ries

ASL vs. English• Overall similarity in ERPs to OC
vs. CC– Similar neural systems mediate
language comprehension irrespective of modality
• ASL– N250 larger over anterior sites for
CC words– N250 larger over posterior sites
for OC words• English
– N280 larger over anterior sites for CC words
• N400 comparable in ASL and English
• Speculate N250 more related to face processing

ASL: Deaf vs. Hearing Native Signers (CoDAs)
• Similar pattern over frontal sites– N250, P550– Later latency in Hearing may
reflect bilingual nature of this population
• Similar N400• Differences due to auditory
deprivation in deaf– N250 over posterior sites– P380
• Increased activity over posterior visual areas in the deaf

Age of Acquisition• N250 component
present in both Hearing groups
• N250 only modulated by word class in native signers
• May reflect proficiency differences due to age of acquisition

Age of Acquisition & Parietal Areas• Another difference between
Hearing Native vs. Late Learners is N250 topography
• Evident at posterior temporal and parietal sites in Hearing Native Signers
• Barely evident over parietal sites in Hearing Late Learners
• Early exposure to ASL leads to recruitment of RH parietal areas important for perception of motion, space & faces

Linguistic Knowledge• N250 present at frontal
sites only in hearing nonsigners
• N250 not modulated by word class in hearing nonsigners
• N400 (suprisingly) modulated by word class– Due to repetition of CC but
not OC words?• Any other suggestions for
why this happened?

N400 ASL Congruity Effects• Deaf
– N250 & N400 effect
• Hearing Native– N400 effect
• Hearing Late Learners– N400 effect
• Hearing Nonsigners– No N400 effect
• Why is the N400 more similar across groups than the N250?