Asian Journal of Empirical Research1)2014-AJER-79-94.pdf · Foreign direct investment and...
16
79 Foreign direct investment and infrastructure development in Indonesia: Evidence from province level data Primandita Fitriandi Directorate General of Taxes, Ministry of Finance, Jl. Gatot Subroto No. 40-42, Jakarta, 12190, Indonesia Makoto Kakinaka and Koji Kotani Graduate School of International Relations, International University of Japan, 777 Kokusai-cho, Minami-Uonuma, Niigata 949-7277, Japan Abstract 1 Attracting foreign direct investment (FDI) has been an important policy agenda under institutional and regulatory reforms toward the decentralized system in Indonesia. Infrastructure development has been acknowledged as a crucial condition to attract foreign direct investment. This study empirically examines the relationship between infrastructure development and FDI inflows at the province level in Indonesia by using panel data of 30 provinces over the sample period of 2000-2009. As a proxy to infrastructure development, this study uses four measures of hard infrastructure: electricity, road length, water capacity, and water distribution. Our empirical analysis shows that infrastructure development would promote FDI inflows. In addition, the result presents that provinces with small- sized government, which is measured by government expenditure, attract more FDI inflows. These results are also confirmed by the count data analysis of FDI projects. The need of better infrastructure with small-sized government suggests that the policy authority should utilize private investment through various schemes, such as public private partnership (PPP). Keywords: Foreign direct investment, infrastructure development, regional economy, Indonesia Introduction The globalization of the world economy has contributed to a remarkable growth of foreign direct investment (FDI) inflow into developing countries in the 1990s. FDI inflow is now acknowledged as a key factor of economic development especially for developing countries; since it provides the major financial sources to the transfer of technology, organizational and managerial practices and skills, as well as access to international markets (see, e.g., Shatz and Venables, 2000; Alfaro et al., 2004). 2 In particular, multinational enterprises (MNEs) have played an essential role in shaping the Corresponding author’s Name: Koji Kotani Email address: [email protected] 2 Shatz and Venables (2000) categorize FDI into two categories: vertical and horizontal FDIs. Vertical FDI or “export oriented FDI” happens when MNEs divide their production process internationally to minimize Asian Journal of Empirical Research journal homepage: http://aessweb.com/journal-detail.php?id=5004
Transcript of Asian Journal of Empirical Research1)2014-AJER-79-94.pdf · Foreign direct investment and...

79
Foreign direct investment and infrastructure development in Indonesia: Evidence
from province level data
Primandita Fitriandi Directorate General of Taxes, Ministry of Finance, Jl. Gatot Subroto No. 40-42, Jakarta, 12190,
Indonesia
Makoto Kakinaka and Koji Kotani
Graduate School of International Relations, International University of Japan, 777 Kokusai-cho,
Minami-Uonuma, Niigata 949-7277, Japan
Abstract1
Attracting foreign direct investment (FDI) has been an important policy agenda under institutional
and regulatory reforms toward the decentralized system in Indonesia. Infrastructure development has
been acknowledged as a crucial condition to attract foreign direct investment. This study empirically
examines the relationship between infrastructure development and FDI inflows at the province level
in Indonesia by using panel data of 30 provinces over the sample period of 2000-2009. As a proxy to
infrastructure development, this study uses four measures of hard infrastructure: electricity, road
length, water capacity, and water distribution. Our empirical analysis shows that infrastructure
development would promote FDI inflows. In addition, the result presents that provinces with small-
sized government, which is measured by government expenditure, attract more FDI inflows. These
results are also confirmed by the count data analysis of FDI projects. The need of better
infrastructure with small-sized government suggests that the policy authority should utilize private
investment through various schemes, such as public private partnership (PPP).
Keywords: Foreign direct investment, infrastructure development, regional economy, Indonesia
Introduction
The globalization of the world economy has contributed to a remarkable growth of foreign direct
investment (FDI) inflow into developing countries in the 1990s. FDI inflow is now acknowledged as
a key factor of economic development especially for developing countries; since it provides the
major financial sources to the transfer of technology, organizational and managerial practices and
skills, as well as access to international markets (see, e.g., Shatz and Venables, 2000; Alfaro et al.,
2004).2In particular, multinational enterprises (MNEs) have played an essential role in shaping the
Corresponding author’s
Name: Koji Kotani Email address: [email protected] 2 Shatz and Venables (2000) categorize FDI into two categories: vertical and horizontal FDIs. Vertical FDI or
“export oriented FDI” happens when MNEs divide their production process internationally to minimize
Asian Journal of Empirical Research
journal homepage: http://aessweb.com/journal-detail.php?id=5004

Asian Journal of Empirical Research, 4(1)2014: 79-94
80
patterns of economic development through their FDI decisions (see, e.g., McCann and Mudambi,
2004). Since the 1997 global economic crisis in international financial markets, many developing
countries have been strongly advised to rely primarily on FDI inflow for the promotion of economic
development on a sustainable basis. Indonesia has also attempted to attract FDI inflow through
several institutional reforms under the decentralization policy, since its economy needs a huge
amount of funds to finance and accelerate economic development.3
Among various factors as a determinant of FDI inflows, infrastructure development is widely
considered as a crucial factor influencing the desirability of investment location. The examination of
the role of infrastructure development is important particularly for developing economies, such as
Indonesia, since developing infrastructure is one of the main processes to attract domestic and
foreign investments. Moreover, discussion at the regional or province level is more important for
Indonesia due to an on-going process of decentralization (see, e.g., Silver et al., 2001; Fane
2003).4Given these arguments, this study aims at verifying the positive relationship between
infrastructure development and FDI inflows at the province level in Indonesia. In addition to the role
of infrastructure development, this study also attempts to present some evidence to explain intra-
country determinants of FDI inflows within Indonesia. Indeed, an understanding of the determinants
of location of FDI inflow could help policy-makers design effective policies to attract FDI inflow
into provinces where investment is most needed.
A lot of empirical studies have put more attention on the role of infrastructure development on FDI
by using various infrastructure variables covering the quality and the availability of transportations
and telecommunication networks.5 Most of them show the clear evidences supporting that highly
developed infrastructure would play a crucial role in attracting FDI inflows at inter- or intra-country
level. Concerning the Indonesian economy, several studies have existed on the role of FDI inflows.
Lipsey and Sjoholm (2011) study the relationship between growth and FDI in comparison with other
East Asian countries. Moreover, Takii (2005) discusses the role of FDI by examining productivity
spillovers from foreign multinational plants in Indonesia, and Takii (2011) also examines the effect
of FDI on economic growth in relation to the origin of investors in Indonesian manufacturing over
the period of 1990–2003.Despite the growing importance of FDI inflows in developing economies,
empirical evidence is limited on the determinants of location choice of FDI inflows at their regional
level. To the best of our knowledge, no previous empirical research has existed on the relationship
between FDI inflows and infrastructure development at the province level in Indonesia. Hence, this
study would be the first attempt to empirically verify this important issue.
This study uses panel data covering 30 provinces in Indonesia over the 10-year sample period of
2000-2009.We employ several techniques to estimate the models, such as pooled OLS, random
effects, and Tobit estimations with the data of the ratio of FDI inflows to GDP on a provincial basis.
In addition, we attempt to check the validity of the empirical results by employing Poisson models
production costs. On the other hand, horizontal FDI or “market oriented FDI” occurs when MNEs perform
same production activities in different countries to take an advantageous position in the local market. 3 Indonesia’s government has been implementing several policies to promote FDI inflow, such as new
investment law No. 25/2007, one-stop shop system, and tax incentives. 4 Indonesia’s decentralization was initiated in January 2001 based on Laws No. 22/1999on Regional
Government and No. 25/1999 on the Fiscal Balance between the Central Government and Regional
Governments. These two laws drastically changed the national-sub national relationships by transferring
powers, taxes, funds, and personnel to the provinces. The authority of the central government has been
devolved to sub national governments except for defense, diplomatic, judicial, fiscal, and religious policies. 5See, e.g., Coughlin, et al. (1991), Wheeler and Mody (1992), Head and Ries (1996), Broadman and Sun
(1997), Wei, Liu, Parker, and Vaidya (1999), Cheng and Kwan (2000),Coughlin and Segev (2000), Asiedu
(2002), Makabenta (2002), Deichman, et al. (2003), Boudier-Bensebaa (2005), Fung, et al. (2005), Cheng
(2006), Mollick, et al. (2006), Li and Park (2006), Bellak, Leibrecht, and Damijan (2009), and Yavan (2010).
Asian Journal of Empirical Research, 4(1)2014: 79-94
81
and negative binomial models (NBM) with the count data of FDI projects. As a proxy to
infrastructure development, this study uses four measures at the province level: the logarithms of
electricity distribution per area, road length per area, water distribution per population, and water
capacity per population. It should be noted that infrastructure is generally classified into hard
components and soft (institutional) components, as emphasized in Fung et al. (2005). Although soft
components in the form of transparent institutions with good governance are important, our focus is
only on the role of hard infrastructure.
The main results demonstrate that all infrastructure variables are positively related to FDI inflows in
terms of both the ratio of FDI inflows to GDP and the count data of FDI projects. This implies that
the environment with better infrastructure could attract more FDI inflows into Indonesia at the
province level. Our results have important policy implications since the result of effective
infrastructure development would support the recent strategic development plan under the State
Ministry of National Development Planning (BAPPENAS-Indonesia). To attract FDI inflows and
thus to promote regional development, infrastructure development should be prioritized by
provincial governments under the institutional reforms toward the decentralization. The analysis also
presents that in general, government expenditure as a proxy to the size of the government is
negatively associated with FDI inflows. Provinces with small-sized government would attract FDI
inflows more significantly, which is consistent with the argument that government spending would
crowd out FDI inflows from abroad. The need of better infrastructure with small-sized government
suggests that the policy authority should utilize private investment through various schemes, such as
public private partnership (PPP).
The rest of this paper is organized as follows. Section2 summarizes the overview of FDI in
Indonesia. Section 3 presents the panel data analysis, which consists of empirical model framework,
data, and empirical results. We also discuss some important implications based on the results.
Finally, section 4 presents conclusion which covers summary and further possible studies.
Overview of foreign direct investment in Indonesia
Indonesia as a developing country has to deal with several challenges to compete with other
countries in the globalized world. Boosting investment and upgrading productivity are the major
challenges for Indonesia to meet global standards, accelerate development, and reduce poverty and
unemployment. Moreover, Indonesia needs a huge amount of funds to finance development projects
and recover its economy after suffering from the financial crisis in 1998. Recognizing that FDI has
significant contribution to economic development, like many other developing countries, Indonesia
has tried to attract FDI inflows to improve the overall productivity and enhance international trade.
During the period when President Soekarnoinitiated self-sufficiency policy with import substitution,
he developed communist sympathies and managed Indonesia as a socialist economy, so that foreign
investments from western countries were strictly restricted under his political leadership. However,
after the overtaking in 1965, President Soeharto changed its investment policy direction. The
government started liberalizing its capital account regime in 1967, when Foreign Investment Law
No. 1/1967was introduced. The government then adopted a free-floating foreign exchange system in
1970, which was followed by further liberalization of the financial sector in 1980s. Indonesia has
been largely perceived as an attractive destination for foreign investment.
After Foreign Investment Law No. 1/1967 as the first underlying legislation for promoting FDI to
Indonesia, the government created a new agency, called the Investment Coordinating Board (Badan
Koordinasi Penanaman Modal-BKPM), in 1973in order to improve the efficiency of investment
permits. This agency was mandated to boost domestic and foreign direct investment through creating
a favorable investment climate. In addition, its goal is not only to attract domestic and foreign

Asian Journal of Empirical Research, 4(1)2014: 79-94
82
investment, but also to improve the quality of investments that help improve social inequality and
reduce poverty. Any application except investment in the oil and gas, mining, banking, and
insurance industries, which are handled by relevant technical government agencies, needs approval
from BKPM. Several policies toward trade liberalization have also removed some restrictions and
barriers to investments from abroad since the 1970s.
In the middle of 1997, Indonesia faced the most severe economic crisis in its history (Levinsohn et
al., 1999). Moreover, the Indonesia rupiah depreciated sharply and extremely, even uncontrolled
during the 1997 Asian financial crisis. Such instability for domestic individuals and businesses led to
foreign investors’ panic, resulting in massive capital outflows from Indonesia (Cole and Slade,
1996). Due to this crisis, the investment environment in Indonesia was weakened. To improve
investment climate, the government signed an agreement with the IMF for the assistance in
overcoming its economic problems with substantial currency depreciation, uprising inflation, and the
fragile banking system, and launched a package of reforms to free investors from some of the
cumbersome documentary requirements and bureaucratic red tape. In addition, the government
allowed foreign investors to acquire domestic firms with reserve of a small stake for the original
owner and to rescue “sick” firms by injecting capital in several sectors, although some regulations
remained particularly for small and medium sized domestic firms.
In 2007, during the mid-term of the Yudhoyono’s government, Indonesia issued the new Investment
Law of 2007 with the sole intention of making the Indonesian economy more attractive to foreign
investment. On a broad front, BKPM attempted to simplify the procedures for approval of new
investments by promoting better coordination between various government institutions, offering tax
incentives and special economic zones to make returns to investment more attractive, and persuading
major players to capitalize in the large domestic consumer markets. As an implementation of
Investment Law of 2007, the government launched the one-stop-shop system in 2010 to mitigate
bureaucratic red tape and allow investors to process business licenses faster. To facilitate this system
further, the government established the National Single Window for Investment (NSWI) as an
electronic platform for investments that enables investors to apply for license and non-license
services through the on-line system. Hence, investment climate, such as the efficiency of the
investment license process, has been improved drastically.
Given the above environments, investment climate has been changing in Indonesia. Figure 1 shows
FDI inflows to Indonesia during the period from 1990 to 2011, excluding FDI inflows in the oil and
gas, mining, banking, and insurance industries. The data from Indonesian Investment Coordinating
Board over the two decades presents that FDI inflows is in an upward trend both in terms of the
number of FDI projects and the value of FDI inflows. Concerning the regional allocation of FDI
inflows, Figure 2 shows the polarization among provinces in terms of geographical location over the
period from 1990 to 2011.FDI inflows in Indonesia appear to concentrate on Java Island, especially
in Jakarta, the capital city. Indeed, Java Island consisting of six provinces attracted 77% of FDI
inflows to Indonesia. Moreover, Jakarta solely attracted 31% of FDI, so that Jakarta has consistently
been the leading destination, although it accounts for only 17% of Indonesia’s GDP and for only 4%
of Indonesia’s population.

Asian Journal of Empirical Research, 4(1)2014: 79-94
83
Figure 1: FDI inflows to Indonesia (1990 – 2011)
Source: Investment coordinating board
Figure 2: FDI inflows to Indonesia per province (1990 – 2011)
Source: Investment Coordinating Board
At the same time, infrastructure has been a major concern for Indonesian government, since its
geographical conditions with thousand islands make infrastructure as a prerequisite for economic
development. Table 1 presents the variables related to infrastructure development in 2009, such as
electricity per area, road length per area, water distribution per population, and water capacity per
population, for 30 provinces of Indonesia. Jakarta achieves the highest ratio related to infrastructure
development, while other provinces are generally low. Although the Indonesian government has

Asian Journal of Empirical Research, 4(1)2014: 79-94
84
attempted to improve infrastructure, it still seems a long way to catch up with developed countries.
Infrastructure, such as electricity, roads, and railway, remains to be far from sufficient.
Table 1: FDI and infrastructure in Indonesia (average: 2000-2009)
Province
Ratio of
FDI to GDP (%)
Elect per
area
Road per
area
Water dist
per pop
Water cap per
pop
1 Aceh 0.09 0.3434 0.2824 0.0031 0.0003
2 Sumatera
utara 0.75 0.6074 0.4365 0.0141 0.0009
3 Sumatera
barat 0.59 0.3914 0.3899 0.0092 0.0008
4 Riau 2.43 0.1493 0.1797 0.0079 0.0005
5 Jambi 0.74 0.1126 0.2502 0.0080 0.0008
6 Sumatera
selatan 1.53 0.1560 0.1332 0.0064 0.0005
7 Bengkulu 0.46 0.2231 0.3054 0.0059 0.0007
8 Lampung 0.91 0.4939 0.3927 0.0025 0.0003
9 Bangka
Belitung 1.51 0.1983 0.1410 0.0064 0.0005
10 Dki Jakarta 6.15 56.3297 10.1440 0.0630 0.0028
11 Jawa barat 4.26 2.2573 0.7222 0.0054 0.0004
12 Jawa
tengah 0.43 2.3247 0.8348 0.0063 0.0006
13 Di
Yogyakarta 0.48 3.6635 2.0259 0.0069 0.0007
14 Jawa timur 2.46 1.6998 0.7210 0.0092 0.0006
15 Banten 8.00 1.6188 0.2665 0.0054 0.0004
16 Bali 8.50 1.9252 1.1806 0.0248 0.0015
17
Nusa
tenggara
barat
0.12 0.3596 0.4016 0.0075 0.0009
18
Nusa
tenggara
timur
0.19 0.1531 0.3866 0.0042 0.0005
19 Kalimantan
barat 0.80 0.1091 0.0776 0.0070 0.0005
20 Kalimantan
tengah 1.39 0.0421 0.0672 0.0070 0.0006
21 Kalimantan
selatan 0.97 0.2925 0.2311 0.0123 0.0007
22 Kalimantan
timur 1.17 0.0487 0.0474 0.0218 0.0016
23 Sulawesi
utara 0.62 0.4147 0.5699 0.0075 0.0010
24 Sulawesi
tengah 0.08 0.1182 0.1739 0.0056 0.0005
25 Sulawesi
Selatan 1.01 0.3545 0.5049 0.0066 0.0007
26 Sulawesi
tenggara 0.04 0.1429 0.1956 0.0044 0.0005
27 Gorontalo 1.86 0.3545 0.2828 0.0075 0.0010
28 Maluku 0.65 0.0817 0.1320 0.0049 0.0005

Asian Journal of Empirical Research, 4(1)2014: 79-94
85
29 Maluku
utara 0.13 0.0703 0.0652 0.0049 0.0005
30 Papua 2.07 0.0124 0.0426 0.0079 0.0005
Some attentions have been paid to FDI inflows in Indonesia. Although most works on FDI inflows
into Indonesia concerns its relationship with trade liberalization and economic growth (see, e.g.,
Osada, 1994; Sjoholm, 2002; Iman and Nagata, 2005), few empirical studies has existed on the
relationship between FDI and infrastructure at the intra-country or provincial level. Given the
significant variation in terms of levels of FDI inflows across provinces, this study empirically
examines how infrastructure development is related to FDI inflows and what factors account for this
unbalanced distribution of FDI inflows within Indonesia. The regional imbalance of FDI location
provides us with a motivation to examine the determinants of FDI inflows across provinces.
Empirical analysis
This section empirically examines how infrastructure development affects FDI inflow at the
provincial level in Indonesia during the 2000s. The methodology adopted for the model estimation is
that specifically designed for panel data. One of the advantages of panel data analysis is the large
number of data points. This would increase the degree of freedom and reduce the co linearity
problem among explanatory variables, hence improving the efficiency of econometric estimation.All
data used in our empirical analysis, except for FDI inflows, is taken from BPS-statistics Indonesia,
and the data of FDI inflows is taken from Investment Coordinating Board of Indonesia (BKPM). The
panel data set covers information for 30 provinces over the sample period from 2000 to 2009.
Methodology
To discuss the impact of infrastructure development on regional FDI flows, we estimate the
following empirical model with panel data:
Where is the ratio of FDI inflows to regional GDP in province i at year t; is the
measurement of infrastructure development; ’s other control variables that are expected to affect
FDI inflows; and is the error term with standard properties. Our primary interest in this study is to
verify that infrastructure development is positively associated with FDI inflows. The host province
with infrastructure development attracts FDI inflows; since good infrastructure facilitates production
processes as well as the distribution of output. Thus, the sign of the coefficient on is
expected to be positive. This study uses four measures of infrastructure development at the province
level: the logarithms of electricity distribution per area, road length per area, water distribution per
population, and water capacity per population.
Concerning other control variables, we include the ratio of government expenditure of provincial
GDP ( and the log of real provincial GDP ( ) to capture the government size in
terms of expenditure and the size of domestic market demands, respectively. We also include the
ratio of the sum of export and import to GDP at the province level ( ) and the ratio of
industrial value added to GDP at the province level ( ) to capture trade openness and
industrialization, respectively. Moreover, we include the log of labour cost ( ) at the
province level due to the arguments that labor cost is one of the main concerns for multinational
firms, and we include the unemployment rate at the province level ( ) as a measure of labor
availability.
To examine the effect of special economic zone with tax incentive on FDI flows, the model
incorporates the dummy variable ( ) that equals unity if province i has special economic (tax

Asian Journal of Empirical Research, 4(1)2014: 79-94
86
free) zones and zero otherwise. Regions that fully represent special economic zones in Indonesia are
Batam, Bintan, and Karimun. Those regions are located in Riau province. Tax incentives are offered
to firms which operate their businesses in these zones. The forms of those incentives are value added
tax (VAT) exemption for firms operating in the islands, import duties nullification for goods which
are imported to these zones, and negation of luxury tax for goods entering these islands. There is no
special treatment in corporate income tax for firms in these zones.
As for each control variable, we briefly explain the role of each variable in our model as follows.
Government expenditure: Several studies have examined the effect of government expenditure or
public investment on FDI inflows. Government policies can be important for guiding FDI inflows by
influencing firms’ decision to internalize processes (Deichman et al., 2003; Mollick et al., 2006).
The impact of public expenditure on FDI inflows might be ambiguous. Public investment would
provide incentives for private investment. On the other hand, government intervention often
dismantles the market mechanism so that it crowds out private investment by diminishing the
attractiveness of establishing business in a certain place.
Provincial gross domestic product (GDP): The size of market demand is one of the most
important location determinants of horizontal FDI or market-oriented FDI inflows in the literature
(see, e.g., Shatz and Venables, 2000). The market size of a province is usually measured by its GDP.
In general, a larger provincial market would attract more FDI inflows than a smaller one since a
larger market size may provide more opportunities for foreign firms to sell their goods or services.
Trade openness: Several studies illustrate that trade openness positively influences FDI inflows into
a country, especially export-oriented FDI. Generally, the empirical literature supports the argument
that trade policy could be one of the important factors for attracting FDI inflows to the host country.
For example, Asiedu (2002) finds that trade openness promotes FDI inflows to Africa. The work of
Sahoo (2006) on South Asia states that investors mostly pursue big markets and tend to invest in
countries which have regional trade integration and also in countries with greater investment
incentives in their trade agreements.
Industry value added: Industrialization is also acknowledged as an important determinant of FDI
inflows. In particular, many studies investigate the effect of industrialization, particularly industry
agglomeration, on FDI inflows and find that economic agglomeration is positively significant as a
determinant of FDI location (Smith and Florida,1994; Disdier and Mayer, 2004; Buch et al., 2005;
Pusterla and Resmini, 2007; Hilber and Voicu, 2010; Yavan, 2010). Due to the lack of regional data
availability in Indonesia, industry value added is used as a measure of industrialization.
Labor costs: Past literature on the effect of labor costs on FDI inflows provides conflicting results at
the regional or country level. Some studies, such as Friedman, et al. (1992) and Coughlin and Segev
(2000), observe that higher wages deter FDI inflows, while Smith and Florida (1994) and Cheng
(2006) find that higher labor costs attract more FDI inflows. Thus, the effect of labor costs on
location choice of FDI inflows might generally be unclear.
Unemployment rate: The availability of labor is generally measured by unemployment rate.
Similarly to the discussion about the relationship between labor costs and FDI inflows, a change in
the unemployment rate would have two opposite effects on FDI inflows. Hogenbirk and Narula
(2004) suggest that the high unemployment rate could reflect the low level of local demand and the
lack of suitable employees. In this case, the higher unemployment rate could deter FDI inflows, so
that the unemployment rate is negatively related to FDI inflows. On the other hand, Coughin and
Segev (2000) state that the high unemployment is also an indicator of labor availability, so that firms

Asian Journal of Empirical Research, 4(1)2014: 79-94
87
can hire workers at lower costs. Thus, the unemployment rate would be positively related to FDI
inflows.
Special economic zones: Many studies have shown some evidences supportive of the positive
impact of tax incentives, which is closely linked to special economic zones, on FDI inflows. For
example, Klemm and Parys (2009) find that lower corporate income tax rates and longer tax
holidays are effective in attracting FDI inflows. In addition, Leichbrecht and Riedl (2010) find that
effective corporate income rates are significant determinants of FDI inflows, and Morisset and Pirnia
(2000) state that tax incentives are effective in promoting FDI inflows. However, the cost of tax
incentives may outweigh the benefit associated with FDI inflows. Tax incentives are likely to entail
a negative direct effect on fiscal revenues and, more seriously, they frequently create significant
opportunities for illicit behavior by tax administrators and companies with corruption.
Results
To estimate the empirical model over the panel data, we first employ pooled ordinary least squares
(OLS) and random affects estimation methods for 30 provinces over the period from 2000 to
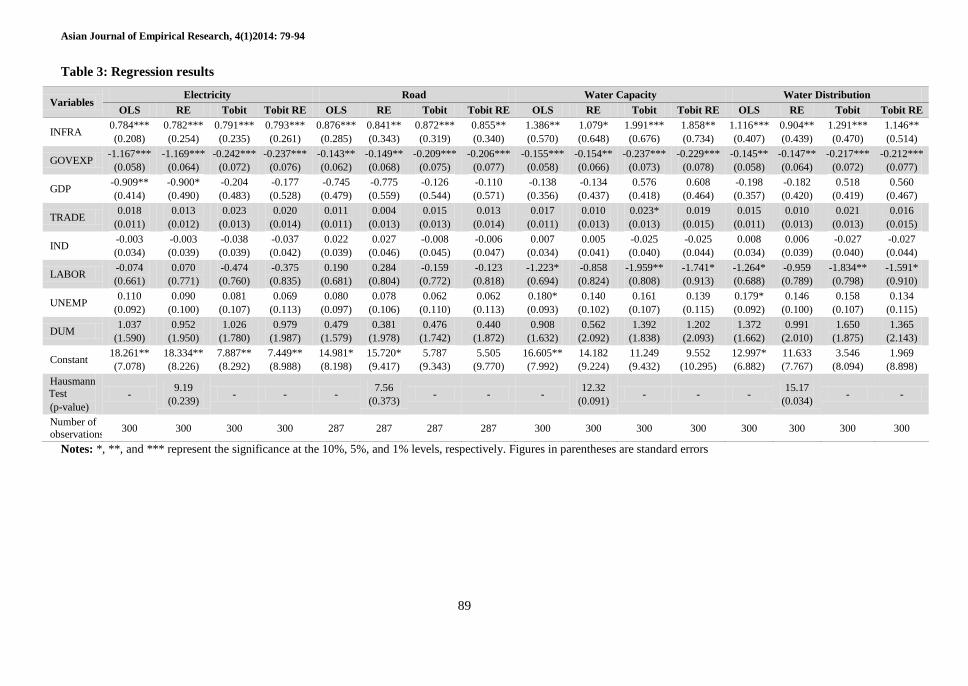
2009.6Table 2 shows the summary of statistics, and Table 3 presents the estimated results, which
includes those of OLS and random effects models since the statistics associated with Hausman
inference is less significant for all estimated model sat a 5% significance level, except water
distribution equation. In our data, some provinces have no FDI flows over a certain period. This kind
of zero FDI inflows is considered as a corner solution outcome in the context of economic theory,
where typical OLS and random effects estimation may not be appropriate. To mitigate this issue, we
estimate our empirical model by applying the standard censored Tobit model or type I Tobit model.
Table 3 also presents the estimated results of Tobit model and random effects Tobit model.
Table 2: Summary of statistics
Variable Observation Mean Std. Dev. Min Max
FDI 300 1.679 4.718 0.000 67.405
INFRA (electricity distribution) 300 -1.104 1.627 -4.622 4.125
INFRA (road length) 287 -1.185 1.170 -5.065 2.652
INFRA (water distribution) 300 -4.937 0.771 -11.848 -2.416
INFRA (water capacity) 300 -7.364 0.523 -8.687 -5.466
GOVEXP 300 13.956 7.753 1.284 49.086
GDP 300 17.025 1.315 14.203 19.733
TRADE 300 76.046 31.614 8.586 182.602
IND 300 16.448 11.446 1.502 52.639
LABOR 300 2.574 0.688 -0.109 4.554
UNEMP 300 8.479 3.502 1.445 19.681
DUM 300 0.033 0.180 0.000 1.000 Notes: Sample period is from 2000 to 2009. Data of load length is not available during 2000-2002 for Bangka
Belitung province, during 2000-2002 for Banten province, during 2000-2002 for Gorontalo province, and
during 2000-2003 for Maluku Utara province.
The results in Table 3 show that irrespective of empirical methods, the coefficients on all proxies to
infrastructure development are significantly positive for all models. The provinces with the higher
level of infrastructure are associated with more FDI inflows. These provide clear evidences
supporting that infrastructure development in terms of electricity distribution, road length, water
distribution, and water capacity, plays an important role in attracting FDI into Indonesian provinces.
6Nevertheless, this model involves an econometric problem. The issue comes from the potential endogeneity of
the explanatory variables.

Asian Journal of Empirical Research, 4(1)2014: 79-94
88
Our findings confirm the conventional wisdom in that the establishment of favorable hard
infrastructure could be a crucial condition for FDI inflows. This result has some important policy
implications about FDI location choice for the government attempting to attract foreign investment
under various decentralization policies.
Concerning the estimated results of other control variables, government expenditure as a proxy to
the size of the government generally has a significantly negative relationship with FDI inflows, as
shown in Deichman et al. (2003) and Mollick et al. (2006). The negative effect of government
expenditure on FDI inflows can be explained by the argument that public investment crowds out
private investment by diminishing the attractiveness of establishing business. Narrowness of a level
playing field for foreign firms may cause them to be reluctant to invest in the province.
The result also demonstrates that labor cost has a significantly negative relationship with FDI flows
for Tobit models in water capacity and water distribution equations, although the results are
insignificant or less clear in electricity and road equations. This is consistent with the finding of
Friedman et al. (1992) and Coughlin and Segev (2000) in that higher labor costs would deter FDI
inflows. Multinational firms would make the importance on labor costs when they decide the
location of foreign investment.
On the other hand, the coefficients on regional GDP, trade openness, the degree of industrialization,
the unemployment rate, and special economic zones are generally insignificant or less clear for all of
four infrastructure equations. The insignificance of the coefficients on regional GDP fail to support
the argument of horizontal FDI or market-oriented FDI, discussed in Shatz and Venables (2000), that
provinces with larger market demand attract more FDI inflows due to more business opportunities
for foreign firms. In addition, in contrast to the argument of several studies such as Yavan (2010),
the insignificant effect of industrialization shows that industrial agglomeration might neither attract
multinational firms nor enhance FDI inflows in Indonesia. Our empirical results from OLS, random
effects, Tobit, and Tobit random effects estimations generally fail to show clear evidence that these
variables influence the location choice of foreign investment.
Count data analysis
Depending on the properties of the data set, the empirical literature has applied a number of
techniques, such as OLS, logit models, Tobit models, Poisson models, and negative binomial models
(NBMs), to examine the determinants of FDI inflows. In the previous subsection, we have presented
clear results supporting that infrastructure development would help increase FDI inflows into
Indonesia by using the data of the ratio of FDI inflows to GDP at the provincial level as a dependent
variable. This subsection attempts to check the validity of the previous results by employing count
data models with the count data of FDI inflows, i.e., the number of FDI projects implemented in
each province during each period from 2000 to 2009. The data of the number of FDI projects is
taken from Investment Coordinating Board of Indonesia (BKPM).
Many studies on FDI location apply count data models (Smith and Florida, 1994; Wu, 1999;
Coughlin and Segev, 2000; List, 2001; Makabenta, 2002; Zhou et al., 2002; Roberto, 2004; Meyer
and Nguyen, 2005; Yavan, 2010). Since there is no FDI inflow in some provinces, the dependent
variable contains many zero counts and takes non-negative integer values. Given the fact, we apply
the Poisson models and NBMs as an alternative model for robustness check. As suggested in Greene
(2003), the preponderance of zeros and discrete nature of the dependent variable suggest that the
Poisson model appears to be suitable. In addition, Arauzo (2005) mentions that the Poisson model
could mitigate the zero problem, where the data of provinces with no FDI inflow contains relevant
information, since the independent variables of these provinces could help explain the reason why
they do not receive any FDI inflows.
Asian Journal of Empirical Research, 4(1)2014: 79-94
89
Table 3: Regression results
Variables Electricity Road Water Capacity Water Distribution
OLS RE Tobit Tobit RE OLS RE Tobit Tobit RE OLS RE Tobit Tobit RE OLS RE Tobit Tobit RE
INFRA 0.784***
(0.208)
0.782***
(0.254)
0.791***
(0.235)
0.793***
(0.261)
0.876***
(0.285)
0.841**
(0.343)
0.872***
(0.319)
0.855**
(0.340)
1.386**
(0.570)
1.079*
(0.648)
1.991***
(0.676)
1.858**
(0.734)
1.116***
(0.407)
0.904**
(0.439)
1.291***
(0.470)
1.146**
(0.514)
GOVEXP -1.167***
(0.058)
-1.169***
(0.064)
-0.242***
(0.072)
-0.237***
(0.076)
-0.143**
(0.062)
-0.149**
(0.068)
-0.209***
(0.075)
-0.206***
(0.077)
-0.155***
(0.058)
-0.154**
(0.066)
-0.237***
(0.073)
-0.229***
(0.078)
-0.145**
(0.058)
-0.147**
(0.064)
-0.217***
(0.072)
-0.212***
(0.077)
GDP -0.909**
(0.414)
-0.900*
(0.490)
-0.204
(0.483)
-0.177
(0.528)
-0.745
(0.479)
-0.775
(0.559)
-0.126
(0.544)
-0.110
(0.571)
-0.138
(0.356)
-0.134
(0.437)
0.576
(0.418)
0.608
(0.464)
-0.198
(0.357)
-0.182
(0.420)
0.518
(0.419)
0.560
(0.467)
TRADE 0.018
(0.011)
0.013
(0.012)
0.023
(0.013)
0.020
(0.014)
0.011
(0.011)
0.004
(0.013)
0.015
(0.013)
0.013
(0.014)
0.017
(0.011)
0.010
(0.013)
0.023*
(0.013)
0.019
(0.015)
0.015
(0.011)
0.010
(0.013)
0.021
(0.013)
0.016
(0.015)
IND -0.003
(0.034)
-0.003
(0.039)
-0.038
(0.039)
-0.037
(0.042)
0.022
(0.039)
0.027
(0.046)
-0.008
(0.045)
-0.006
(0.047)
0.007
(0.034)
0.005
(0.041)
-0.025
(0.040)
-0.025
(0.044)
0.008
(0.034)
0.006
(0.039)
-0.027
(0.040)
-0.027
(0.044)
LABOR -0.074
(0.661)
0.070
(0.771)
-0.474
(0.760)
-0.375
(0.835)
0.190
(0.681)
0.284
(0.804)
-0.159
(0.772)
-0.123
(0.818)
-1.223*
(0.694)
-0.858
(0.824)
-1.959**
(0.808)
-1.741*
(0.913)
-1.264*
(0.688)
-0.959
(0.789)
-1.834**
(0.798)
-1.591*
(0.910)
UNEMP 0.110
(0.092)
0.090
(0.100)
0.081
(0.107)
0.069
(0.113)
0.080
(0.097)
0.078
(0.106)
0.062
(0.110)
0.062
(0.113)
0.180*
(0.093)
0.140
(0.102)
0.161
(0.107)
0.139
(0.115)
0.179*
(0.092)
0.146
(0.100)
0.158
(0.107)
0.134
(0.115)
DUM 1.037
(1.590)
0.952
(1.950)
1.026
(1.780)
0.979
(1.987)
0.479
(1.579)
0.381
(1.978)
0.476
(1.742)
0.440
(1.872)
0.908
(1.632)
0.562
(2.092)
1.392
(1.838)
1.202
(2.093)
1.372
(1.662)
0.991
(2.010)
1.650
(1.875)
1.365
(2.143)
Constant 18.261**
(7.078)
18.334**
(8.226)
7.887**
(8.292)
7.449**
(8.988)
14.981*
(8.198)
15.720*
(9.417)
5.787
(9.343)
5.505
(9.770)
16.605**
(7.992)
14.182
(9.224)
11.249
(9.432)
9.552
(10.295)
12.997*
(6.882)
11.633
(7.767)
3.546
(8.094)
1.969
(8.898)
Hausmann
Test
(p-value)
- 9.19
(0.239) - - -
7.56
(0.373) - - -
12.32
(0.091) - - -
15.17
(0.034) - -
Number of
observations 300 300 300 300 287 287 287 287 300 300 300 300 300 300 300 300
Notes: *, **, and *** represent the significance at the 10%, 5%, and 1% levels, respectively. Figures in parentheses are standard errors

90
Poisson regression models assume that the number of FDI projects located in province i, , is
distributed according to a Poisson distribution with parameter related to the independent variables
vector describing the provincial characteristics. The likelihood of observing a count of FDI projects
is written by:
Parameter is assumed to be log-linearly dependent on the independent variables vector with
where is a parameter vector to be estimated. However, the assumed equality of the conditional mean
and variance can be considered the major shortcoming of the Poisson regression models. Among
many alternatives, the most common is the negative binomial models (NBMs). The NBM is an
extension of the Poisson regression model by introducing an individual, unobserved effect into the
conditional mean:
Where follows a gamma distribution, and the disturbance reflects either specification
error as in the classical regression model or cross-sectional heterogeneity that could characterize the
data.
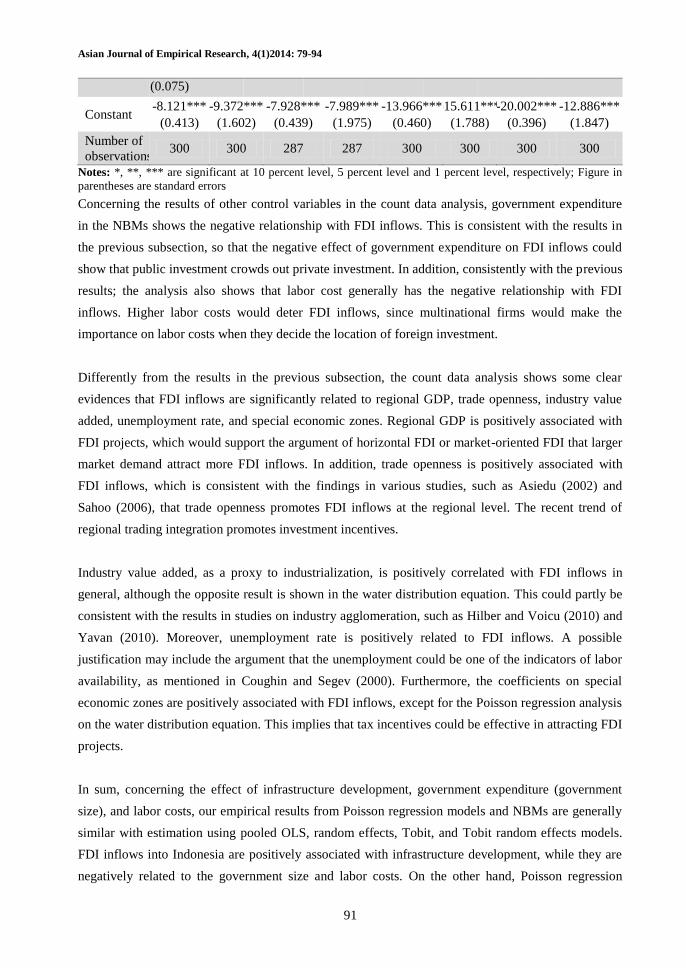
Table 4 shows the estimated results for the Poisson regression model and NBMs with the same
explanatory variables as the baseline models in the previous subsection. Similar to the previous
estimation results, the coefficients for all of infra structure development are statistically significant in
all count data models except for the Poisson regression model in the water capacity equation. The
count models also support that infrastructure development has the positive relationship with FDI
inflows into Indonesia, so that provinces with well-developed hard infrastructure would attract more
FDI projects.
Table 4: Poisson and NBM regression results
Variables ELECTRICITY ROAD
WATER
CAPACITY
WATER
DISTRIBUTION
Poisson NBM Poisson NBM Poisson NBM Poisson NBM
INFRA 0.493***
(0.013)
0.502***
(0.040)
0.664***
(0.017)
0.601***
(0.059)
0.621***
(0.032)
0.451***
(0.080)
0.072***
(0.020)
0.871***
(0.134)
GOVEXP -0.018***
(0.005)
-0.039***
(0.014)
-0.019***
(0.005)
-0.057***
(0.016)
-0.024***
(0.005)
-0.034**
(0.016)
-0.028***
(0.005)
-0.028*
(0.016)
GDP 0.561***
(0.022)
0.694***
(0.097)
0.529***
(0.024)
0.613***
(0.121)
1.112***
(0.019)
1.225***
(0.105)
1.267***
(0.018)
1.288***
(0.103)
TRADE 0.006***
(0.001)
0.016***
(0.002)
0.007***
(0.001)
0.016***
(0.003)
0.008***
(0.001)
0.017***
(0.003)
0.009***
(0.001)
0.017***
(0.003)
IND 0.033***
(0.002)
0.004
(0.007)
0.051***
(0.002)
0.025***
(0.010)
0.011***
(0.002)
-0.005
(0.009)
-0.011***
(0.002)
-0.000
(0.009)
LABOR -0.090**
(0.036)
-0.422***
(0.149)
0.018
(0.035)
-0.423**
(0.167)
-0.672***
(0.039)
-1.015***
(0.189)
-0.217***
(0.032)
-0.950***
(0.186)
UNEMP 0.013**
(0.005)
-0.000
(0.021)
0.012**
(0.005)
0.011
(0.024)
0.114***
(0.004)
0.051**
(0.025)
0.115***
(0.004)
0.057**
(0.025)
DUM 1.071**
*
1.287***
(0.304)
0.701***
(0.069)
0.931***
(0.324)
0.352***
(0.068)
1.761***
(0.589)
-0.228***
(0.063)
0.898**
(0.372)
Asian Journal of Empirical Research, 4(1)2014: 79-94
91
(0.075)
Constant -8.121***
(0.413)
-9.372***
(1.602)
-7.928***
(0.439)
-7.989***
(1.975)
-13.966***
(0.460)
-15.611***
(1.788)
-20.002***
(0.396)
-12.886***
(1.847)
Number of
observations 300 300 287 287 300 300 300 300
Notes: *, **, *** are significant at 10 percent level, 5 percent level and 1 percent level, respectively; Figure in
parentheses are standard errors
Concerning the results of other control variables in the count data analysis, government expenditure
in the NBMs shows the negative relationship with FDI inflows. This is consistent with the results in
the previous subsection, so that the negative effect of government expenditure on FDI inflows could
show that public investment crowds out private investment. In addition, consistently with the previous
results; the analysis also shows that labor cost generally has the negative relationship with FDI
inflows. Higher labor costs would deter FDI inflows, since multinational firms would make the
importance on labor costs when they decide the location of foreign investment.
Differently from the results in the previous subsection, the count data analysis shows some clear
evidences that FDI inflows are significantly related to regional GDP, trade openness, industry value
added, unemployment rate, and special economic zones. Regional GDP is positively associated with
FDI projects, which would support the argument of horizontal FDI or market-oriented FDI that larger
market demand attract more FDI inflows. In addition, trade openness is positively associated with
FDI inflows, which is consistent with the findings in various studies, such as Asiedu (2002) and
Sahoo (2006), that trade openness promotes FDI inflows at the regional level. The recent trend of
regional trading integration promotes investment incentives.
Industry value added, as a proxy to industrialization, is positively correlated with FDI inflows in
general, although the opposite result is shown in the water distribution equation. This could partly be
consistent with the results in studies on industry agglomeration, such as Hilber and Voicu (2010) and
Yavan (2010). Moreover, unemployment rate is positively related to FDI inflows. A possible
justification may include the argument that the unemployment could be one of the indicators of labor
availability, as mentioned in Coughin and Segev (2000). Furthermore, the coefficients on special
economic zones are positively associated with FDI inflows, except for the Poisson regression analysis
on the water distribution equation. This implies that tax incentives could be effective in attracting FDI
projects.
In sum, concerning the effect of infrastructure development, government expenditure (government
size), and labor costs, our empirical results from Poisson regression models and NBMs are generally
similar with estimation using pooled OLS, random effects, Tobit, and Tobit random effects models.
FDI inflows into Indonesia are positively associated with infrastructure development, while they are
negatively related to the government size and labor costs. On the other hand, Poisson regression

Asian Journal of Empirical Research, 4(1)2014: 79-94
92
models and NBMs generally present the results of the effects of regional GDP, trade openness,
industry value added (industrialization), and special economic zones on FDI inflows, although non-
count models fail to show clear evidences.
Conclusion
This paper has investigated how infrastructure development affects the location choice of foreign
investment or FDI inflows in Indonesia by using panel data of 30 provinces over the period of 2000-
2009. As proxies to infrastructure development, we used electricity, road length, water capacity, and
water distribution. Our empirical analysis showed that infrastructure development would help
enhance FDI inflows at the province level. This study also presented that regional government
expenditure as a proxy to the size of the government is negatively related to FDI inflows, and the
labor cost is also negatively related to FDI inflows. In addition, these results can generally be
supported by the count data analysis, such as Poisson regression models and NBMs.
Our results have some important implications about public policy that aims at attracting foreign
investment in several specific provinces in Indonesia. Since establishing hard infrastructure is
required to enhance FDI inflows, the government should pay more attention to infrastructure
development and its quality for foreign firms. Moreover, since the large size of government
expenditure causes FDI inflows to decline due to the crowd-out effect, the government should restrict
its intervention and promote private investment as well as private economic activities. These results
should be taken into account under on-going institutional and regulatory reforms toward effective
decentralization in Indonesia.
Our study has several limitations in terms of data and methodology. Similar to other developing
countries, we have some difficulty in obtaining province level data. The lack of data prevented us
from carrying out comprehensive econometric analysis. In addition, it should be noted that our
empirical models would suffer from the typical endogeneity problem related to FDI inflows and
infrastructure development. Although we admit these issues, we believe that our empirical study
would provide important policy implications of regional FDI allocation to contribute a lot to regional
development in Indonesia.
References
Alfaro, L., Chanda, A., Kalemli-Ozcan, S., & Sayek, S. (2004). FDI and economic growth: The role
of local financial markets. Journal of International Economics, 64, 89-112.
Arauzo, J. M. (2005). Determinants of industrial location: An application for Catalan municipalities.
Papers in Regional Science, 84, 105-120.

Asian Journal of Empirical Research, 4(1)2014: 79-94
93
Asiedu, E. (2002). On the determinants of foreign direct investment to developing countries: Is Africa
different? World Development, 30, 107-118.
Bellak, C., Leibrecht, M., & Damijan, J. (2009). Infrastructure endowment and corporate income
taxes as determinants of foreign direct investment in Central and Eastern European countries.
World Economy, 32, 267-290.
Boudier-Bensebaa, F. (2005). Agglomeration economies and location choice: Foreign direct
investment in Hungary. Economics of Transition, 13, 605–628.
Broadman, H. G., & Sun, X. (1997). The distribution of foreign direct investment in China. World
Economy, 20, 339–361.
Buch, C. M., Kleinert, J., Lipponer, A., Toubal, F., Markusen, J. R., & Midelfart, K. H. (2005).
Determinants and effects of foreign direct investment: Evidence from German firm-level data.
Economic Policy, 20, 53-110.
Cheng, L. K., & Kwan, Y. K. (2000). What are the determinants of the location of foreign direct
investment? The Chinese experience. Journal of International Economic, 51, 379-400.
Cheng, S. (2006). The role of labor cost in the location choices of Japanese investors in China. Papers
in Regional Science, 85, 121–138.
Cole, D. C., & Slade, B. F. (1996). Building a modern financial system: The Indonesian experience.
Cambridge university press.
Coughin, C. C., & Segev, E. (2000). Location determinants of new foreign-owned manufacturing
plants. Journal of Regional Science, 40, 323-351.
Coughlin, C. C., Terza, J. & Arromdee, V. (1991). State characteristics and the location of foreign
direct investment within the United States. Review of Economics and Statistics, 73, 675-683.
Deichman, J., Karidis, S., & Sayek, S. (2003). Foreign direct investment in Turkey: Regional
determinants. Applied Economics, 35, 1767-1778.
Disdier, A. C., & Mayer, T. (2004). How different is eastern Europe? Structure and determinants of
location choices by French firms in Eastern and Western Europe. Journal of Comparative
Economics, 32, 280–296.
Fane, G., (2003). Change and continuity in Indonesia's new fiscal decentralization arrangements.
Bulletin of Indonesian Economic Studies, 39, 159-176.
Friedman, J., Gerlowski, D. A., & Silberman, J. (1992). What attracts foreign multinational
corporations? Evidence from branch plant location in the United States. Journal of Regional
Science, 32, 403-418.
Fung, K. C., Garcia-Herrero, A., IIzaka, H., & Siu, A. (2005). Hard or soft? institutional reforms and
infrastructure spending as determinants of foreign direct investment. Japanese Economic
Review, 56, 408-416.
Greene, W. H. (2003). Econometric analysis. 5th edition. New Jersey: Prentice-Hall.
Head, K., & Ries, J. (1996). Inter-city competition for foreign investment: State and dynamic effects
of China’s incentive areas. Journal of Urban Economics, 40, 38-60.
Hilber, C. A. L., & Voicu, I. (2010). Agglomeration economies and the location of foreign direct
investment: Empirical evidence from Romania. Regional Studies, 44, 355-371.
Hogenbirk, A., & Narula, R. (2004). Location and agglomeration of FDI in the Netherlands:
Implications for policy. MERIT-Infonomics Research Memorandum Series No. 2004-006.
Iman, M. S., & Nagata, A., (2005). Liberalization policy over foreign direct investment and the
promotion of local firms development in Indonesia. Technology in Society, 27, 399-411.
Klemm, A., & Parys, S. V. (2009). Empirical evidence on the effects of tax incentives. IMF Working
Paper WP/09/136.
Levinsohn, J., Berry, S., & Friedman, J. (1999). Impacts of the Indonesian economic crisis: Price
changes and the poor. NBER Working Paper Series 1794.
Li, S., & Park, S. H. (2006). Determinants of locations of foreign direct investment in China.
Management and Organization Review, 2, 95-119.
Lipsey, R. E., & Sjoholm, F. (2011). FDI and growth in East Asia: Lessons for Indonesia. Bulletin of
Indonesian Economic Studies, 47, 35-63.

Asian Journal of Empirical Research, 4(1)2014: 79-94
94
List, J. A. (2001). US county-level determinants of inbound FDI: Evidence from a two-step modified
count data model. International Journal of Industrial Organization, 19, 953-973.
Makabenta, M. P. (2002). FDI location and special economic zones in the Philippines. Review of
Urban and Regional Development Studies, 14, 59–77.
Meyer, K., & Nguyen, H. V. (2005). Foreign investment strategies and sub-national institutions in
emerging markets: Evidence from Vietnam. Journal of Management Studies, 42(1), 63-93.
McCann, P., & Mudambi, R. (2004). The location behavior of the multinational enterprise: Some
analytical issues. Growth and Change, 35, 491-524.
Mollick, A. V., Ramos-Duran, R., & Silva-Ochoa, E. (2006). Infrastructure and FDI into Mexico: A
panel data approach. Global Economy Journal, 6(1), 1-27.
Morisset, J., & Pirnia, N. (2000). How tax policy and incentives affect foreign direct investment: A
review. Policy Research Working Paper 2509, World Bank.
Osada, H. (1994). Trade liberalization and FDI incentives in Indonesia: The impact on industrial
productivity, Developing Economies, 32, 479-491.
Pusterla, F., & Resmini, L. (2007). Where do foreign firms locate in transition countries? An
empirical investigation. Annals of Regional Science, 41, 835-856.
Roberto, B. (2004). Acquisition versus Greenfield investment: the location of foreign manufacturers
in Italy. Regional Science and Urban Economics, 34, 3-25.
Sahoo, P. (2006). Foreign direct investment in South Asia: Policy, trends, impact and determinants.
ADB Institute Discussion Paper No. 56.
Shatz, H. J., & Venables, A. J. (2000). The geography of international investment. Policy Research
Working Paper 2338, The World Bank.
Silver, C., Azis, I. J., & Schroeder, L., (2001). Intergovernmental transfers and decentralisation in
Indonesia. Bulletin of Indonesian Economic Studies, 37, 345-362.
Sjoholm, F. (2002). The challenge of combining FDI and regional development in Indonesia. Journal
of Contemporary Asia, 32, 381-393.
Smith, D. F., & Florida, R. (1994). Agglomeration and industrial location: An econometric analysis of
Japanese affiliated manufacturing establishments in automotive-related industries. Journal of
Urban Economics, 36, 23-41.
Takii, S. (2005). Productivity spillovers and characteristics of foreign multinational plants in
Indonesian manufacturing, 1990-1995. Journal of Development Economics, 76, 521-542.
Takii, S. (2011). Do FDI spillovers vary among home economies? Evidence from Indonesian
manufacturing, Journal of Asian Economics, 22, 152-163.
Wei, Y., Liu, X., Parker, D., & Vaidya, K. (1999). The regional distribution of foreign direct
investment in China. Regional Studies, 33, 857–867.
Wheeler, D., & Mody, A. (1992). International investment location decisions: The case of U.S. firms.
Journal of International Economics, 33, 57-76.
Wu, F. (1999). Intra-metropolitan FDI firm in guangzhou, China: A poisson and negative binomial
analysis. Annals of Regional Science, 33, 535–555.
Yavan, N. (2010). The location choice of foreign direct investment within Turkey: An empirical
analysis. European Planning Studies, 18, 1675-1705.
Zhou, C., Delios, A., & Yang, J. Y. (2002). Locational determinants of Japanese foreign direct
investment in China. Asia Pacific Journal of Management, 19, 63-86.