Asian Journal of Empirical Researchaessweb.com/pdf-files/6-19-3(10)2013-AJER-1310-1330.pdfAsian...
21
. 1300 EFFICIENCY OF FOOD SECTOR OF PAKISTAN – A DEA ANALYSIS Muhammad AFZAL 1 Maryam AYAZ 2 ABSTRACT We used DEA to examine the efficiency of the food sector of Pakistan for the period 2007-2010. The year-wise technical efficiency scores show that the performance of the food producing companies improved over the past four years. The overall efficiency analysis suggests that the industry level technical efficiency scores ranged between 0.5 and 0.8 in the year 2007 which increased to 0.9 in the year 2010. The food industry is most efficient (90.7%) in the year 2010 when the technical efficiency score assuming VRS with output orientation was considered. In the second stage analysis based on OLS, the Model IV was found to be the most feasible one in which the size, age and labor to capital ratio and dummy have significant impact on the technical efficiency. Performance of food sector of Pakistan will improve significantly if modern technology in food production and processing is used that is likely to promote exports. Keywords: Food sector, DEA, Technical efficiency, Determinants, Pakistan INTRODUCTION After air food is the most basic need of human being to keep the body and soul together. Fixed supply of land acts as the binding constraint to raise the production of food in order to cater to the growing needs of the population. Malthus predicted a dismal future of the humanity because the population growth outstrips the production of food that brings misery to the mankind. Technological discoveries increased the food production but gave rise to health hazards due to increasing use of fertilizers, pesticides and insecticides with a view to increase the crops yield. Urbanization and industrialization increased vigorously after the Second World War which also 1 Professor; Department of Management Sciences Preston University Islamabad 44000, Pakistan 2 MS Scholar; COMSATS Institute of Information Technology, Islamabad, Pakistan This work is supported by Higher Education of Pakistan Indigenous Scholarship (PIN NO. 085-12164-Be5- 153). Asian Journal of Empirical Research journal homepage: http://aessweb.com/journal-detail.php?id=5004
Transcript of Asian Journal of Empirical Researchaessweb.com/pdf-files/6-19-3(10)2013-AJER-1310-1330.pdfAsian...
.
1300
EFFICIENCY OF FOOD SECTOR OF PAKISTAN – A DEA ANALYSIS
Muhammad AFZAL1
Maryam AYAZ2
ABSTRACT
We used DEA to examine the efficiency of the food sector of Pakistan for the period 2007-2010.
The year-wise technical efficiency scores show that the performance of the food producing
companies improved over the past four years. The overall efficiency analysis suggests that the
industry level technical efficiency scores ranged between 0.5 and 0.8 in the year 2007 which
increased to 0.9 in the year 2010. The food industry is most efficient (90.7%) in the year 2010
when the technical efficiency score assuming VRS with output orientation was considered. In the
second stage analysis based on OLS, the Model IV was found to be the most feasible one in which
the size, age and labor to capital ratio and dummy have significant impact on the technical
efficiency. Performance of food sector of Pakistan will improve significantly if modern technology
in food production and processing is used that is likely to promote exports.
Keywords: Food sector, DEA, Technical efficiency, Determinants, Pakistan
INTRODUCTION
After air food is the most basic need of human being to keep the body and soul together. Fixed
supply of land acts as the binding constraint to raise the production of food in order to cater to the
growing needs of the population. Malthus predicted a dismal future of the humanity because the
population growth outstrips the production of food that brings misery to the mankind.
Technological discoveries increased the food production but gave rise to health hazards due to
increasing use of fertilizers, pesticides and insecticides with a view to increase the crops yield.
Urbanization and industrialization increased vigorously after the Second World War which also
1 Professor; Department of Management Sciences Preston University Islamabad 44000, Pakistan
2 MS Scholar; COMSATS Institute of Information Technology, Islamabad, Pakistan
This work is supported by Higher Education of Pakistan Indigenous Scholarship (PIN NO. 085-12164-Be5-
153).
Asian Journal of Empirical Research
journal homepage: http://aessweb.com/journal-detail.php?id=5004
Asian Journal of Empirical Research, 3(10)2013: 1310-1330
1311
affected the agricultural sector. The rising level of urbanization increased the rural-urban
migration. The massive migration required the increased supply of water, transport, health and
education facilities besides food. Agriculture also became an industry to meet the mounting needs
of the population. Many agro-based industries like textile, sugar, fertilizers, and flour mills were
set up that had multi-faceted effects. The industries used various agricultural inputs as
intermediate goods to produce the final products like garments, sweets, biscuits, cakes, cold
drinks and many others. In addition to agro-based industries, many other different kinds of
industries were also established. The increased industrialization has boosted the demand for eggs
and poultry which besides being used as the final products, are also used as raw material (input)
for various products like bakery products. Poultry, eggs and chicken are not free from the health
hazards. Especially the hormones fed chicken pose many serious problems for the humanity
especially the females.
Being an agricultural country, the food sector of Pakistan largely depends on the agricultural
yield. The raw material comes from the seasonal crops which are processed properly. A large
number of multinational companies have invested in the food sector utilizing the potential and the
fertile resources of the country. The most noticeable groups are Bawany, Crescent, Habib, Fecto,
Premier, Lakson, Burma Oil Brooke Bond, Clover Foods, Lever Brothers, Nestle and National
Foods. Unlike developed countries the food processing usually involves the traditional
procedures. In most of the developing countries, the food crops are harvested and the traditional
processes of cooking are used to make them ready for eating.
The food and its allied products industry is considered Pakistan's largest industry and is believed
to account for 27% of its value-added production, and 16% of the total employment by the
manufacturing sector. It is estimated that in Pakistan there are 80,000 small businesses and more
than 2 million micro-enterprises, many of which are food manufacturers. SMEs (small and
medium enterprises) and micro-enterprises are located in rural areas and fall into the category of
food processors, depending heavily on agricultural raw materials and poorly skilled non-farm
labor. Due to lack of education and technological advancement, the standards of hygiene are not
maintained by these small businesses. However, these come under the category of food
manufacturers and processors. The types of crops grown in Pakistan can be categorized into
commodity crops (wheat, rice), industrial crops (sugarcane, oilseeds) and the horticulture crops.
The livestock is another type of raw material used in the food production besides agricultural
crops. Oilseed being an industrial crop is used both as an additive as well as a final product.
Despite considerable yield of oilseed, Pakistan could not become self-sufficient in vegetable oil.
Horticulture crops are also important because the climate of the country is favorable for the
production of a variety of fruits and vegetables. The main fruits which contribute towards the
economy of the country are mango and oranges. Various varieties of oranges are grown in Punjab.
Asian Journal of Empirical Research, 3(10)2013: 1310-1330
1312
Sargodha is known for the production of kino. Mango is the second largest produced fruit of
Pakistan. Both fruits are extensively being used in the manufacturing of juices and beverages. As
far as vegetables are concerned, potatoes are the most notable one. The limited supply of
horticulture crops for the production and processing of food in Pakistan is attributed to various
factors which include old practices of cultivation, lack of modern technology and poor pest
management.
Yet another element of food processing in Pakistan is the use of livestock. There are 30.8 million
buffalo, 34.3 million cattle, 59.9 million goat and 27.8 million sheep in Pakistan which accounts
for the better availability of milk and eggs. The poultry business is well established in the country
since chicken is used both as an ingredient as well as the final product. Animal husbandry is a
relatively less expensive business in the country. The food and allied industries are developing in
Pakistan. The agricultural sector contributes 21 percent towards GDP employing the 45 percent of
the total population. Almost 62 percent of population of the country resides in rural areas and is
associated with farming (Government of Pakistan (GOP) 2009-10). There are over 50 food
producing companies listed on the Karachi Stock Exchange (KSE) of Pakistan. The food
processing sector of Pakistan mainly consists of the grain and flour mills, hydrogenated vegetable
oil, dairy plants, fruit juice units, beverage bottling plants, snack foods, confectionery units and
tea blending plants. In addition, there are some small vegetable dehydration, spice and salt
packaging, and cereal facilities. The meat and vegetable processing industry is not well
developed.
Food industry problems
1. Rise in energy prices and acute shortage of supply, alarming law and order situation,
precarious economic situation, labor unrest due to rampant inflation are the common
problems faced by the industry in Pakistan. However, food sector faces many peculiar
problems .Traditional processes of production, little use of the latest technology, delayed
production processes, low quality of the processed food items and infrastructure are the
prominent food sector problems. Consequently the food industry is labor-intensive that is
not highly skilled and receives low wage culminating in low productivity.
2. The supply chain management is another factor that adversely affects the efficiency of
the food producers in Pakistan. Farmer plays a primary role in the whole supply chain
right from the time of harvest till the food reaches the consumer after processing. But it
is clearly observed that there is a big gap between the two most important players __
farmers and the consumers which frustrates the realization of the objectives of the whole
process. Farmers lack the information that helps them in assessing the demand of the
market while the consumers always want the quality for which they are paying. The
Asian Journal of Empirical Research, 3(10)2013: 1310-1330
1313
performance of the food producers, being the intermediate players, suffers at the end of
the day due to the lack of integration along the supply chain.
3. Proper marketing strategies may have positively contributed towards the performance of
food producers. The implementation of marketing techniques has not been done.
Consequently the quality food cannot be produced.
4. Food industry receives step-motherly treatment from the financial institutions and
commercial banks. The industry is not facilitated with a timely and low-cost credit that
certainly affects the production potential and quality of the products.
5. The financial institutions and banks are reluctant to understand the precarious position of
a food producer. The production of food primarily depends on the natural environment
and the food processors have to suffer if the yield is not up to the mark due to lack of
rainfall. In such situation, the banks do not extend the credit limit even for a limited
period of time. The performance of the food processing companies gets adversely
affected by this practice.
6. Consequently the food sector on the whole experiences the worst situation. The export of
Pakistani fish and seafood to the European Union countries was banned on account of
allegation of producing the unhygienic products. Similarly other non-tariff barriers
significantly affect the efficiency of the food sector.
7. The mindset and buying practices of consumers also play an important role. Because of
financial instability and poverty, consumers do not want to spend more on the food
products. They demand high quality food at low prices which exposes the food
producing firm to an awkward situation. Consequently, the quality is sacrificed and the
substandard food is offered to the consumer at a much lower price. Lack of government
support aggravates the situation.
Efficiency
Efficiency refers to the optimum utilization of inputs and production of maximum possible
output. There are different types of efficiencies (technical, cost, allocative, and scale) which have
been identified, explained and measured by using various techniques. A firm is said to be
technically efficient if it produces a given amount of output by using the minimum inputs while
cost efficiency is the ratio between the minimum cost at which it is possible to attain a given
volume of production and the cost actually incurred. The allocative efficiency is equal to the ratio
of the cost efficiency to the technical efficiency as discussed in a study on European banks
(Maudos et. al., 1999).
Efficiency measurement is one of the dimensions of the modern world. Various industries have
been evaluated so as to identify the loopholes. Despite extensive research on the manufacturing
and banking sectors of Pakistan, there is no study on the food industry of Pakistan for

Asian Journal of Empirical Research, 3(10)2013: 1310-1330
1314
performance evaluation. This study aims at filling the gap in the literature by considering the food
producing companies of Pakistan. Most of the studies have concentrated on the financial sector
like banking and insurance for the efficiency measurement. Although there are some studies on
the manufacturing sector of Pakistan but none of these to the best of our knowledge has examined
the efficiency of the food producers of Pakistan. The main objective of the study is to evaluate the
technical and scale efficiency of food producing companies listed on the Karachi Stock Exchange
(KSE) for the period 2007 - 2010. We use DEA (Data Envelopment Analysis) to achieve the
objective. Furthermore, the study also aims at identifying the determinants of technical efficiency
of food sector of Pakistan. This study is the pioneering one to evaluate the efficiency of the food
sector of Pakistan using the DEA.
REVIEW OF STUDIES
A number of studies have been done on the efficiency and its various forms. An important aspect
of these studies is their concentration on the banking sector using DEA and SFA (Stochastic
Frontier Analysis). Very few studies have been done on the manufacturing sector particularly
food industry. Banker and Morey (1986) evaluated the efficiency of the restaurant networks
considering the relative nature of the DEA when the input and output variables are not under the
control of the managers. Banker and Thrall (1990) study contributed to the literature by
developing a linkage between the various returns to scale with the most efficient scale size
especially where there are multiple inputs and outputs used. Gregorian and Manole (2002)
calculated an appropriate measure of commercial bank efficiency in a multiple-input/output
framework and evaluated the effects of policy framework on the performance of commercial
banks in seventeen transition countries for the period 1995-1998. The inputs used were the labor,
fixed assets and interest expenditure while they considered two sets of outputs. First set consisted
of revenues, net loans and liquid assets whereas the second set comprised deposits, net loans and
liquid assets. Countries that produced the best outcome in terms of a revenue-based index (DEA-
l) were Czech Republic (1995, 1998), Slovak Republic (1996), and Croatia (1997). The list of
service-based index (DEA-2), winners consisted of Czech Republic (1995), Slovenia (1996,
1998), and Latvia (1997). It was found that the rules and regulations regarding banking
operations, ownership structure and consolidation are the critical factors that affect the efficiency
scores of the banking sector.
Mahdevan (2002) studied the Malaysian manufacturing sector taking into account 28 sub-sectors
for the evaluation of productivity growth performance and Malmquist Index to calculate the total
productivity growth. The change in technical and scale efficiencies was also studied as an
outcome of the productivity growth of the industry. The results showed that the Malaysian
manufacturing industry had a low productivity growth leading to a negative effect on the

Asian Journal of Empirical Research, 3(10)2013: 1310-1330
1315
technical and scale efficiency change. Mahmood et. al., (2002) used SFA to analyze the large-
scale manufacturing sector of Pakistan for 1995-96 and 2000-01. They considered the
contribution towards GDP as an output while the inputs were taken to be capital, labor, industrial
cost and non-industrial cost. The sample of the study analyzed the data of all the important
manufacturing sectors (tobacco, petroleum, food, drugs, iron and steel). They conclude that some
sectors are technically efficient.
Zahid et. al., (1992) examined seventeen industry groups in order to analyze the technical change
and efficiency in Pakistan for the period 1960-1986. It was concluded that in the long-term, the
capital production techniques can be replaced by the labor-intense approach. The results show
that various industries of Pakistan (sugar, rubber products, textiles, fertilizers and non-ferrous
metals) reveal constant returns to scale while the remaining industries represent the decreasing
returns to scale. Using DEA, Mukherjee and Ray (2004) studied the effect of reforms on the
efficiency of the firms in different states of India for the periods 1986-87 and 1999-2000. The
inputs used for the analysis included production workers, non-production workers, capital, fuels,
and materials while the gross-value of manufacturing production in a state was taken as the sole
output. The study did not identify any effect of the reforms on the efficiency of the manufacturing
sector. Burki and Khan (2005) studied the impact of allocative inefficiency on the resource
allocation in manufacturing industry of Pakistan for the period 1969- 91 and concluded that the
allocative inefficiency had a negative effect on the allocation of resources. The results confirm
that the strict regulatory regime is one of the factors leading to the high allocative inefficiency.
Halkos and Tzeremes (2010) studied the twenty three manufacturing industries of Greek
including food and used DEA, the ratio analysis and Bootstrapping technique in order to evaluate
the sensitivity of their data. The used, total assets, total equity and the distribution costs as the
input variables and the ratios of net profit, return on equity and return on assets as the output
variables. The results show that the efficiency scores considerably improved after application of
Bootstrapping technique. Gopinath et. al., (1996) conducted a unique study on the food sector of
USA in which the efficiency gains from the agriculture and the food processing were inter-related
in a different manner. They maintain that the efficiency gains from the agriculture are more
important than those by the processing of food materials. Jayanthi et al., (1996) analyzed the
efficiency of 20 manufacturing plants used in the food processing sector of USA. The results
suggest that the small sized food processing units are competitive while for the plant
infrastructure it was concluded that the competitiveness depends on the factors like equipment
maintenance, quality management programs, packaging supplies inventory, workforce training
and product variety.

Asian Journal of Empirical Research, 3(10)2013: 1310-1330
1316
Hamilton and Sunding (1997) suggested that the increasing trend towards the food processing is
inversely proportional to the market power. This implies that when the farm supply curve shifts
outwards, the decrease in the market power causes the increased focus on the food processing.
Fontana and Wobst (2001) studied the impact of macro policies on the food sector in Bangladesh
in the backdrop of trade liberalization in the early 1990s and the depreciation of the local
currency. The results suggest that the impact of the policies on the average households is different
depending on whether it is headed by a woman or a man. Using DEA for the period 1997-1999,
Palomares (2002) investigated the efficiency and productivity change in the food distribution
industry of Spain. They used SFA along with the output-oriented DEA model for the
measurement of efficiency. A multi-stage DEA was also applied to study the role of inefficient
units in the sample. A total of 22 food distribution units were considered and their data were
analyzed for the measurement of scale, technical and pure technical efficiency of the sector. It
was concluded that there is a margin of improvement in the sales efficiency as far as the technical
and pure technical efficiencies are concerned. Using DEA, Chapelle and Plane (2002) analyzed
the technical efficiency of the Ivorian manufacturing sectors including the textile and garment,
metal products, wood and furniture, food processing. The results showed that the managerial
performance is higher in the small and informal companies.
Abedullah et. al., (2007) analyzed the rice production of Punjab province of Pakistan with special
reference to future investment in the country. The technical efficiency of the farmers of Punjab
was evaluated using the SFA. It was revealed that more investment in machinery used in farming
could boost the technical efficiency scores of the farmers and that the low inefficiency score
implies that there is a possibility of improvement in the efficiency scores. Bayyurt and Duzu
(2008) carried out a comparative analysis of the manufacturing firms of Turkey and China. They
employed the DEA technique in order to have a comparative data for the two countries. It was
concluded that Chinese manufacturing industry is a way ahead of the Turkish manufacturing
industry as far as the efficiencies of the firms are concerned. Wilkinson (2004) conducted a
descriptive study reviewing the literature on the factors of export earnings, dietary issues and
domestic restructuring of the food processing companies in the developed countries.
Kumar and Basu (2008) studied the impact of technological change and technical efficiency
change on the scale efficiency of food processing industry in India for the periods 1998-99 and
2004-05. It is found that the industry is not utilizing its agricultural resources up to the optimal
level due to which the food processing sector of India is not working efficiently. Lopez (2008)
studied the Canadian food processing sector. The results suggest that the market was very
sensitive to the change in prices and reported that labor and energy are more elastic inputs and
raw food materials and capital do not respond as much to a change in the market prices.
Asian Journal of Empirical Research, 3(10)2013: 1310-1330
1317
Tektas and Tosun (2010) used DEA analysis and considered the supply chain costs, inventory
costs and employee strength as the inputs while the profits, revenues and the exports were taken
as the outputs for efficiency analysis of food and beverages sector in Turkey. They also observed
the impact of volume of exports on the supply chain efficiency of the food and beverage sector of
Turkey. The results confirmed that there is a positive relationship between the exports and the
supply chain efficiency. Mohamad and Said (2010) considered the Malaysian food manufacturing
sector and evaluated the companies for the period 2002- 2007. DEA is used to compute and
analyze the decomposition of Malmquist index TFP into technological change, technical
efficiency change and scale efficiency change by utilizing an output-oriented DEA model under
the assumptions of constant and variable returns to scale.
METHODOLOGY AND DATA
DEA is a methodology that measures the relative performance and efficiency of multiple decision
making units (DMUs) when the production process presents a difficult structure of multiple inputs
and outputs. DEA effectively estimates the frontier by finding a set of linear segments that binds
or envelops the observed data. The DEA is a linear programming based technique for measuring
the relative efficiency and management performance of firms where presence of multiple inputs
and outputs makes comparison difficult (Banker and Morey 1986).
The definition of a DMU is generic and flexible. DEA has been used extensively in evaluating the
performances of many different kinds of entities like hospitals, universities, cities, business firms,
banks, regions etc since it is based on very few assumptions. Charnes, Cooper and Rhodes
(1978) proposed a model that had an input-orientation and assumed constant returns to
scale (CRS). Later studies have considered alternative sets of assumptions. Banker, Charnes and
Cooper (1984) first introduced the assumption of variable returns to scale (VRS). The CRS
assumption is only appropriate when all DMUs are operating at an optimal scale. However,
factors like imperfect competition and constraints on finance may cause a DMU not to be
operating at optimal scale. Consequently the use of the CRS specification when some DMUs
are not operating at optimal scale will result in measures of technical efficiency which
are mystified by scale efficiencies. The VRS specification has been the most commonly used
specification in the 1990s (Coelli 1998).
The literature shows that different studies have used various models of DEA to analyze
efficiency. However, these models are either input-oriented or output-oriented. When the linear
programming model is modified such that the inputs used by a firm are reduced to the maximum
level to achieve the same required quantity of outputs, it takes the form of input-oriented DEA.
Asian Journal of Empirical Research, 3(10)2013: 1310-1330
1318
There is evidence that the model can be used in the capacity estimation but that is rare. Mostly it
has been employed in studying the efficiency of the firms.
Suppose there are n DMUs who use m inputs and produce s outputs. The quantities of the outputs
may be different for each DMU. More precisely the DMUj uses an m-dimensional input vector xij
(i= 1, 2…m) to produce an s-dimensional output vector yrj (r=1, 2…s). A particular DMU is
represented by DMU0 and rest is denoted by DMUj. In the ratio form, the ratio of weighted sum of
outputs to weighted sum of inputs is used to measure the relative efficiency. For each DMU
following optimization problem is formed (Pyu 1992):
Max ∑r ur yr0/∑i vixi0 (1)
Subject to the constraint
∑r ur yrj /∑i vi xij ≤ 1 ur ≥ 0 vi ≥ 0
Where i= 1, 2…m, r=1, 2…s; j = 1, 2… n
Both output weight (ur) and inputs weight (vi) are required to be non-negative.
In Charnes, Cooper, and Rhodes (1978) model the reduction of the multiple-output /multiple-
input situation is reduced (for each DMU) to that of a single virtual output (∑r ur yrj ) and virtual
input (/∑i vi xij) .
This ratio which is to be maximized forms the objective function in mathematical programming
language for the particular DMU being evaluated. This ratio is non-linear and can be transformed
to a linear form as given below:
Max ∑r ur yrj (2)
subject to vi xij = 1
∑r ur yrj - vi xij ≤ 0
ur ≥ 0 vi ≥ 0
Data
In the DEA variables are termed as the outputs and inputs. Literature shows that diverse inputs
and outputs have been used by the studies. This study considers the capital, salaries, materials and
energy as the inputs while net sales is taken to be the output variable. The cost of capital was
calculated considering the depreciation and interest costs while the net sales were deflated using
the GDP deflator for each year. The choice of these variables was made on the basis of the fact
that being the neo-classical technique the DEA considers only the variable inputs. Since the
measure of efficiency can be best expressed in terms of sales of the firm, it was considered as the
output. The relevant data from annual reports of 22 food producing companies were gathered
from the Karachi Stock Exchange for the period 2007-2010. Data on GDP deflator were gathered
from GOP, Economic Survey (various issues).

Asian Journal of Empirical Research, 3(10)2013: 1310-1330
1319
Determinants of technical efficiency
A second stage analysis using the OLS is also carried out in order to see the robustness of the
efficiency scores of the firms. We use four models of technical efficiency where each model
represents a different combination of two orientations and the returns to scale. The technical
efficiency score for each of the firm under CRS with input orientation (Y1) is taken as the
dependent variables while the size, age and labor to capital ratio are the independent variables. A
number factors could be identified that are expected to influence the efficiency of a firm like
political and economic stability, cheap and regular energy supply, cordial labor and management
relations, absence of security threats, efficient skilled labor and competent management etc.
Keeping in view of data limitations, we presume that the size of a firm, age and labor to capital
ratio are the important factors influencing the efficiency of a firm. The natural log of the input
variables reduces the chances of error in the estimates (Angelidis and Lyroudi 2006). Therefore,
the natural logs are used for the size of a firm, age and labor to capital ratio.
Larger firms are usually considered more efficient than smaller firms because the former are
thought to have superior organization or technical knowledge. Older firms are usually regarded
more efficient than younger firms because the former gain experience from past operations and
their survival per se may reflect their superior efficiency. Therefore we take square of the age.
Efficiency may also be related to local participation in ownership. Local participation may
improve efficiency since foreign owners are generally less familiar with the local environment;
local shareholders can help in that respect. On the other hand, local participation may hurt
efficiency if the local owners, because of a lack of knowledge or experience or simply for cultural
reasons, resist adoption of new and more efficient techniques. Considering this background, we
specify the models as follows:
Model I: CRS (Input-Orientation)
Y1 = α0+ α1 lnX1it+ α2 (lnX1it) 2
+ α3lnX2it+ α4 (lnX2it) 2+ α5lnX3it+D+μit (3)
Where
Y1 = technical efficiency score under CRS with input orientation
ln = natural log
t = time (number of years)
X1it = age of the firm i in the year t
X2it = size of the firm i in year t measured by number of employees
X3i = ratio of labor to capital
Dummy Variable =1 if the firm is locally owned
= 0 if the firm is foreign owned
μ = error term that follows the classical linear regression assumptions
Asian Journal of Empirical Research, 3(10)2013: 1310-1330
1320
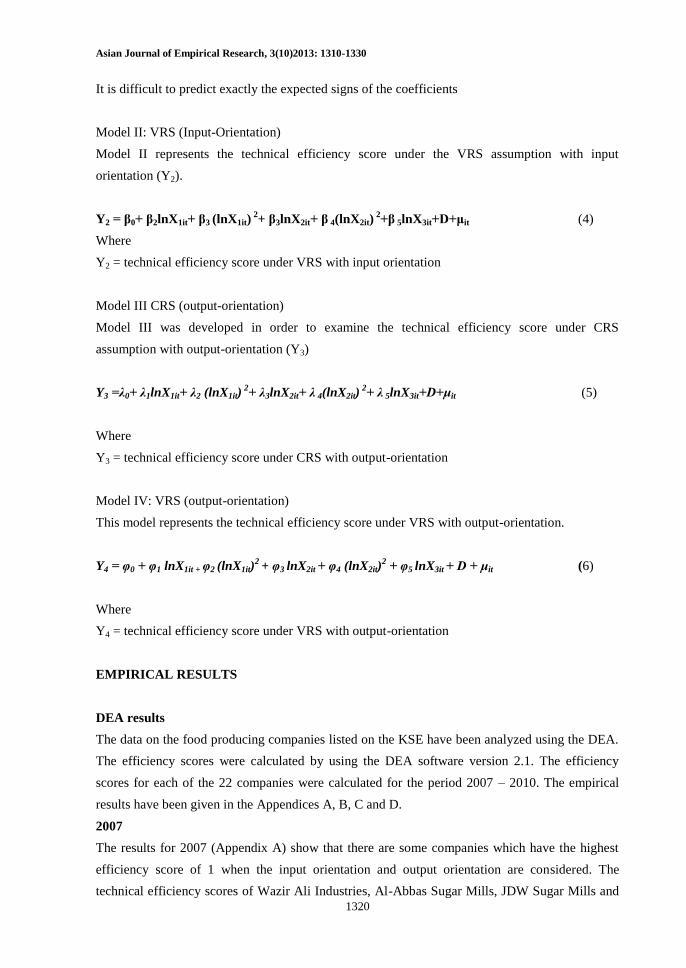
It is difficult to predict exactly the expected signs of the coefficients
Model II: VRS (Input-Orientation)
Model II represents the technical efficiency score under the VRS assumption with input
orientation (Y2).
Y2 = β0+ β2lnX1it+ β3 (lnX1it) 2+ β3lnX2it+ β 4(lnX2it)
2+β 5lnX3it+D+μit (4)
Where
Y2 = technical efficiency score under VRS with input orientation
Model III CRS (output-orientation)
Model III was developed in order to examine the technical efficiency score under CRS
assumption with output-orientation (Y3)
Y3 =λ0+ λ1lnX1it+ λ2 (lnX1it) 2+ λ3lnX2it+ λ 4(lnX2it)
2+ λ 5lnX3it+D+μit (5)
Where
Y3 = technical efficiency score under CRS with output-orientation
Model IV: VRS (output-orientation)
This model represents the technical efficiency score under VRS with output-orientation.
Y4 = φ0 + φ1 lnX1it + φ2 (lnX1it)2 + φ3 lnX2it + φ4 (lnX2it)
2 + φ5 lnX3it + D + μit (6)
Where
Y4 = technical efficiency score under VRS with output-orientation
EMPIRICAL RESULTS
DEA results
The data on the food producing companies listed on the KSE have been analyzed using the DEA.
The efficiency scores were calculated by using the DEA software version 2.1. The efficiency
scores for each of the 22 companies were calculated for the period 2007 – 2010. The empirical
results have been given in the Appendices A, B, C and D.
2007
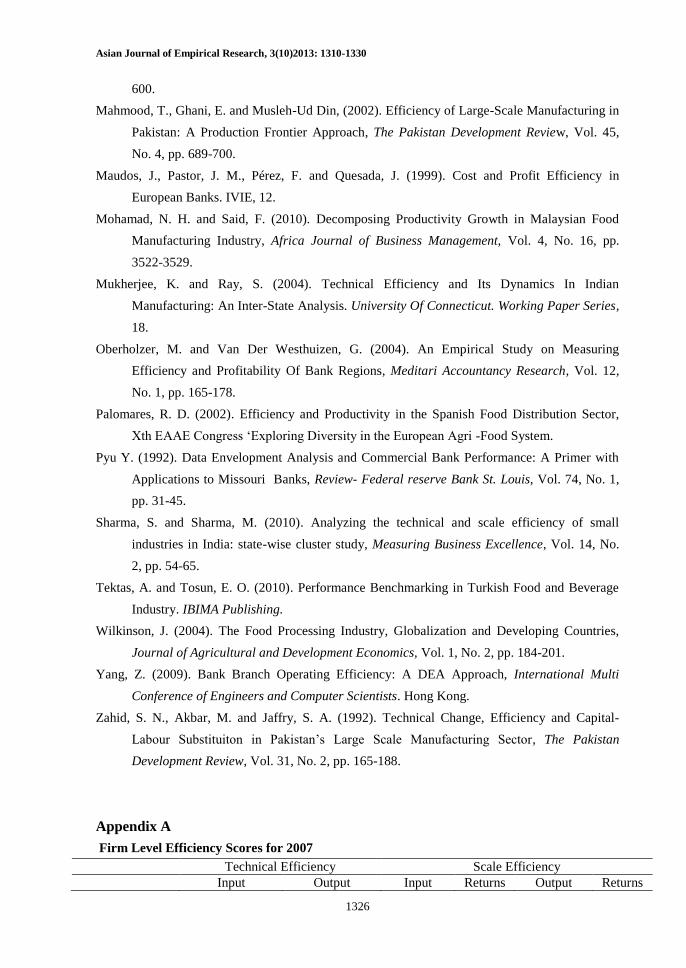
The results for 2007 (Appendix A) show that there are some companies which have the highest
efficiency score of 1 when the input orientation and output orientation are considered. The
technical efficiency scores of Wazir Ali Industries, Al-Abbas Sugar Mills, JDW Sugar Mills and
Asian Journal of Empirical Research, 3(10)2013: 1310-1330
1321
Rafhan Maize demonstrate that these firms are 100 percent efficient. On the other hand, Sakrand
Sugar Mills is approaching the efficient frontier with 88 percent efficiency when the input
orientation is considered under VRS assumption. The scale efficiency scores show that the firms
which were technically efficient were also scale efficient as Wazir Ali Industries, Al-Abbas Sugar
Mills, JDW Sugar Mills and Rafhan Maize scored the maximum efficiency score 1 under both
types of orientations. The companies which are following the frontier include Shakarganj Sugar
Mills and Colony Sugar Mills with 93 percent and 92 percent efficiency respectively when input
orientation is considered. While in case of output orientation, Faran Sugar Mills, Shakarganj
Sugar Mills, Mehran Sugar Mills and Noon Pakistan showed inadequately efficient performance.
2008
A variable trend is observed in the year 2008 (Appendix B) regarding the efficiency of the firms.
Only few companies showed 100 percent efficiency. As far as technical efficiency is concerned,
Wazir Ali, Al-Abbas Sugar, J.D.W. Sugar and Rafhan Maize are technically efficient with both
orientations and returns to scale. While Mitchell’s Fruits, S.S Oil, Mirza Sugar, National Foods
Limited, Nestle Pakistan and Pangrio sugar are technically efficient under the VRS assumption.
Appendix B shows that the scale efficiency scores differed from the technical efficiency. Wazir
Ali, Al-Abbas Sugar, J.D.W. Sugar and Rafhan Maize were 100 percent scale efficient with the
maximum efficiency score of 1 in both types of orientation. The scale efficiency scores of all
other firms in the sample are lower and none of them can be regarded as working efficiently.
2009
2009 (Appendix C) results show that Wazir Ali could not maintain its efficient performance and
showed a lower technical efficiency of 26.4 percent and 94 percent under the different
assumptions. On the other hand, there is a considerable improvement in the performance of some
companies like S.S Oil and Pangrio Sugar as they were 100 percent efficient under CRS and VRS
with both types of orientations. Accordingly S.S Oil, Pangrio Sugar, Al-Abbas Sugar and J.D.W.
Sugar are technically efficient for the year and Mitchell’s Fruits, Thal Industries, Unilever
Pakistan, Nestle Pakistan and Noon Sugar Limited attained maximum technical efficiency score
1 under the VRS assumption with the input and output orientation. The scale efficiency scores of
the sample firms followed the trend of preceding years and Wazir Ali, Al-Abbas Sugar, J.D.W.
Sugar and Rafhan Maize again showed 100 percent scale efficiency.
2010
The year 2010 (Appendix D) can be regarded as the most successful year as far as the
performance of the food producing companies is concerned. Although few companies which had
shown influential performance in the previous years could not keep up the pace but many other
companies joined the group of technically efficient companies which include Adam Sugar and
Thal Industries. Other technically efficient companies for 2010 are S.S.Oil, Al-Abbas Sugar,
J.D.W sugar, Rafhan Maize, Murree Brewery and Wazir Ali. All these companies showed both
technical and scale efficiencies.

Asian Journal of Empirical Research, 3(10)2013: 1310-1330
1322
OLS results
Four models were developed in order to determine the effect of different factors like age, size and
labor to capital ratio on the technical efficiency of the sample firms. We get results for age
(experience) against expectations in the four models which are even significant in Model III and
Model IV (Table I). These results are not sustainable keeping in view the infant industry
argument for domestic industry protection. However, except Model I other models results are
according to expectations (age2) as supported by economic theory. Model I shows poor results.
Size variable is negative and significant for Model II only suggesting that increase in the size of
the firm will diminish technical efficiency and is negative and insignificant in Model III and
Model IV. As the firm size increases (size2)
, it has significant impact on technical efficiency
except Model I. This means that larger firms are more technically efficient under CRS with output
orientation. Labor-capital ratio seems to have no impact on the technical efficiency suggesting
that firms use labor-intensive technology because Pakistan is a labor-abundant country and this
factor is used intensively. Dummy is significant only in model IV implying that foreign or local
ownership carries insignificant role in other models.
Table 1: OLS Results
Variables Model I Model II Model III Model IV
C
0.78
(0.84)
4.72
(0.10)
6.5
(0.14) 7.78 (0.01)
X1 age
-0.99
(-0.55)
-0.22
(- 0.85)
-2.9
(0.08)
-2.5
(0.03)
(X1)2
0.14
(0.53)
0.02
(0.001)
0.40
(0.09) 0.33 (0.03)
X2 size
0.21
(0.72)
-0.77
(0.06) -0.42 (0.56) -0.78 (0.11)
(X2)2
-0.005
(0.89)
0.04
(0.09)
0.03
(0.02) 0.05 (0.07)
X3 L/K
-0.105
(0.15)
0.003
(0.94)
0.03
(0.46) -0.03 (0.59)
D
0.23
(0.47)
-0.03
(0.87)
0.50
(0.19) 0.37 (0.08)
R2 0.13 0.19 0.11 0.29
DW 1.89 2.04 1.86 2.00
Note: The figures in parenthesis are the p-values
CONCLUSIONS
We used DEA to examine the financial data of food producing companies listed on the KSE for
the period 2007 -2010. The year-wise technical efficiency scores of the food sector show that the
performance of the food producing companies has improved over the past four years. The overall

Asian Journal of Empirical Research, 3(10)2013: 1310-1330
1323
efficiency analysis of the food industry suggests that the industry level technical efficiency scores
ranged between 0.5 and 0.8 in the year 2007 which increased to 0.9 in the year 2010. The food
industry is most efficient (90.7%) in the year 2010 when the technical efficiency score assuming
VRS with output orientation was considered. This trend shows that the industry as a whole is
improving. However, the fact that the efficiency never reached the maximum of 100% in the past
4 years indicates that proper policy making and implementation is needed so as to make the
industry fully efficient. Similarly, if the results from the scale efficiency analysis are considered
there is an increasing trend since 2007. Although, the scale efficiency scores of the industry are
not as encouraging as the technical efficiency ones are. The range is 0.5 to 0.7 for the sample
period. Therefore, there is a margin of improvement as far as the scale efficiency of the food
industry is concerned.
The second stage analysis based on OLS shows that Model IV (technical efficiency scores
assuming CRS with the output-orientation) is the most feasible one in which the size, age and
labor to capital ratio and dummy have some significant impact on the technical efficiency.
Whereas the Model I is not feasible since none of the independent variables tend to have any
significant effect on the technical efficiency when the CRS is assumed with input-orientation. In
the light of the overall results, we come up with the following policy implications which if
implemented are expected to enhance the efficiency of the food sector of Pakistan.
1. Being an agricultural country, proper attention should be given to the modern approaches
of producing and processing the agricultural yield. This includes the use of highly
equipped machinery and infrastructure in addition to the general awareness in the farmer
community.
2. Since the DEA shows that the food industry is not scale efficient which means that the
resources are not being appropriately exploited due to which the returns are not up to the
desired mark. Ultimately the scale efficiency of the whole industry is suffering.
3. The OLS results show that the technical efficiency scores under CRS and VRS
assumption of input orientation is effected by the age of the firm. This implies that the
new firms are more efficient. Consequently there is a gap between the efficiency of the
new and old firms, the older firms may also achieve the benchmark if they improve their
organizational practices. This will in turn trigger the efficiency of the overall
performance of the industry.
4. There is a big potential in the food sector of Pakistan which may contribute towards the
exports of the country. As for instance, if the cereal grain production is increased and
proper steps are taken in the right direction, the productivity of cereals may be improved.
Since the South Asian and Middle Eastern countries are not self-sufficient, the exports
may be targeted to such countries. This may be done by improving the technological

Asian Journal of Empirical Research, 3(10)2013: 1310-1330
1324
facilities available to the farmers and the more refined processes to make the yield
available for exports.
5. Since Pakistan is blessed with ample natural resources, appropriate steps in the right
direction may lead the country towards prosperity. The exploitation of water resources in
this regard needs immediate attention. Being an agricultural country, the performance of
food sector of Pakistan heavily relies on the annual yield. Therefore, the quality of
agricultural yield may be improved if the canal system is further developed employing
the modern technological advancements. Proper policy making and exploitation of water
resources may in turn enhance the performance of the overall food industry of the
country.
REFERENCES
Abedullah, Kouser, S. and Mushtaq, K. (2007). Analysis of Technical Efficiency of Rice
Production in Punjab (Pakistan) - Implications for Future Investment Strategies, Pakistan
Economic and Social Review, Vol. 45, No. 2, pp. 231-244.
Angelidis, D. and Lyroudi, K. (2006). Efficiency in the Italian Banking Industry: Data
Envelopment Analysis and Neural Networks, International Research Journal of Finance
and Economics, Vol. 5, pp. 155-165.
Banker, R., Charnes, A. & Cooper, C. (1984). Some Models for Estimating Technical and Scale
Inefficiencies in Data Envelopment Analysis, Management Science, Vol. 30, pp. 1078–
1092.
Banker, R. D. and Morey, R. C. (1986). Efficiency Analysis for Exogenously Fixed Inputs And
Outputs, Operations Research, Vol. 34, No. 4, pp. 113-120.
Banker, R. D. and Thrall, R. M. (1990). Estimation of Returns to Scale using Data Envelopment
Analysis, European Journal of Operational Research, pp. 74-84.
Bayyurt, N. and Duzu, G. (2008). Performance Measurement of Turkish and Chinese
Manufacturing Firms: A Comparative Analysis, Eurasian Journal of Business and
Economics, Vol. 1, No. 2, pp. 71-83.
Burki, A. A. and Khan, M. H. (2005). Effects of Allocative Inefficiency on Resource Allocation
and Energy Substitution in Pakistan’s Manufacturing. Center for Management and
Economic Research (CMER), Lahore University of Management Sciences (LUMS),
Working Paper No. pp. 04-30.
Chapelle, K. and Plane, P. (2002). Technical Efficiency Measurement within the Ivorian
Manufacturing Sector: A Data Envelopment Analysis Approach. Centre D’etudes Et De
Recherches Sur Le Developpement International.
Charnes, A., Cooper, W., & Rhodes. E. (1978), Measuring the efficiency of decision-making
units, European Journal of Operational Research, Vol. 2, pp. 429–444.
Asian Journal of Empirical Research, 3(10)2013: 1310-1330
1325
Coelli, T. (1998). A Guide to DEAP Version 2.1: A Data Envelopment Analysis (Computer)
Program. CEPA, Working Paper 96/08.
Eling, M. and Luhnen, M. (2008). Frontier Efficiency Methodologies to Measure Performance in
the Insurance Industry: Overview and New Empirical Evidence. Institute of Insurance
Economics, University Of St. Gallen, Working Papers on Risk Management and Insurance
No. 56.
Eling, M. and Luhnen, M. (2009). Efficiency in the International Insurance Industry: A Cross-
Country Comparison, Institute Of Insurance Economics, University Of St. Gallen, Working
Papers on Risk Management and Insurance No. 72.
Ferrier, G. D. and V. Valdmanis (1996). Rural Hospital Performance and its Correlates, Journal
of Productivity Analysis, Vol. 7 pp. 63-80.
Fontana, M. & Wobst, P. (2001). Macro Policies and the Food Sector in Bangladesh: A General
Equilibrium Analysis. Trade and Macroeconomics Division International Food Policy
Research Institute.
Gregorian, D. A. and Manole, V. (2002). Determinants of Commercial Bank Performance in
Transition - An Application Of Data Envelopment Analysis, Policy Research Working
Paper 2850 - The World Bank.
Gopinath, M., Roe, L. & Shane, D. (1996). Competitiveness of US Food Processing: Benefits
from Primary Agriculture, American Journal of Agricultural Economics, Vol. 78, No. 4,
pp. 1044-1055.
Government of Pakistan, Economic Survey (various issues), Islamabad, Ministry of Finance,
Economic Advisor Wing.
Halkos, G. and Tzeremes, N. (2010). Performance Evaluation Using Bootstrapping DEA
Techniques: Evidence from Industry Ratio Analysis. MPRA, 25072.
Halkos, G. E. and Salamouris, D. S. (2001). Efficiency Measures of The Greek Banking Sector: A
Non-Parametric Approach For The Period 1997-1999, Munich Personal Repec Archiv.
Hamilton, F. & Sunding, L. (1997). The Effect of Farm Supply Shifts on Concentration and
Market Power in the Food Processing Sector, American Journal of Agricultural
Economics, Vol. 79, No. 2, pp. 524-531.
Jayanthi, S., Kocha, B. and Sinha, K. K. (1996). Competitive Analysis of U.S Food Processing
Plants, The Retail Food Industry Center, Working Paper 96-04.
Kumar, M. and Basu, P. (2008). Perspectives of productivity growth in Indian food industry: a
data envelopment analysis, International Journal of Productivity and Performance
Management, Vol. 57, No. 7, pp. 503 – 522.
Lopez, E. (2008). Measuring Oligopoly Power and Production Responses of the Canadian Food
Processing Industry, Journal of Agricultural Economics, Vol. 3, No. 2, pp. 219-230.
Mahdevan, R. (2002). A DEA Approach to Understanding the Productivity Growth of Malaysia’s
Manufacturing Industries, Asia Pacific Journal of Management, Vol. 19, No. 4, pp. 587-
Asian Journal of Empirical Research, 3(10)2013: 1310-1330
1326
600.
Mahmood, T., Ghani, E. and Musleh-Ud Din, (2002). Efficiency of Large-Scale Manufacturing in
Pakistan: A Production Frontier Approach, The Pakistan Development Review, Vol. 45,
No. 4, pp. 689-700.
Maudos, J., Pastor, J. M., Pérez, F. and Quesada, J. (1999). Cost and Profit Efficiency in
European Banks. IVIE, 12.
Mohamad, N. H. and Said, F. (2010). Decomposing Productivity Growth in Malaysian Food
Manufacturing Industry, Africa Journal of Business Management, Vol. 4, No. 16, pp.
3522-3529.
Mukherjee, K. and Ray, S. (2004). Technical Efficiency and Its Dynamics In Indian
Manufacturing: An Inter-State Analysis. University Of Connecticut. Working Paper Series,
18.
Oberholzer, M. and Van Der Westhuizen, G. (2004). An Empirical Study on Measuring
Efficiency and Profitability Of Bank Regions, Meditari Accountancy Research, Vol. 12,
No. 1, pp. 165-178.
Palomares, R. D. (2002). Efficiency and Productivity in the Spanish Food Distribution Sector,
Xth EAAE Congress ‘Exploring Diversity in the European Agri -Food System.
Pyu Y. (1992). Data Envelopment Analysis and Commercial Bank Performance: A Primer with
Applications to Missouri Banks, Review- Federal reserve Bank St. Louis, Vol. 74, No. 1,
pp. 31-45.
Sharma, S. and Sharma, M. (2010). Analyzing the technical and scale efficiency of small
industries in India: state-wise cluster study, Measuring Business Excellence, Vol. 14, No.
2, pp. 54-65.
Tektas, A. and Tosun, E. O. (2010). Performance Benchmarking in Turkish Food and Beverage
Industry. IBIMA Publishing.
Wilkinson, J. (2004). The Food Processing Industry, Globalization and Developing Countries,
Journal of Agricultural and Development Economics, Vol. 1, No. 2, pp. 184-201.
Yang, Z. (2009). Bank Branch Operating Efficiency: A DEA Approach, International Multi
Conference of Engineers and Computer Scientists. Hong Kong.
Zahid, S. N., Akbar, M. and Jaffry, S. A. (1992). Technical Change, Efficiency and Capital-
Labour Substituiton in Pakistan’s Large Scale Manufacturing Sector, The Pakistan
Development Review, Vol. 31, No. 2, pp. 165-188.
Appendix A
Firm Level Efficiency Scores for 2007
Technical Efficiency Scale Efficiency
Input Output Input Returns Output Returns

Asian Journal of Empirical Research, 3(10)2013: 1310-1330
1327
orientation orientation orientation orientation
CRS VRS CRS VRS
Adam Sugar
Mills 0.272 0.798 0.272 0.41 0.34 IRS 0.663 IRS
Colony Sugar
Mills 0.214 0.231 0.214 0.704 0.925 DRS 0.304 DRS
Faran Sugar
Mills 0.287 0.586 0.287 0.291 0.49 IRS 0.988 IRS
Mithchells Fruit 0.437 1 0.437 1 0.437 IRS 0.437 IRS
Shahtaj Sugar 0.428 1 0.428 1 0.482 IRS 0.482 IRS
Shakarganj Mills 0.609 0.65 0.609 0.644 0.938 IRS 0.945 DRS
S.S.Oil 0.542 1 0.542 1 0.542 IRS 0.542 IRS
Thal Industries 0.502 0.582 0.502 0.917 0.863 DRS 0.547 DRS
Unilever
Pakistan 0.227 1 0.227 1 0.227 DRS 0.227 DRS
Wazir Ali 1 1 1 1 1 - 1 -
AL-Abbas Sugur 1 1 1 1 1 - 1 -
J.D.W.Sugar 1 1 1 1 1 - 1 -
Mehran
SugarXD 0.168 0.587 0.168 0.176 0.286 IRS 0.953 DRS
Mirpurkhas
Sugar 0.103 0.491 0.103 0.157 0.209 IRS 0.656 DRS
Mirza Sugar 0.203 1 0.203 1 0.203 IRS 0.203 IRS
Murree Brewery 0.727 1 0.727 1 0.727 IRS 0.727 IRS
National Foods
Ltd. 0.782 1 0.782 1 0.782 IRS 0.782 IRS
Nestle Pakistan 0.809 1 0.809 1 0.809 DRS 0.809
Noon Sugar
Mills 0.227 0.629 0.227 0.237 0.361 IRS 0.959 IRS
Pangrio Sugar 0.08 1 0.08 1 0.08 IRS 0.08 IRS
Rafhan Maize 1 1 1 1 1 - 1 -
Sakrand Sugar 0.338 0.888 0.338 0.661 0.38 IRS 0.511 IRS
Appendix B
Firm Level Efficiency Scores for 2008
Technical Efficiency Scale Efficiency
Input
orientation
Output
orientation
Input
orientation Returns
Output
orientation Returns
CRS VRS CRS VRS
Adam Sugar
Mills 0.319 0.84 0.319 0.545 0.379 IRS 0.584 IRS
Colony
Sugar Mills 233
0.25
3 233 0.76 0.919 DRS 0.306 DRS
Faran Sugar
Mills 0.322
0.60
4 0.322 0.333 0.533 IRS 0.966 IRS
Mithchells
Fruit 0.325 1 0.325 1 0.325 IRS 0.325 IRS
Shahtaj
Sugar 0.347
0.90
2 0.347 0.494 0.384 IRS 0.702 IRS
Shakarganj 0.653 0.69 0.653 0.746 0.941 IRS 0.876 DRS

Asian Journal of Empirical Research, 3(10)2013: 1310-1330
1328
Mills 5
S.S.Oil 0.471 1 0.471 1 0.471 IRS 0.471 IRS
Thal
Industries 0.475
0.47
7 0.475 0.85 0.996 IRS 0.559 DRS
Unilever
Pakistan 0.23 1 0.23 1 0.23 DRS 0.23 DRS
Wazir Ali 1 1 1 1 1 - 1 -
AL-Abbas
Sugur 1 1 1 1 1 - 1 -
J.D.W.Sugar 1 1 1 1 1 - 1 -
Mehran
SugarXD 0.12
0.53
3 0.12 0.152 0.224 IRS 0.788 DRS
Mirpurkhas
Sugar 0.075
0.52
5 0.075 0.122 0.144 IRS 0.615 DRS
Mirza Sugar 0.174 1 0.174 1 0.174 IRS 0.174 IRS
Murree
Brewery 0.424
0.58
4 0.424 0.55 0.726 IRS 0.771 DRS
National
Foods Ltd. 0.853 1 0.853 1 0.853 IRS 0.852 IRS
Nestle
Pakistan 0.528 1 0.528 1 0.528 DRS 0.528 DRS
Noon Sugar
Mills 0.272
0.60
5 0.272 0.286 0.45 IRS 0.952 IRS
Pangrio
Sugar 0.089 1 0.089 1 0.089 IRS 0.089 IRS
Rafhan
Maize 1 1 1 1 1 - 1 -
Sakrand
Sugar 0.238 0.72 0.238 0.334 0.331 IRS 0.714 IRS
Appendix C
Firm Level Efficiency Scores for 2009
Technical Efficiency Scale Efficiency
Input
orientation
Output
orientation
Input
orientation Returns
Output
orientation Returns
CRS VRS CRS VRS
Adam
Sugar Mills 0.696 0.736 0.696 0.703 0.946 IRS 0.99 DRS
Colony
Sugar Mills 0.304 0.729 0.304 0.845 0.417 DRS 0.36 DRS
Faran
Sugar Mills 452 0.669 452 0.467 0.676 IRS 0.968 DRS
Mithchells
Fruit 0.349 1 0.349 1 0.349 IRS 0.349 IRS
Shahtaj
Sugar 0.549 0.781 0.549 0.558 0.704 IRS 0.985 DRS
Shakarganj
Mills 0.874 0.953 0.874 0.96 0.917 DRS 0.91 DRS

Asian Journal of Empirical Research, 3(10)2013: 1310-1330
1329
S.S.Oil 1 1 1 1 1 - 1
Thal
Industries 0.884 1 0.884 1 0.884 DRS 0.884 DRS
Unilever
Pakistan 0.417 1 0.417 1 0.417 DRS 0.417 DRS
Wazir Ali 0.264 0.945 0.264 0.264 0.279 IRS 0.999 -
AL-Abbas
Sugur 1 1 1 1 1 - 1 -
J.D.W.Sug
ar 1 1 1 1 1 - 1 -
Mehran
SugarXD 0.393 0.396 0.393 0.518 0.993 IRS 0.759 DRS
Mirpurkhas
Sugar 0.32 0.619 0.32 0.341 0.517 IRS 0.94 DRS
Mirza
Sugar 0.266 1 0.266 1 0.266 IRS 0.266 IRS
Murree
Brewery 0.988 1 0.988 1 0.988 IRS 0.988 IRS
National
Foods Ltd. 0.537 0.617 0.537 0.625 0.872 IRS 0.861 DRS
Nestle
Pakistan 0.886 1 0.886 1 0.886 DRS 0.886 DRS
Noon
Sugar Mills 0.606 1 0.606 1 0.606 IRS 0.606 IRS
Pangrio
Sugar 1 1 1 1 1 - 1 -
Rafhan
Maize 1 1 1 1 1 - 1 -
Sakrand
Sugar 0.256 0.68 0.256 0.258 0.377 IRS 0.994 DRS
Appendix D
Firm Level Efficiency Scores for 2010
Technical Efficiency Scale Efficiency
Input orientation
Output
orientation
Input
orientation Returns
Output
orientation Returns
CRS VRS CRS VRS
Adam Sugar
Mills 1 1 1 1 1 - 1 -
Colony
Sugar Mills 0.403 0.468 0.403 0.676 0.862 DRS 0.597 DRS
Faran Sugar
Mills 0.731 0.736 0.731 0.746 0.933 DRS 0.981 DRS
Mithchells
Fruit 0.676 1 0.676 1 0.676 IRS 0.676 IRS
Shahtaj
Sugar 0.719 0.771 0.719 0.745 0.933 IRS 0.966 IRS
Shakarganj
Mills 0.639 0.87 0.639 0.885 0.734 DRS 0.722 DRS

Asian Journal of Empirical Research, 3(10)2013: 1310-1330
1330
S.S.Oil 1 1 1 1 1 - 1 -
Thal
Industries 1 1 1 1 1 - 1 -
Unilever
Pakistan 0.941 1 0.941 1 0.941 DRS 0.941 DRS
Wazir Ali 1 1 1 1 1 - 1 -
AL-Abbas
Sugur 1 1 1 1 1 - 1 -
J.D.W.Sugar 1 1 1 1 1 - 1 -
Mehran
SugarXD 0.668 0.7 0.668 0.68 0.954 IRS 0.983 IRS
Mirpurkhas
Sugar 0.53 0.581 0.53 0.536 0.911 IRS 0.989 IRS
Mirza Sugar 0.695 1 0.695 1 0.695 IRS 0.695 IRS
Murree
Brewery 1 1 1 1 1 - 1 -
National
Foods Ltd. 0.873 0.931 0.873 0.903 0.956 IRS 0.966 IRS
Nestle
Pakistan 0.895 1 0.895 1 0.895 DRS 0.895 DRS
Noon Sugar
Mills 0.878 1 0.878 1 0.878 IRS 0.878 IRS
Pangrio
Sugar 0.818 1 0.818 1 0.818 IRS 0.818 IRS
Rafhan
Maize 1 1 1 1 1 - 1 -
Sakrand
Sugar 0.768 0.795 0.768 0.786 0.965 IRS 0.976 IRS