Asian insuranceAsian insurance - Actuaries Institute · KSJ &AD Fire ndai n gbu n Re IAG S UN Q...
34
Asian insurance Asian insurance What do investors think of insurance companies? Scott Russell, FIAA Head of Financials Research, Asia Macquarie Capital Securities Limited 1 Harbour View Street Central Hong Kong 1 Harbour View Street, Central, Hong Kong +852-3922 3567 [email protected] November 2015 In preparing this research, we did not take into account the investment objectives, financial situation and particular needs of the reader. Before making an investment decision on the basis of this research, the reader needs to consider, with or without the assistance of an adviser, whether the advice is appropriate in light of their particular investment needs, objectives and financial circumstances. Please see disclaimer.
Transcript of Asian insuranceAsian insurance - Actuaries Institute · KSJ &AD Fire ndai n gbu n Re IAG S UN Q...
Asian insuranceAsian insuranceWhat do investors think of insurance companies?
Scott Russell, FIAAHead of Financials Research, Asia
Macquarie Capital Securities Limited1 Harbour View Street Central Hong Kong1 Harbour View Street, Central, Hong Kong
+852-3922 [email protected]
November 2015
In preparing this research, we did not take into account the investment objectives, financial situation and particular needs of the reader. Before making an investment decision on the basis of this research, the reader needs to consider, with or without the assistance of an adviser, whether the advice is appropriate in light of their particular investment needs, objectives and financial circumstances. Please see disclaimer.
Agendag
1. Overview
2. Quantitative factors
3. Qualitative factors
4. Putting it together
5. Summary
2

Investor conundrums Asia offers some of the most and least attractive insurance markets globally
Which countries offer the best/worst investment opportunities?
Life or Non-life?
Growth or value? What holding period?
What changes will regulators and Government make?What changes will regulators and Government make?
Where are stock markets, FX rates and interest rates going?
What is the right price to buy/sell?
3

Agendag
1. Overview
2. Quantitative factors
3. Qualitative factors
4. Putting it together
5. Summary
4
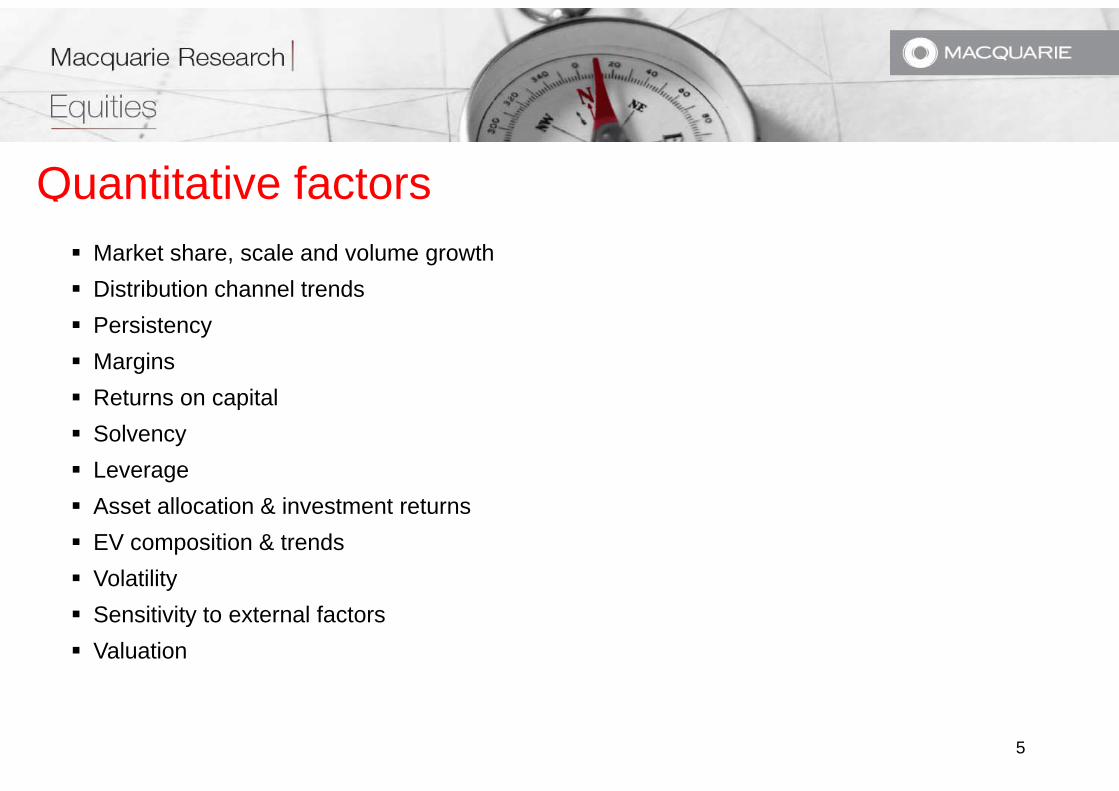
Quantitative factors Market share, scale and volume growth Distribution channel trends Persistency Margins Returns on capital Returns on capital Solvency Leverage Asset allocation & investment returns EV composition & trends Volatilityy Sensitivity to external factors Valuation
5
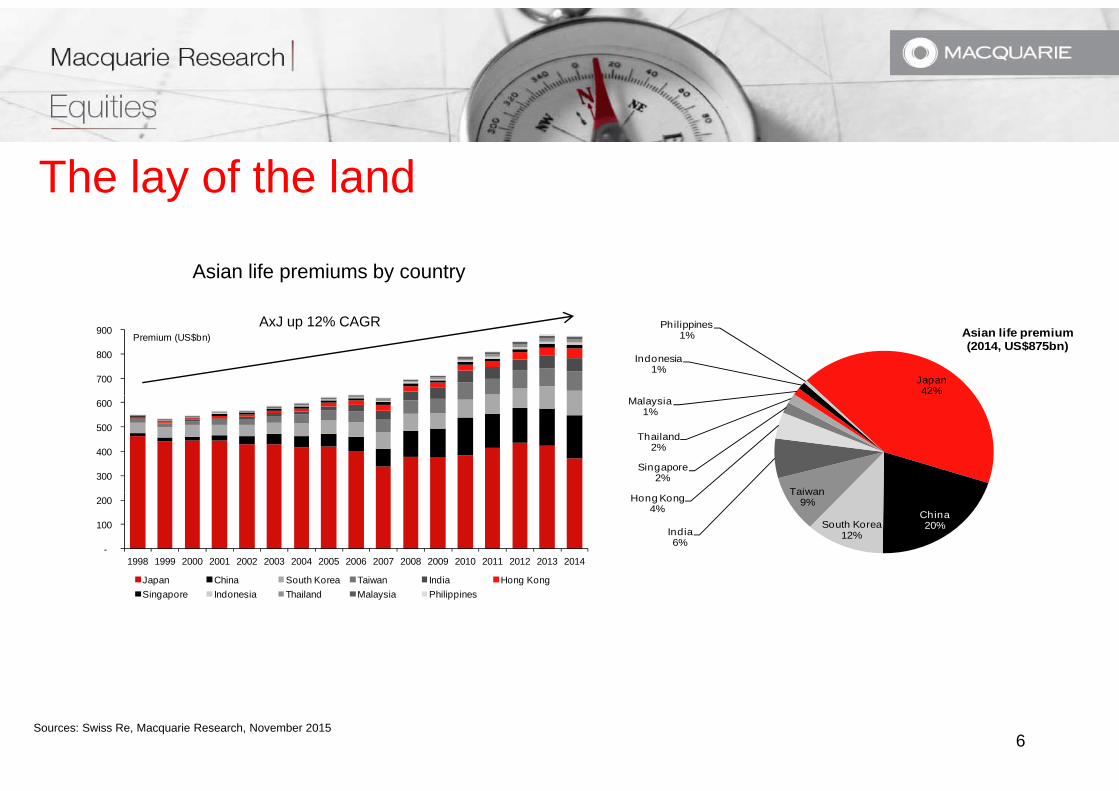
The lay of the landy
Asian life premiums by country
700
800
900 Premium (US$bn)
Japan42%
Indonesia1%
Philippines1% Asian life premium
(2014, US$875bn)
AxJ up 12% CAGR
300
400
500
600
Taiwan
Singapore2%
Thailand2%
Malaysia1%
-
100
200
1998 1999 2000 2001 2002 2003 2004 2005 2006 2007 2008 2009 2010 2011 2012 2013 2014
Japan China South Korea Taiwan India Hong Kong
China20%South Korea
12%
Taiwan9%
India6%
Hong Kong4%
Singapore Indonesia Thailand Malaysia Philippines
Sources: Swiss Re, Macquarie Research, November 20156
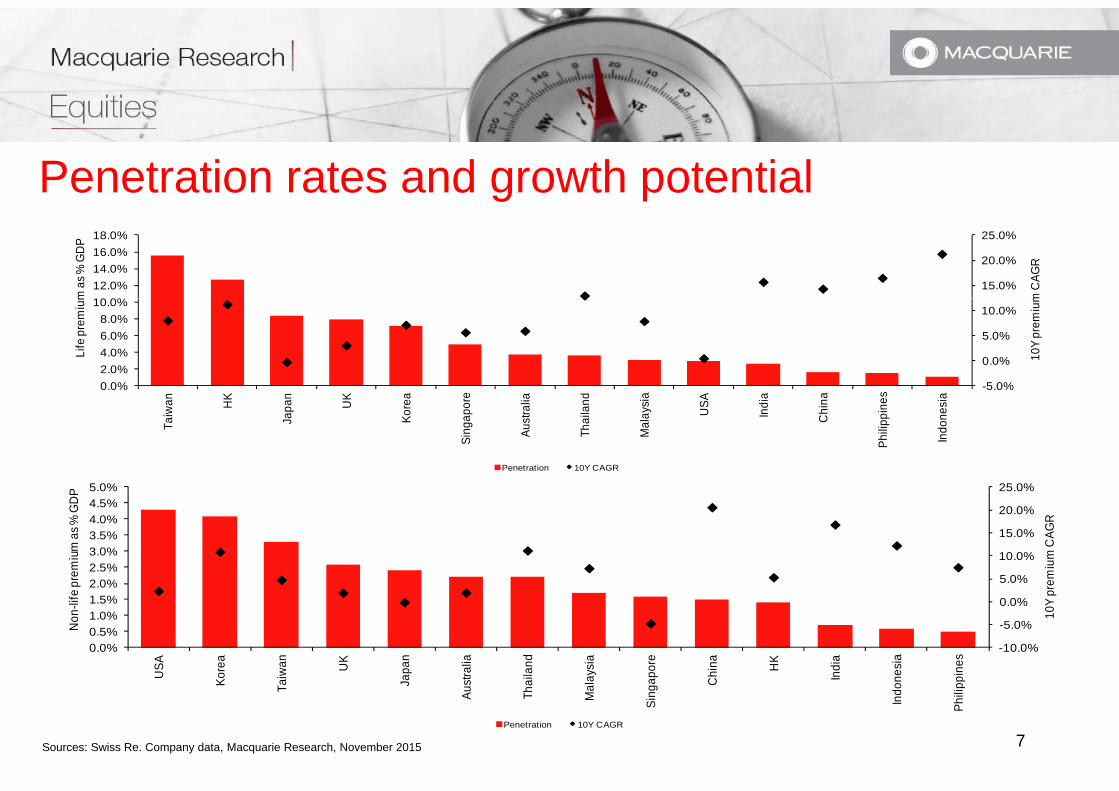
Penetration rates and growth potentialg
15.0%
20.0%
25.0%
10 0%12.0%14.0%16.0%18.0%
m C
AGR
m a
s % G
DP
-5.0%
0.0%
5.0%
10.0%
0.0%2.0%4.0%6.0%8.0%
10.0%
n K n K a e a d a A a a s a
10Y
prem
ium
Life
pre
miu
m
Taiw
an HK
Japa
n
UK
Kore
a
Sing
apor
e
Aust
ralia
Thai
land
Mal
aysi
a
USA
Indi
a
Chi
na
Phili
ppin
es
Indo
nesi
a
Penetration 10Y CAGR
25.0%5.0%P
5.0%
10.0%
15.0%
20.0%
2.0%2.5%3.0%3.5%4.0%4.5%
rem
ium
CAG
R
prem
ium
as %
GD
P
-10.0%
-5.0%
0.0%
0.0%0.5%1.0%1.5%
USA
Kore
a
Taiw
an UK
Japa
n
stra
lia
aila
nd
alay
sia
gapo
re
Chi
na HK
Indi
a
ones
ia
ppin
es
10Y
p
Non
-life
Sources: Swiss Re. Company data, Macquarie Research, November 2015
T Au Th Ma
Sing Indo
Phili
p
Penetration 10Y CAGR
7
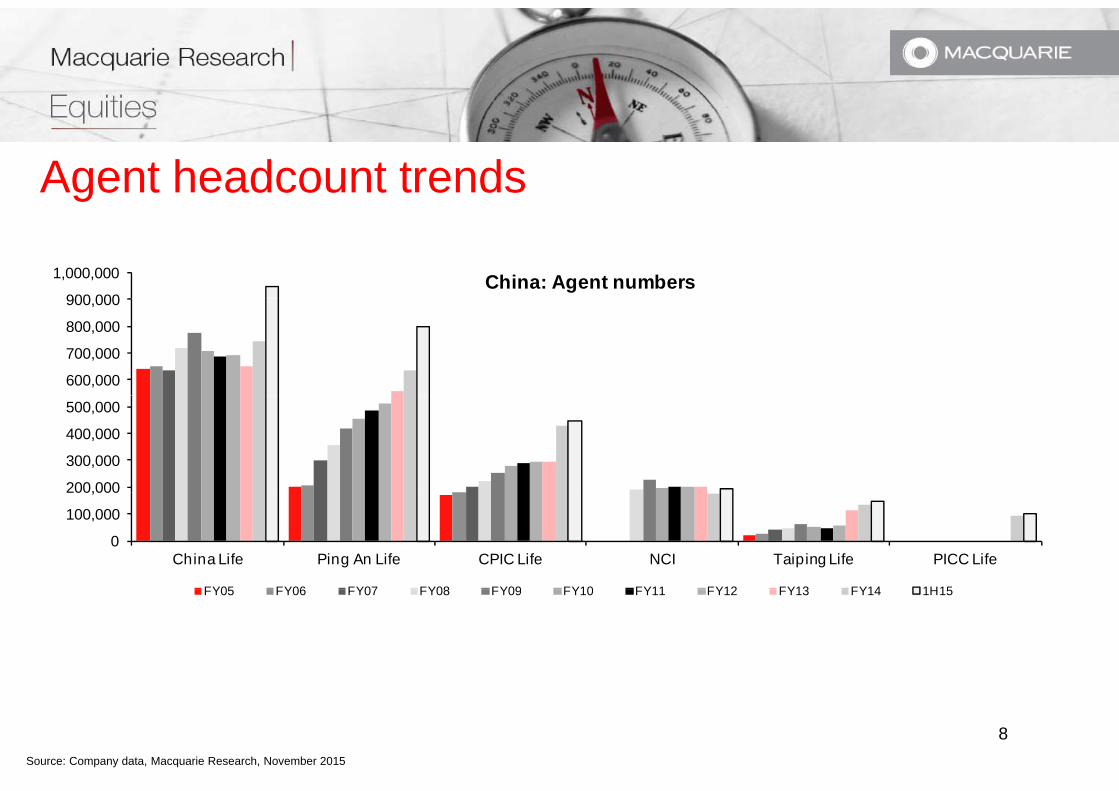
Agent headcount trendsg
900 000
1,000,000 China: Agent numbers
600,000
700,000
800,000
900,000
200,000
300,000
400,000
500,000
0
100,000
200,000
China Life Ping An Life CPIC Life NCI Taiping Life PICC Life
FY05 FY06 FY07 FY08 FY09 FY10 FY11 FY12 FY13 FY14 1H15FY05 FY06 FY07 FY08 FY09 FY10 FY11 FY12 FY13 FY14 1H15
Source: Company data, Macquarie Research, November 2015
8
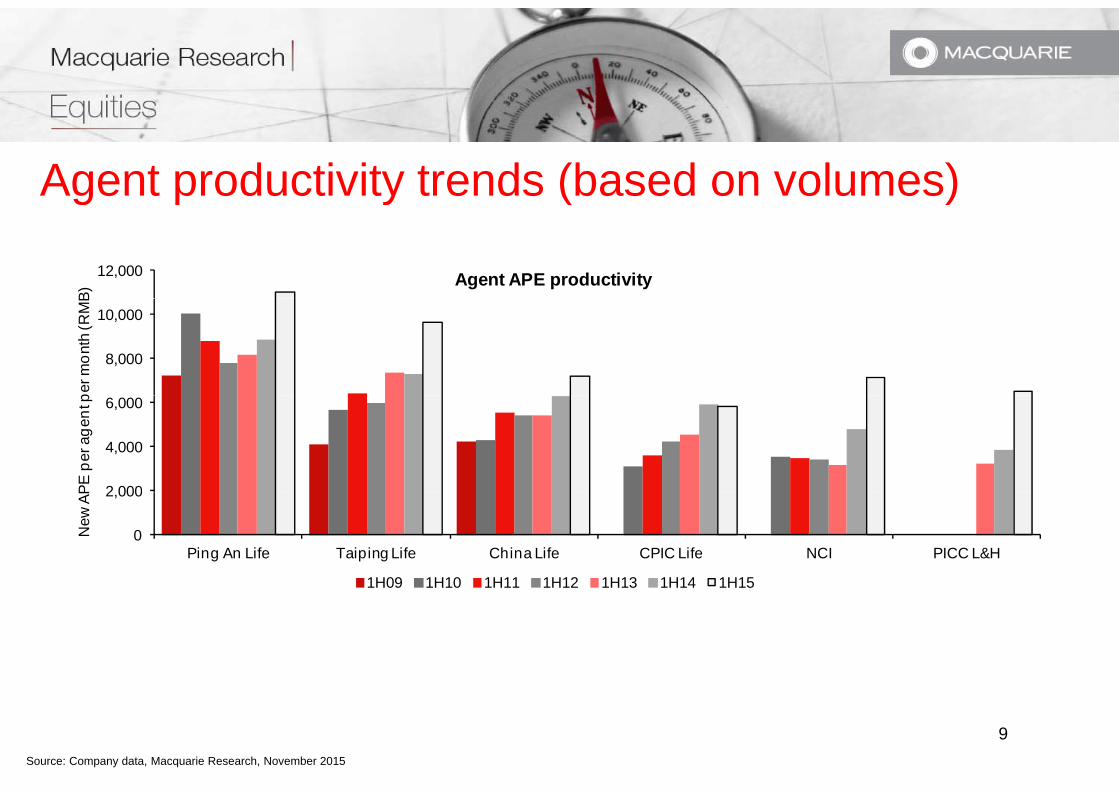
Agent productivity trends (based on volumes)g p y ( )
12,000
B)
Agent APE productivity
8,000
10,000
per m
onth
(RM
B
2 000
4,000
6,000
PE p
er a
gent
p
0
2,000
Ping An Life Taiping Life China Life CPIC Life NCI PICC L&H
New
AP
1H09 1H10 1H11 1H12 1H13 1H14 1H15
Source: Company data, Macquarie Research, November 2015
9
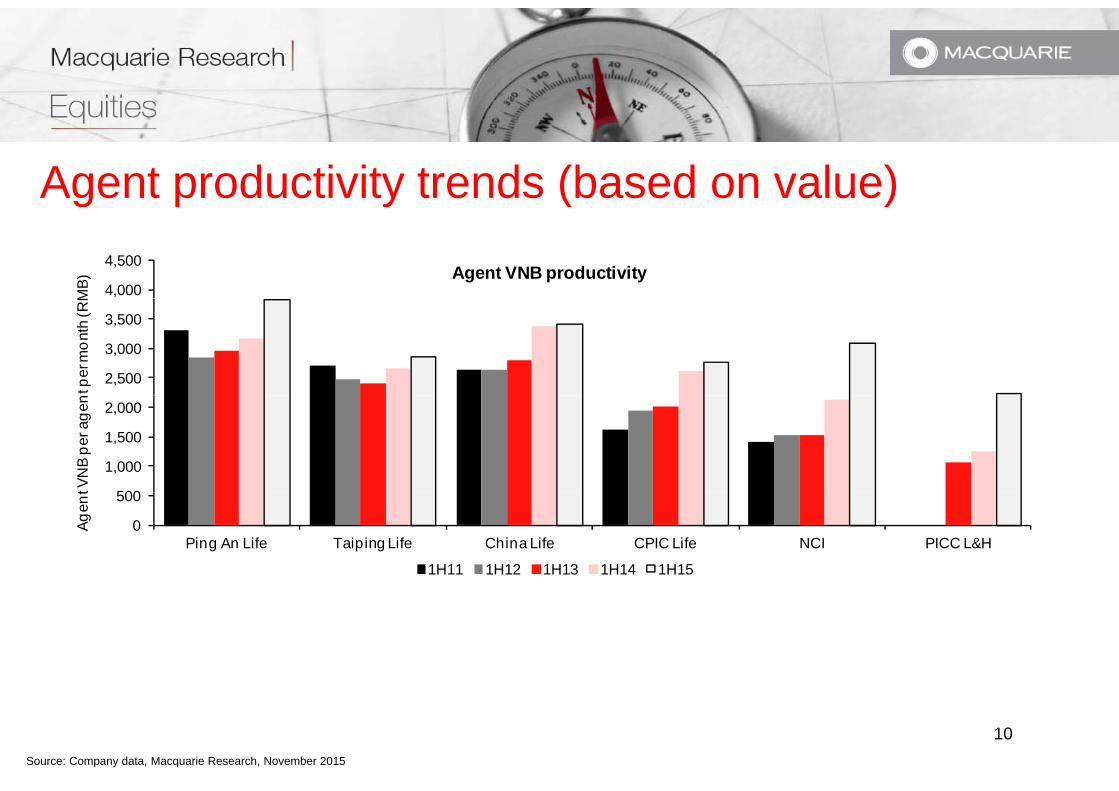
Agent productivity trends (based on value)g p y ( )
4,000
4,500
MB)
Agent VNB productivity
2,500
3,000
3,500
t per
mon
th (R
M
500
1,000
1,500
2,000
t VN
B pe
r age
n
0
500
Ping An Life Taiping Life China Life CPIC Life NCI PICC L&H
Agen
t
1H11 1H12 1H13 1H14 1H15
Source: Company data, Macquarie Research, November 2015
10
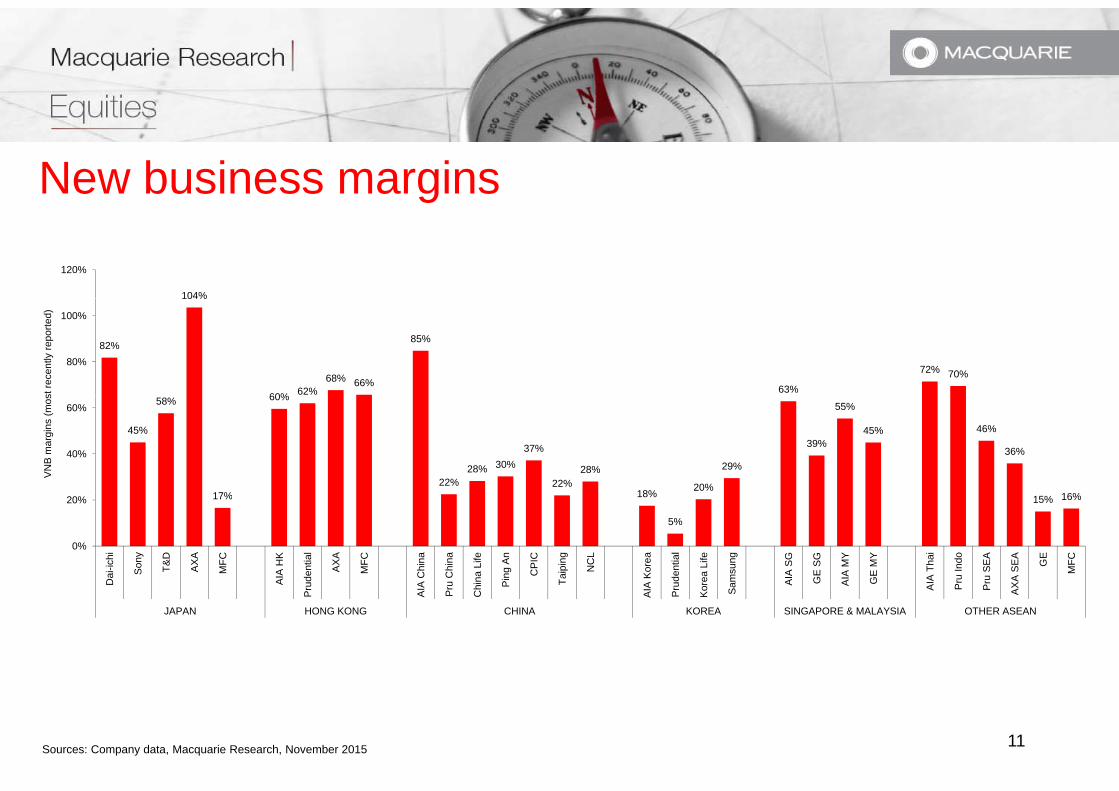
New business marginsg
104%
120%
82%
104%
60% 62%68% 66%
85%
63%
72% 70%80%
100%
st re
cent
ly re
porte
d)
45%
58%
17%
60%
22%28% 30%
37%
22%28%
18% 20%
29%
39%
55%
45% 46%
36%40%
60%
VN
B m
argi
ns (m
os
17% 18%
5%
15% 16%
0%
20%
Dai
-ichi
Son
y
T&D
AX
A
MFC
AIA
HK
rude
ntia
l
AX
A
MFC
IA C
hina
ru C
hina
hina
Life
Pin
g A
n
CP
IC
Taip
ing
NC
L
A K
orea
rude
ntia
l
orea
Life
Sam
sung
AIA
SG
GE
SG
AIA
MY
GE
MY
AIA
Tha
i
Pru
Indo
Pru
SE
A
AX
A S
EA
GE
MFC
Pr
AI Pr
Ch
AI Pr
Ko S A P P A
JAPAN HONG KONG CHINA KOREA SINGAPORE & MALAYSIA OTHER ASEAN
Sources: Company data, Macquarie Research, November 2015 11
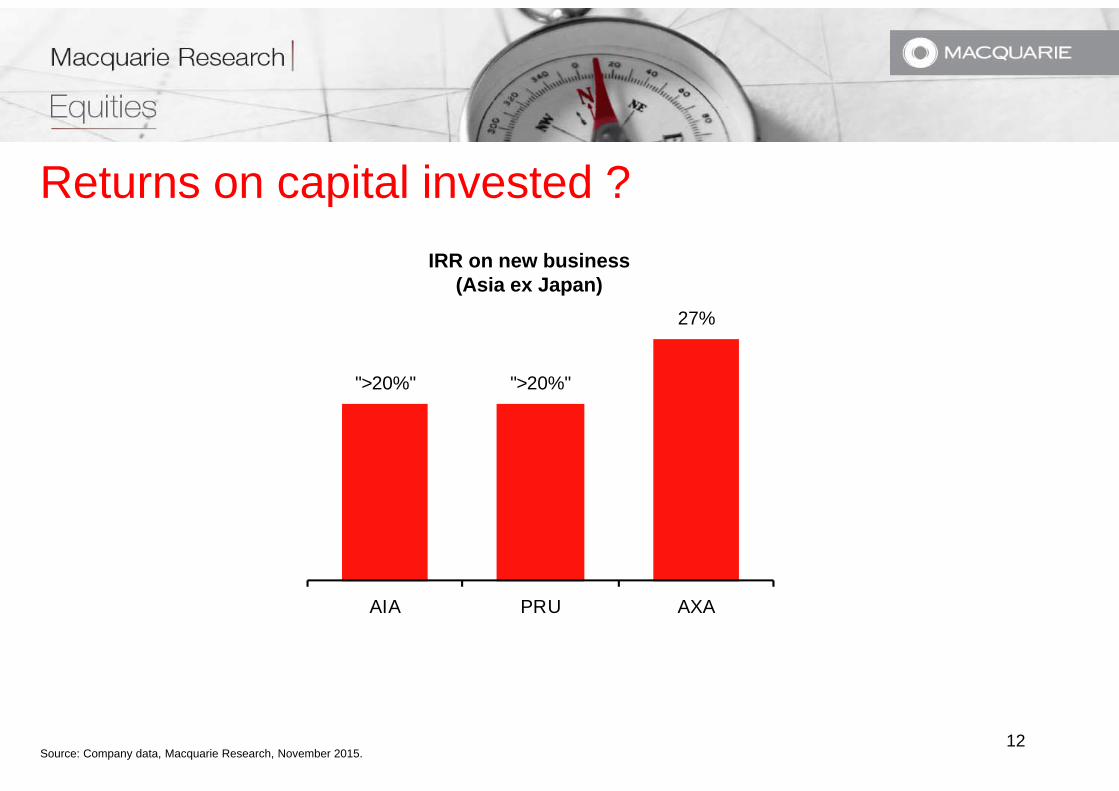
Returns on capital invested ?pIRR on new business
(Asia ex Japan)
">20%" ">20%"
27%
AIA PRU AXA
Source: Company data, Macquarie Research, November 2015. 12
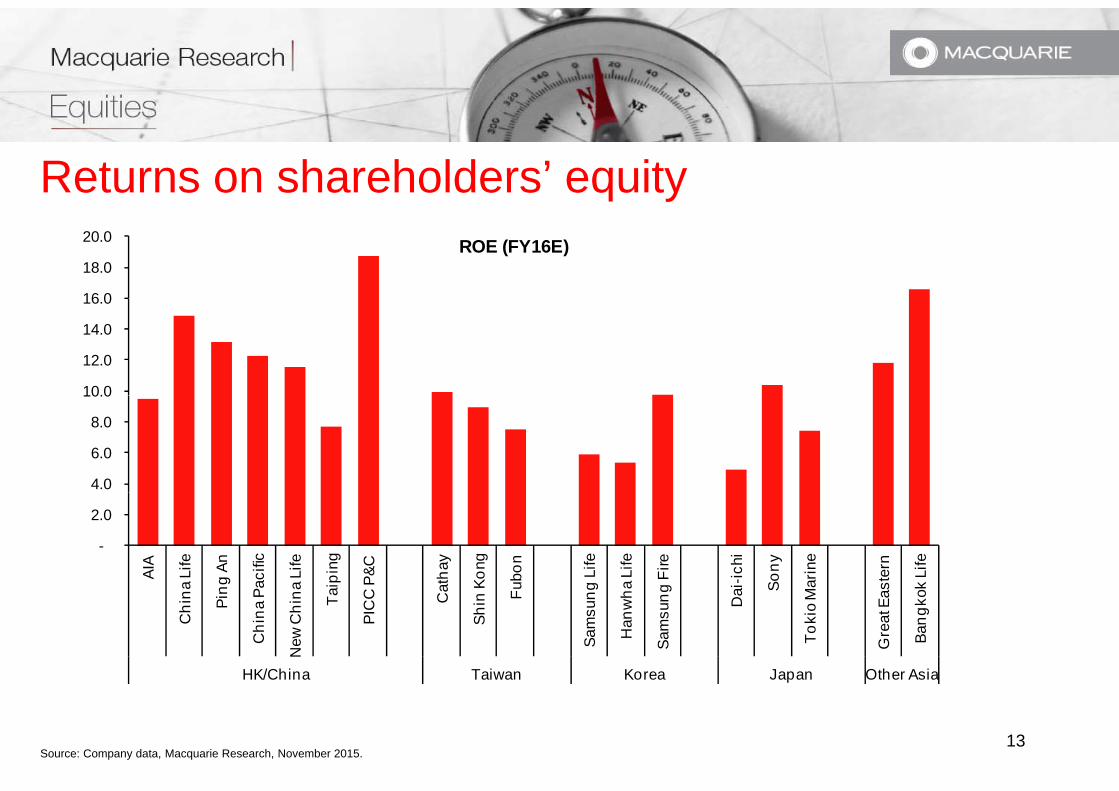
Returns on shareholders’ equityy
16 0
18.0
20.0 ROE (FY16E)
10.0
12.0
14.0
16.0
4.0
6.0
8.0
10.0
-
2.0
AIA
a Li
fe
ng A
n
Paci
fic
a Li
fe
aipi
ng
C P
&C
atha
y
Kong
ubon
g Li
fe
a Li
fe
g Fi
re
ai-ic
hi
Sony
Mar
ine
ster
n
k Li
fe
Chi
n Pin
Chi
na P
New
Chi
na Ta
PIC
C Ca
Shin
F
Sam
sun g
Han
wh
Sam
sung Da S
Toki
o M
Gre
at E
as
Bang
ko
HK/China Taiwan Korea Japan Other Asia
Source: Company data, Macquarie Research, November 2015. 13
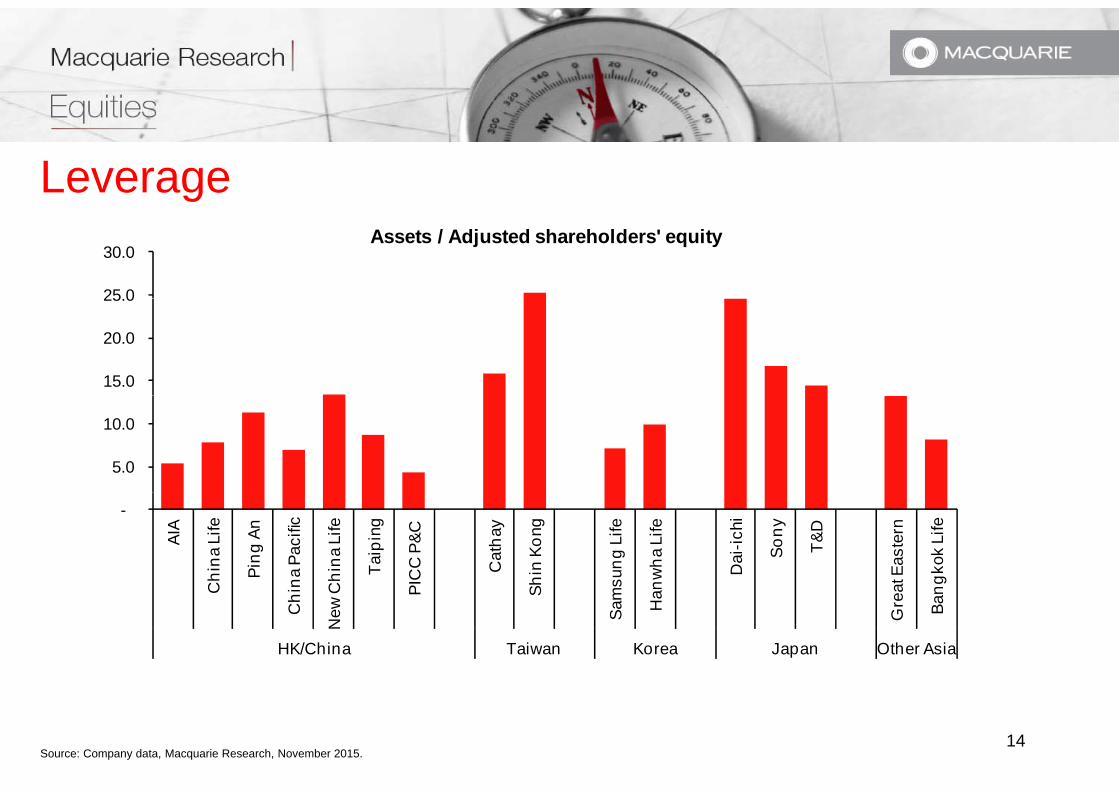
Leverageg
25 0
30.0 Assets / Adjusted shareholders' equity
15.0
20.0
25.0
5.0
10.0
-
AIA
Chi
na L
ife
Ping
An
na P
acifi
c
Chi
na L
ife
Taip
ing
PIC
C P
&C
Cat
hay
Shin
Kon
g
msu
ng L
ife
nwha
Life
Dai
-ichi
Sony
T&D
at E
aste
rn
ngko
k Li
fe
C
Chi
New
C P S
Sam Ha
Gre
a
Ban
HK/China Taiwan Korea Japan Other Asia
Source: Company data, Macquarie Research, November 2015. 14
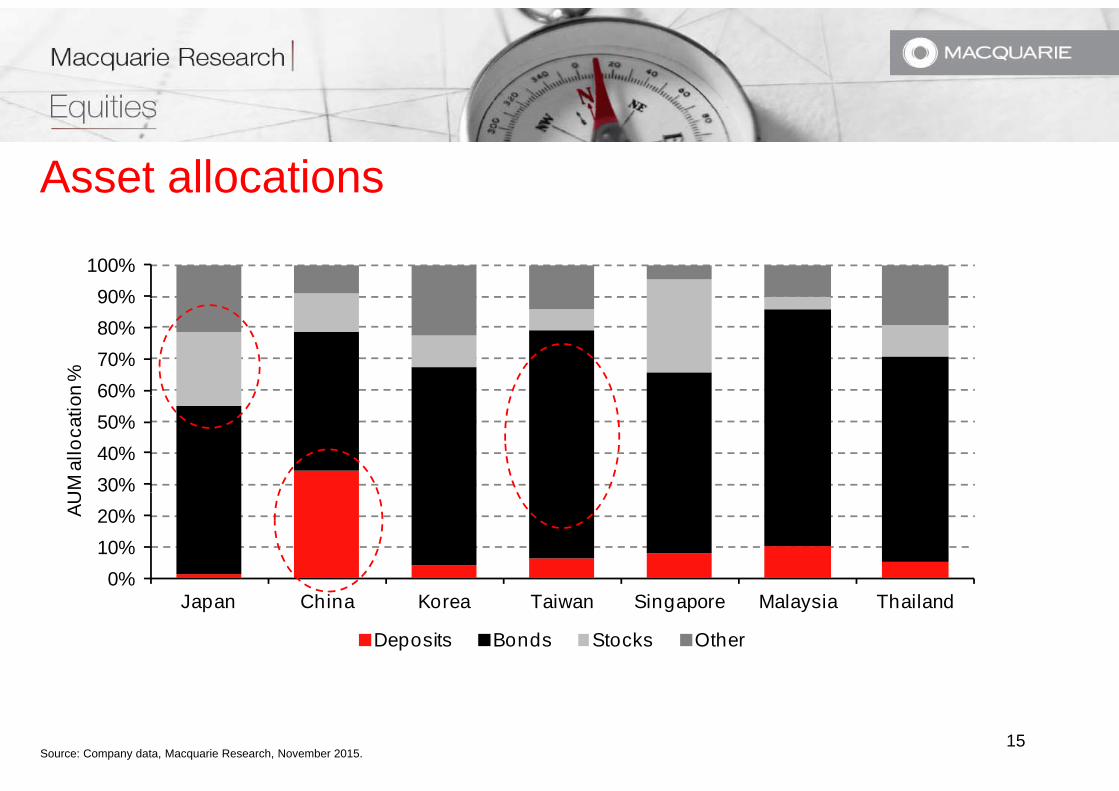
Asset allocations
90%100%
60%70%80%90%
n %
30%40%50%60%
UM
allo
catio
0%10%20%AU
Japan China Korea Taiwan Singapore Malaysia Thailand
Deposits Bonds Stocks Other
Source: Company data, Macquarie Research, November 2015. 15
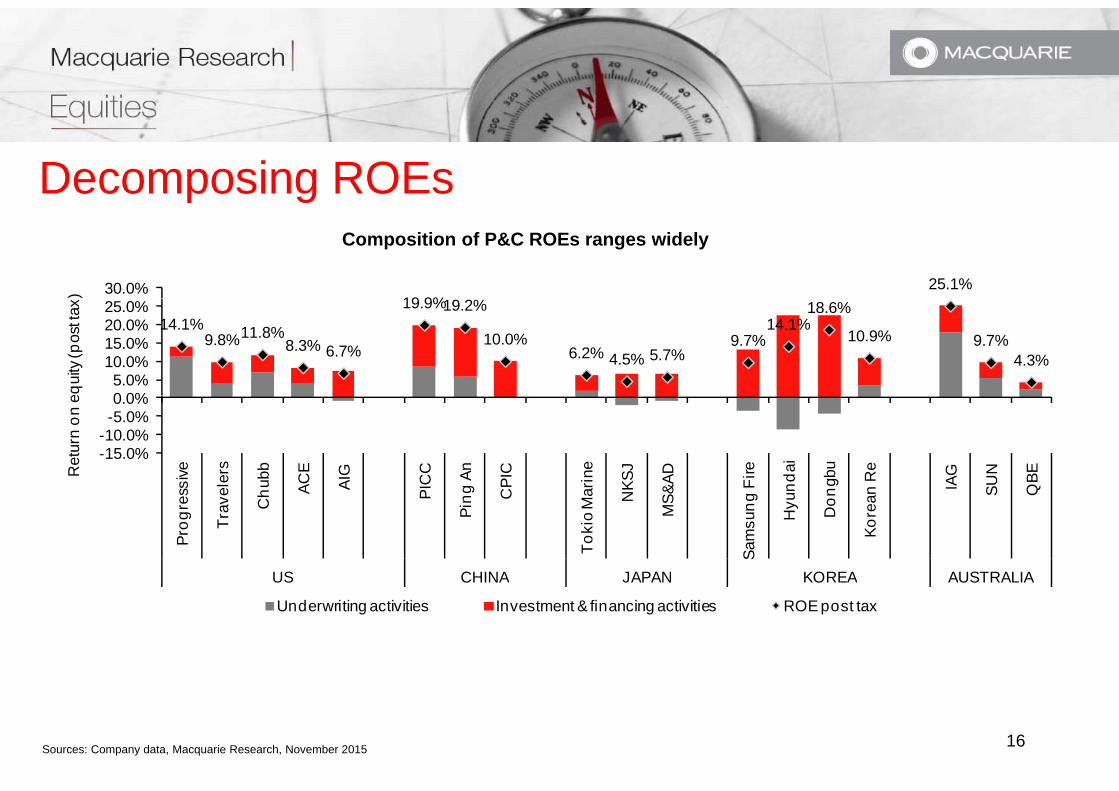
Decomposing ROEsp gComposition of P&C ROEs ranges widely
19 9%25.1%30.0%)
14.1%9.8%11.8%
8.3% 6.7%
19.9%19.2%
10.0%6.2% 4.5% 5.7%
9.7%14.1%
18.6%
10.9% 9.7%4.3%
0 0%5.0%
10.0%15.0%20.0%25.0%
equi
ty (p
ost t
ax
-15.0%-10.0%-5.0%0.0%
ssive
eler
s
hubb
ACE
AIG
PIC
C
g An
CPI
C
arin
e
NKS
J
&AD
Fire
ndai
ngbu
n R
e
IAG
SUN
QBER
etur
n on
e
Prog
res
Trav
e
Ch A P
Ping C
Toki
o M
a N
MS&
Sam
sung Hyu Do n
Kore
an S Q
US CHINA JAPAN KOREA AUSTRALIA
Underwriting activities Investment & financing activities ROE post tax
Sources: Company data, Macquarie Research, November 2015 16
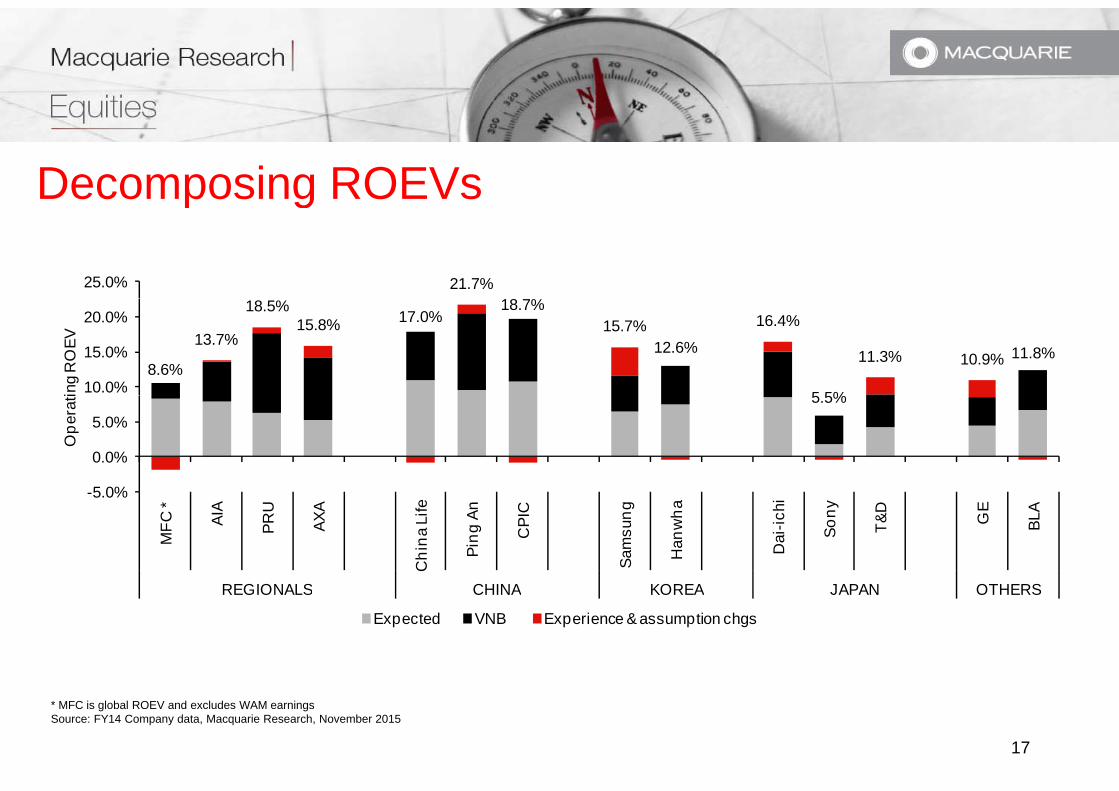
Decomposing ROEVsp g
21.7%%
25.0%
8.6%
13.7%
18.5%15.8% 17.0%
18.7%15.7%
12.6%
16.4%
5 5%
11.3% 10.9% 11.8%
10.0%
15.0%
20.0%
ing
RO
EV
5.5%
5 0%
0.0%
5.0%
Ope
rati
-5.0%
MFC
*
AIA
PRU
AXA
Chi
na L
ife
Ping
An
CPI
C
Sam
sung
Han
wha
Dai
-ichi
Sony
T&D
GE
BLA
REGIONALS CHINA KOREA JAPAN OTHERSREGIONALS CHINA KOREA JAPAN OTHERS
Expected VNB Experience & assumption chgs
* MFC is global ROEV and excludes WAM earningsSource: FY14 Company data, Macquarie Research, November 2015
17
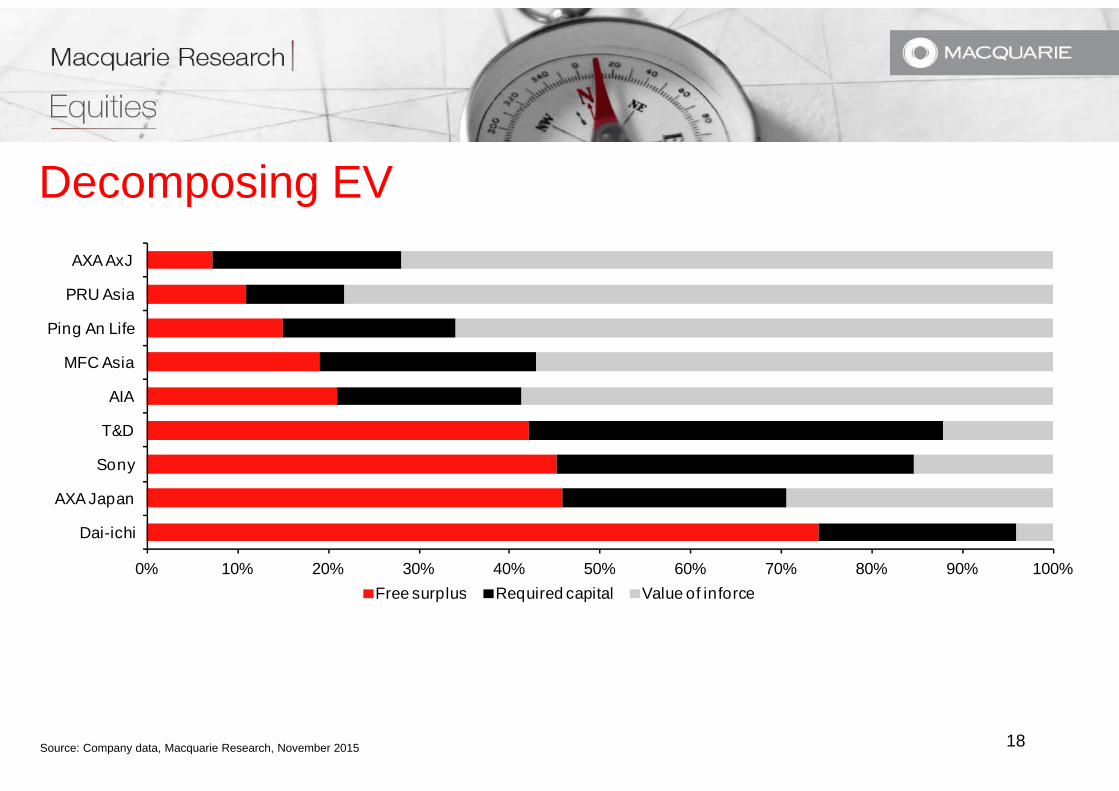
Decomposing EVp g
PRU Asia
AXA AxJ
AIA
MFC Asia
Ping An Life
PRU Asia
Sony
T&D
AIA
0% 10% 20% 30% 40% 50% 60% 70% 80% 90% 100%
Dai-ichi
AXA Japan
F l R i d it l V l f i fFree surplus Required capital Value of inforce
Source: Company data, Macquarie Research, November 2015 18
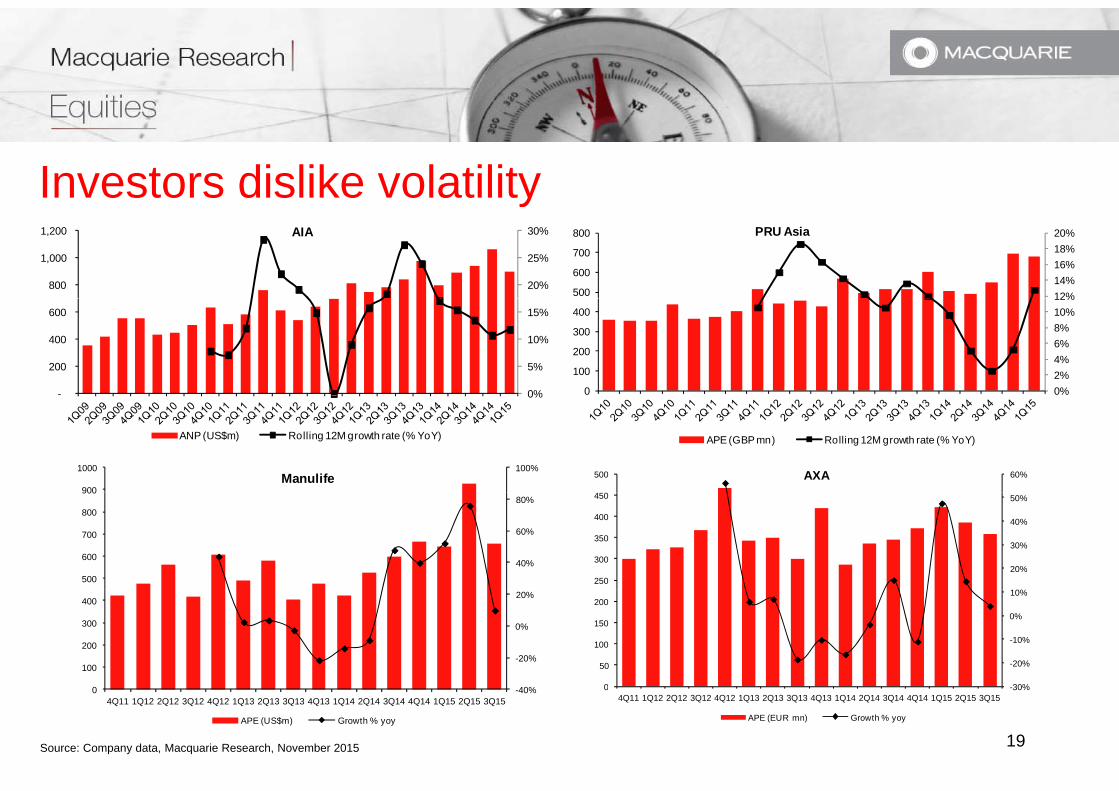
Investors dislike volatilityy
20%
25%
30%
800
1,000
1,200 AIA
12%14%16%18%20%
500
600
700
800 PRU Asia
0%
5%
10%
15%
-
200
400
600
0%2%4%6%8%10%12%
0
100
200
300
400
0%
ANP (US$m) Rolling 12M growth rate (% YoY) APE (GBP mn) Rolling 12M growth rate (% YoY)
100%
900
1000Manulife 60%500 AXA
40%
60%
80%
500
600
700
800
900
20%
30%
40%
50%
250
300
350
400
450
-20%
0%
20%
100
200
300
400
30%
-20%
-10%
0%
10%
0
50
100
150
200
Source: Company data, Macquarie Research, November 2015 19
-40%04Q11 1Q12 2Q12 3Q12 4Q12 1Q13 2Q13 3Q13 4Q13 1Q14 2Q14 3Q14 4Q14 1Q15 2Q15 3Q15
APE (US$m) Growth % yoy
-30%04Q11 1Q12 2Q12 3Q12 4Q12 1Q13 2Q13 3Q13 4Q13 1Q14 2Q14 3Q14 4Q14 1Q15 2Q15 3Q15
APE (EUR mn) Growth % yoy
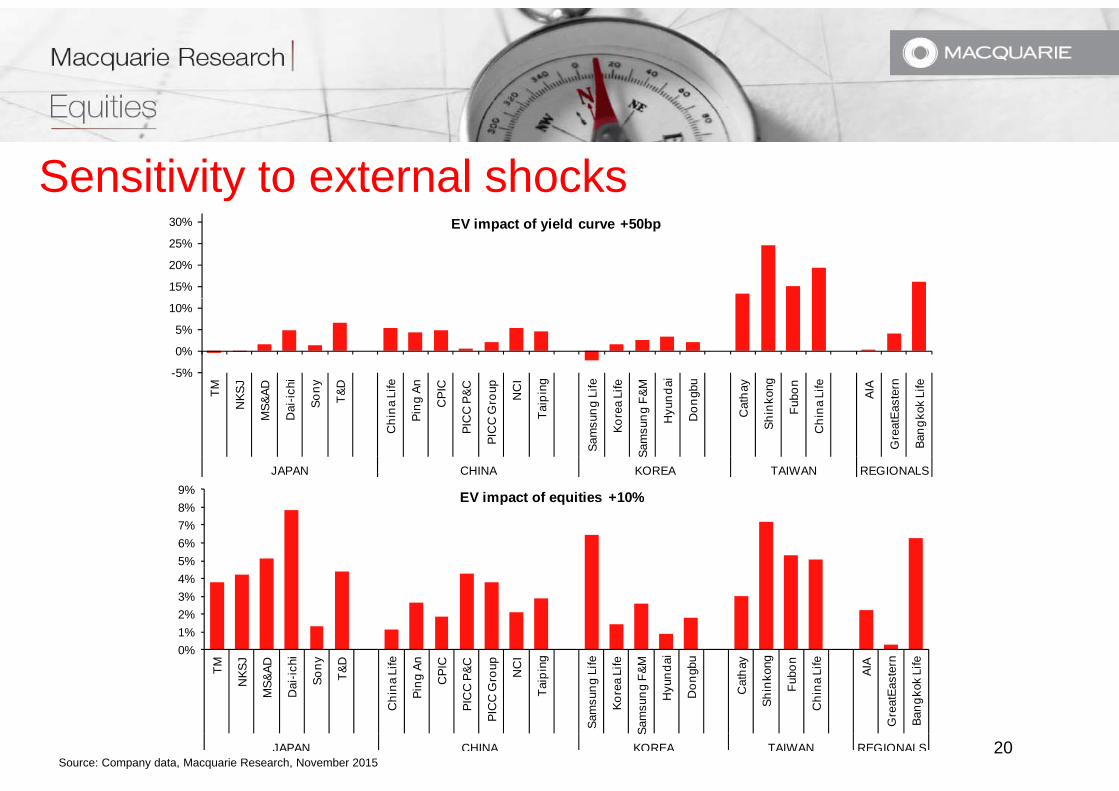
Sensitivity to external shocks
15%
20%
25%
30% EV impact of yield curve +50bp
-5%
0%
5%
10%
TM KSJ
AD chi
ony
&D Life An PIC
&C oup
NC
I
ing
Life
Life &M da
i
gbu
hay
ong
bon
Life
AIA ern
Life
9% EV i t f iti 10%
T
NK
MS&
A
Dai
-i So T
Chi
na L
Ping
CP
PIC
C P
&
PIC
C G
ro N
Taip
Sam
sung
L
Kore
a L
Sam
sung
F&
Hyu
n
Don
g
Cat
h
Shin
ko
Fub
Chi
na L A
Gre
atEa
st
Bang
kok
L
JAPAN CHINA KOREA TAIWAN REGIONALS
4%5%6%7%8%9% EV impact of equities +10%
0%1%2%3%
TM
NKS
J
S&AD
ai-ic
hi
Sony
T&D
na L
ife
ng A
n
CPI
C
C P
&C
Gro
up NC
I
aipi
ng
g Li
fe
ea L
ife
g F&
M
unda
i
ongb
u
atha
y
nkon
g
Fubo
n
na L
ife AIA
aste
rn
ok L
ife
Source: Company data, Macquarie Research, November 201520
MS
Da
Chi
n Pin
PIC
C
PIC
C G Ta
Sam
sun
Kore
Sam
sung Hy Do C
Shi n F
Chi
n
Gre
atEa
Bang
ko
JAPAN CHINA KOREA TAIWAN REGIONALS
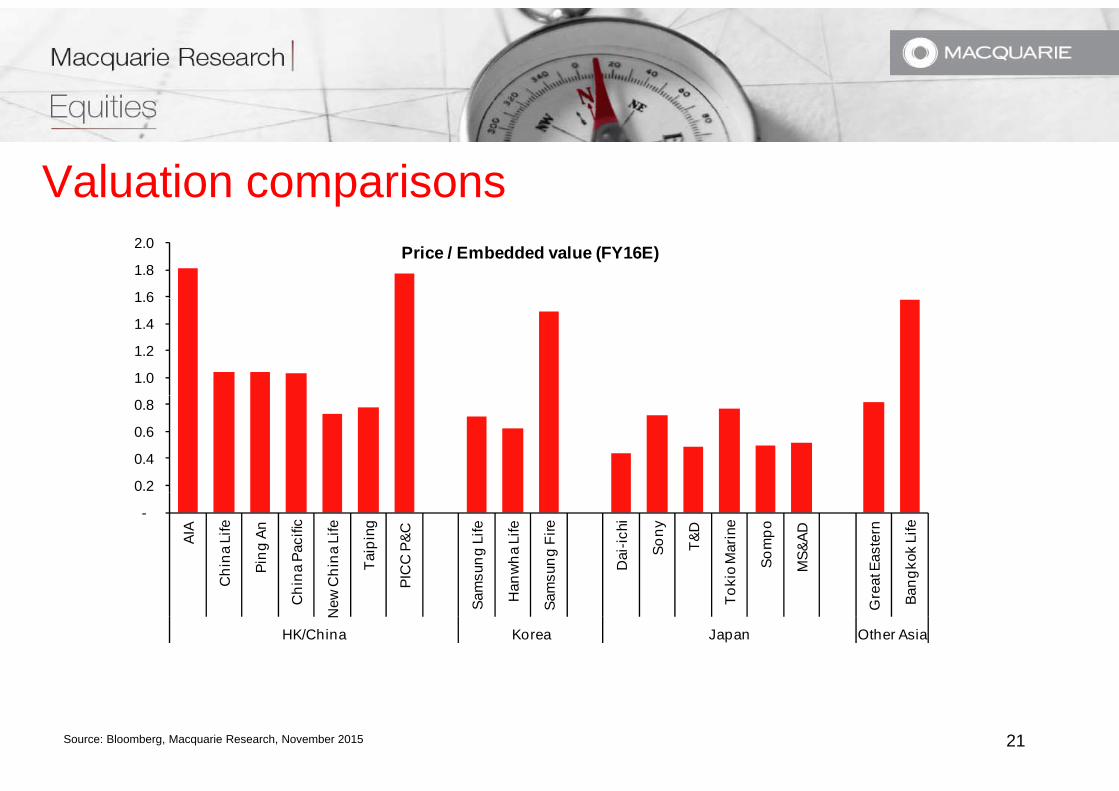
Valuation comparisonsp
1 6
1.8
2.0 Price / Embedded value (FY16E)
1.0
1.2
1.4
1.6
0.2
0.4
0.6
0.8
-
AIA
Chi
na L
ife
Ping
An
hina
Pac
ific
Chi
na L
ife
Taip
ing
PIC
C P
&C
msu
ng L
ife
anw
ha L
ife
msu
ng F
ire
Dai
-ichi
Sony
T&D
okio
Mar
ine
Som
po
MS&
AD
eat E
aste
rn
angk
ok L
ife
Ch
New
Sam Ha
Sam
To Gre Ba
HK/China Korea Japan Other Asia
Source: Bloomberg, Macquarie Research, November 2015 21
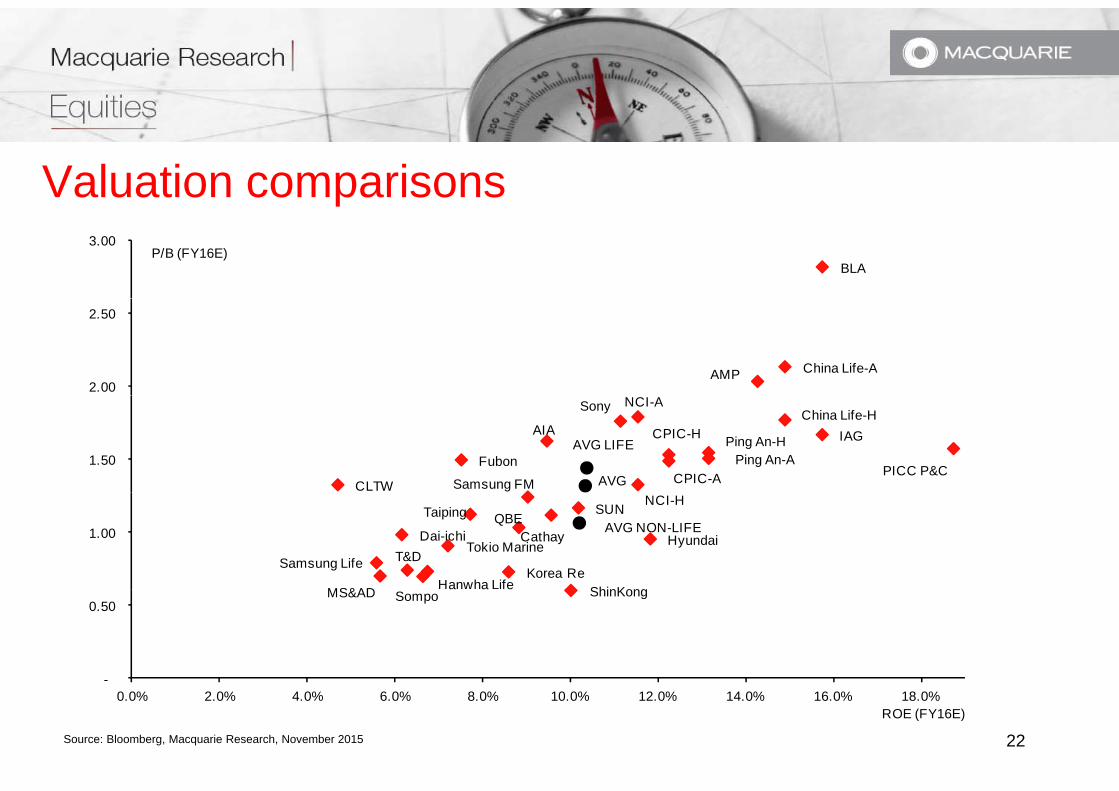
Valuation comparisonspBLA
3.00 P/B (FY16E)
China Life-AAMP2.00
2.50
China Life-H
Ping An-HCPIC-HAIA
Ping An-ACPIC-A
NCI-A
Fubon
CLTW
Sony
AVG LIFE
PICC P&CSamsung FM
IAG
AVG1.50
NCI-HTaiping
ShinKong
Cathay
Hanwha LifeSamsung Life
Dai-ichiT&D
Hyundai
Korea Re
Tokio Marine
MS&AD
QBESUN
AVG NON-LIFE1.00
ShinKonga a eMS&AD Sompo
-
0.50
Source: Bloomberg, Macquarie Research, November 2015 22
0.0% 2.0% 4.0% 6.0% 8.0% 10.0% 12.0% 14.0% 16.0% 18.0%ROE (FY16E)
Agendag
1. Overview
2. Quantitative factors
3. Qualitative factors
4. Putting it together
5. Summary
23
Qualitative factors Business quality Management qualityg q y Corporate governance Corporate transparency Regulatory direction Regulatory direction Thematics
24
Business quality is subjectiveq y j Product mix Agent productivityAgent productivity Policy term & typical persistency Premium payment terms Margins Margins IRR
25
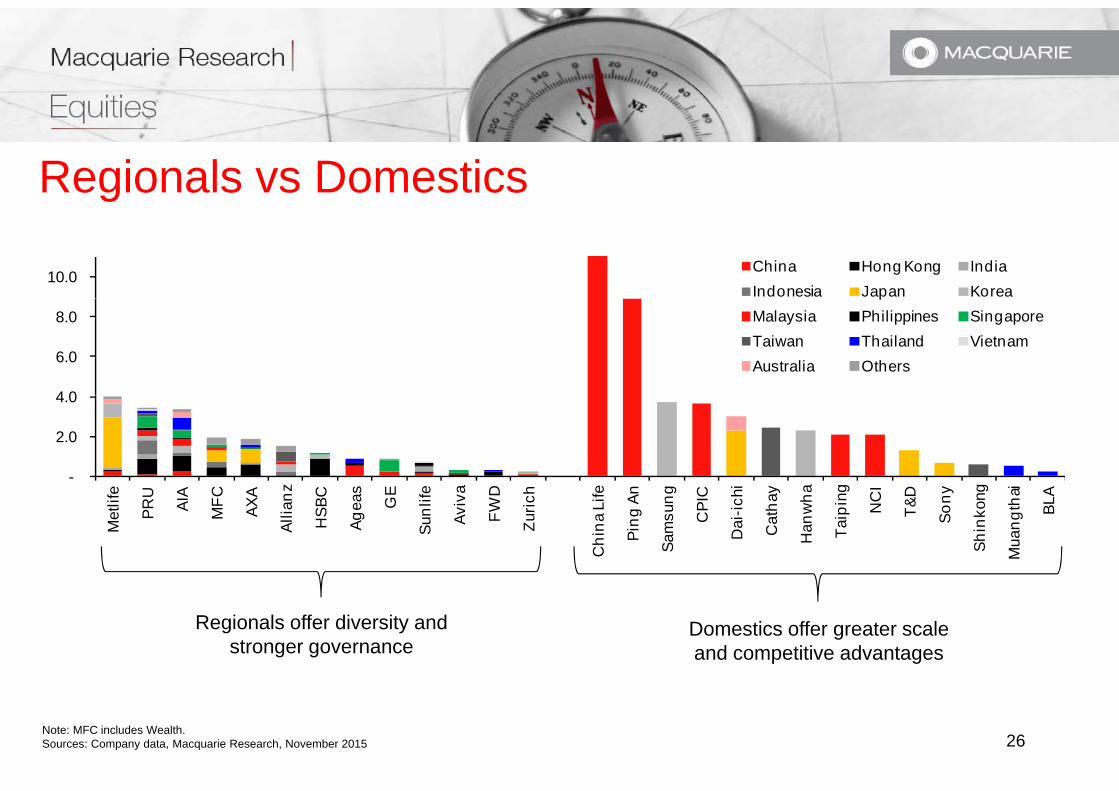
Regionals vs Domesticsg
10.0 China Hong Kong IndiaIndonesia Japan Korea
4 0
6.0
8.0 p
Malaysia Philippines SingaporeTaiwan Thailand VietnamAustralia Others
-
2.0
4.0
e U A C A z C s E e a D h e n g C hi y a g CI D y g ai A
Met
life
PRU
AIA
MFC AX
A
Allia
n
HSB
C
Agea
s
GE
Sunl
ife
Aviv
a
FWD
Zuric
h
Chi
na L
ife
Ping
An
Sam
sung
CPI
C
Dai
-ich
Cat
hay
Han
wh
Taip
in NC
T&D
Sony
Shin
kon
Mua
ngth
a
BLA
Regionals offer diversity and stronger governance
Domestics offer greater scale and competitive advantages
Note: MFC includes Wealth.Sources: Company data, Macquarie Research, November 2015 26
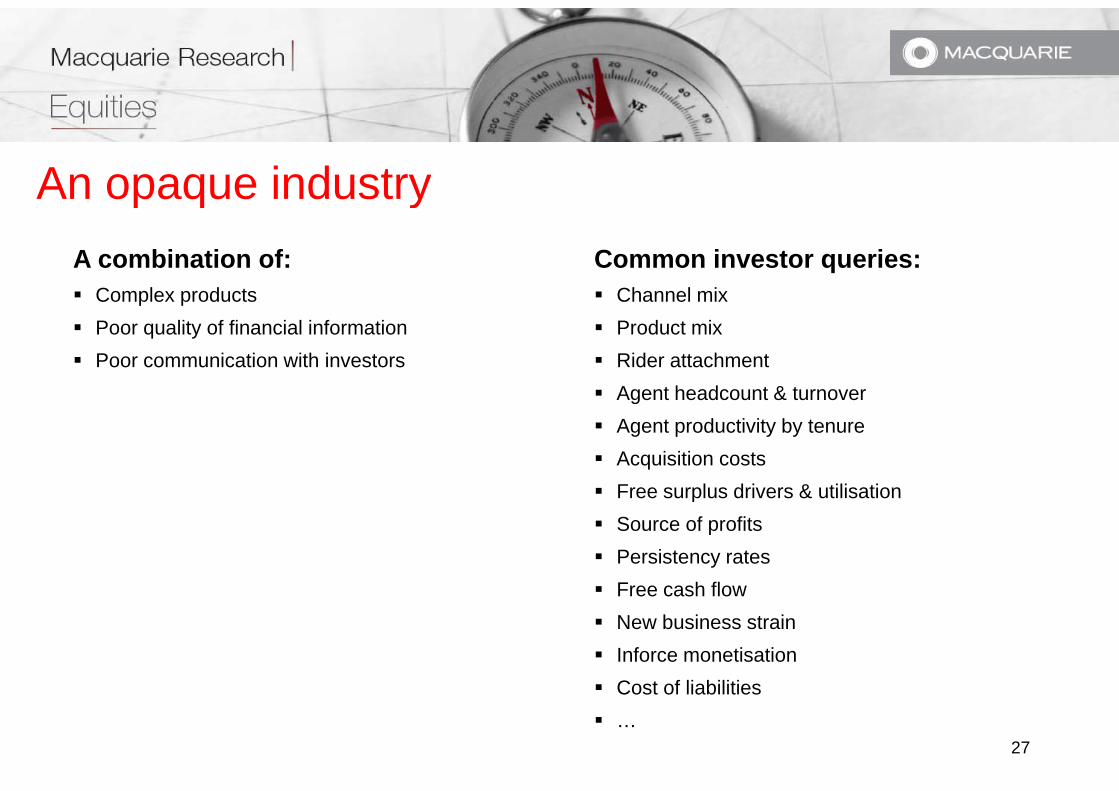
An opaque industryp q yA combination of: Complex products
Common investor queries: Channel mixComplex products
Poor quality of financial information Poor communication with investors
Channel mix Product mix Rider attachment Agent headcount & turnover Agent headcount & turnover Agent productivity by tenure Acquisition costs Free surplus drivers & utilisation Free surplus drivers & utilisation Source of profits Persistency rates Free cash flow Free cash flow New business strain Inforce monetisation Cost of liabilities
27
Cost of liabilities …
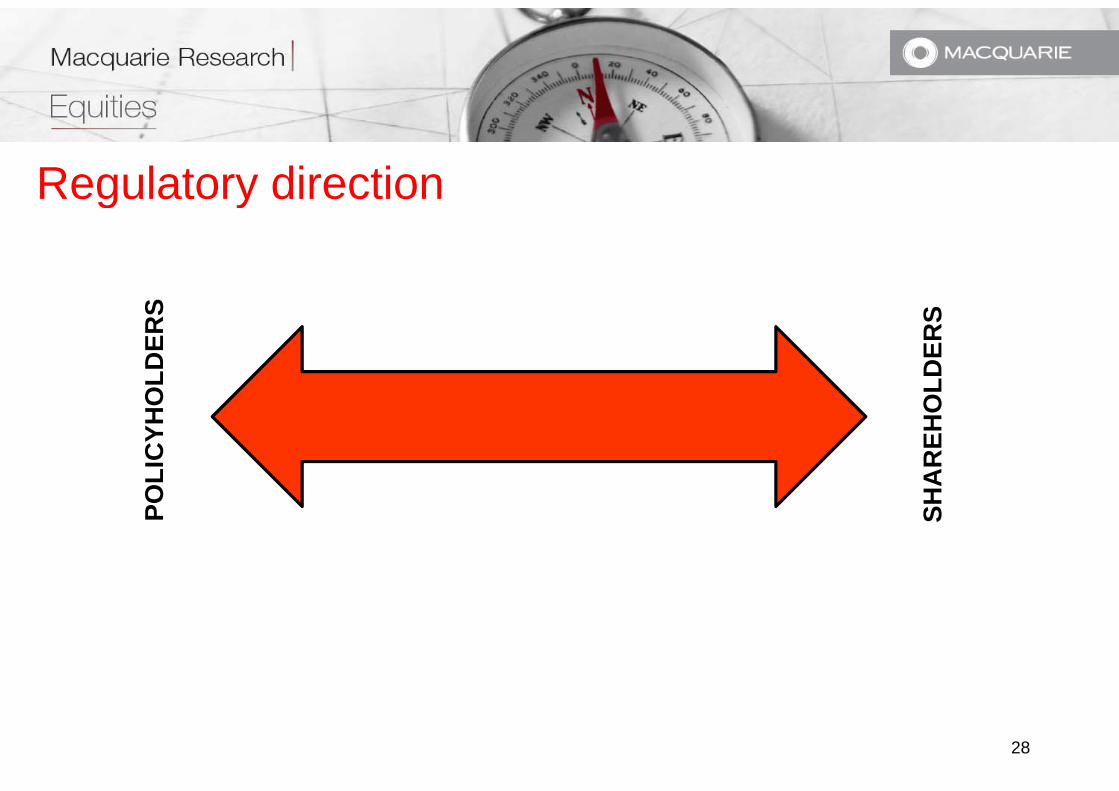
Regulatory directiong yO
LDER
S
OLD
ERS
OLI
CYH
O
HA
REH
O
PO SH
28
Thematics
What long-term themes will drive the market?
Demographics Government policy & reformsGovernment policy & reforms New market opportunities Agent professionalism
P t ti b k t Penetrating bank customers Technology & the internet Recruitment
29
Agendag
1. Overview
2. Quantitative factors
3. Qualitative factors
4. Putting it together
5. Summary
30
Investor conundrums Asia offers some of the most and least attractive insurance markets globally
Which countries offer the best/worst investment opportunities?
Life or Non-life?
Growth or value? What holding period?
What changes will regulators and Government make?What changes will regulators and Government make?
Where are stock markets, FX rates and interest rates going?
What is the right price to buy/sell?
31
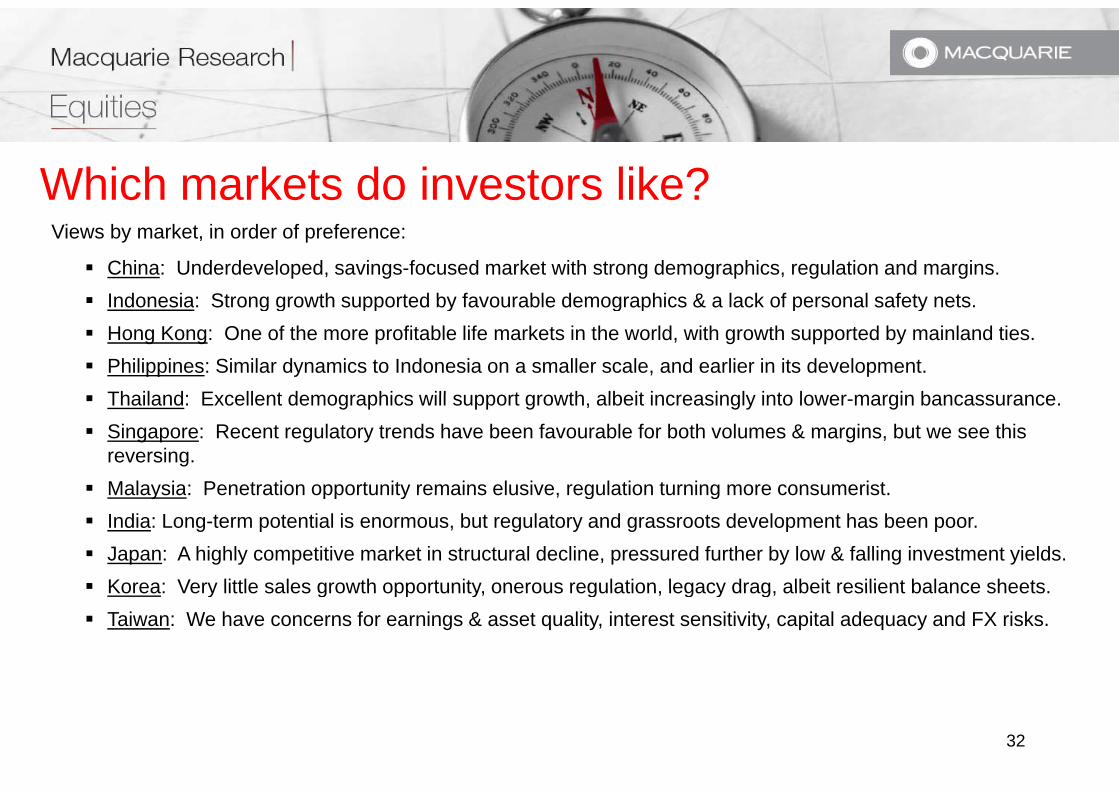
Which markets do investors like?Views by market, in order of preference:
China: Underdeveloped, savings-focused market with strong demographics, regulation and margins. Indonesia: Strong growth supported by favourable demographics & a lack of personal safety nets Indonesia: Strong growth supported by favourable demographics & a lack of personal safety nets. Hong Kong: One of the more profitable life markets in the world, with growth supported by mainland ties. Philippines: Similar dynamics to Indonesia on a smaller scale, and earlier in its development. Thailand: Excellent demographics will support growth albeit increasingly into lower margin bancassurance Thailand: Excellent demographics will support growth, albeit increasingly into lower-margin bancassurance. Singapore: Recent regulatory trends have been favourable for both volumes & margins, but we see this
reversing. Malaysia: Penetration opportunity remains elusive regulation turning more consumeristMalaysia: Penetration opportunity remains elusive, regulation turning more consumerist. India: Long-term potential is enormous, but regulatory and grassroots development has been poor. Japan: A highly competitive market in structural decline, pressured further by low & falling investment yields. Korea: Very little sales growth opportunity onerous regulation legacy drag albeit resilient balance sheetsKorea: Very little sales growth opportunity, onerous regulation, legacy drag, albeit resilient balance sheets. Taiwan: We have concerns for earnings & asset quality, interest sensitivity, capital adequacy and FX risks.
32
Investor (mis)perceptions( )p p• Ageing population is good for life insurers
• Protection products are high quality. Savings products are low quality
• Bancassurance is largely deposit replacement
• Wealth management is low margin
• The internet will eventually disrupt traditional insurance modelsThe internet will eventually disrupt traditional insurance models
• Japan is saturated and therefore offers no growth
• IFRS earnings & capital suffer from rising interest rates
&C• Emerging P&C markets are usually irrational
33

In summaryy
34