ASIAN DEVELOPMENT BANK - OECD. · PDF fileIT − information technology NDBSL −...
46
ASIAN DEVELOPMENT BANK PPA: SRI 24272 PROJECT PERFORMANCE AUDIT REPORT ON THE SECOND SMALL AND MEDIUM INDUSTRIES PROJECT (Loan 1084-SRI[SF]) IN SRI LANKA August 2003
Transcript of ASIAN DEVELOPMENT BANK - OECD. · PDF fileIT − information technology NDBSL −...
ASIAN DEVELOPMENT BANK PPA: SRI 24272
PROJECT PERFORMANCE AUDIT REPORT
ON THE
SECOND SMALL AND MEDIUM INDUSTRIES PROJECT (Loan 1084-SRI[SF])
IN
SRI LANKA
August 2003
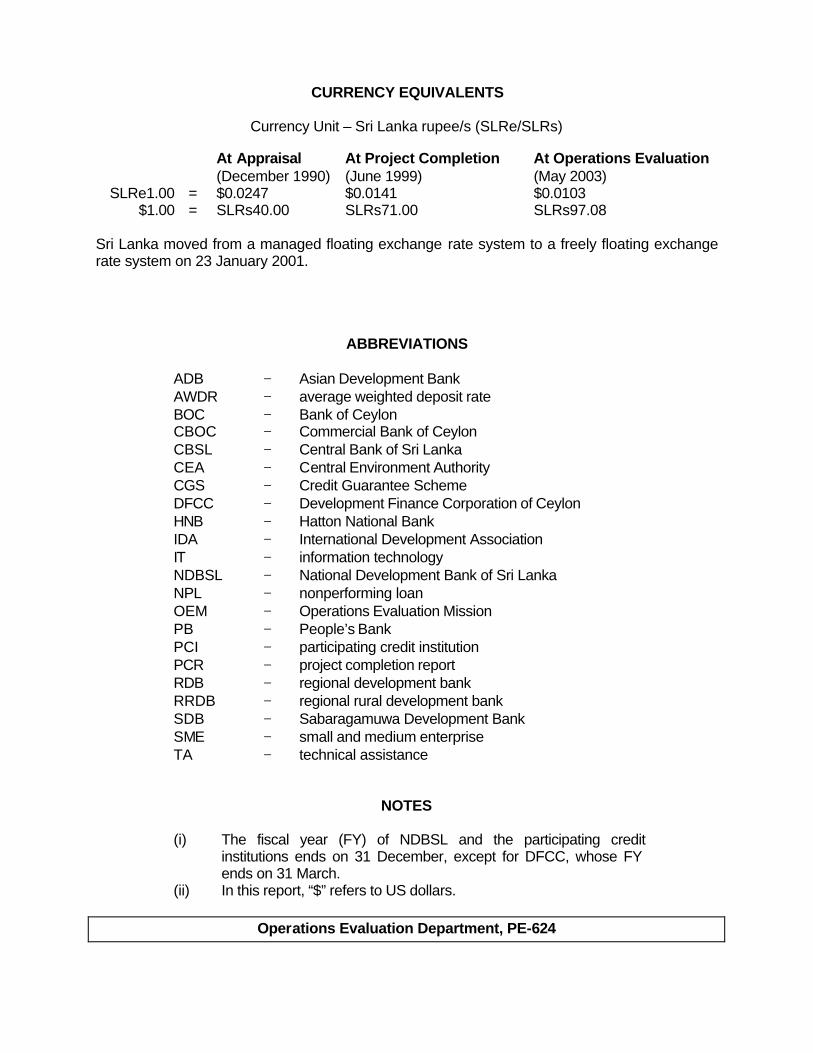
CURRENCY EQUIVALENTS
Currency Unit – Sri Lanka rupee/s (SLRe/SLRs)
At Appraisal At Project Completion At Operations Evaluation (December 1990) (June 1999) (May 2003) SLRe1.00 = $0.0247 $0.0141 $0.0103
$1.00 = SLRs40.00 SLRs71.00 SLRs97.08 Sri Lanka moved from a managed floating exchange rate system to a freely floating exchange rate system on 23 January 2001.
ABBREVIATIONS
ADB − Asian Development Bank AWDR − average weighted deposit rate BOC − Bank of Ceylon CBOC − Commercial Bank of Ceylon CBSL − Central Bank of Sri Lanka CEA − Central Environment Authority CGS − Credit Guarantee Scheme DFCC − Development Finance Corporation of Ceylon HNB − Hatton National Bank IDA − International Development Association IT − information technology NDBSL − National Development Bank of Sri Lanka NPL − nonperforming loan OEM − Operations Evaluation Mission PB − People’s Bank PCI − participating credit institution PCR − project completion report RDB − regional development bank RRDB − regional rural development bank SDB − Sabaragamuwa Development Bank SME − small and medium enterprise TA − technical assistance
NOTES
(i) The fiscal year (FY) of NDBSL and the participating credit institutions ends on 31 December, except for DFCC, whose FY ends on 31 March.
(ii) In this report, “$” refers to US dollars.
Operations Evaluation Department, PE-624
CONTENTS
Page BASIC DATA iii EXECUTIVE SUMMARY iv MAP vii I. BACKGROUND 1 A. Rationale 1 B. Formulation 1 C. Purpose and Outputs 2 D. Cost, Financing, and Executing Arrangements 2 E. Completion and Self-Evaluation 3 F. Operations Evaluation 3 II. PLANNING AND IMPLEMENTATION PERFORMANCE 4 A. Formulation and Design 4 B. Achievement of Outputs 5 C. Cost and Scheduling 5 D. Procurement and Construction 6 E. Organization and Management 6 III. ACHIEVEMENT OF PROJECT PURPOSE 7 A. Operational Performance 7 B. Performance of the Operating Entities 7 C. Financial and Economic Reevaluation 10 D. Sustainability 10 IV. ACHIEVEMENT OF OTHER DEVELOPMENT IMPACTS 11 A. Socioeconomic Impact 11 B. Environmental Impact 11 C. Impact on Institutions and Policy 11 V. OVERALL ASSESSMENT 13 A. Relevance 13 B. Efficacy 13 C. Efficiency 13 D. Sustainability 14 E. Institutional Development and Other Impacts 14 F. Overall Project Rating 14 G. Asian Development Bank and Borrower Performance 14
ii
VI. LESSONS, ISSUES, AND FOLLOW-UP ACTIONS 15 A. Lessons Learned 15 B. Key Issues for the Future 15 C. Follow-Up Actions 17 APPENDIXES 1. Characteristics of Subloans 18 2. Regionwise Distribution of Subloans 19 3. Number and Amount of Subloans Made and Utilization by the 20 Participating Credit Institution 4. Project Framework 21 5. Borrower Profile Matrix 25 6. National Development Bank of Sri Lanka 26 7. Financial Performance of Participating Credit Institutions 32 8. Financial Internal Rate of Return Computations 38
BASIC DATA Loan 1084-SRI(SF): Second Small and Medium Industries Project
Project Preparation/Institution Building TA No. TA Name Type Person-
Months Amount ($’000)
Approval Date
TA 1519-SRI Study of Small and Medium Industries Development Policies and Strategies 1
ADTA 24 238 30 May 1991
TA 1520-SRI Institutional Strengthening of Credit Information Bureau of Sri Lanka1
ADTA 4 1102 30 May 1991
As per ADB Key Project Data ($ million) Loan Documents Actual ADB Loan Amount/Utilization 30.003 28.84
(SDR million) 22.37 20.06 ADB Loan Amount/Cancellation 3.10
(SDR million) 2.31 Key Dates Expected Actual Fact-Finding 28 May–8 Jun 1990 Appraisal 26 Nov–12 Dec 1990 Loan Negotiations 8–11 Apr 1991 Board Approval 30 May 1991 Loan Agreement 25 Jun 1991 Loan Effectiveness 4 Oct 1991 4 Oct 1991 First Disbursement 25 Nov 1991 Project Completion 4 Oct 1996 14 Jun 1999 Loan Closing 4 Oct 1996 14 Jun 1999 Months (effectiveness to completion) 60 92 Borrower Democratic Socialist Republic of Sri Lanka Executing Agency National Development Bank of Sri Lanka Mission Data Type of Mission No. of Missions No. of Person-Days Fact-Finding 1 24 Appraisal 1 85 Project Administration 6 148 Review 5 130 Project Completion 1 18 Operations Evaluation4 1 40
ADB = Asian Development Bank, ADTA= advisory technical assistance, SDR= special drawing rights, TA = technical assistance. 1 Attached to Loan 1084-SRI(SF). 2 The TA was cancelled on 16 May 1992. 3 The International Development Association provided parallel cofinancing through a $31.5 million credit.
Additionally, sponsors of subprojects were to contribute a minimum of 25% of project costs in the form of equity, and participating credit institutions were required to finance 30% of the loanable part of individual project costs.
4 The Mission comprised A. Ibrahim (Evaluation Specialist/Mission Leader), S.A.B.R. Thalakada (Staff Consultant/ Small and Medium Industries Specialist), and D. Wijesekera (Domestic Consultant).
EXECUTIVE SUMMARY
The main objective of the Project was to provide continued support for term financing of viable small and medium enterprise (SME) projects in the private sector, with an emphasis on new export-oriented ventures and on expansion, modernization, and replacement requirements of existing enterprises. In addition, by providing assistance to the Government and the banking sector in allocating appropriate resources to the SME sector through supplementing the long-term resource base of participating credit institutions (PCIs) and strengthening their institutional capabilities for SME lending, the Project was to contribute to the broader objectives of the Government and the Asian Development Bank (ADB): to develop the financial sector and improve its efficiency.
The Project was in keeping with the Government’s priorities in the private sector in general and the SME sector in particular as reflected in the 1989 Revised Industrial Policy Statement. The Project was also consistent with ADB’s operational strategy for Sri Lanka (1992–1995) of supporting a transition toward a more market-oriented economy, with the full participation of the private sector.
The Project was part of a series of external assistance for the SME subsector to Sri Lanka—the fourth for the International Development Association (IDA) and the second for ADB. ADB’s SME and II were cofinanced by IDA.
The ADB financing for the Project was estimated at SDR22.4 million. The Government relent this amount to the National Development Bank of Sri Lanka (NDBSL), the apex institution. The NDBSL onlent the proceeds for financing selected subloans to the PCIs at the average weighted deposit rate prevailing at the time of drawdowns. To cover its administration costs, NDBSL received a fee of 1% of the outstanding loan amount from the Government. The 10 PCIs—five from the private sector, two state-owned financial institutions, and three regional rural development banks—applied rates they considered appropriate. A technical assistance (TA) component of $348,000 (two TAs) was also approved: (i) a study on SME development policies and strategies; and (ii) a study on strengthening the Credit Information Bureau of Sri Lanka, which was later cancelled as its objectives were achieved through assistance provided by the United States Agency for International Development. IDA contributed $31.5 million for the Project. Additionally, sponsors of subprojects were to contribute a minimum of 25% of project costs in the form of equity, and PCIs were required to finance 30% of the loanable part of individual project costs.
The second SME loan became effective on 4 October 1991, with an original project completion date of 4 October 1996. Actual project completion was 14 June 1999—32 months later than expected. The two state-owned banks—Bank of Ceylon (BOC) and the People’s Bank (PB)—chosen for their extensive branch networks were suspended from participation in the Project at the outset because of their failure to meet the eligibility criteria. BOC was reinstated in April 1995 and PB in July 1995, 3.5 years after SME II loan effectiveness. The Operations Evaluation Mission (OEM) confirmed that this was the principal reason behind the Government’s request to extend the original loan closing date.
Despite delays during implementation, the major objective of the Project—to provide continued support for term financing of viable SMI projects in the private sector—was fully met. Evaluation of the Project revealed that the repayment status of the 1,961 subloans of SLRs1469.3 million under the Project is satisfactory with 1,528 subloans repaid in full (77.9%); 227 subloans current (11.6%); 37 subloans rescheduled and regular (1.9%); 23 subloans in
v
arrears (1.1%); 45 subloans claimed under the credit guarantee scheme (2.3%); and legal action being taken in the case of 101 subloans (5.2%).
Neither the apex institution nor the PCIs maintained any records of subloans that were fully repaid by which development impact might be evaluated. To overcome this problem, the OEM carried out an independent survey of 30 subborrowers, three from each PCI. The survey results indicated that there was incremental employment of 878 in 26 subprojects. This was estimated at 34 incremental jobs per subproject, at an investment cost of SLRs8,358 ($87) per job. The incremental value added of 22 subprojects amounted to SLRs153 million ($1.6 million) or SLRs6.9 million ($73,000) per subproject. Data on exports was not available. Projection of these results on subborrowers in remote areas and the three regional rural development banks was not considered appropriate by the OEM, as differences in employment generation and value addition were considerable.
The OEM noted that the Government reduced the combined share in NDBSL of the Treasury, Central Bank of Sri Lanka (CBSL), and state-owned commercial banks from 100% to about 26%. This has resulted in considerable improvements in the portfolio of nonperforming loans. In addition, four of the five PCIs are recording satisfactory profitability and financial positions. The Hatton National Bank, though profitable, is no longer in compliance with ADB financial covenants requiring 1% net return on average assets because of overcapitalization.
The two state-owned banks that had failed to meet the eligibility criteria are being restructured. BOC has improved its financial viability considerably through a reduction of government debt, strengthening of the capital adequacy ratio, increasing ability to withstand political pressure, and preparation of accounts based on international accounting standards. Similarly, despite restructuring of PB, it is still not meeting CBSL’s prudential regulations on capital adequacy and nonperforming loan limit. The lending rates on SME II were positive in real terms. However, the onlending rates were lower than the rates charged by the PCIs to customers who borrowed under other schemes. The OEM was informed that this difference was due to the considerably lower cost of refinance loans for the banks. In addition, the deposit rate is considerably lower than the lending rate in Sri Lanka—giving banks a large spread. This differential was cited as a major impediment to the development of the SME sector by the subborrowers.
The key issues for the future are (i) debt recovery, (ii) onlending rate, (iii) credit guarantee scheme, (iv) monitoring on subloans repaid in full, and (v) need to develop other markets for SME lending.
The key lessons learned are (i) the need to rely on PCIs to evaluate credit risks where such capacity exists, (ii) reliance on financial and economic internal rates of return calculation may restrict the subborrowers to wealthy regions, (iii) continue collection and recording of data pertaining to subprojects, and (iv) consideration needs to be given to the efficacy of attaching to a loan a capacity building TA related to project implementation rather than it preceding loan approval.
The OEM has recommended three follow-up actions: (i) establishment of a small claims court to facilitate recovery of loans, (ii) staff training for the concerned officials in order to facilitate the use of credit guarantee scheme, and (iii) a TA by 2004 for benefits monitoring and evaluation systems within the PCIs for 5 years after project completion.
I. BACKGROUND A. Rationale 1. Sri Lanka's dynamic private industrial sector remains its principal engine of growth. Manufacturing accounts for 17% of gross domestic product and approximately 76% of the country’s total exports. The small and medium industry1 subsector accounts for over 95% of the total number of manufacturing establishments in the country, 55% of total value added, and over 70% of total employment. In particular, small and medium enterprises (SMEs) remain an important source of employment for disadvantaged social groups like women, create jobs at lower investment cost per job relative to large-scale industries, assist in diversifying the production base, and are effectively used to build a cadre of entrepreneurs. 2. Systemic constraints have impacted negatively on Sri Lanka’s SME subsector: limited access to institutional credit and to modern technology, scarce managerial resources, obsolete machinery and equipment, poor marketing, and weaknesses in the Government’s support programs to compensate for these bottlenecks. The Government acknowledged these constraints and, in its 1989 Revised Industrial Policy Statement,2 reemphasized the importance of the private sector as an integral part of its growth strategy in general, with SME development in particular, in conjunction with the need to revamp export incentives, tax reforms, and improve the efficiency of the financial sector. Additionally, SMEs, like the rest of the manufacturing sector, suffered considerably from the long-standing civil conflict. 3. The Government of Sri Lanka requested Asian Development Bank (ADB) assistance for the second time in the SME sector in 1990. The objective was to provide continued support for term financing of viable SME projects in the private sector. The success of ADB’s SME I3 was the rationale for SME II. 4 4. The Government also requested a technical assistance (TA) component of $348,000, comprising two TAs: (i) a study on SME development policies and strategies,5 and (ii) a study on strengthening the Credit Information Bureau of Sri Lanka.6 B. Formulation 5. The Project was part of a series of external assistance for the SME subsector to Sri Lanka—the fourth for the International Development Association (IDA) and the second for ADB. ADB’s SME projects I7 and II8 were both cofinanced by IDA. 6. The ADB loan amount of $30 million equivalent for the Project was based on (i) growth projections for the SME sector requiring an estimated $180 million in short-term credit; and
1 The term small and medium industry has generally been replaced by small and medium enterprise (SME). For the
sake of consistency, this project performance audit report will use SME. 2 The industrial policy statement was issued in March 1987. 3 Loan 873-SRI(SF): Small and Medium Industries Project, for $15 million, approved on 8 December 1987. The
project completion report assessed it generally successful under the three category system of generally successful, partly successful, and unsuccessful.
4 Loan 1084-SRI(SF): Second Small and Medium Industries Project, for $30 million, approved on 30 May 1991. 5 TA 1519-SRI: Study of SMI Development Policies and Strategies, for $238,000, approved on 30 May 1991. 6 TA 1520-SRI: Institutional Strengthening of Credit Information Bureau of Sri Lanka, for $110,000, approved on
30 May 1991. It was cancelled (para. 11). 7 IDA cofinanced SME I with a loan of $18 million comprising $15 mill ion credit and $3 million TA component. 8 IDA cofinanced SME II with a $31.5 million credit.
2
(ii) the assumption that after 25% equity contribution by the sponsors, the financial intermediaries would provide 30% of the loan needs, leaving a financing gap of $90 million. Part of this gap was to be met by the proposed project and part by IDA’s SME IV. Project processing was carried out in close coordination with IDA. Fact-finding (May–June 1990) and appraisal (November–December 1990) were conducted jointly with IDA. C. Purpose and Outputs 7. The primary objective of the Project was to provide the required resources for term financing of viable SME projects in the private sector. The emphasis was to be on new export-oriented ventures and on expansion, modernization, and replacement requirements of existing enterprises. The Project envisaged supporting the Government’s strategy for modernizing and expanding the SME sector by making investment funds more readily available. It was also expected to meet a part of the existing resource gap for SME lending and to provide assistance to the Government and the banking sector in allocating appropriate resources to the SME sector. By supplementing participating credit institutions (PCIs) long-term resource base and strengthening their institutional capabilities for SME term lending, the Project was to contribute to the broader objectives of the Government and ADB: to develop the financial sector and improve its efficiency. D. Cost, Financing, and Executing Arrangements 8. ADB lending for the Project was estimated at SDR22.4 million9 ($30 million equivalent), financed from Special Funds resources. The Government was to relend this amount to the National Development Bank of Sri Lanka (NDBSL), the apex institution. NDBSL would onlend to the PCIs at the average weighted deposit rate10 (AWDR) prevailing at the time of drawdowns by the PCIs for onlending to selected subborrowers. To cover its administration costs, NDBSL received a fee of 1% of the outstanding loan amount from the Government. In addition, onlending by NDBSL to the PCIs was up to 70% of the amount of a PCI loan for a qualified subborrower. The PCIs applied rates they considered appropriate, which could be fixed or variable, including a grace period of 2 years. Seven PCIs headquartered in Colombo were selected—two more than in SME I.11 In addition, three regional rural development banks (RRDBs) in Kandy, Kegalla, and Kurunegala were selected to extend lending to rural areas. 9. The ADB loan was made through an imprest account with the Central Bank of Sri Lanka (CBSL), in which the loan proceeds were deposited and from which the local currency equivalent was disbursed through the NDBSL to the PCIs for onlending to subborrowers. Thus, the exchange risk was borne by the Borrower and not by the PCIs or the subborrowers. 10. An attached TA of $238,000 financed from the TA special funds was to provide consulting services for formulating comprehensive SME development policies and strategies (footnote 5). ADB’s share of the cost comprised $140,000 in foreign exchange and $98,000 in
9 The loan was denominated in special drawing rights. 10 This rate was lower than the rate applicable for SME I, which was 7% lower than the average weighted prim e rate
charged by commercial banks to their prime customers. However, the appraisal report of SME II noted that the AWDR rate was not appropriate for long-term lending but, in the absence of a long-term bond market, AWDR rates were considered appropriate.
11 Five out of the seven were private sector institutions, namely Commercial Bank of Ceylon, Development Finance Corporation of Ceylon, Hatton National Bank, Sampath Bank, and Seylan Bank. The other two were state-owned institutions: Bank of Ceylon and People’s Bank.
3
local currency. The Government’s contribution was estimated at $20,000 in the form of services of counterpart staff, secretarial services, office accommodation, and supplies. E. Completion and Self-Evaluation 11. The project completion report (PCR), circulated on 19 December 2000, rated the Project successful,12 as it met the long-term fund requirements of the SMEs and supported SME development policies and programs. The RRDBs helped distribute funds to 300 subborrowers in the rural areas. The Project helped create about 14,300 jobs, less than the appraisal estimates of 30,000. The loan closing date was extended by nearly 3 years due to slower than expected pace of utilization. This was attributable to the suspension of two state-owned commercial banks due to their inability to meet the eligibility criteria: an annual and cumulative collection ratio of not less than 80% and a portfolio infection ratio13 of not more than 15%.14 The PCR assessed loan utilization satisfactory. The TA on SME development policies and strategies (footnote 5) was assessed as partly successful. However, the TA for strengthening the Credit Information Bureau of Sri Lanka (footnote 6) was cancelled, as its objectives were achieved through assistance from the United States Agency for International Development. 12. The majority of the subborrowers were engaged in (i) agriculture, forestry, and fishing sectors; followed by (ii) food and beverages sector; and (iii) financing and business services sectors together accounting for approximately 49% of the total loan amount (Appendix 1, Table A1.1). Subloan size ranged from SLRs50,000 to SLRs8 million ($200,000); however, over 50% of the loan amount was for loans greater than SLRs2 million (Appendix 1, Table A1.2). Loans in terms of amount were largely made for expansion, modernization, and replacement purposes (65%) relative to the establishment of new businesses (35%) (Appendix 1, Table A1.3) and nearly 52% of the loans had a maturity of up to 5 years (Appendix 1, Table A1.4). The relatively richer western region was the major beneficiary of the Project, accounting for 52% of the total loan amount; and the Wayamba region accounted for 18% of the project loan amount (Appendix 2). Private sector PCIs accounted for 66% of the total number of subloans and 80% of the loan amount. The two state-owned PCIs accounted for 19% of the total number of subloans and 18% of the total loan amount, reflecting that private sector PCIs were more successful in SME lending. The three RRDBs extended only 1.6% of the total loan amount (Appendix 3). The PCR noted that NDBSL was unable to collect ex-post data once loans were fully repaid, as the PCIs did not maintain records for repaid loans.15 In addition, the PCIs did not submit their quarterly reports to their respective head offices on time, while their branches cited the cumbersome procedures associated with the preparation of these reports, without the assistance of computers, as reasons for the delay. F. Operations Evaluation 13. The Operations Evaluation Mission (OEM) visited Sri Lanka from 23 April to 12 May 2003. It held extensive discussions with concerned government agencies, including the Ministry of Finance, Ministry of Industries, CBSL, NDBSL, 10 PCIs, and the beneficiaries (i.e., the subborrowers). Site visits were also undertaken to Kandy, Kurunegala, and Ratnapura—the head offices of the three participating RRDBs. The OEM also met with aid agencies involved in the SME sector. 12 This was rated under the four-category system of highly successful, successful, partly successful, and
unsuccessful. 13 Portfolio infection ratio = (loan portfolio affected by arrears divided by total loan portfolio) multiplied by 100. 14 The eligibility criteria were covenanted (Schedule 4, para. 4 [a] [i] and [ii]) to be achieved by December 1992. 15 NDBSL provided data only on 109 subprojects to the PCR mission, or 5.5% of the total number of subprojects.
4
14. The OEM assessed whether the long-term credit needs of the SME subprojects were met as a result of the Project. The OEM also verified the sustainability of the PCIs and the subprojects, as well as the socioeconomic impact of the subprojects. To overcome the problem associated with lack of ex-post data identified in the PCR, the OEM undertook an independent survey of 30 subborrowers—three from each PCI.16 The identification of the subborrowers was made by the PCIs who had the vital contact information on subborrowers. However, only those subprojects could be selected which remained on their books—subprojects either in arrears or those that had repaid on schedule and taken subsequent loans for further expansion or modernization purposes—a mix of unsuccessful and successful subprojects. Thus, even though funding constraints restricted the OEM sample to about 2% of the total number of subprojects, yet the OEM was of the view that the sample chosen was sufficiently representative in that it consisted of a mix of unsuccessful and successful subprojects.
II. PLANNING AND IMPLEMENTATION PERFORMANCE A. Formulation and Design 15. The Project supported the Government’s strategy for modernizing and expanding the SME sector by making investment funds more readily available. SME development remains a priority of the Government, and the strategy for SME development is part of the country’s national strategy paper, Regaining Sri Lanka. In addition, an estimated 20,000 SMEs are targeted to be set up within the next 5 years.17 The Project was consistent with ADB’s medium-term operational strategy for Sri Lanka (1992–1995) to support a transition toward a more market-oriented economy, with the full participation of the private sector. It remains consistent with ADB’s operational strategy as contained in the country strategy and program update (2002–2004), which highlights the “importance of private sector development in reducing poverty, especially SME development, to create employment for the poor.” 16. The design of the Project closely followed the format developed under IDA’s previous three loans with one exception: the inclusion of the three RRDBs18 as PCIs to support small-scale agro-industries, especially in rural areas. However, because RRDBs possessed limited experience in SME term lending at the time of the Project, their participation was to be on a pilot basis and all their subloan applications were to be subjected to a thorough review and appraisal by NDBSL. The number of subloans actually extended by RRDBs under the Project amounted to 15% of the total and the total amount lent by them comprised a mere 1.6% of the total (Appendix 3). This was considerably lower than the appraisal estimates of around 10% of the total loan amount. The OEM notes that the intent to include the three RRDBs was consistent with ADB’s present overarching objective of poverty reduction. 17. The project design did not identify sector or regionwise distribution of subloans for the PCIs. The OEM found that loans were largely allocated to the relatively rich urban areas of the Western Province, which accounted for educated and information technology (IT) aware
16 A domestic consultant was hired to survey 21 subloans in and around the Colombo area, while the OEM surveyed
nine subloans made by the RRDBs. 17 Loan 1896-SRI, the Sahanya Program, effective 19 September 2002, is a credit assistance project for five PCIs:
Commercial Bank of Ceylon, Hatton National Bank, NDBSL, and Sampath Bank. It provides loans for SMEs with total assets, excluding land and buildings, but including assets financed by loan proceeds, of less than SLRs70 million.
18 Kurunegala RRDB was the only one of the three that had participated previously in such assistance—in IDA’s SME III.
5
subborrowers maintaining good accounting records. In contrast, the typical RRDB subborrower was less educated with little or no IT skills and little or no accounting records. However, the distribution of the loans in terms of major production sectors was relatively even. 18. There was little linkage between the Project’s objective of stimulating exports and the project design, which did not require the subprojects to meet specific targets, such as being export oriented. As a result, the PCIs selected subprojects for financing on the basis of their perception about risks and financial gains associated with the lending—a more financially sound method of selection. B. Achievement of Outputs 19. The project framework in Appendix 4 compares appraisal targets with actual achievements. The OEM verified that a total of 1,961 subloans were allocated under the Project, 82% of the appraisal target of 2,400 subloans. The shortfall was mainly due to (i) the appraisal target was an approximation based on an average amount of $13,000 per subproject, while the actual average amount per subproject was estimated at $14,700; and (ii) cancellation of $3,067,564 of the loan amount after the terminal disbursement date, which if utilized would have funded an additional 209 subprojects. 20. Data on incremental employment and value addition accruing from the subloans was not available, as the PCIs did not maintain records of those subloans that had been repaid in full (para. 12). However, as targets had been established during appraisal, the OEM carried out an independent survey (para.14) to ascertain incremental employment and value addition. 21. The independent survey results indicated that there was incremental employment of 878 people in 26 subprojects (Appendix 5). This averaged at 34 incremental jobs per subproject, at an investment cost of SLRs8,358 ($87) per job. The incremental value added of 22 subprojects amounted to SLRs153 million ($1.6 million) or SLRs6.9 million ($73,000) per subproject. Projection of these results on other subprojects for which data was not available, particularly subborrowers in remote areas and the RRDB-funded subprojects, was not considered appropriate, as the OEM’s survey results were not based on a representative sample.19 The OEM was unable to collect any data on exports from the surveyed subprojects. C. Cost and Scheduling 22. As mentioned in para. 8, the original loan amount was SDR22.4 million ($30 million equivalent). At completion, actual disbursements amounted to SDR20.1 million ($28.8 million equivalent).20 The undisbursed balance of SDR2.3 million, about 10% of the appraisal estimate of the loan, was cancelled from the loan account on 14 June 1999. The cancelled amount of $3.1 million equivalent, after the terminal date of disbursement, was due to cancellations of 136 subloans and undisbursed balances as a result of the devaluation of the Sri Lanka rupee against the dollar during implementation. 23. The SME II loan became effective on 4 October 1991, with an original project completion date of 4 October 1996. Actual project completion was 14 June 1999—32 months later than
19 These subprojects financed by RRDBs constituted 30% of the OEM sample by number compared with about
15% subprojects financed under the Project. 20 The actual loan amount in dollar equivalent increased to $31.9 million due to the depreciation of SDR against the
dollar.
6
expected. The two state-owned banks—People’s Bank (PB) and the Bank of Ceylon (BOC)—chosen for their extensive branch networks, were the major conduits for ADB’s first SME loan, accounting for around 37% of the total loan amount. However, during implementation of SME I, PB and BOC were suspended because of their inability to meet the eligibility criteria (para. 11). The appraisal mission for SME II was aware of PB and BOC’s failure to meet these criteria; however, after receiving assurances from the Government that it would formulate and implement a phased restructuring program for the two banks, ADB agreed to their continued participation in the Project. Their share of the total number of subloans declined to 19% and, in terms of the total loan amount, to 18% (Appendix 3). BOC was reinstated in April 1995 and PB in July 1995, 4 years after SME II loan effectiveness. The OEM confirmed that this was the principal reason behind the Government’s request to extend the original loan closing date for commitment of the loan in October 1994 and disbursement in October 1996 by 1 year—to October 1995 and October 1997, respectively. 24. Managerial and technical problems associated with lack of experience of some of the PCIs, especially the three RRDBs included on a pilot basis (para. 16), resulted in further delays and subloan cancellations. The Government requested a further 1-year extension. ADB agreed to the new deadline of 4 October 1996 for loan commitment and 4 October 1998 for loan disbursement. After the completion of the TA report, the Government requested that savings of $7,834 from the attached TA be used to engage a short-term consultant on a study of SME financing mechanisms, to which ADB agreed. D. Procurement and Construction 25. ADB established procedures that applied to procurement of goods and services financed out of the proceeds of the loan to the subborrowers. These included the apex institution ensuring and certifying in its quarterly reports to ADB that the “goods and services to be financed by any subloan are to be purchased at reasonable and competitive prices, account also being taken of the reliability of the goods, their suitability for the qualified project and the availability of maintenance facilities and spare parts, and, in the case of services, the quality and competence of the parties rendering them” (Schedule 5, para. 3). The OEM confirmed that procurement under the subprojects was undertaken satisfactorily. E. Organization and Management 26. The SME Policy Coordination Committee, established under IDA SME I and operating under IDA SME II and III and ADB SME I, was responsible for the overall implementation of the Project. It was chaired by the secretary of the Ministry of Industries, Science and Technology, and its membership included the secretaries of Ministry of Finance, Ministry of Handlooms and Textile Industries, Ministry of Tourism and Rural Industries Development, and representatives from CBSL, Export Development Board, NDBSL, Central Environment Authority (CEA), SME Chamber of Commerce, and the 10 PCIs. The secretary of the committee was provided by the Ministry of Policy, Planning, and Implementation. The OEM considered the constitution of the committee appropriate. 27. Due to experience gained during the implementation of SME I, NDBSL performed its role as the apex institution adequately for SME II.
7
III. ACHIEVEMENT OF PROJECT PURPOSE
A. Operational Performance 28. The OEM measured the Project’s operational performance against the restructuring of NDBSL (the apex institution), the two state-owned banks, the three RRDBs, and the Development Finance Corporation of Ceylon (DFCC) as covenanted under the Project (Schedule 7, paras. 4 and 5[a] of the Loan Agreement). In addition, a review of all ongoing financial sector reforms was also covenanted (Schedule 7, para. 5[b]). However, financial sector reforms were limited to divestment. At the time of the OEM, government share ownership in NDBSL21 had declined from almost 92% at appraisal to about 25%. It now operates as a private sector development finance institution, and the management is pursuing a policy of reducing its nonperforming loans (NPLs). In order to ensure an independent capital base and thereby guarantee its long-term viability, NDBSL has followed the example of Industrial Credit and Investment Corporation of India and entered the commercial banking arena through purchase of shares in ABN-AMRO in Sri Lanka. NDBSL’s long-term portfolio has dropped due to the adverse investment climate currently prevailing in the country and stood at around SLRs22 billion as of 31 December 2002 (Appendix 6, Table A6.1). NDBSL’s financial performance ratios, summarized in Table 1, have changed marginally since appraisal due to what is considered as continued political intervention in its lending operations.
Table 1: Financial Performance Ratios of the National Development Bank of Sri Lanka (fiscal year ending 31 December)
Item
Appraisal
Project Completion
Operations Evaluation
1990 1995 2000 2002 Return on Average Equity (after tax,%) 10.0 19.7 9.5 13.6 Return on Average Assets (after tax,%) 3.3 4.2 1.4 2.2 Long-Term Debt-Equity Ratio (times) 1.9 2.9 3.8 3.3 Debt-Service Coverage Ratio (times) 2.4 1.8 3.1 3.0 Cash Collection Ratio (%) 91.1 84.0 80.9 Portfolio Infection Ratio (%) 12.1 12.3
= no data available Source: National Development Bank of Sri Lanka. 29. NDBSL was the apex institution for SME I, and appraisal for SME II assessed its performance satisfactory. However, during project implementation, there was considerable opposition by the PCIs to NDBSL’s role as the apex institution, even though NDBSL was not a PCI. The PCIs regarded NDBSL as a competitor empowered to oversee their operations, access their data, and recycle liquidity. Subsequent ADB interventions did not use NDBSL as an apex institution. B. Performance of the Operating Entities 30. The OEM found that the repayment status of the 1,961 subloans for SLRs1,469.3 million under the Project has been satisfactory with 77.9% subloans repaid in full; 11.6% subloans current; 1.9% subloans rescheduled and regular; 1.1% subloans in arrears; 2.3% subloans 21 Government ownership comprises direct shares of about 12%, held by the Treasury and CBSL, and indirect shares
held by state-owned banks and other financial institutions.
8
claimed under the credit guarantee scheme (para. 70); and 5.2% subloans in legal action. This is detailed in Table 2 below.
Table 2: Repayment Status of Subloans (as of 12 May 2003)
Number of Subloans Participating Credit Institution Financing Subloan
Fully Settled
Current Rescheduled and
Regular
In Arrears
Claimed Under Credit
Guarantee Scheme
Legal Action
Total
People’s Bank 36 9 1 9 55 Bank of Ceylon 154 116 16 31 317 Development Finance Corporation of Ceylon
566 3 1 570
Sampath Bank 68 6 74 Hatton National Bank 252 86 54 392 Central Bank of C 129 33 23 185 Seylan Bank 66 2 68 Wayamba Dev’t Bank 165 21 186 Sabaragamuwa Dev’t Bank 31 2 33 Kandurata Dev’t Bank 61 13 7 81
Total 1,528 227 37 23 45 101 1,961 Percentage (%) 77.9 11.6 1.9 1.1 2.3 5.2 100.0
Source: Participating credit institutions.
1. Private Sector Participating Credit Institutions 31. Five private sector PCIs, namely Hatton National Bank (HNB), Seylan Bank, DFCC, Sampath Bank, and Commercial Bank of Ceylon (CBOC), recorded satisfactory profitability and financial positions (Appendix 7, Tables A7.1–A7.3) Their financial performance ratios are considered satisfactory, with the exception of HNB and CBOC. 32. The two state-owned commercial banks’ ownership of DFCC was reduced to 15%, which was covenanted.22 This was confirmed by the OEM. DFCC has also acquired a commercial bank23 in an attempt to mobilize deposits while the other privately owned PCIs, operating in commercial banking, have introduced new product ranges to further mobilize savings. The OEM found that HNB, although profitable, is no longer in compliance with ADB’s financial covenant for relending schemes requiring a 1% return on average assets because of over capitalization.24 However, efforts are being made to meet this covenant and HNB has registered an improvement—from 0.3% in 2001 to 0.5% in 2002. In addition, HNB’s NPLs in 2002 remained a concern. CBOC continues to be profitable, with its return on average assets above the required 1% rate of return. In addition, portfolio infection ratio of 15.3% as of 31 December 2002 slightly exceeded the minimum stipulated ceiling of 15%. In 2000, Seylan Bank’s return on average assets was below the minimum 1% (0.5%) and the portfolio infection ratio was above the minimum stipulated limit of 15% (15.9%). These two ratios were complied with in 2002; however, private sector banks operate under a psychological disadvantage with the general public perception that state-owned National Savings Bank and treasury bills and
22 At appraisal, PB and BOC owned 39% of DFCC shares. Foreign shareholders held 33.8% of the shares and
private domestic shareholders controlled the remaining 27.2% shares. 23 DFCC has purchased 20% shares in Commercial Bank of Ceylon. 24 This is attributable to a recent construction of a central office in Colombo.
9
bonds are risk free. The five privately owned PCIs adequately performed their roles as conduits for SME II, accounting for 66% of the total subloans and 81% of the total amount (Appendix 3).
2. State-Owned Participating Credit Institutions 33. The financial performance ratios of the two state-owned banks—PB and BOC—are given in Appendix 7, Table A7.4. 34. The OEM confirms that the restructuring of PB and BOC is proceeding, albeit slowly. BOC has improved its financial viability through a reduction of government debt, strengthening its capital adequacy ratio, increasing ability to withstand political pressure, and preparation of accounts based on international accounting standards. Restructuring of PB is ongoing, nevertheless, it is still not meeting CBSL’s prudential regulations on capital adequacy and NPL limit. Under International Monetary Fund and World Bank assistance, its operations are targeted to be commercialized in the near future. No timeframe has been fixed for this, but there is considerable resistance by the trade unions to the ongoing restructuring and to the proposed commercialization. In comparison to the performance of the five private sector PCIs, the state-owned PCIs continue to perform poorly as regards financial performance ratios. The OEM was unable to access information on cash collection and portfolio infection ratios for the two state-owned banks, however, the general consensus was that their performance was considerably less than their private sector counterparts.
3. Rural Regional Development Banks as Participating Credit Institutions 35. Seventeen RRDBs were amalgamated into six regional development banks (RDBs) in late 1998–early 1999 with the objective of strengthening capitalization and enhancing efficiency. Hence, discussion would focus on the RDBs. The three participating RRDBs have been amalgamated as follows: (i) Kegalla RRDB with the Sabaragamuwa25 Development Bank (SDB) in January 1999; (ii) Kandy RRDB with the Kandurata Development Bank26 in October 1998, (iii) Kurunegala RRDB with the Wayamba Development Bank27 in January 1999. The financial performance of two RDBs has improved; however, SDB is no longer meeting the eligibility criteria because of declining cash-collection ratio. The three participating RDBs have excess liquidity at present reflecting (i) lack of viable lending opportunities, (ii) competition from microcredit and grant schemes, (iii) competition from other SME loans, and (iv) mismatch of resources between deposits which are mainly short term and development lending requiring longer-term facilities. Some rationalization between various funding sources is essential to bring about efficient resource utilization for promotion of economic development, particularly in the rural areas. Profitability and financial position of the three RDBs is in Appendix 7, Tables A7.5–A7.6. The OEM found that an ongoing study is proposing additional restructuring of the RDBs to further enhance their viability. In the first phase, CBSL will retain about 20% shareholding and transfer the balance of about 32%–48% to the Ministry of Finance. Phase II envisages the sale of the Ministry of Finance shareholding to (i) a private sector investor, (ii) another bank, or (iii) the employees. 36. The state-owned banks—namely PB, BOC, and the three RDBs, with their large branch and outreach networks—remain important vehicles to reach remote areas of the country until such a time as the privately operated banks increase their outreach.
25 Includes Badulla, Kegalla, and Ratnapura districts. 26 Includes Kandy, Matale, and Nuwara-Eliya districts. 27 Includes the Gampaha, Kurunegala, and Puttalam districts.
10
C. Financial and Economic Reevaluation 37. The Project did not require the subprojects to attain any minimum financial and economic rates of return. The financial internal rate of return of two subprojects, namely a jewelry manufacturer and a hotel, were calculated at 22.9% and 29.8%, respectively (Appendix 8). NDBSL’s selection of these two subprojects was premised on the fact that relevant data was available from which the calculation for the financial internal rate of return could be made. The data required for economic reevaluation was not available. D. Sustainability
1. Subprojects 38. The OEM evaluated the sustainability of 24 subprojects, where data was available, out of the 30 subprojects surveyed using the formula: value added (annualized capital28 and labor cost).29 On the basis of this formula,30 15 subprojects (12 subprojects located in the western region and three subprojects located in the semiurban/rural areas and financed by the three RDBs) had a ratio greater than 2, implying that they were fully sustainable. Six subprojects (four subprojects located in the western region and two subprojects located in the semiurban/rural areas and financed by the three RDBs) had a ratio of between 1.0 and 2.0, implying marginally sustainable subprojects; and three subprojects (one subproject located in the western region and two subprojects located in the semiurban/rural areas and financed by two of the RDBs) had a ratio below 1.0, implying they were unsustainable (Appendix 5). 39. All high value-adding manufacturing subprojects were sustainable while those in the service sector, with relatively less value addition, were marginally sustainable or unsustainable. The subprojects located in the affluent western region and financed by the seven PCIs headquartered in Colombo had a greater number of fully and marginally sustainable subprojects (88%) relative to the RDBs. This was attributable to a larger and relatively more prosperous market, higher education levels and awareness of IT and accounting practices. Out of the three unsustainable subprojects (12.5%), two subprojects or 67% were from the semiurban/rural areas. Out of the 30 subprojects surveyed, only one subproject (a poultry operator financed by SDB) had closed down due to competition from an overseas operator.
2. Participating Credit Institutions 40. Eight of the 10 PCIs are sustainable. These include the five private sector PCIs and the three RDBs. They are well managed, profitable, and have sound financial positions although HNB needs to further improve its performance in order to meet the ADB eligibility criteria for SMEs (para. 32). Of the three RDBs, SDB’s cash collection ratio dropped from 83% in 2000 to 73% in 2002. Nevertheless, SDB appears sustainable given its profitability and financial position. Its portfolio infection ratio dropped from 17% in 2000 to 11% in 2002, below ADB’s
28 The capital cost = value of fixed capital employed by the subproject multiplied by the opportunity cost of capital.
The opportunity cost of capital is the rate of return available to the subborrower who employs capital in less risky investments, and has been estimated at 12% to 18% for Sri Lanka for the past 10 years.
29 The labor cost = total wage bill of the subproject for any given period. 30 A ratio of 1.0 implies that the value of output of the subproject is sufficient to cover the input costs. A ratio of less
than 1.0 implies that the value of output is unable to cover the input costs and the subproject is unsustainable, a ratio greater than 1.0 but less than 2.0 defines a marginally sustainable subproject while a ratio greater than 2.0 is rated fully sustainable.
11
stipulated maximum of 15%. However, all three RDBs deal with only one product and it may be difficult for them to survive without government support. 41. The restructuring of the two state-owned banks is not assured, especially given trade union pressure resisting moves to restructure or commercialize these institutions. However, BOC appears to be moving toward commercialization at a much faster pace than PB whose long-term sustainability remains at risk.
IV. ACHIEVEMENT OF OTHER DEVELOPMENT IMPACTS A. Socioeconomic Impact 42. The subprojects’ outreach was concentrated in two regions—the western region and Wayamba region—accounting for 70% of project subborrowers. There was employment of women in all subprojects independently surveyed by the OEM, with the exception of a welding unit. The OEM found that women in the Colombo area occupied jobs traditionally considered the domain of women, for example as office staff, while operation of heavy machinery remained the domain of men. Additionally, women were also employed in the garments industry, though cutting remained the domain of men. 43. The 30 subprojects surveyed by the OEM reflect the difficulties associated with quantifying the exact economic impact of subprojects, especially in the services sector. For example, the extent of the value of services provided to the community as a direct consequence of the subloans, like hospital care and tutoring, which contributed to health care and education levels in the region, could not be adequately quantified. B. Environmental Impact 44. The Loan Agreement noted that in consultation with the CEA, PCIs would be delegated authority to approve subprojects with little or no adverse environment impact. All industrial units in Sri Lanka are required to get a license from the CEA by law. The independent survey carried out by the OEM confirmed that few subprojects had any significant adverse environment impact. Those that were involved in the production of effluents were either treating them by reusing the effluents directly, as in the case of the carrom board manufacturer who used the wood shavings to grow flowers, or indirectly through sale, as in the case of sale of photographic waste for extraction of silver. C. Impact on Institutions and Policy 45. The impact of the Project on financial sector reforms was limited to divestment (para. 28). However, the onlending rate played a significant role in the development of the SME subsector. The Sri Lanka rupee depreciated from SLRs40 per $1 at appraisal in December 1990 to SLRs97 per $1 at the time of the OEM in May 2003 or by about an average rate of 11.9% per annum during the 12-year period reflecting the extent of the government foreign-exchange subsidy. 46. The onlending rate from NDBSL to the PCIs was determined on the basis of the six monthly AWDR. The PCIs were free to add their own margins when extending loans to the subborrowers. The OEM agrees with the report and recommendation of the President and appraisal reports that the AWDR was not an adequate benchmark to determine the onlending interest rate, as it contained a large proportion of “interest-free” current accounts that deflated it.
12
For example, on 23 April 2003, the AWDR was about 6.5% while the 5-year Government bond rate was higher—at approximately 9.3%. Considering that 69% of the subloans under SME II had a repayment term of between 1 to 5 years, it may have been more appropriate to set an onlending rate on the basis of either the 5-year Government bond rate, or a variable interest rate of 2% above the 3-month treasury bill rate.31 This rate is currently being offered by the commercial banks, including some of the PCIs, on their 5-year debenture issues for raising resources for lending and capital strengthening. 47. During loan commitment (1992–1996), the average interest rate from the PCIs to the subborrowers was between 17%–21% and about 14% from the RDBs, whereas the average inflation rate during that period was estimated at 11.02% on the basis of CBSL’s year-end inflation rate. Thus, the lending rates on SME II were positive in real terms. However, the onlending rates were lower than the rates charged by the PCIs to customers who borrowed under schemes other than the Project. The OEM was informed that this difference was due to the considerably lower cost of SME loans under the Project for the banks. In addition, the deposit rate is considerably lower than the lending rate in Sri Lanka—giving banks a large spread. This differential was cited as a major impediment to the development of the SME sector by the subborrowers. 48. International consulting services under the attached TA consisted of (i) an SME development specialist, (ii) five local subsector specialists, and (iii) one local SME regulation specialist. The TA, completed in December 1992, carried out a survey of 202 industrial units in five production sectors: metal products, food processing, wood products, electronics, and rubber products. Given the market diversification that has taken place in the SME subsector in recent years in Sri Lanka—away from electronics and handicrafts to leather products and fashion garments—the survey’s findings had limited validity at the time of the OEM. 49. The TA findings indicated that Sri Lanka’s industrial policy addressed problems of large firms as opposed to those of the SME sector and proposed some general recommendations: industrial policy formulation be geared to addressing problems faced by SMEs; incentive schemes be targeted for mid-sized firms (i.e., the ones most likely to grow); promotion of export-oriented sectors; improving access to technology; and the promotion of subcontracting. The OEM found it difficult to follow up on any specific policy and strategy development for SME promotion recommended in the TA report. However, the Government remains committed to SME development and links the development of this sector to poverty reduction. While this does ensure government engagement in this crucial sector, yet the consensus within the Ministry of Finance was that SME interventions must be kept distinct from the larger issue of financial sector reforms, as the main objective of SME assistance is poverty reduction. 50. In an effort to improve the climate in which the SME sector operates, the Government has introduced a large number of policy measures. These include (i) continuing liberalization of the economy and dismantling of state-owned enterprises; (ii) expansion of industrial estates with adequate infrastructure facilities in outlying regions; (iii) allowing SMEs to enjoy the same facilities as those enjoyed by foreign investors through establishing Board Of Investment facilitating offices in five regions of the country—the facilities provided by these offices include duty-free import of machinery, raw material, technology, and IT hardware and software; and (iv) introduction of 810 unique industrial estates and industrial training centers in all the regions of the country. The Government has decided to use a large portion of the forthcoming international financial institutions assistance (estimated to total about $600 million) for upgrading
31 At the time of the OEM, this rate was 8.64%.
13
rural infrastructure, increasing power generation (at present only about 40% of the country has access to electricity), water supply, and rural hospitals. This would provide a tremendous impetus to the development of the rural sector in general and SMEs in particular. However, none of these measures was related to the TA report, and the OEM had problems locating a copy of the report in the Executing Agency’s office. 51. The appraisal estimated total TA assistance of $238,000 for a period of 4 months commencing mid-1991. The draft TA report was delayed until December 1992 and the actual expense incurred was $230,166. The draft was poorly written; however, the Government accepted the draft as the final report. The Executing Agency requested that the surplus amount be used to engage a short-term consultant on SME financing mechanisms. The short-term consultant provided valuable advice to local venture capital firms on SME techniques and worked closely with a venture capital firm on structuring and exit from SME investments. Overall, the TA is rated unsuccessful, as none of its recommendations are directly attributable to the Government’s subsequent policy reform measures designed to further develop the SME sector.
V. OVERALL ASSESSMENT A. Relevance 52. The Project‘s objective to provide continued support to term financing of viable SME projects in the private sector was relevant, as (i) it was an integral part of the Government’s strategy to reduce poverty levels, and (ii) without this support the SME subsector would have had little access to capital from other sources. The Project remains relevant today given the ongoing peace process. The Project’s financial covenants contributed to improving the financial position of the 10 PCIs and enabled them to become more efficient purveyors of financial assistance for SME development. The Project also served as a vehicle for ongoing restructuring of two of the state-owned PCIs. However, the onlending rates were lower than the rates charged by the PCIs to customers who borrowed under schemes other than under the Project due to the considerably lower cost of SME loans for the banks. The Project is assessed relevant. B. Efficacy 53. The Project achieved its objective of partly meeting the estimated gap of $90 million between the SME growth projections and available financing. There was incremental employment and value addition, however, the OEM was unable to get exact figures as there was no database for assessing these indicators. However, the institutional capacities in all PCIs for SME term lending were strengthened. The Project is assessed efficacious. C. Efficiency 54. The two state-owned PCIs’ failure to meet the eligibility criteria for 4 years after loan effectiveness delayed implementation. Delays were also associated with the managerial and technical problems of inexperienced staff at RDBs. However, the private PCIs performed adequately. Overall, the Project is rated efficient.
14
D. Sustainability 55. The OEM evaluated the sustainability of 24 subprojects. About 88% of the subprojects surveyed were sustainable. Only three subprojects were unsustainable. Out of the 30 subprojects inspected by the OEM, only one subproject had closed down. 56. Six of the eight PCIs, except the state owned banks, are sustainable with satisfactory profitability and financial positions. HNB needs to further improve its return on average assets while SDB needs to increase its cash collection ratio. The sustainability of the two state-owned banks appears marginal; however, restructuring plans are being implemented satisfactorily. Doubt remains as to whether these plans would be sustained. Trade union pressure may delay or prevent the commercialization of PB in which event its sustainability would be questionable. The Project is assessed sustainable. E. Institutional Development and Other Impacts 57. The Government’s attempts to bring the large informal sector, which accounts for underestimation of key social indicators like employment and output and, consequently, cannot be taxed, into the formal economy have met with little success because of procedural bottlenecks associated with the formal sector. However, while the SME sector does operate largely in the formal sector, the process has been strengthened by the Project, as it requires the subborrowers to operate within the formal sector. This may eventually be a source of considerable government revenue as productivity rises. 58. The Project was responsible for greater IT activity in the western region. However, this was not evident among the majority of the subborrowers of the three RDBs. The Project’s institutional impact is assessed moderate. F. Overall Project Rating 59. The Project is rated successful. G. Asian Development Bank and Borrower Performance 60. ADB fielded 11 project administration missions. The PCR noted that stronger supervision would have been desirable, as it may have led to full utilization of the loan. The OEM concurs with this view. In addition, the PCIs did not maintain any records of the subproject data once the loans were fully repaid, which made data collection difficult for the PCR Mission and the OEM. 61. ADB, however, successfully monitored the progress of policy measures and compliance with loan covenants under SME II. Review missions visited randomly selected sites. Feedback from the Government was satisfactory. The OEM noted, however, that two state-owned PCIs failed to meet the eligibility criteria for 4 years after loan effectiveness, and ADB missions should have been more vigilant in enforcing the eligibility criteria in their selection process. 62. Overall, the OEM assesses ADB’s performance as satisfactory. The Borrower’s performance was also satisfactory despite the implementation delays due to the inability of the two state-owned commercial banks to meet the eligibility criteria.
15
VI. LESSONS, ISSUES, AND FOLLOW-UP ACTIONS A. Lessons Learned 63. Subsequent to SME II, ADB’s SME interventions have been based on private sector participation. This may have been due to lessons learned in SME II where the private sector PCIs performed considerably better than the state-owned PCIs (para. 11). They include ADB’s third SME project32 and the Credit Enhancement Facility for Private Enterprises.33 The latter also envisaged a partial credit guarantee with the objective of assisting Sri Lanka gain access to the international financial markets. A sector development program,34 based on lessons learned from previous ADB interventions, further refined ADB’s SME strategy for Sri Lanka to exclude those state-owned banks that failed to meet the eligibility criteria. Corporate governance, IT, and institutional strengthening have been added to the eligibility criteria for the PCIs . These loans reflect that lessons learned have effectively strengthened ADB interventions in the SME sector. 64. In cases where the PCIs have the capacity to evaluate credit risks, ADB may rely on their lending guidelines and policies. In addition, directed lending programs, which include specific region and gender targets, may not be as effective as assessing why these target groups do not have access to formal finance. 65. The use of RDBs as PCIs in SME II supported economic activity in the rural areas. However, subsequent ADB loans require subprojects to have a financial internal rate of return of not less than the average weighted cost of capital and an economic internal rate of return of not less than 12%. Due to lack of adequate data in remote areas and lack of expertise of some of the PCIs (especially the RDBs with lower institutional capacity relative to the PCIs based in Colombo), the subborrowers find it difficult to make the necessary calculations. 66. The collection and recording of data pertaining to the subprojects ceased after a loan was fully repaid. The apex institution must ensure that PCIs continue to supply data after project completion. This would provide useful information for aid agencies and the Government in formulating new projects for the sector. 67. Consideration needs to be given to the efficacy of attaching a capacity-building TA related to a loan to help with project implementation rather than one that precedes loan approval. B. Key Issues for the Future
1. Debt Recovery 68. As required under the Project (Schedule 7, para. 7 of the Loan Agreement), Parliament enacted amendments to the Debt Recovery (Special Provisions) Act on 24 February 1994. This
32 Investment 7137/Loan 1522-SRI: Small and Medium Enterprise Assistance Project, for $5 million, approved on
5 June 1997. 33 Investment 7149/Loan 1629-SRI: Credit Enhancement Facility for Private Enterprises, for $5 million, approved on
8 September 1998. 34 Loan 1894-SRI(SF): Small and Medium Enterprise Sector Development Program (Program Loan) and Loan 1895-
SRI(SF): Small and Medium Enterprise Sector Development Program (Investment Loan for the Business Services Support Facility) were for $20 million and $6 million, respectively, and were both approved on 20 December 2001.
16
Act has enabled the PCIs, under Parate powers,35 to recover bad debts through board resolutions authorizing auction of mortgaged fixed assets/property of the defaulter. Notice to the client is conveyed through newspaper advertisements and Gazette notification. The OEM found that in many instances, the threat of invoking the Parate powers was sufficient for the client to seek a negotiated settlement. In other instances, loan defaulters opted for litigation, thereby considerably slowing the process of debt recovery. The Government is considering establishing a committee, which would be empowered to reconcile claims and settle bad debts without going through the cumbersome litigation process. The Government is also considering a further amendment to the 1994 Act to facilitate debt recovery on joint loans, including third party mortgages. The OEM was informed that this amendment is likely to be presented to Parliament for enactment shortly. However, a small claims court may be a more appropriate way to deal with this issue. Efforts made to facilitate debt collection are likely to further strengthen the ability of the PCIs to recycle their funds for further expansion of the SME sector. However, poor debt recovery remains an issue for Sri Lanka’s banking sector.
2. Onlending Rate 69. The onlending rate for ADB interventions will remain an issue unless a long-term bond market is established. Until such a time as this happens, it maybe appropriate to set an onlending rate on the basis of a 5-year government bond rate (para. 46).
3. Credit Guarantee Scheme 70. The Credit Guarantee Scheme (CGS), established under the third IDA Agreement, remained operational for ADB SME II (Schedule 7, para. 2). It was operated by CBSL, and its objective was to provide partial coverage to eligible SMEs unable to provide adequate collateral. A PCI was liable to pay a fee of 1% of the loan amount, later raised to 1.5%, in order to guarantee the loan for repayment in the event of delinquency. This fee was borne by the PCI from its interest spread. At the time of the OEM, 45 claims amounting to SLRs1.4 million were lodged by the PCIs, constituting 2% of the total amount of loans (Table 2). The mandatory nature of the CGS for all SME loans ended in 1998. This was due to the general consensus among the PCIs that the CGS was increasing the cost of funds due to the lengthy, time-consuming, and cumbersome procedures involved.
4. Lack of Data on Subprojects 71. The PCIs have not set up procedures and systems to record and quickly retrieve data on socioeconomic impact of subprojects. The problem was further exacerbated given that most of the loans had been repaid in full and their data erased from the PCI database. The OEM found it difficult to obtain data on subprojects relating to capacity utilization, sales, and socioeconomic impact which could be comparable to the data available in the PCR. This would remain an issue for PCR and evaluation missions in ADB interventions in this subsector.
5. Development of Other Markets 72. Capital markets, investment funds, and venture capital businesses need to be developed to meet the requirement for long-term funds of SMEs.
35 Parate powers allow banks to recover bad debts through a public notice to the defaulter as a first step toward
litigation.
17
C. Follow-Up Actions 73. The OEM was informed that the CGS maintains a sizeable fund (about SLRs3.5 billion). Given the existence of this fund, it maybe beneficial to reactivate CGS. However, to make it effective, it is suggested that procedural requirements be telescoped to a much shorter time span and staff training be undertaken at both CBSL and PCI levels (through workshops, on-the-job training, and operational manuals) in order to facilitate the use of the CGS. It may also provide an alternative to collateral or personal guarantee-based SME lending. This maybe accomplished by the end of 2003. 74. ADB may consider a TA by 2004 to set up monitoring and evaluation systems within the PCIs so that data may be retained and retrieved quickly until 5 years after project completion. 75. ADB may engage the Government in policy dialogue for the possible establishment of small claims court to facilitate the recovery of loans by the end of 2004.
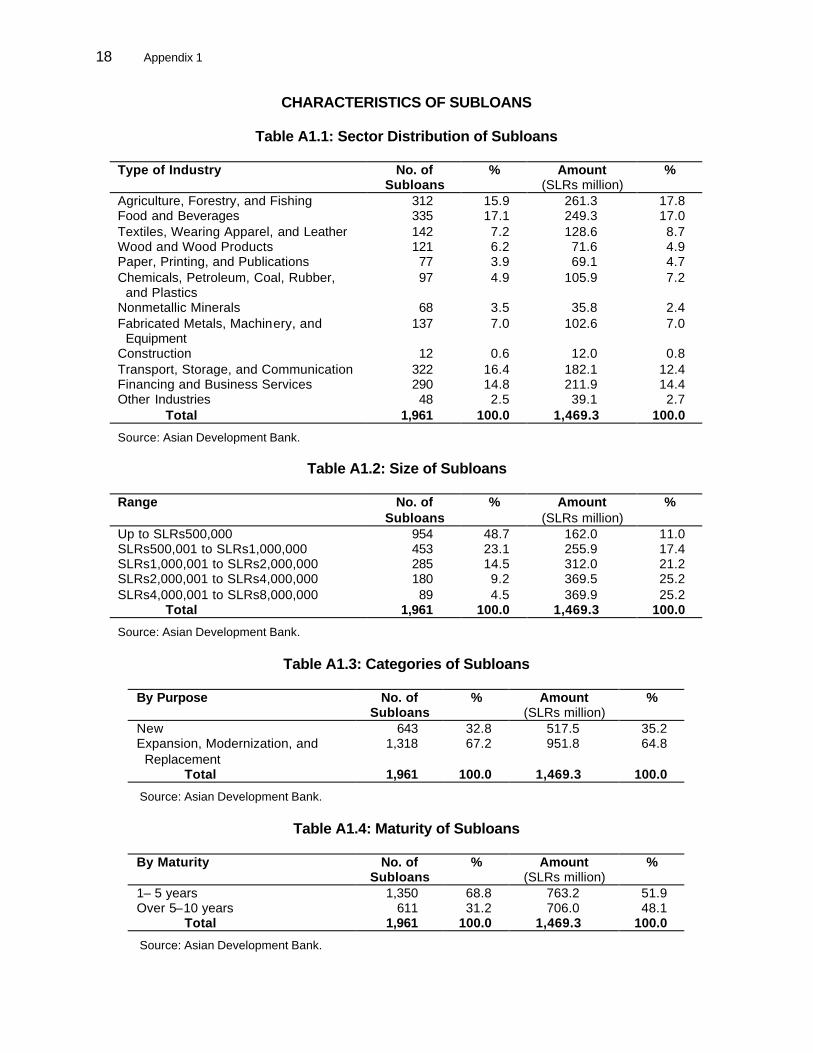
Appendix 1 18
CHARACTERISTICS OF SUBLOANS
Table A1.1: Sector Distribution of Subloans
Type of Industry No. of Subloans
% Amount (SLRs million)
%
Agriculture, Forestry, and Fishing 312 15.9 261.3 17.8 Food and Beverages 335 17.1 249.3 17.0 Textiles, Wearing Apparel, and Leather 142 7.2 128.6 8.7 Wood and Wood Products 121 6.2 71.6 4.9 Paper, Printing, and Publications 77 3.9 69.1 4.7 Chemicals, Petroleum, Coal, Rubber, and Plastics
97 4.9 105.9 7.2
Nonmetallic Minerals 68 3.5 35.8 2.4 Fabricated Metals, Machinery, and Equipment
137 7.0 102.6 7.0
Construction 12 0.6 12.0 0.8 Transport, Storage, and Communication 322 16.4 182.1 12.4 Financing and Business Services 290 14.8 211.9 14.4 Other Industries 48 2.5 39.1 2.7 Total 1,961 100.0 1,469.3 100.0
Source: Asian Development Bank.
Table A1.2: Size of Subloans
Range No. of Subloans
% Amount (SLRs million)
%
Up to SLRs500,000 954 48.7 162.0 11.0 SLRs500,001 to SLRs1,000,000 453 23.1 255.9 17.4 SLRs1,000,001 to SLRs2,000,000 285 14.5 312.0 21.2 SLRs2,000,001 to SLRs4,000,000 180 9.2 369.5 25.2 SLRs4,000,001 to SLRs8,000,000 89 4.5 369.9 25.2 Total 1,961 100.0 1,469.3 100.0
Source: Asian Development Bank.
Table A1.3: Categories of Subloans
By Purpose No. of Subloans
% Amount (SLRs million)
%
New 643 32.8 517.5 35.2 Expansion, Modernization, and Replacement
1,318 67.2 951.8 64.8
Total 1,961 100.0 1,469.3 100.0
Source: Asian Development Bank.
Table A1.4: Maturity of Subloans
By Maturity No. of Subloans
% Amount (SLRs million)
%
1– 5 years 1,350 68.8 763.2 51.9 Over 5–10 years 611 31.2 706.0 48.1 Total 1,961 100.0 1,469.3 100.0
Source: Asian Development Bank.
Appendix 2 19
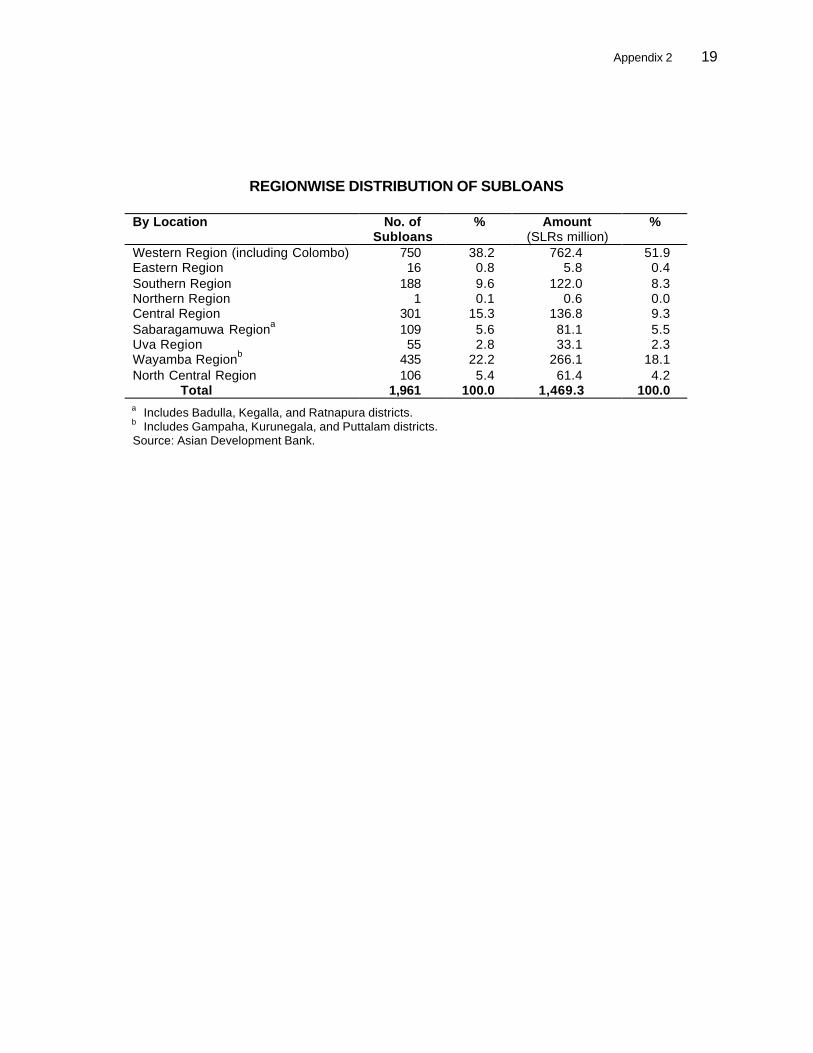
REGIONWISE DISTRIBUTION OF SUBLOANS
By Location No. of Subloans
% Amount (SLRs million)
%
Western Region (including Colombo) 750 38.2 762.4 51.9 Eastern Region 16 0.8 5.8 0.4 Southern Region 188 9.6 122.0 8.3 Northern Region 1 0.1 0.6 0.0 Central Region 301 15.3 136.8 9.3 Sabaragamuwa Regiona 109 5.6 81.1 5.5 Uva Region 55 2.8 33.1 2.3 Wayamba Regionb 435 22.2 266.1 18.1 North Central Region 106 5.4 61.4 4.2 Total 1,961 100.0 1,469.3 100.0 a Includes Badulla, Kegalla, and Ratnapura districts. b Includes Gampaha, Kurunegala, and Puttalam districts. Source: Asian Development Bank.
Appendix 3 20
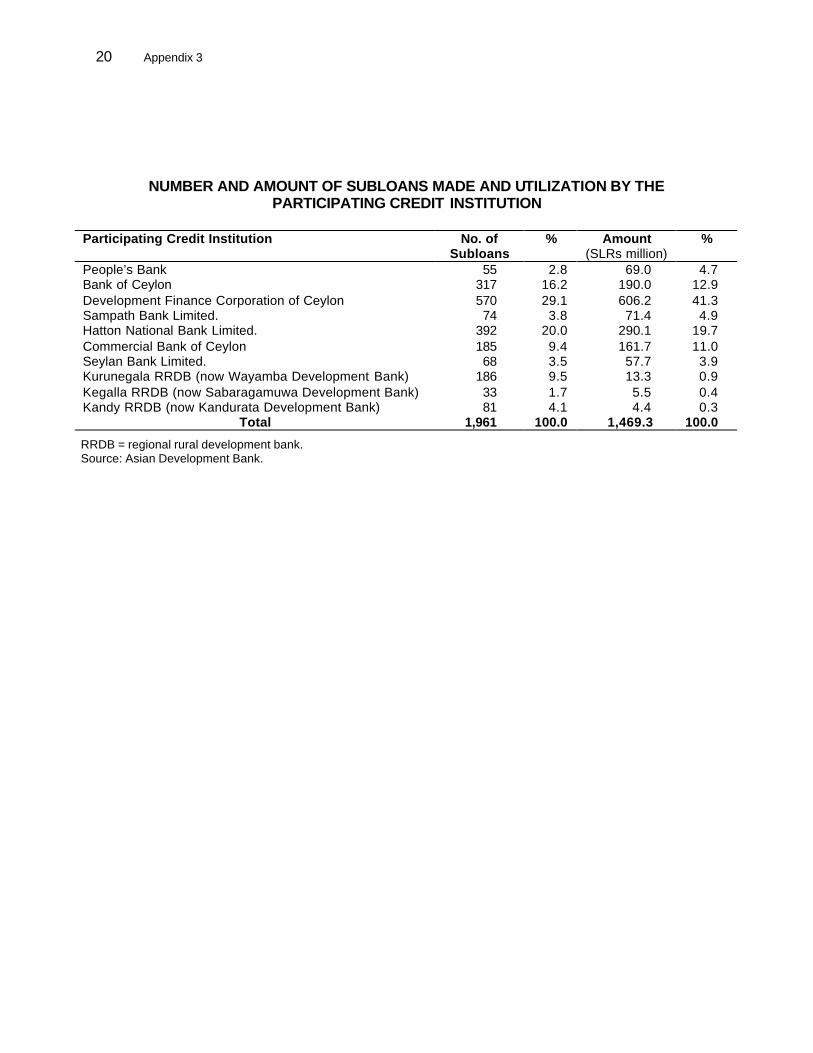
NUMBER AND AMOUNT OF SUBLOANS MADE AND UTILIZATION BY THE PARTICIPATING CREDIT INSTITUTION
Participating Credit Institution No. of
Subloans % Amount
(SLRs million) %
People’s Bank 55 2.8 69.0 4.7 Bank of Ceylon 317 16.2 190.0 12.9 Development Finance Corporation of Ceylon 570 29.1 606.2 41.3 Sampath Bank Limited. 74 3.8 71.4 4.9 Hatton National Bank Limited. 392 20.0 290.1 19.7 Commercial Bank of Ceylon 185 9.4 161.7 11.0 Seylan Bank Limited. 68 3.5 57.7 3.9 Kurunegala RRDB (now Wayamba Development Bank) 186 9.5 13.3 0.9 Kegalla RRDB (now Sabaragamuwa Development Bank) 33 1.7 5.5 0.4 Kandy RRDB (now Kandurata Development Bank) 81 4.1 4.4 0.3
Total 1,961 100.0 1,469.3 100.0
RRDB = regional rural development bank. Source: Asian Development Bank.
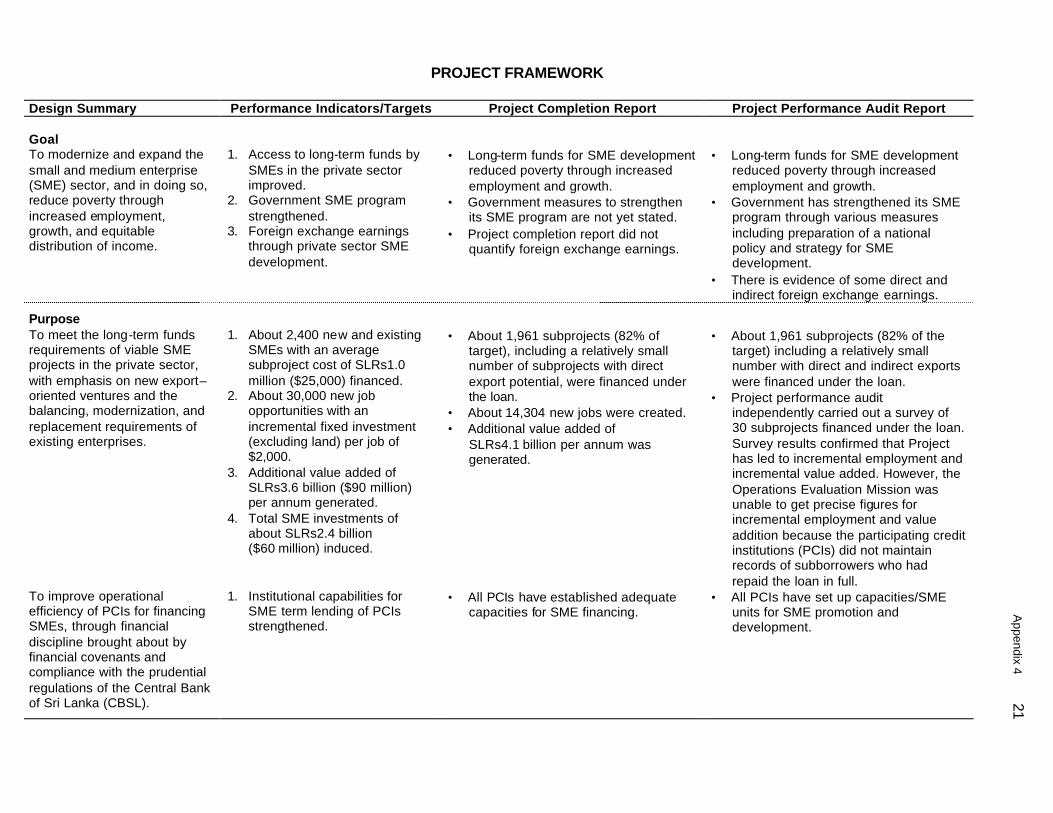
PROJECT FRAMEWORK Design Summary Performance Indicators/Targets Project Completion Report Project Performance Audit Report Goal To modernize and expand the small and medium enterprise (SME) sector, and in doing so, reduce poverty through increased employment, growth, and equitable distribution of income.
1. Access to long-term funds by
SMEs in the private sector improved.
2. Government SME program strengthened.
3. Foreign exchange earnings through private sector SME development.
• Long-term funds for SME development
reduced poverty through increased employment and growth.
• Government measures to strengthen its SME program are not yet stated.
• Project completion report did not quantify foreign exchange earnings.
• Long-term funds for SME development
reduced poverty through increased employment and growth.
• Government has strengthened its SME program through various measures including preparation of a national policy and strategy for SME development.
• There is evidence of some direct and indirect foreign exchange earnings.
Purpose To meet the long-term funds requirements of viable SME projects in the private sector, with emphasis on new export– oriented ventures and the balancing, modernization, and replacement requirements of existing enterprises.
1. About 2,400 new and existing
SMEs with an average subproject cost of SLRs1.0 million ($25,000) financed.
2. About 30,000 new job opportunities with an incremental fixed investment (excluding land) per job of $2,000.
3. Additional value added of SLRs3.6 billion ($90 million) per annum generated.
4. Total SME investments of about SLRs2.4 billion ($60 million) induced.
• About 1,961 subprojects (82% of
target), including a relatively small number of subprojects with direct export potential, were financed under the loan.
• About 14,304 new jobs were created. • Additional value added of
SLRs4.1 billion per annum was generated.
• About 1,961 subprojects (82% of the
target) including a relatively small number with direct and indirect exports were financed under the loan.
• Project performance audit independently carried out a survey of 30 subprojects financed under the loan. Survey results confirmed that Project has led to incremental employment and incremental value added. However, the Operations Evaluation Mission was unable to get precise figures for incremental employment and value addition because the participating credit institutions (PCIs) did not maintain records of subborrowers who had repaid the loan in full.
To improve operational efficiency of PCIs for financing SMEs, through financial discipline brought about by financial covenants and compliance with the prudential regulations of the Central Bank of Sri Lanka (CBSL).
1. Institutional capabilities for SME term lending of PCIs strengthened.
• All PCIs have established adequate capacities for SME financing.
• All PCIs have set up capacities/SME units for SME promotion and development.
Appendix 4 21
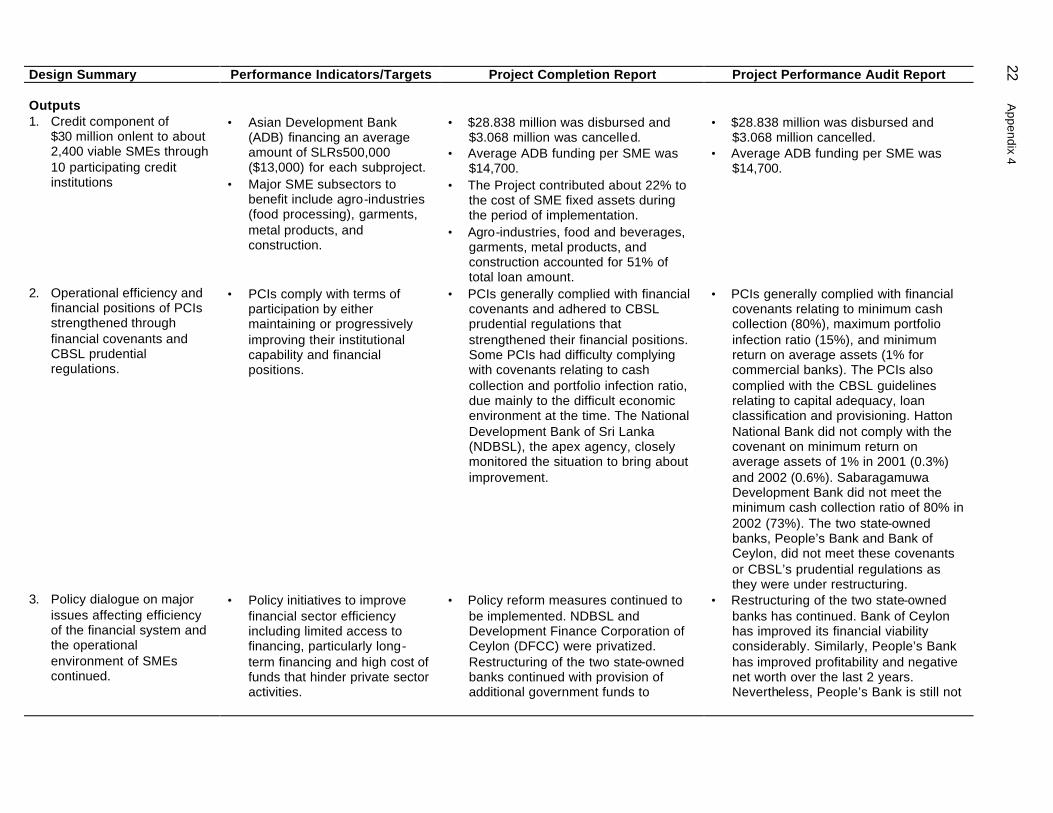
Design Summary Performance Indicators/Targets Project Completion Report Project Performance Audit Report Outputs 1. Credit component of
$30 million onlent to about 2,400 viable SMEs through 10 participating credit institutions
• Asian Development Bank
(ADB) financing an average amount of SLRs500,000 ($13,000) for each subproject.
• Major SME subsectors to benefit include agro-industries (food processing), garments, metal products, and construction.
• $28.838 million was disbursed and
$3.068 million was cancelled. • Average ADB funding per SME was
$14,700. • The Project contributed about 22% to
the cost of SME fixed assets during the period of implementation.
• Agro-industries, food and beverages, garments, metal products, and construction accounted for 51% of total loan amount.
• $28.838 million was disbursed and
$3.068 million cancelled. • Average ADB funding per SME was
$14,700.
2. Operational efficiency and financial positions of PCIs strengthened through financial covenants and CBSL prudential regulations.
• PCIs comply with terms of participation by either maintaining or progressively improving their institutional capability and financial positions.
• PCIs generally complied with financial covenants and adhered to CBSL prudential regulations that strengthened their financial positions. Some PCIs had difficulty complying with covenants relating to cash collection and portfolio infection ratio, due mainly to the difficult economic environment at the time. The National Development Bank of Sri Lanka (NDBSL), the apex agency, closely monitored the situation to bring about improvement.
• PCIs generally complied with financial covenants relating to minimum cash collection (80%), maximum portfolio infection ratio (15%), and minimum return on average assets (1% for commercial banks). The PCIs also complied with the CBSL guidelines relating to capital adequacy, loan classification and provisioning. Hatton National Bank did not comply with the covenant on minimum return on average assets of 1% in 2001 (0.3%) and 2002 (0.6%). Sabaragamuwa Development Bank did not meet the minimum cash collection ratio of 80% in 2002 (73%). The two state-owned banks, People’s Bank and Bank of Ceylon, did not meet these covenants or CBSL’s prudential regulations as they were under restructuring.
3. Policy dialogue on major issues affecting efficiency of the financial system and the operational environment of SMEs continued.
• Policy initiatives to improve financial sector efficiency including limited access to financing, particularly long-term financing and high cost of funds that hinder private sector activities.
• Policy reform measures continued to be implemented. NDBSL and Development Finance Corporation of Ceylon (DFCC) were privatized. Restructuring of the two state-owned banks continued with provision of additional government funds to
• Restructuring of the two state-owned banks has continued. Bank of Ceylon has improved its financial viability considerably. Similarly, People’s Bank has improved profitability and negative net worth over the last 2 years. Nevertheless, People’s Bank is still not
22 A
ppendix 4
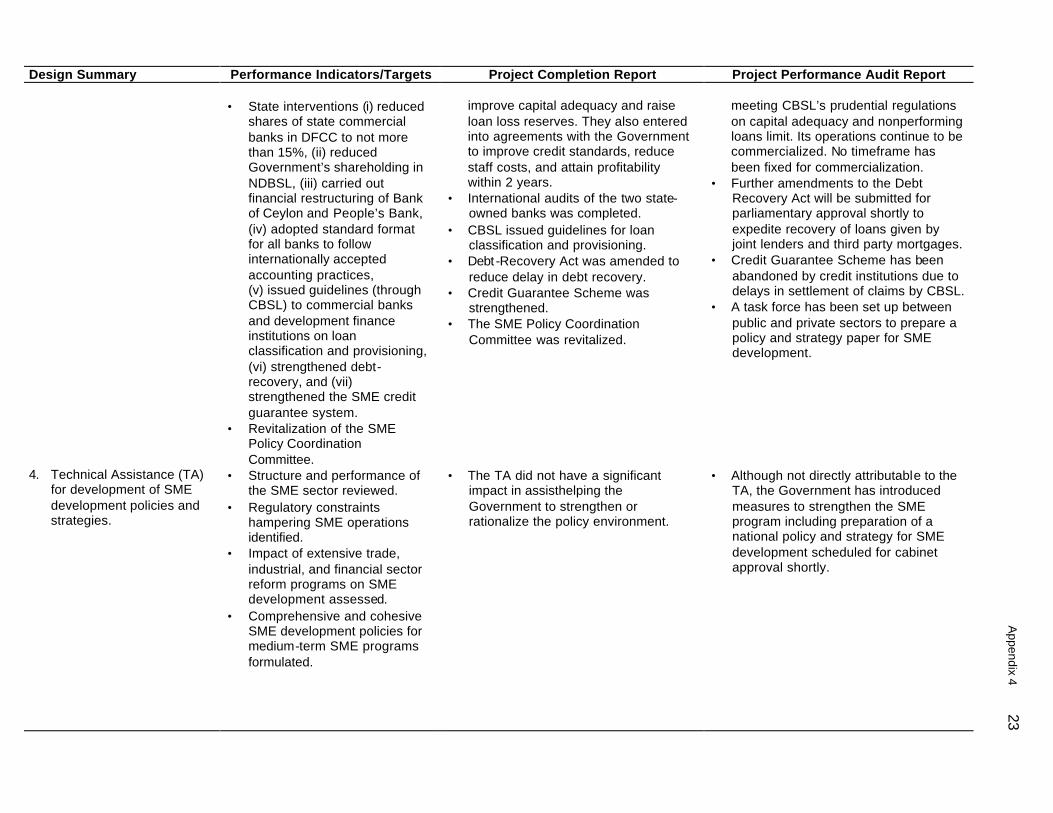
Design Summary Performance Indicators/Targets Project Completion Report Project Performance Audit Report • State interventions (i) reduced
shares of state commercial banks in DFCC to not more than 15%, (ii) reduced Government’s shareholding in NDBSL, (iii) carried out financial restructuring of Bank of Ceylon and People’s Bank, (iv) adopted standard format for all banks to follow internationally accepted accounting practices, (v) issued guidelines (through CBSL) to commercial banks and development finance institutions on loan classification and provisioning, (vi) strengthened debt-recovery, and (vii) strengthened the SME credit guarantee system.
• Revitalization of the SME Policy Coordination Committee.
improve capital adequacy and raise loan loss reserves. They also entered into agreements with the Government to improve credit standards, reduce staff costs, and attain profitability within 2 years.
• International audits of the two state-owned banks was completed.
• CBSL issued guidelines for loan classification and provisioning.
• Debt -Recovery Act was amended to reduce delay in debt recovery.
• Credit Guarantee Scheme was strengthened.
• The SME Policy Coordination Committee was revitalized.
meeting CBSL’s prudential regulations on capital adequacy and nonperforming loans limit. Its operations continue to be commercialized. No timeframe has been fixed for commercialization.
• Further amendments to the Debt Recovery Act will be submitted for parliamentary approval shortly to expedite recovery of loans given by joint lenders and third party mortgages.
• Credit Guarantee Scheme has been abandoned by credit institutions due to delays in settlement of claims by CBSL.
• A task force has been set up between public and private sectors to prepare a policy and strategy paper for SME development.
4. Technical Assistance (TA) for development of SME development policies and strategies.
• Structure and performance of the SME sector reviewed.
• Regulatory constraints hampering SME operations identified.
• Impact of extensive trade, industrial, and financial sector reform programs on SME development assessed.
• Comprehensive and cohesive SME development policies for medium-term SME programs formulated.
• The TA did not have a significant impact in assisthelping the Government to strengthen or rationalize the policy environment.
• Although not directly attributable to the TA, the Government has introduced measures to strengthen the SME program including preparation of a national policy and strategy for SME development scheduled for cabinet approval shortly.
Appendix 4 23
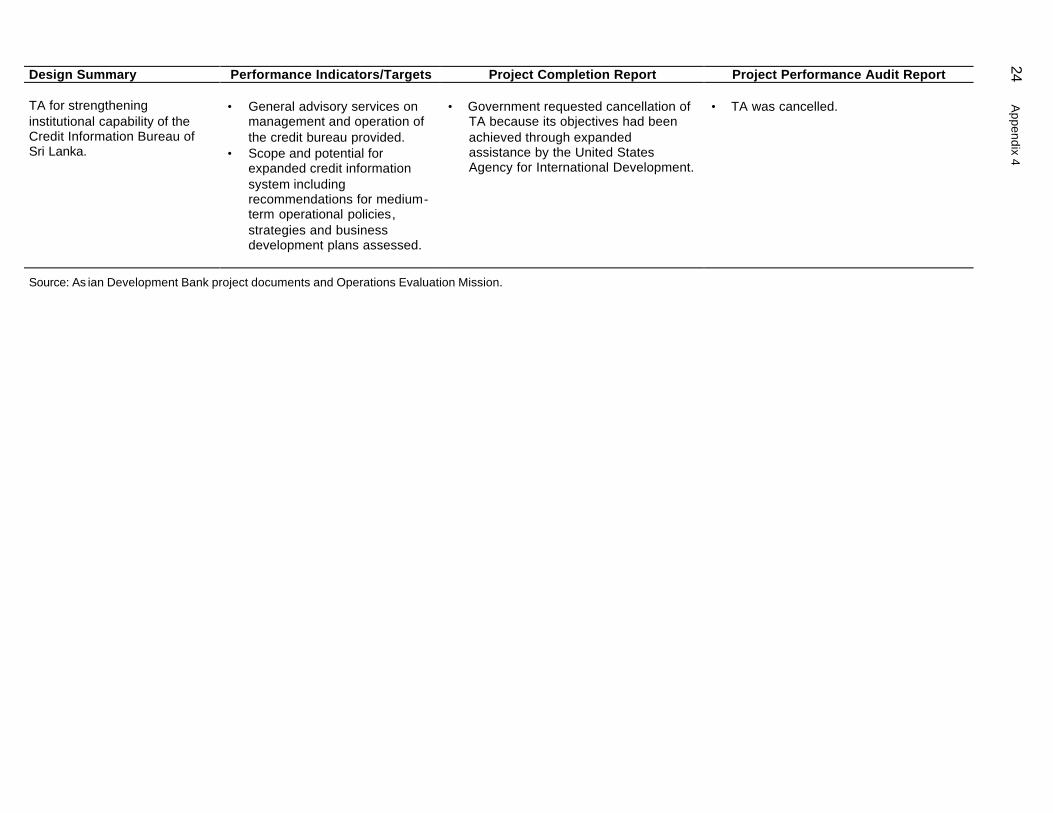
Design Summary Performance Indicators/Targets Project Completion Report Project Performance Audit Report TA for strengthening institutional capability of the Credit Information Bureau of Sri Lanka.
• General advisory services on management and operation of the credit bureau provided.
• Scope and potential for expanded credit information system including recommendations for medium-term operational policies, strategies and business development plans assessed.
• Government requested cancellation of TA because its objectives had been achieved through expanded assistance by the United States Agency for International Development.
• TA was cancelled.
Source: As ian Development Bank project documents and Operations Evaluation Mission.
24 A
ppendix 4
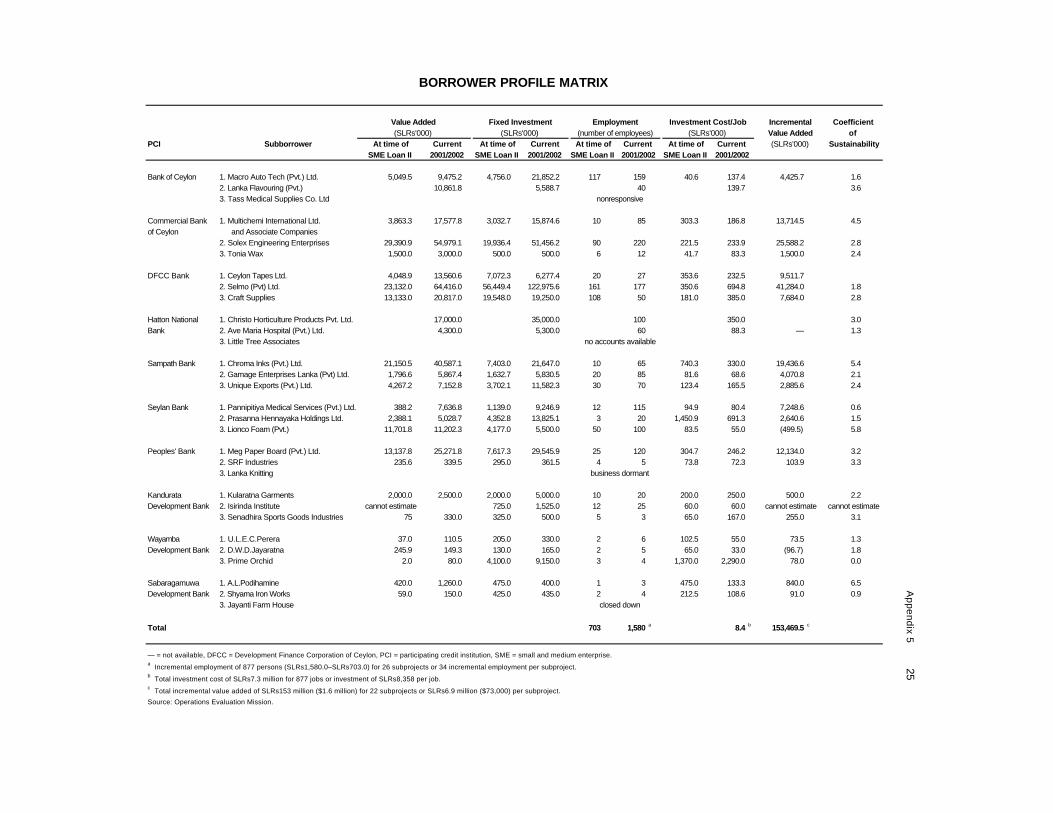
BORROWER PROFILE MATRIX
PCI Subborrower
Bank of Ceylon 1. Macro Auto Tech (Pvt.) Ltd. 5,049.5 9,475.2 4,756.0 21,852.2 117 159 40.6 137.4 4,425.7 1.62. Lanka Flavouring (Pvt.) 10,861.8 5,588.7 40 139.7 3.63. Tass Medical Supplies Co. Ltd
Commercial Bank 1. Multichemi International Ltd. 3,863.3 17,577.8 3,032.7 15,874.6 10 85 303.3 186.8 13,714.5 4.5of Ceylon and Associate Companies
2. Solex Engineering Enterprises 29,390.9 54,979.1 19,936.4 51,456.2 90 220 221.5 233.9 25,588.2 2.83. Tonia Wax 1,500.0 3,000.0 500.0 500.0 6 12 41.7 83.3 1,500.0 2.4
DFCC Bank 1. Ceylon Tapes Ltd. 4,048.9 13,560.6 7,072.3 6,277.4 20 27 353.6 232.5 9,511.72. Selmo (Pvt) Ltd. 23,132.0 64,416.0 56,449.4 122,975.6 161 177 350.6 694.8 41,284.0 1.83. Craft Supplies 13,133.0 20,817.0 19,548.0 19,250.0 108 50 181.0 385.0 7,684.0 2.8
Hatton National 1. Christo Horticulture Products Pvt. Ltd. 17,000.0 35,000.0 100 350.0 3.0Bank 2. Ave Maria Hospital (Pvt.) Ltd. 4,300.0 5,300.0 60 88.3 — 1.3
3. Little Tree Associates
Sampath Bank 1. Chroma Inks (Pvt.) Ltd. 21,150.5 40,587.1 7,403.0 21,647.0 10 65 740.3 330.0 19,436.6 5.42. Gamage Enterprises Lanka (Pvt) Ltd. 1,796.6 5,867.4 1,632.7 5,830.5 20 85 81.6 68.6 4,070.8 2.13. Unique Exports (Pvt.) Ltd. 4,267.2 7,152.8 3,702.1 11,582.3 30 70 123.4 165.5 2,885.6 2.4
Seylan Bank 1. Pannipitiya Medical Services (Pvt.) Ltd. 388.2 7,636.8 1,139.0 9,246.9 12 115 94.9 80.4 7,248.6 0.62. Prasanna Hennayaka Holdings Ltd. 2,388.1 5,028.7 4,352.8 13,825.1 3 20 1,450.9 691.3 2,640.6 1.53. Lionco Foam (Pvt.) 11,701.8 11,202.3 4,177.0 5,500.0 50 100 83.5 55.0 (499.5) 5.8
Peoples' Bank 1. Meg Paper Board (Pvt.) Ltd. 13,137.8 25,271.8 7,617.3 29,545.9 25 120 304.7 246.2 12,134.0 3.22. SRF Industries 235.6 339.5 295.0 361.5 4 5 73.8 72.3 103.9 3.3
3. Lanka Knitting
Kandurata 1. Kularatna Garments 2,000.0 2,500.0 2,000.0 5,000.0 10 20 200.0 250.0 500.0 2.2Development Bank 2. Isirinda Institute 725.0 1,525.0 12 25 60.0 60.0
3. Senadhira Sports Goods Industries 75 330.0 325.0 500.0 5 3 65.0 167.0 255.0 3.1
Wayamba 1. U.L.E.C.Perera 37.0 110.5 205.0 330.0 2 6 102.5 55.0 73.5 1.3Development Bank 2. D.W.D.Jayaratna 245.9 149.3 130.0 165.0 2 5 65.0 33.0 (96.7) 1.8
3. Prime Orchid 2.0 80.0 4,100.0 9,150.0 3 4 1,370.0 2,290.0 78.0 0.0
Sabaragamuwa 1. A.L.Podihamine 420.0 1,260.0 475.0 400.0 1 3 475.0 133.3 840.0 6.5Development Bank 2. Shyama Iron Works 59.0 150.0 425.0 435.0 2 4 212.5 108.6 91.0 0.9
3. Jayanti Farm House
Total 703 1,580 a 8.4 b 153,469.5 c
— = not available, DFCC = Development Finance Corporation of Ceylon, PCI = participating credit institution, SME = small and medium enterprise.a Incremental employment of 877 persons (SLRs1,580.0–SLRs703.0) for 26 subprojects or 34 incremental employment per subproject.b Total investment cost of SLRs7.3 million for 877 jobs or investment of SLRs8,358 per job.c Total incremental value added of SLRs153 million ($1.6 million) for 22 subprojects or SLRs6.9 million ($73,000) per subproject.
Source: Operations Evaluation Mission.
Appendix 5 25
Incremental
(SLRs'000)
Coefficient
At time of
Employment(number of employees)At time of
Investment Cost/JobValue Added of
Current2001/2002
At time ofSME Loan II
Current2001/2002
(SLRs'000)At time of
Value Added(SLRs'000)
Fixed Investment(SLRs'000)
cannot estimate
business dormant
SME Loan II Current
nonresponsive
no accounts available
2001/2002
cannot estimate
SME Loan II SME Loan II Current2001/2002
closed down
Sustainability
cannot estimate
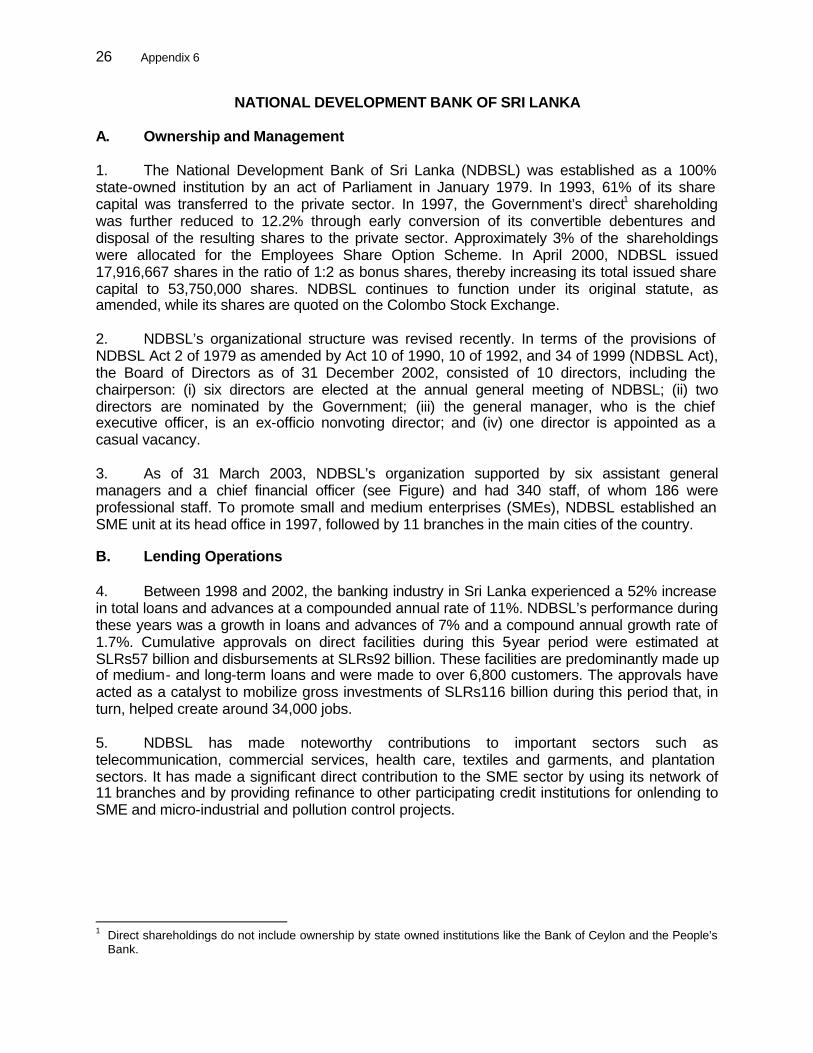
26 Appendix 6
NATIONAL DEVELOPMENT BANK OF SRI LANKA A. Ownership and Management 1. The National Development Bank of Sri Lanka (NDBSL) was established as a 100% state-owned institution by an act of Parliament in January 1979. In 1993, 61% of its share capital was transferred to the private sector. In 1997, the Government’s direct1 shareholding was further reduced to 12.2% through early conversion of its convertible debentures and disposal of the resulting shares to the private sector. Approximately 3% of the shareholdings were allocated for the Employees Share Option Scheme. In April 2000, NDBSL issued 17,916,667 shares in the ratio of 1:2 as bonus shares, thereby increasing its total issued share capital to 53,750,000 shares. NDBSL continues to function under its original statute, as amended, while its shares are quoted on the Colombo Stock Exchange. 2. NDBSL’s organizational structure was revised recently. In terms of the provisions of NDBSL Act 2 of 1979 as amended by Act 10 of 1990, 10 of 1992, and 34 of 1999 (NDBSL Act), the Board of Directors as of 31 December 2002, consisted of 10 directors, including the chairperson: (i) six directors are elected at the annual general meeting of NDBSL; (ii) two directors are nominated by the Government; (iii) the general manager, who is the chief executive officer, is an ex-officio nonvoting director; and (iv) one director is appointed as a casual vacancy. 3. As of 31 March 2003, NDBSL’s organization supported by six assistant general managers and a chief financial officer (see Figure) and had 340 staff, of whom 186 were professional staff. To promote small and medium enterprises (SMEs), NDBSL established an SME unit at its head office in 1997, followed by 11 branches in the main cities of the country. B. Lending Operations 4. Between 1998 and 2002, the banking industry in Sri Lanka experienced a 52% increase in total loans and advances at a compounded annual rate of 11%. NDBSL’s performance during these years was a growth in loans and advances of 7% and a compound annual growth rate of 1.7%. Cumulative approvals on direct facilities during this 5-year period were estimated at SLRs57 billion and disbursements at SLRs92 billion. These facilities are predominantly made up of medium- and long-term loans and were made to over 6,800 customers. The approvals have acted as a catalyst to mobilize gross investments of SLRs116 billion during this period that, in turn, helped create around 34,000 jobs. 5. NDBSL has made noteworthy contributions to important sectors such as telecommunication, commercial services, health care, textiles and garments, and plantation sectors. It has made a significant direct contribution to the SME sector by using its network of 11 branches and by providing refinance to other participating credit institutions for onlending to SME and micro-industrial and pollution control projects.
1 Direct shareholdings do not include ownership by state owned institutions like the Bank of Ceylon and the People’s
Bank.
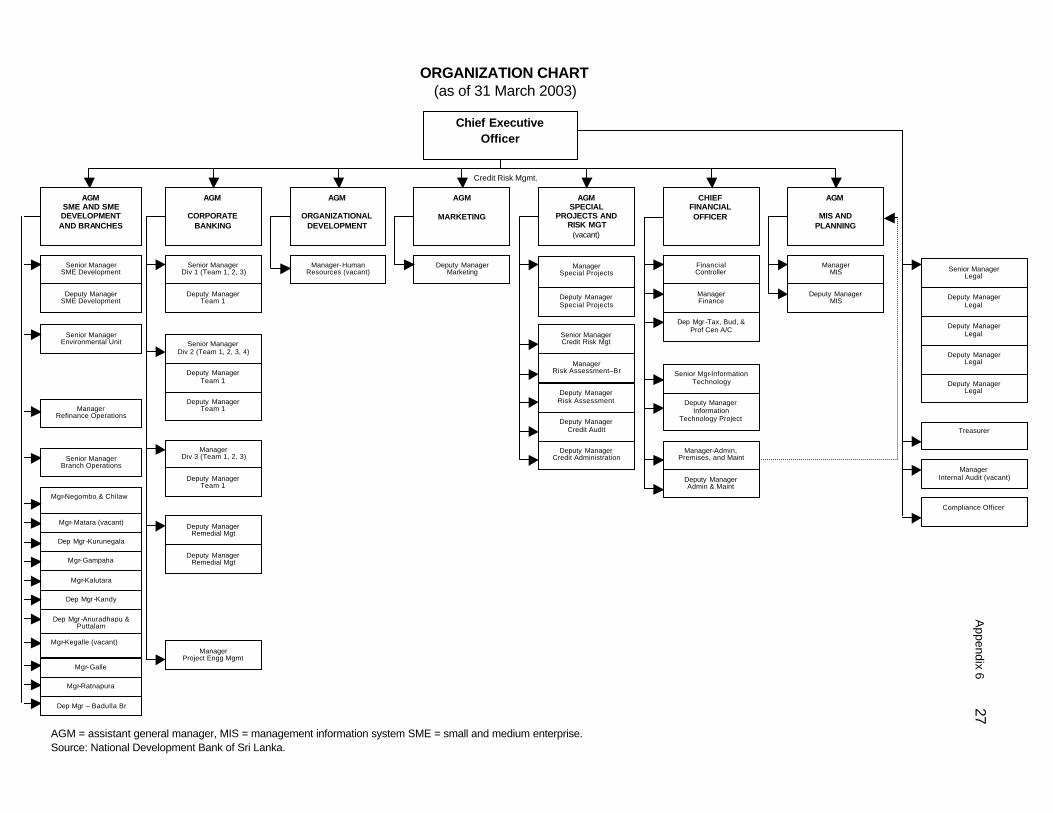
ORGANIZATION CHART (as of 31 March 2003)
Credit Risk Mgmt.
Chief Executive Officer
AGM
CORPORATE BANKING
AGM
ORGANIZATIONAL DEVELOPMENT
AGM
MIS AND PLANNING
AGM SPECIAL
PROJECTS AND RISK MGT
(vacant)
AGM
MARKETING
Deputy Manager SME Development
Senior Manager SME Development
Senior Manager Environmental Unit
Senior Manager Div 1 (Team 1, 2, 3)
Deputy Manager Team 1
Senior Manager Div 2 (Team 1, 2, 3, 4)
Deputy Manager Team 1
Manager-Human Resources (vacant)
Manager-Admin, Premises, and Maint
Senior Manager Credit Risk Mgt
Manager Special Projects
Deputy Manager Marketing
Financial Controller
Manager Finance
Senior Mgr-Information Technology
CHIEF FINANCIAL OFFICER
Manager Refinance Operations
Senior Manager Branch Operations
Manager MIS
Manager Risk Assessment–Br
Dep Mgr -Tax, Bud, & Prof Cen A/C
Manager Internal Audit (vacant)
Treasurer
AGM SME AND SME DEVELOPMENT AND BRANCHES
Deputy Manager MIS
Senior Manager Legal
Mgr-Negombo & Chilaw
Mgr-Matara (vacant)
Dep Mgr -Kurunegala
Mgr-Gampaha
Mgr-Kalutara
Dep Mgr -Kandy
Dep Mgr -Anuradhapu & Puttalam
Mgr-Kegalle (vacant)
Mgr-Galle
Mgr-Ratnapura
Dep Mgr – Badulla Br
Deputy Manager Special Projects
Compliance Officer
Deputy Manager Team 1
Manager Div 3 (Team 1, 2, 3)
Deputy Manager Team 1
Deputy Manager Remedial Mgt
Deputy Manager Remedial Mgt
Manager Project Engg Mgmt
Deputy Manager Risk Assessment
Deputy Manager Credit Audit
Deputy Manager Credit Administration
Deputy Manager Information
Technology Project
Deputy Manager Admin & Maint
Deputy Manager Legal
Deputy Manager Legal
Deputy Manager Legal
Deputy Manager Legal
AGM = assistant general manager, MIS = management information system SME = small and medium enterprise. Source: National Development Bank of Sri Lanka.
Appendix 6 27
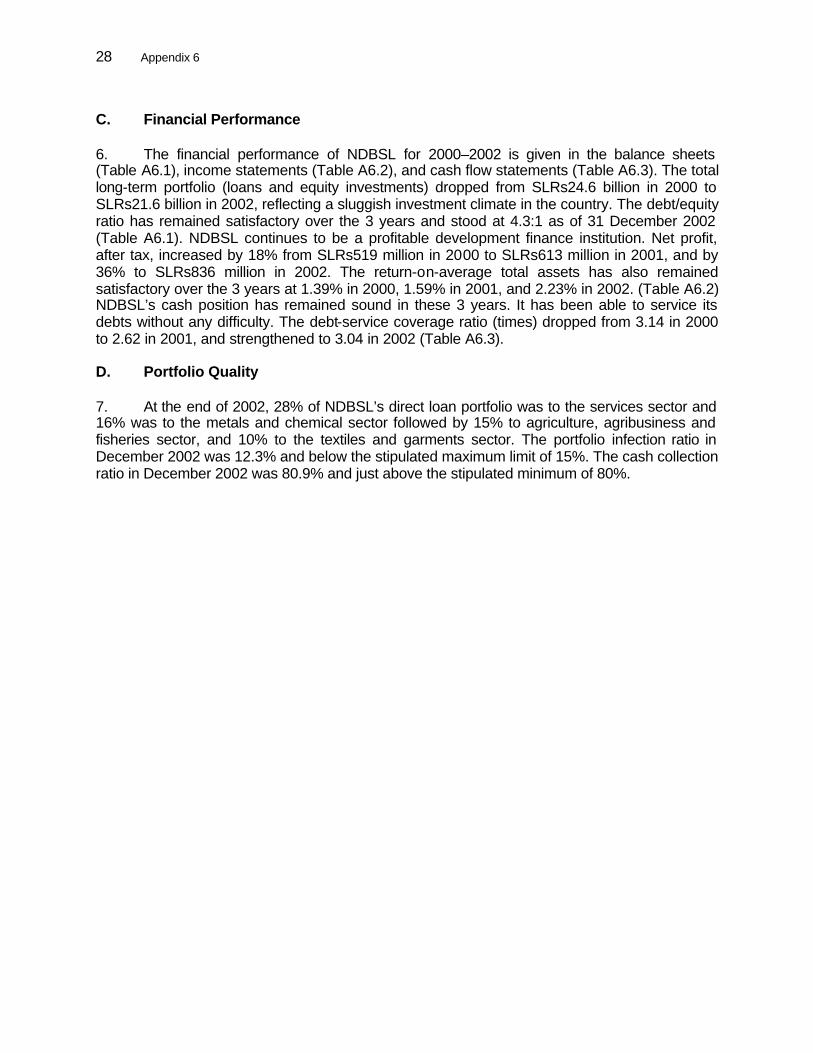
28 Appendix 6
C. Financial Performance 6. The financial performance of NDBSL for 2000–2002 is given in the balance sheets (Table A6.1), income statements (Table A6.2), and cash flow statements (Table A6.3). The total long-term portfolio (loans and equity investments) dropped from SLRs24.6 billion in 2000 to SLRs21.6 billion in 2002, reflecting a sluggish investment climate in the country. The debt/equity ratio has remained satisfactory over the 3 years and stood at 4.3:1 as of 31 December 2002 (Table A6.1). NDBSL continues to be a profitable development finance institution. Net profit, after tax, increased by 18% from SLRs519 million in 2000 to SLRs613 million in 2001, and by 36% to SLRs836 million in 2002. The return-on-average total assets has also remained satisfactory over the 3 years at 1.39% in 2000, 1.59% in 2001, and 2.23% in 2002. (Table A6.2) NDBSL’s cash position has remained sound in these 3 years. It has been able to service its debts without any difficulty. The debt-service coverage ratio (times) dropped from 3.14 in 2000 to 2.62 in 2001, and strengthened to 3.04 in 2002 (Table A6.3). D. Portfolio Quality 7. At the end of 2002, 28% of NDBSL’s direct loan portfolio was to the services sector and 16% was to the metals and chemical sector followed by 15% to agriculture, agribusiness and fisheries sector, and 10% to the textiles and garments sector. The portfolio infection ratio in December 2002 was 12.3% and below the stipulated maximum limit of 15%. The cash collection ratio in December 2002 was 80.9% and just above the stipulated minimum of 80%.
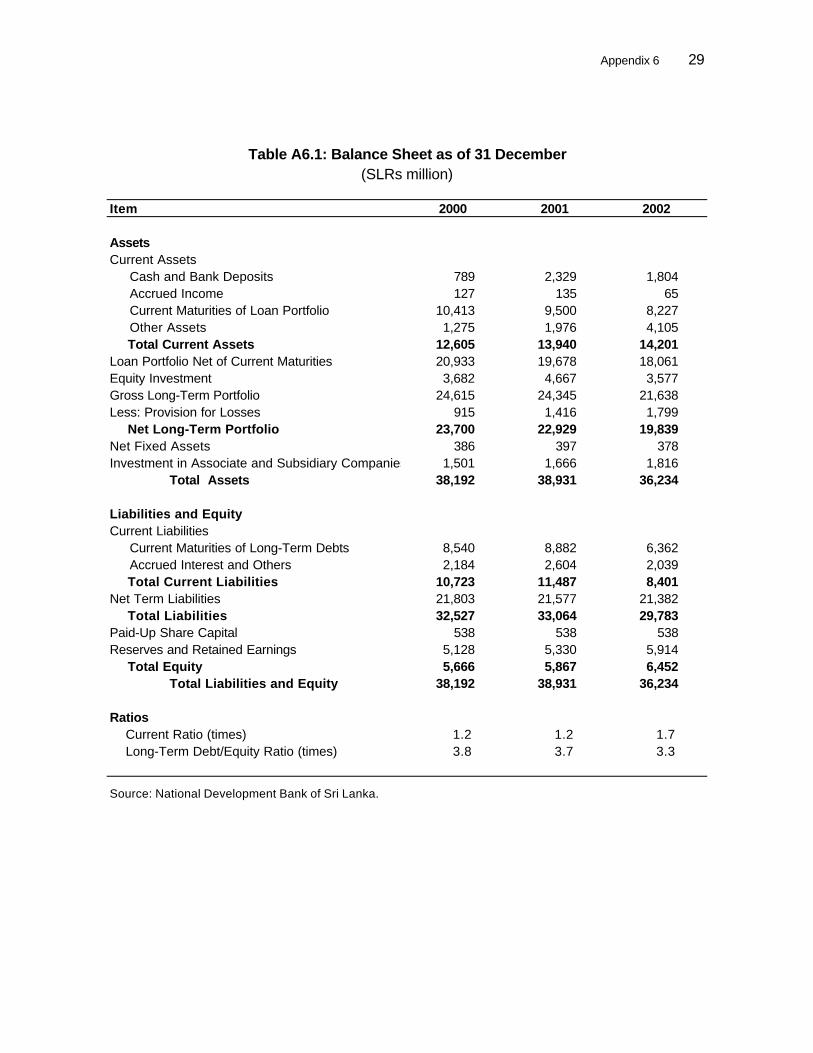
Item
AssetsCurrent Assets Cash and Bank Deposits 789 2,329 1,804 Accrued Income 127 135 65 Current Maturities of Loan Portfolio 10,413 9,500 8,227 Other Assets 1,275 1,976 4,105
Total Current Assets 12,605 13,940 14,201Loan Portfolio Net of Current Maturities 20,933 19,678 18,061Equity Investment 3,682 4,667 3,577Gross Long-Term Portfolio 24,615 24,345 21,638Less: Provision for Losses 915 1,416 1,799
Net Long-Term Portfolio 23,700 22,929 19,839Net Fixed Assets 386 397 378Investment in Associate and Subsidiary Companies -1,501 1,666 1,816
38,192 38,931 36,234
Liabilities and EquityCurrent Liabilities Current Maturities of Long-Term Debts 8,540 8,882 6,362 Accrued Interest and Others 2,184 2,604 2,039
Total Current Liabilities 10,723 11,487 8,401Net Term Liabilities 21,803 21,577 21,382
Total Liabilities 32,527 33,064 29,783Paid-Up Share Capital 538 538 538Reserves and Retained Earnings 5,128 5,330 5,914
Total Equity 5,666 5,867 6,45238,192 38,931 36,234
Ratios Current Ratio (times) 1.2 1.2 1.7 Long-Term Debt/Equity Ratio (times) 3.8 3.7 3.3
Source: National Development Bank of Sri Lanka.
Total Liabilities and Equity
2000 2001 2002
Appendix 6 29
Table A6.1: Balance Sheet as of 31 December(SLRs million)
Total Assets
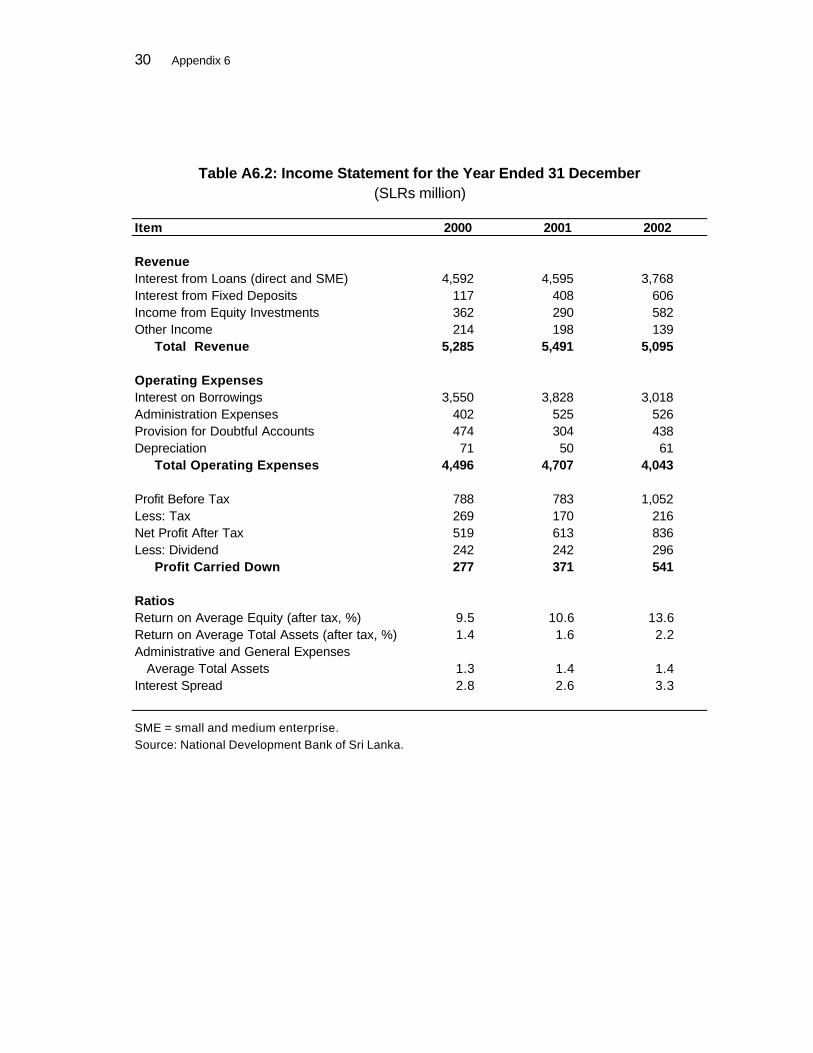
Item
RevenueInterest from Loans (direct and SME) 4,592 4,595 3,768Interest from Fixed Deposits 117 408 606Income from Equity Investments 362 290 582Other Income 214 198 139 Total Revenue 5,285 5,491 5,095
Operating ExpensesInterest on Borrowings 3,550 3,828 3,018Administration Expenses 402 525 526Provision for Doubtful Accounts 474 304 438Depreciation 71 50 61 Total Operating Expenses 4,496 4,707 4,043
Profit Before Tax 788 783 1,052Less: Tax 269 170 216Net Profit After Tax 519 613 836Less: Dividend 242 242 296 Profit Carried Down 277 371 541
RatiosReturn on Average Equity (after tax, %) 9.5 10.6 13.6Return on Average Total Assets (after tax, %) 1.4 1.6 2.2Administrative and General Expenses Average Total Assets 1.3 1.4 1.4Interest Spread 2.8 2.6 3.3
SME = small and medium enterprise.Source: National Development Bank of Sri Lanka.
30 Appendix 6
Table A6.2: Income Statement for the Year Ended 31 December(SLRs million)
2000 2001 2002
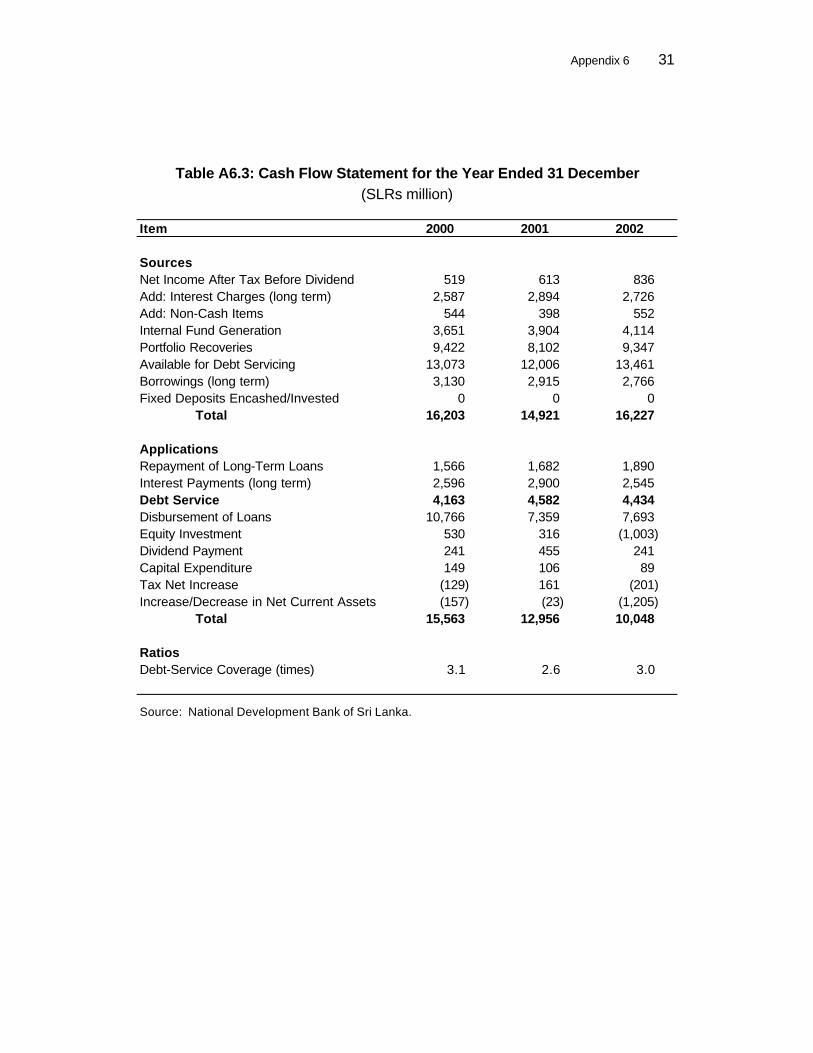
Item
SourcesNet Income After Tax Before Dividend 519 613 836Add: Interest Charges (long term) 2,587 2,894 2,726Add: Non-Cash Items 544 398 552Internal Fund Generation 3,651 3,904 4,114Portfolio Recoveries 9,422 8,102 9,347Available for Debt Servicing 13,073 12,006 13,461Borrowings (long term) 3,130 2,915 2,766Fixed Deposits Encashed/Invested 0 0 0 Total 16,203 14,921 16,227
ApplicationsRepayment of Long-Term Loans 1,566 1,682 1,890Interest Payments (long term) 2,596 2,900 2,545Debt Service 4,163 4,582 4,434Disbursement of Loans 10,766 7,359 7,693Equity Investment 530 316 (1,003)Dividend Payment 241 455 241Capital Expenditure 149 106 89Tax Net Increase (129) 161 (201)Increase/Decrease in Net Current Assets (157) (23) (1,205) Total 15,563 12,956 10,048
RatiosDebt-Service Coverage (times) 3.1 2.6 3.0
Source: National Development Bank of Sri Lanka.
Appendix 6 31
Table A6.3: Cash Flow Statement for the Year Ended 31 December(SLRs million)
2000 2001 2002
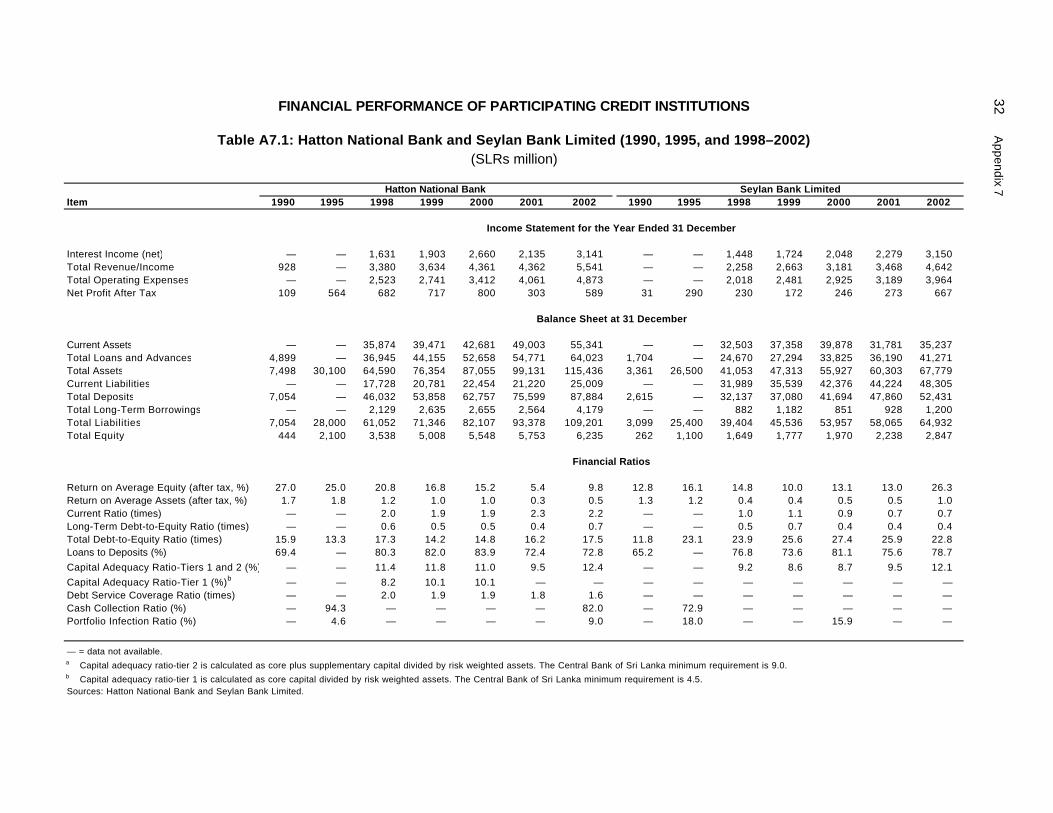
Item
Interest Income (net) — — 1,631 1,903 2,660 2,135 3,141 — — 1,448 1,724 2,048 2,279 3,150Total Revenue/Income 928 — 3,380 3,634 4,361 4,362 5,541 — — 2,258 2,663 3,181 3,468 4,642Total Operating Expenses — — 2,523 2,741 3,412 4,061 4,873 — — 2,018 2,481 2,925 3,189 3,964Net Profit After Tax 109 564 682 717 800 303 589 31 290 230 172 246 273 667
Current Assets — — 35,874 39,471 42,681 49,003 55,341 — — 32,503 37,358 39,878 31,781 35,237Total Loans and Advances 4,899 — 36,945 44,155 52,658 54,771 64,023 1,704 — 24,670 27,294 33,825 36,190 41,271Total Assets 7,498 30,100 64,590 76,354 87,055 99,131 115,436 3,361 26,500 41,053 47,313 55,927 60,303 67,779Current Liabilities — — 17,728 20,781 22,454 21,220 25,009 — — 31,989 35,539 42,376 44,224 48,305Total Deposits 7,054 — 46,032 53,858 62,757 75,599 87,884 2,615 — 32,137 37,080 41,694 47,860 52,431Total Long-Term Borrowings — — 2,129 2,635 2,655 2,564 4,179 — — 882 1,182 851 928 1,200Total Liabilities 7,054 28,000 61,052 71,346 82,107 93,378 109,201 3,099 25,400 39,404 45,536 53,957 58,065 64,932Total Equity 444 2,100 3,538 5,008 5,548 5,753 6,235 262 1,100 1,649 1,777 1,970 2,238 2,847
Return on Average Equity (after tax, %) 27.0 25.0 20.8 16.8 15.2 5.4 9.8 12.8 16.1 14.8 10.0 13.1 13.0 26.3Return on Average Assets (after tax, %) 1.7 1.8 1.2 1.0 1.0 0.3 0.5 1.3 1.2 0.4 0.4 0.5 0.5 1.0Current Ratio (times) — — 2.0 1.9 1.9 2.3 2.2 — — 1.0 1.1 0.9 0.7 0.7Long-Term Debt-to-Equity Ratio (times) — — 0.6 0.5 0.5 0.4 0.7 — — 0.5 0.7 0.4 0.4 0.4Total Debt-to-Equity Ratio (times) 15.9 13.3 17.3 14.2 14.8 16.2 17.5 11.8 23.1 23.9 25.6 27.4 25.9 22.8Loans to Deposits (%) 69.4 — 80.3 82.0 83.9 72.4 72.8 65.2 — 76.8 73.6 81.1 75.6 78.7Capital Adequacy Ratio-Tiers 1 and 2 (%) — — 11.4 11.8 11.0 9.5 12.4 — — 9.2 8.6 8.7 9.5 12.1Capital Adequacy Ratio-Tier 1 (%)b — — 8.2 10.1 10.1 — — — — — — — — —Debt Service Coverage Ratio (times) — — 2.0 1.9 1.9 1.8 1.6 — — — — — — —Cash Collection Ratio (%) — 94.3 — — — — 82.0 — 72.9 — — — — —Portfolio Infection Ratio (%) — 4.6 — — — — 9.0 — 18.0 — — 15.9 — —
— = data not available.a Capital adequacy ratio-tier 2 is calculated as core plus supplementary capital divided by risk weighted assets. The Central Bank of Sri Lanka minimum requirement is 9.0.b Capital adequacy ratio-tier 1 is calculated as core capital divided by risk weighted assets. The Central Bank of Sri Lanka minimum requirement is 4.5.Sources: Hatton National Bank and Seylan Bank Limited.
Financial Ratios
FINANCIAL PERFORMANCE OF PARTICIPATING CREDIT INSTITUTIONS
Table A7.1: Hatton National Bank and Seylan Bank Limited (1990, 1995, and 1998–2002)(SLRs million)
Income Statement for the Year Ended 31 December
2000 2001 2002Seylan Bank Limited
1995 1998 1999
Balance Sheet at 31 December
32 A
ppendix 7
2000 2001 2002Hatton National Bank
1990 1995 1998 1999 1990
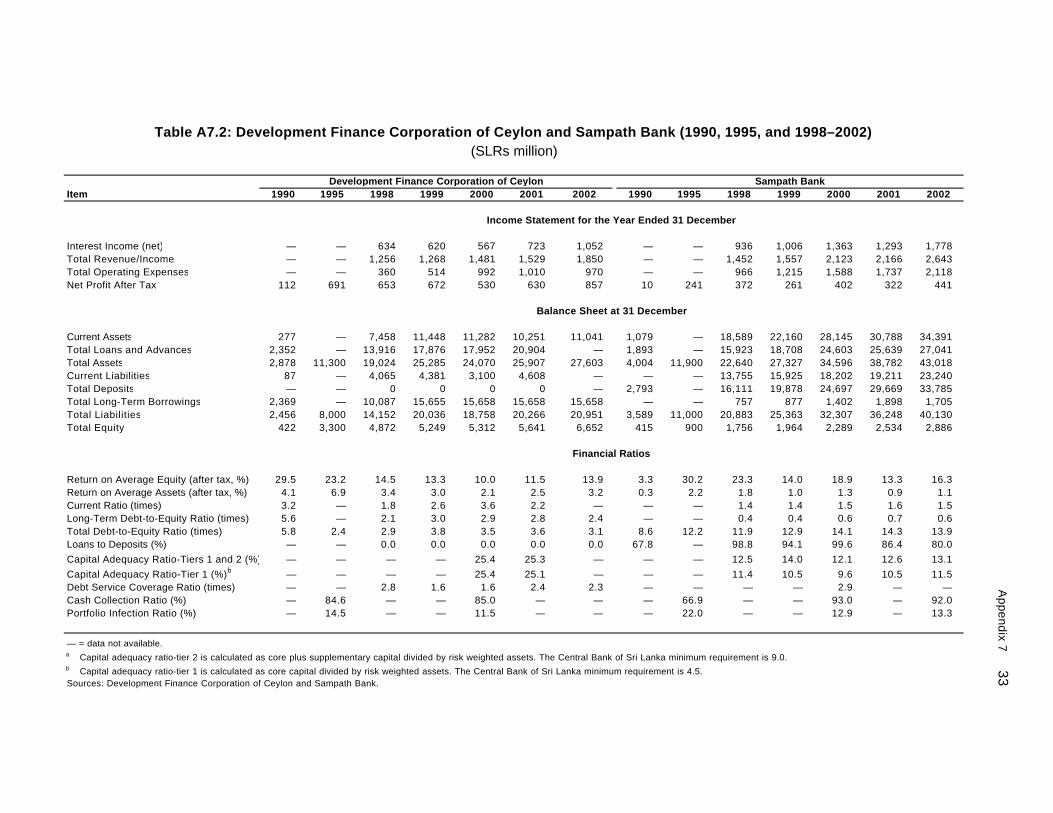
Item
Interest Income (net) — — 634 620 567 723 1,052 — — 936 1,006 1,363 1,293 1,778Total Revenue/Income — — 1,256 1,268 1,481 1,529 1,850 — — 1,452 1,557 2,123 2,166 2,643Total Operating Expenses — — 360 514 992 1,010 970 — — 966 1,215 1,588 1,737 2,118Net Profit After Tax 112 691 653 672 530 630 857 10 241 372 261 402 322 441
Current Assets 277 — 7,458 11,448 11,282 10,251 11,041 1,079 — 18,589 22,160 28,145 30,788 34,391Total Loans and Advances 2,352 — 13,916 17,876 17,952 20,904 — 1,893 — 15,923 18,708 24,603 25,639 27,041Total Assets 2,878 11,300 19,024 25,285 24,070 25,907 27,603 4,004 11,900 22,640 27,327 34,596 38,782 43,018Current Liabilities 87 — 4,065 4,381 3,100 4,608 — — — 13,755 15,925 18,202 19,211 23,240Total Deposits — — 0 0 0 0 — 2,793 — 16,111 19,878 24,697 29,669 33,785Total Long-Term Borrowings 2,369 — 10,087 15,655 15,658 15,658 15,658 — — 757 877 1,402 1,898 1,705Total Liabilities 2,456 8,000 14,152 20,036 18,758 20,266 20,951 3,589 11,000 20,883 25,363 32,307 36,248 40,130Total Equity 422 3,300 4,872 5,249 5,312 5,641 6,652 415 900 1,756 1,964 2,289 2,534 2,886
Return on Average Equity (after tax, %) 29.5 23.2 14.5 13.3 10.0 11.5 13.9 3.3 30.2 23.3 14.0 18.9 13.3 16.3Return on Average Assets (after tax, %) 4.1 6.9 3.4 3.0 2.1 2.5 3.2 0.3 2.2 1.8 1.0 1.3 0.9 1.1Current Ratio (times) 3.2 — 1.8 2.6 3.6 2.2 — — — 1.4 1.4 1.5 1.6 1.5Long-Term Debt-to-Equity Ratio (times) 5.6 — 2.1 3.0 2.9 2.8 2.4 — — 0.4 0.4 0.6 0.7 0.6Total Debt-to-Equity Ratio (times) 5.8 2.4 2.9 3.8 3.5 3.6 3.1 8.6 12.2 11.9 12.9 14.1 14.3 13.9Loans to Deposits (%) — — 0.0 0.0 0.0 0.0 0.0 67.8 — 98.8 94.1 99.6 86.4 80.0Capital Adequacy Ratio-Tiers 1 and 2 (%) — — — — 25.4 25.3 — — — 12.5 14.0 12.1 12.6 13.1Capital Adequacy Ratio-Tier 1 (%)b — — — — 25.4 25.1 — — — 11.4 10.5 9.6 10.5 11.5Debt Service Coverage Ratio (times) — — 2.8 1.6 1.6 2.4 2.3 — — — — 2.9 — —Cash Collection Ratio (%) — 84.6 — — 85.0 — — — 66.9 — — 93.0 — 92.0Portfolio Infection Ratio (%) — 14.5 — — 11.5 — — — 22.0 — — 12.9 — 13.3
— = data not available.a Capital adequacy ratio-tier 2 is calculated as core plus supplementary capital divided by risk weighted assets. The Central Bank of Sri Lanka minimum requirement is 9.0.b Capital adequacy ratio-tier 1 is calculated as core capital divided by risk weighted assets. The Central Bank of Sri Lanka minimum requirement is 4.5.Sources: Development Finance Corporation of Ceylon and Sampath Bank.
2000 2001 2002Development Finance Corporation of Ceylon
1990 1995 1998 1999 1990 1995 1998 1999
Appendix 7 33
Balance Sheet at 31 December
Financial Ratios
Table A7.2: Development Finance Corporation of Ceylon and Sampath Bank (1990, 1995, and 1998–2002)(SLRs million)
Income Statement for the Year Ended 31 December
2000 2001 2002Sampath Bank
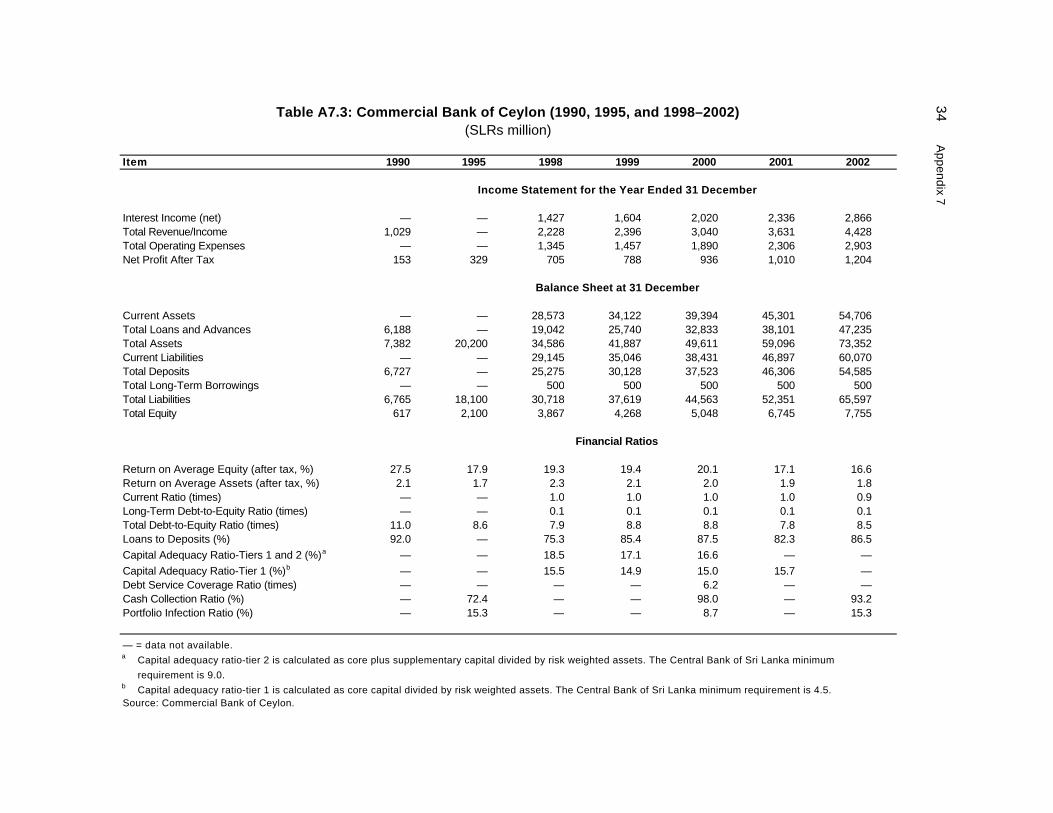
Item
Interest Income (net) — — 1,427 1,604 2,020 2,336 2,866Total Revenue/Income 1,029 — 2,228 2,396 3,040 3,631 4,428Total Operating Expenses — — 1,345 1,457 1,890 2,306 2,903Net Profit After Tax 153 329 705 788 936 1,010 1,204
Current Assets — — 28,573 34,122 39,394 45,301 54,706Total Loans and Advances 6,188 — 19,042 25,740 32,833 38,101 47,235Total Assets 7,382 20,200 34,586 41,887 49,611 59,096 73,352Current Liabilities — — 29,145 35,046 38,431 46,897 60,070Total Deposits 6,727 — 25,275 30,128 37,523 46,306 54,585Total Long-Term Borrowings — — 500 500 500 500 500Total Liabilities 6,765 18,100 30,718 37,619 44,563 52,351 65,597Total Equity 617 2,100 3,867 4,268 5,048 6,745 7,755
Return on Average Equity (after tax, %) 27.5 17.9 19.3 19.4 20.1 17.1 16.6Return on Average Assets (after tax, %) 2.1 1.7 2.3 2.1 2.0 1.9 1.8Current Ratio (times) — — 1.0 1.0 1.0 1.0 0.9Long-Term Debt-to-Equity Ratio (times) — — 0.1 0.1 0.1 0.1 0.1Total Debt-to-Equity Ratio (times) 11.0 8.6 7.9 8.8 8.8 7.8 8.5Loans to Deposits (%) 92.0 — 75.3 85.4 87.5 82.3 86.5Capital Adequacy Ratio-Tiers 1 and 2 (%)a — — 18.5 17.1 16.6 — —Capital Adequacy Ratio-Tier 1 (%)b — — 15.5 14.9 15.0 15.7 —Debt Service Coverage Ratio (times) — — — — 6.2 — —Cash Collection Ratio (%) — 72.4 — — 98.0 — 93.2Portfolio Infection Ratio (%) — 15.3 — — 8.7 — 15.3
— = data not available.a Capital adequacy ratio-tier 2 is calculated as core plus supplementary capital divided by risk weighted assets. The Central Bank of Sri Lanka minimum
requirement is 9.0.b Capital adequacy ratio-tier 1 is calculated as core capital divided by risk weighted assets. The Central Bank of Sri Lanka minimum requirement is 4.5.Source: Commercial Bank of Ceylon.
1999
Balance Sheet at 31 December
Financial Ratios
Table A7.3: Commercial Bank of Ceylon (1990, 1995, and 1998–2002)(SLRs million)
34 Appendix 7Income Statement for the Year Ended 31 December
20022000 20011990 1995 1998
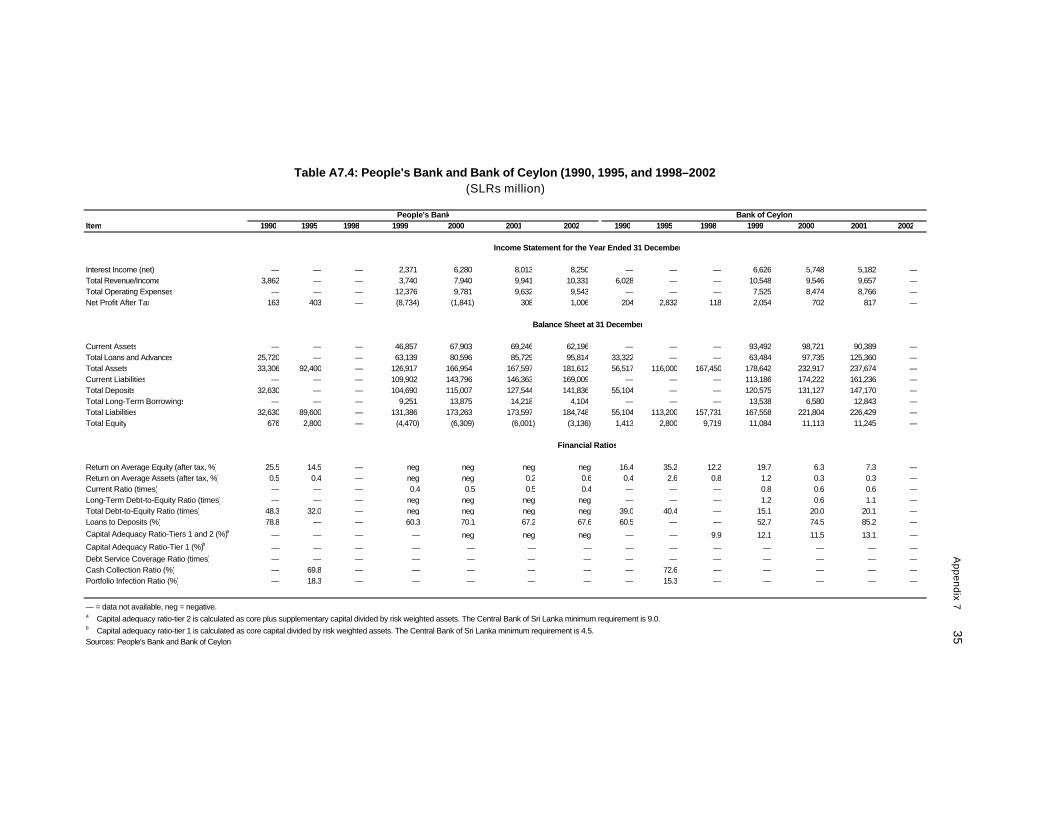
Item
Interest Income (net) — — — 2,371 6,280 8,013 8,250 — — — 6,626 5,748 5,182 —Total Revenue/Income 3,862 — — 3,740 7,940 9,941 10,331 6,028 — — 10,548 9,546 9,657 —Total Operating Expenses — — — 12,376 9,781 9,632 9,543 — — — 7,525 8,474 8,766 —Net Profit After Tax 163 403 — (8,734) (1,841) 308 1,006 204 2,832 118 2,054 702 817 —
Current Assets — — — 46,857 67,903 69,246 62,196 — — — 93,492 98,721 90,389 —Total Loans and Advances 25,720 — — 63,139 80,596 85,729 95,814 33,322 — — 63,484 97,735 125,360 —Total Assets 33,306 92,400 — 126,917 166,954 167,597 181,612 56,517 116,000 167,450 178,642 232,917 237,674 —Current Liabilities — — — 109,902 143,796 146,363 169,009 — — — 113,186 174,222 161,236 —Total Deposits 32,630 — — 104,690 115,007 127,544 141,836 55,104 — — 120,575 131,127 147,170 —Total Long-Term Borrowings — — — 9,251 13,875 14,218 4,104 — — — 13,538 6,580 12,843 —Total Liabilities 32,630 89,600 — 131,386 173,263 173,597 184,748 55,104 113,200 157,731 167,558 221,804 226,429 —Total Equity 676 2,800 — (4,470) (6,309) (6,001) (3,136) 1,413 2,800 9,719 11,084 11,113 11,245 —
Return on Average Equity (after tax, %) 25.5 14.5 — neg neg neg neg 16.4 35.2 12.2 19.7 6.3 7.3 —Return on Average Assets (after tax, %) 0.5 0.4 — neg neg 0.2 0.6 0.4 2.6 0.8 1.2 0.3 0.3 —Current Ratio (times) — — — 0.4 0.5 0.5 0.4 — — — 0.8 0.6 0.6 —Long-Term Debt-to-Equity Ratio (times) — — — neg neg neg neg — — — 1.2 0.6 1.1 —Total Debt-to-Equity Ratio (times) 48.3 32.0 — neg neg neg neg 39.0 40.4 — 15.1 20.0 20.1 —Loans to Deposits (%) 78.8 — — 60.3 70.1 67.2 67.6 60.5 — — 52.7 74.5 85.2 —Capital Adequacy Ratio-Tiers 1 and 2 (%)a — — — — neg neg neg — — 9.9 12.1 11.5 13.1 —Capital Adequacy Ratio-Tier 1 (%)b — — — — — — — — — — — — — —Debt Service Coverage Ratio (times) — — — — — — — — — — — — — —Cash Collection Ratio (%) — 69.8 — — — — — — 72.6 — — — — —Portfolio Infection Ratio (%) — 18.3 — — — — — — 15.3 — — — — —
— = data not available, neg = negative.a Capital adequacy ratio-tier 2 is calculated as core plus supplementary capital divided by risk weighted assets. The Central Bank of Sri Lanka minimum requirement is 9.0.b Capital adequacy ratio-tier 1 is calculated as core capital divided by risk weighted assets. The Central Bank of Sri Lanka minimum requirement is 4.5.Sources: People's Bank and Bank of Ceylon.
Bank of Ceylon19902001 2002
Appendix 7
35
People's Bank1990 1995 1998 1999 1995 1998
Table A7.4: People's Bank and Bank of Ceylon (1990, 1995, and 1998–2002)(SLRs million)
19992000
Balance Sheet at 31 December
Financial Ratios
Income Statement for the Year Ended 31 December
2000 2001 2002
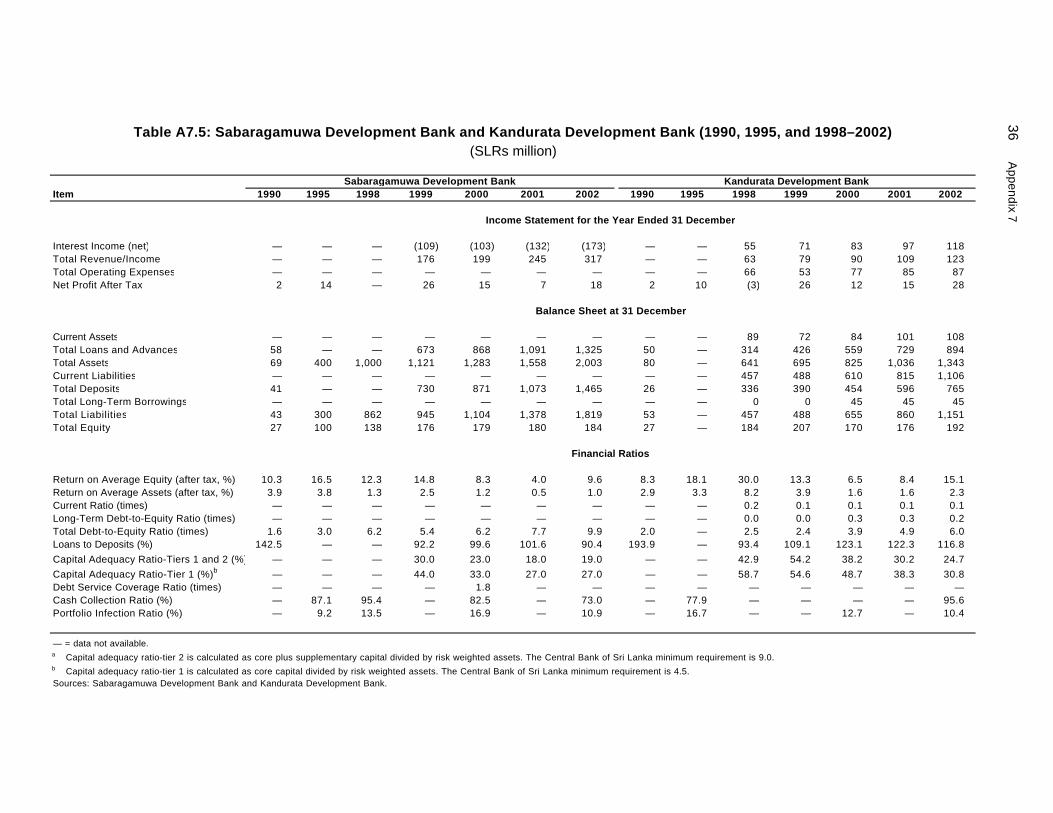
Item
Interest Income (net) — — — (109) (103) (132) (173) — — 55 71 83 97 118Total Revenue/Income — — — 176 199 245 317 — — 63 79 90 109 123Total Operating Expenses — — — — — — — — — 66 53 77 85 87Net Profit After Tax 2 14 — 26 15 7 18 2 10 (3) 26 12 15 28
Current Assets — — — — — — — — — 89 72 84 101 108Total Loans and Advances 58 — — 673 868 1,091 1,325 50 — 314 426 559 729 894Total Assets 69 400 1,000 1,121 1,283 1,558 2,003 80 — 641 695 825 1,036 1,343Current Liabilities — — — — — — — — — 457 488 610 815 1,106Total Deposits 41 — — 730 871 1,073 1,465 26 — 336 390 454 596 765Total Long-Term Borrowings — — — — — — — — — 0 0 45 45 45Total Liabilities 43 300 862 945 1,104 1,378 1,819 53 — 457 488 655 860 1,151Total Equity 27 100 138 176 179 180 184 27 — 184 207 170 176 192
Return on Average Equity (after tax, %) 10.3 16.5 12.3 14.8 8.3 4.0 9.6 8.3 18.1 30.0 13.3 6.5 8.4 15.1Return on Average Assets (after tax, %) 3.9 3.8 1.3 2.5 1.2 0.5 1.0 2.9 3.3 8.2 3.9 1.6 1.6 2.3Current Ratio (times) — — — — — — — — — 0.2 0.1 0.1 0.1 0.1Long-Term Debt-to-Equity Ratio (times) — — — — — — — — — 0.0 0.0 0.3 0.3 0.2Total Debt-to-Equity Ratio (times) 1.6 3.0 6.2 5.4 6.2 7.7 9.9 2.0 — 2.5 2.4 3.9 4.9 6.0Loans to Deposits (%) 142.5 — — 92.2 99.6 101.6 90.4 193.9 — 93.4 109.1 123.1 122.3 116.8Capital Adequacy Ratio-Tiers 1 and 2 (%) — — — 30.0 23.0 18.0 19.0 — — 42.9 54.2 38.2 30.2 24.7Capital Adequacy Ratio-Tier 1 (%)b — — — 44.0 33.0 27.0 27.0 — — 58.7 54.6 48.7 38.3 30.8Debt Service Coverage Ratio (times) — — — — 1.8 — — — — — — — — —Cash Collection Ratio (%) — 87.1 95.4 — 82.5 — 73.0 — 77.9 — — — — 95.6Portfolio Infection Ratio (%) — 9.2 13.5 — 16.9 — 10.9 — 16.7 — — 12.7 — 10.4
— = data not available.a Capital adequacy ratio-tier 2 is calculated as core plus supplementary capital divided by risk weighted assets. The Central Bank of Sri Lanka minimum requirement is 9.0.b Capital adequacy ratio-tier 1 is calculated as core capital divided by risk weighted assets. The Central Bank of Sri Lanka minimum requirement is 4.5.Sources: Sabaragamuwa Development Bank and Kandurata Development Bank.
2000 2001 2002Sabaragamuwa Development Bank
1990 1995 1998 1999 1990 1995 1998 1999
36 A
ppendix 7
Balance Sheet at 31 December
Financial Ratios
Table A7.5: Sabaragamuwa Development Bank and Kandurata Development Bank (1990, 1995, and 1998–2002)(SLRs million)
Income Statement for the Year Ended 31 December
2000 2001 2002Kandurata Development Bank
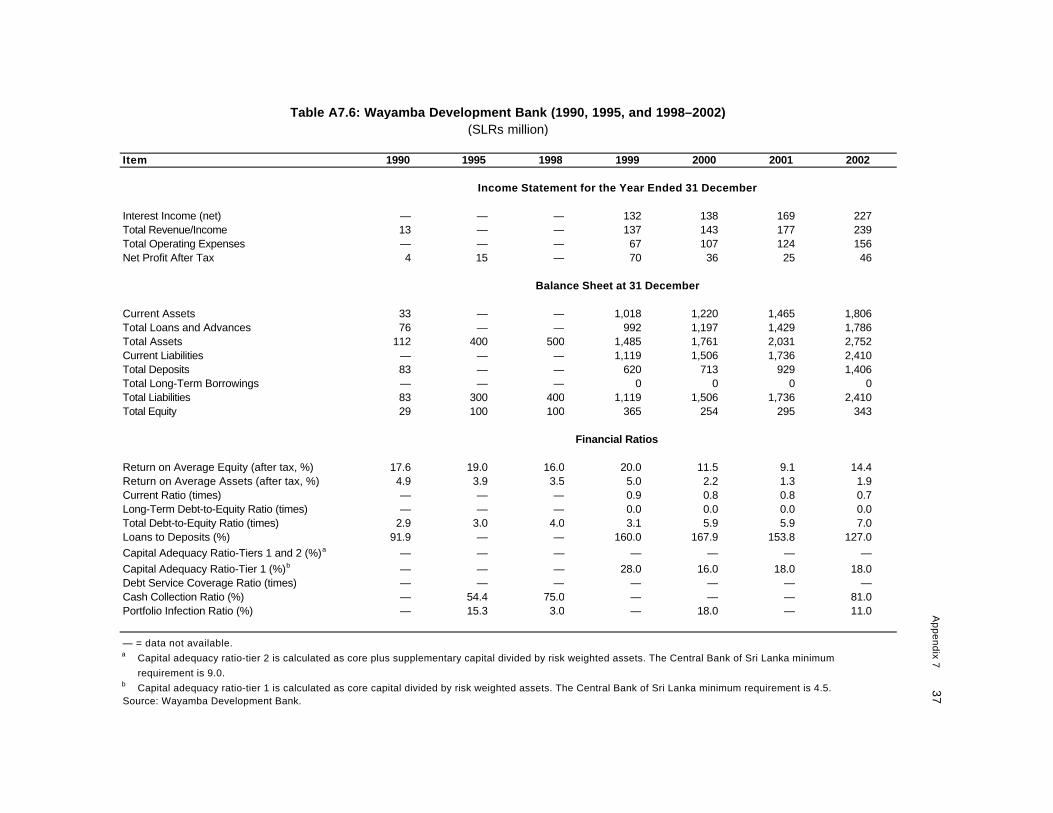
Item
Interest Income (net) — — — 132 138 169 227Total Revenue/Income 13 — — 137 143 177 239Total Operating Expenses — — — 67 107 124 156Net Profit After Tax 4 15 — 70 36 25 46
Current Assets 33 — — 1,018 1,220 1,465 1,806Total Loans and Advances 76 — — 992 1,197 1,429 1,786Total Assets 112 400 500 1,485 1,761 2,031 2,752Current Liabilities — — — 1,119 1,506 1,736 2,410Total Deposits 83 — — 620 713 929 1,406Total Long-Term Borrowings — — — 0 0 0 0Total Liabilities 83 300 400 1,119 1,506 1,736 2,410Total Equity 29 100 100 365 254 295 343
Return on Average Equity (after tax, %) 17.6 19.0 16.0 20.0 11.5 9.1 14.4Return on Average Assets (after tax, %) 4.9 3.9 3.5 5.0 2.2 1.3 1.9Current Ratio (times) — — — 0.9 0.8 0.8 0.7Long-Term Debt-to-Equity Ratio (times) — — — 0.0 0.0 0.0 0.0Total Debt-to-Equity Ratio (times) 2.9 3.0 4.0 3.1 5.9 5.9 7.0Loans to Deposits (%) 91.9 — — 160.0 167.9 153.8 127.0Capital Adequacy Ratio-Tiers 1 and 2 (%)a — — — — — — —Capital Adequacy Ratio-Tier 1 (%)b — — — 28.0 16.0 18.0 18.0Debt Service Coverage Ratio (times) — — — — — — —Cash Collection Ratio (%) — 54.4 75.0 — — — 81.0Portfolio Infection Ratio (%) — 15.3 3.0 — 18.0 — 11.0
— = data not available.a Capital adequacy ratio-tier 2 is calculated as core plus supplementary capital divided by risk weighted assets. The Central Bank of Sri Lanka minimum
requirement is 9.0.b Capital adequacy ratio-tier 1 is calculated as core capital divided by risk weighted assets. The Central Bank of Sri Lanka minimum requirement is 4.5.Source: Wayamba Development Bank.
(SLRs million)
Financial Ratios
Appendix 7 37
Income Statement for the Year Ended 31 December
20022000 20011990
Table A7.6: Wayamba Development Bank (1990, 1995, and 1998–2002)
1995 1998 1999
Balance Sheet at 31 December
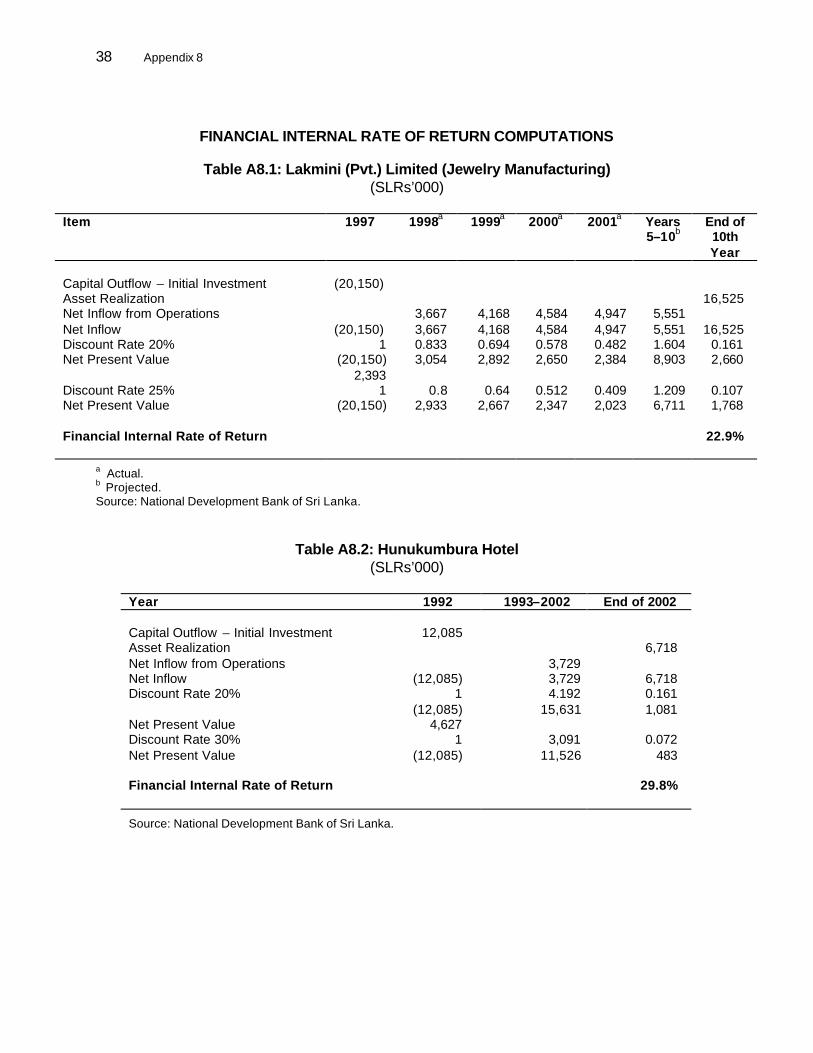
Appendix 8 38
FINANCIAL INTERNAL RATE OF RETURN COMPUTATIONS
Table A8.1: Lakmini (Pvt.) Limited (Jewelry Manufacturing) (SLRs’000)
Item 1997 1998a 1999a 2000a 2001a Years
5–10b End of 10th Year
Capital Outflow – Initial Investment (20,150) Asset Realization 16,525 Net Inflow from Operations 3,667 4,168 4,584 4,947 5,551 Net Inflow (20,150) 3,667 4,168 4,584 4,947 5,551 16,525 Discount Rate 20% 1 0.833 0.694 0.578 0.482 1.604 0.161 Net Present Value (20,150) 3,054 2,892 2,650 2,384 8,903 2,660 2,393 Discount Rate 25% 1 0.8 0.64 0.512 0.409 1.209 0.107 Net Present Value (20,150) 2,933 2,667 2,347 2,023 6,711 1,768 Financial Internal Rate of Return 22.9%
a Actual. b Projected. Source: National Development Bank of Sri Lanka.
Table A8.2: Hunukumbura Hotel (SLRs’000)
Year 1992 1993–2002 End of 2002 Capital Outflow – Initial Investment 12,085 Asset Realization 6,718 Net Inflow from Operations 3,729 Net Inflow (12,085) 3,729 6,718 Discount Rate 20% 1 4.192 0.161 (12,085) 15,631 1,081 Net Present Value 4,627 Discount Rate 30% 1 3,091 0.072 Net Present Value (12,085) 11,526 483 Financial Internal Rate of Return 29.8%
Source: National Development Bank of Sri Lanka.