Asian Development Bank Institute · Asian Development Bank Institute . ... across different...
31
ADBI Working Paper Series Infrastructure and Urbanization in the People’s Republic of China Zhigang Li No. 632 January 2017 Asian Development Bank Institute
Transcript of Asian Development Bank Institute · Asian Development Bank Institute . ... across different...
ADBI Working Paper Series
Infrastructure and Urbanization in the People’s Republic of China
Zhigang Li
No. 632 January 2017
Asian Development Bank Institute
The Working Paper series is a continuation of the formerly named Discussion Paper series; the numbering of the papers continued without interruption or change. ADBI’s working papers reflect initial ideas on a topic and are posted online for discussion. ADBI encourages readers to post their comments on the main page for each working paper (given in the citation below). Some working papers may develop into other forms of publication.
Disclaimer: ADB recognizes "China" as the People's Republic of China.
Suggested citation:
Li, Z. 2017. Infrastructure and Urbanization in the People’s Republic of China. ADBI Working Paper 632. Tokyo: Asian Development Bank Institute. Available: https://www.adb.org/publications/infrastructure-and-urbanization-prc Please contact the author for information about this paper.
E-mail: [email protected]
Zhigang Li is an economist at the Asian Development Bank. The views expressed in this paper are the views of the author and do not necessarily reflect the views or policies of ADBI, ADB, its Board of Directors, or the governments they represent. ADBI does not guarantee the accuracy of the data included in this paper and accepts no responsibility for any consequences of their use. Terminology used may not necessarily be consistent with ADB official terms. Working papers are subject to formal revision and correction before they are finalized and considered published.
Asian Development Bank Institute Kasumigaseki Building 8F 3-2-5 Kasumigaseki, Chiyoda-ku Tokyo 100-6008, Japan Tel: +81-3-3593-5500 Fax: +81-3-3593-5571 URL: www.adbi.org E-mail: [email protected] © 2017 Asian Development Bank and Asian Development Bank Institute
ADBI Working Paper 632 Li
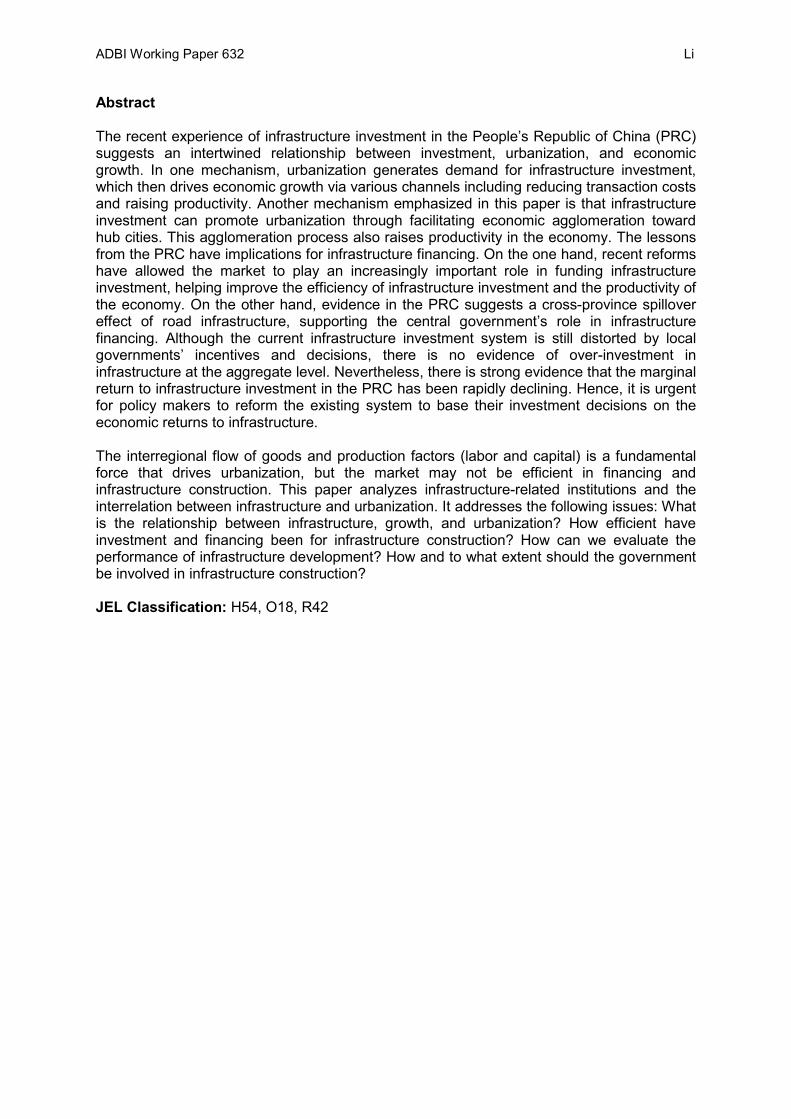
Abstract The recent experience of infrastructure investment in the People’s Republic of China (PRC) suggests an intertwined relationship between investment, urbanization, and economic growth. In one mechanism, urbanization generates demand for infrastructure investment, which then drives economic growth via various channels including reducing transaction costs and raising productivity. Another mechanism emphasized in this paper is that infrastructure investment can promote urbanization through facilitating economic agglomeration toward hub cities. This agglomeration process also raises productivity in the economy. The lessons from the PRC have implications for infrastructure financing. On the one hand, recent reforms have allowed the market to play an increasingly important role in funding infrastructure investment, helping improve the efficiency of infrastructure investment and the productivity of the economy. On the other hand, evidence in the PRC suggests a cross-province spillover effect of road infrastructure, supporting the central government’s role in infrastructure financing. Although the current infrastructure investment system is still distorted by local governments’ incentives and decisions, there is no evidence of over-investment in infrastructure at the aggregate level. Nevertheless, there is strong evidence that the marginal return to infrastructure investment in the PRC has been rapidly declining. Hence, it is urgent for policy makers to reform the existing system to base their investment decisions on the economic returns to infrastructure. The interregional flow of goods and production factors (labor and capital) is a fundamental force that drives urbanization, but the market may not be efficient in financing and infrastructure construction. This paper analyzes infrastructure-related institutions and the interrelation between infrastructure and urbanization. It addresses the following issues: What is the relationship between infrastructure, growth, and urbanization? How efficient have investment and financing been for infrastructure construction? How can we evaluate the performance of infrastructure development? How and to what extent should the government be involved in infrastructure construction? JEL Classification: H54, O18, R42
ADBI Working Paper 632 Li
Contents
1. Introduction ................................................................................................................ 1
1.1 Overview of Infrastructure Development in the PRC ...................................... 1 1.2 Cross-Regional Distribution of Infrastructure .................................................. 4 1.3 Cross-Country Comparison of Infrastructure Development ............................ 5
2. Institutional Changes and Infrastructure Development ............................................... 9
2.1 Electricity Generation Infrastructure ............................................................... 9 2.2 Highways and Railroads .............................................................................. 10 2.3 Telecommunications Infrastructure .............................................................. 11
3. Infrastructure Financing ........................................................................................... 11
3.1 Development of Infrastructure Financing System in the PRC ....................... 11 3.2 Decentralized Infrastructure Financing in the PRC ....................................... 15
4. Infrastructure–Growth–Urbanization Relationship .................................................... 16
4.1 Infrastructure Investment and Growth in the PRC ........................................ 16 4.2 Infrastructure Investment and Urbanization .................................................. 19
5. Policy Recommendations ........................................................................................ 21
References ......................................................................................................................... 23
Appendix ............................................................................................................................. 26
ADBI Working Paper 632 Li
1. INTRODUCTION Infrastructure is defined as the provision of basic services to industries and households (Lee and Martini 1996). It typically includes energy (power generation and supply), transport (toll roads, light rail systems, bridges, and tunnels), water (sewerage, waste water treatment, and water supply), and telecommunications (telephones) (Grimsey and Lewis 2002). To provide a broad picture of the development of infrastructure in the People’s Republic of China (PRC), in this section, we first summarize its major trends and features in the past 2 decades. We then conduct a cross-country comparison to gauge the status of infrastructure in the PRC. In this comparison, we pay particular attention to the PRC and India in their infrastructure development progress.
1.1 Overview of Infrastructure Development in the PRC
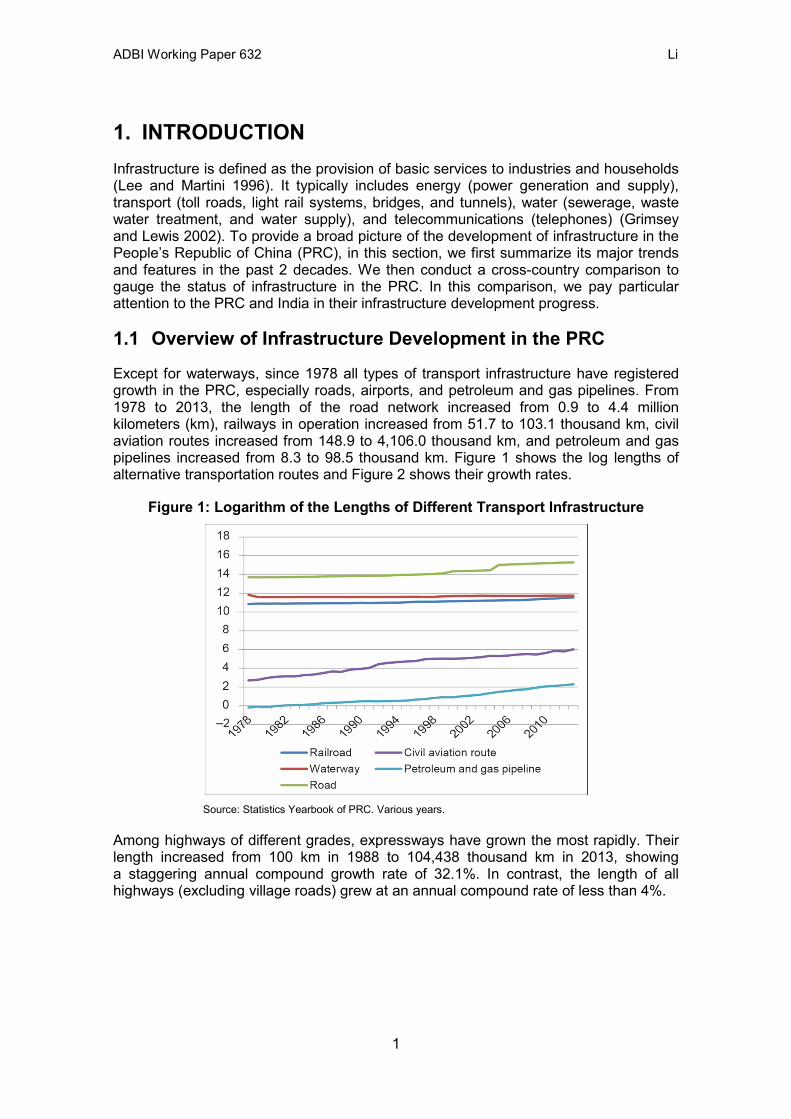
Except for waterways, since 1978 all types of transport infrastructure have registered growth in the PRC, especially roads, airports, and petroleum and gas pipelines. From 1978 to 2013, the length of the road network increased from 0.9 to 4.4 million kilometers (km), railways in operation increased from 51.7 to 103.1 thousand km, civil aviation routes increased from 148.9 to 4,106.0 thousand km, and petroleum and gas pipelines increased from 8.3 to 98.5 thousand km. Figure 1 shows the log lengths of alternative transportation routes and Figure 2 shows their growth rates.
Figure 1: Logarithm of the Lengths of Different Transport Infrastructure
Source: Statistics Yearbook of PRC. Various years.
Among highways of different grades, expressways have grown the most rapidly. Their length increased from 100 km in 1988 to 104,438 thousand km in 2013, showing a staggering annual compound growth rate of 32.1%. In contrast, the length of all highways (excluding village roads) grew at an annual compound rate of less than 4%.
1
ADBI Working Paper 632 Li
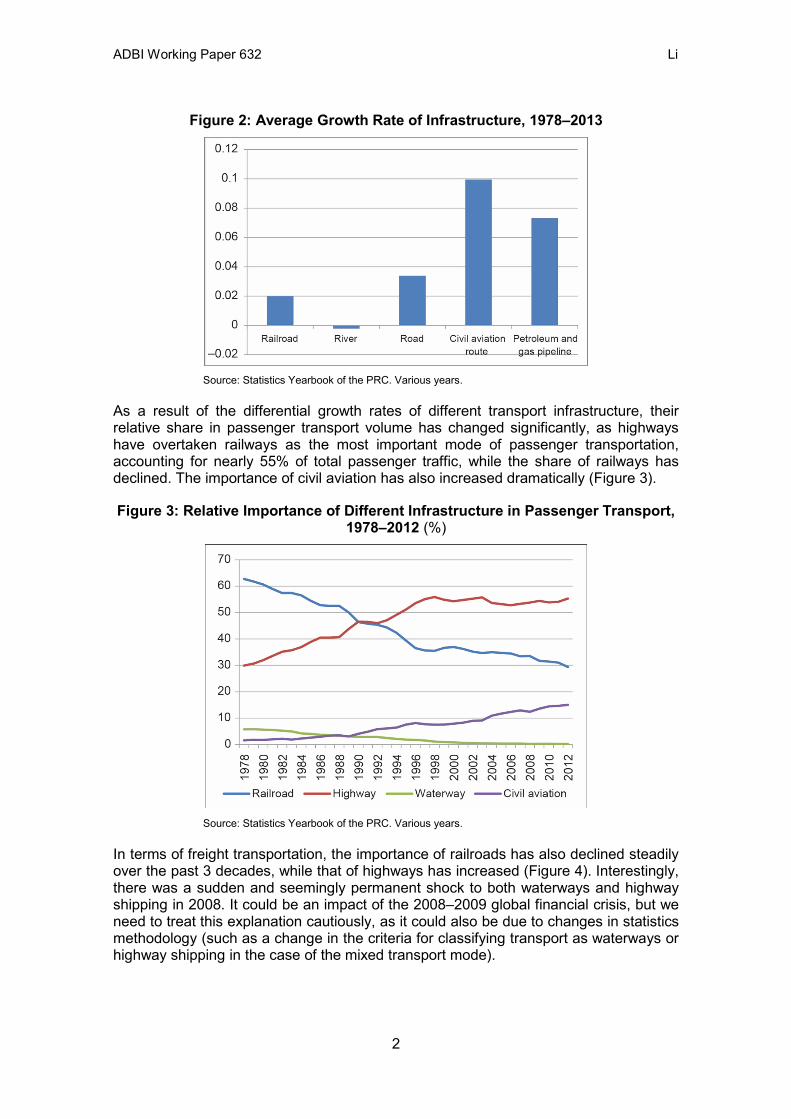
Figure 2: Average Growth Rate of Infrastructure, 1978–2013
Source: Statistics Yearbook of the PRC. Various years.
As a result of the differential growth rates of different transport infrastructure, their relative share in passenger transport volume has changed significantly, as highways have overtaken railways as the most important mode of passenger transportation, accounting for nearly 55% of total passenger traffic, while the share of railways has declined. The importance of civil aviation has also increased dramatically (Figure 3).
Figure 3: Relative Importance of Different Infrastructure in Passenger Transport, 1978–2012 (%)
Source: Statistics Yearbook of the PRC. Various years.
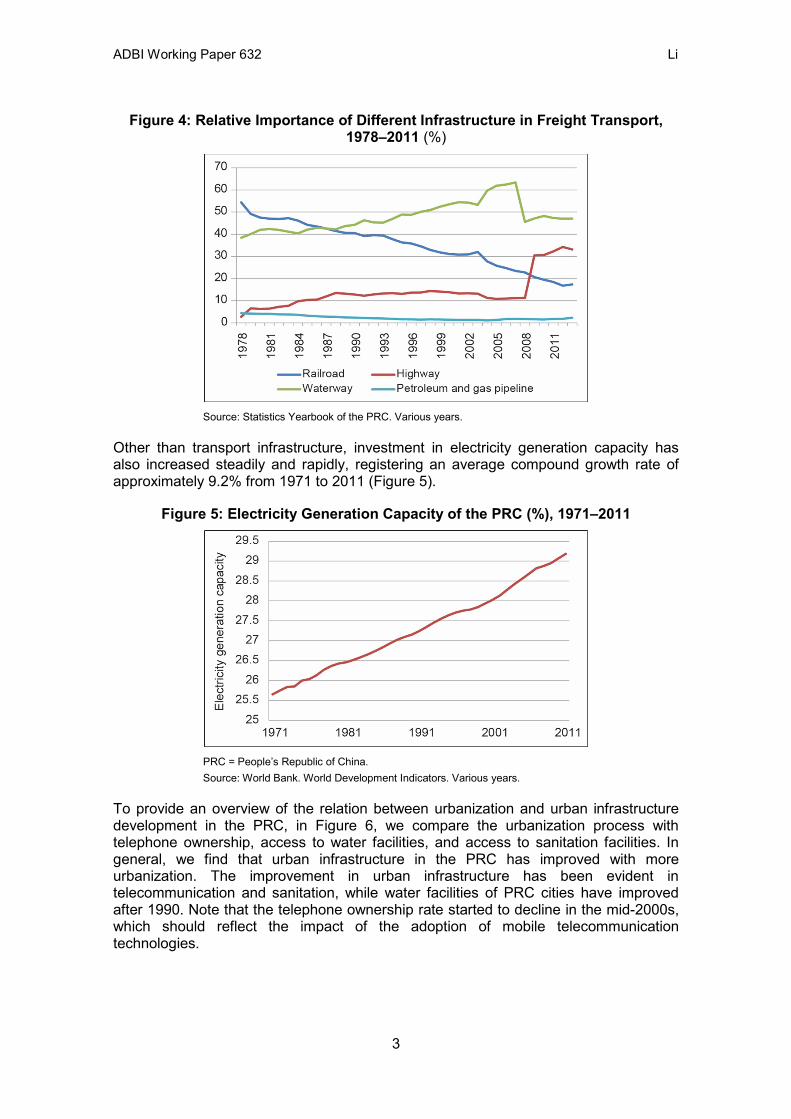
In terms of freight transportation, the importance of railroads has also declined steadily over the past 3 decades, while that of highways has increased (Figure 4). Interestingly, there was a sudden and seemingly permanent shock to both waterways and highway shipping in 2008. It could be an impact of the 2008–2009 global financial crisis, but we need to treat this explanation cautiously, as it could also be due to changes in statistics methodology (such as a change in the criteria for classifying transport as waterways or highway shipping in the case of the mixed transport mode).
2
ADBI Working Paper 632 Li
Figure 4: Relative Importance of Different Infrastructure in Freight Transport, 1978–2011 (%)
Source: Statistics Yearbook of the PRC. Various years.
Other than transport infrastructure, investment in electricity generation capacity has also increased steadily and rapidly, registering an average compound growth rate of approximately 9.2% from 1971 to 2011 (Figure 5).
Figure 5: Electricity Generation Capacity of the PRC (%), 1971–2011
PRC = People’s Republic of China. Source: World Bank. World Development Indicators. Various years.
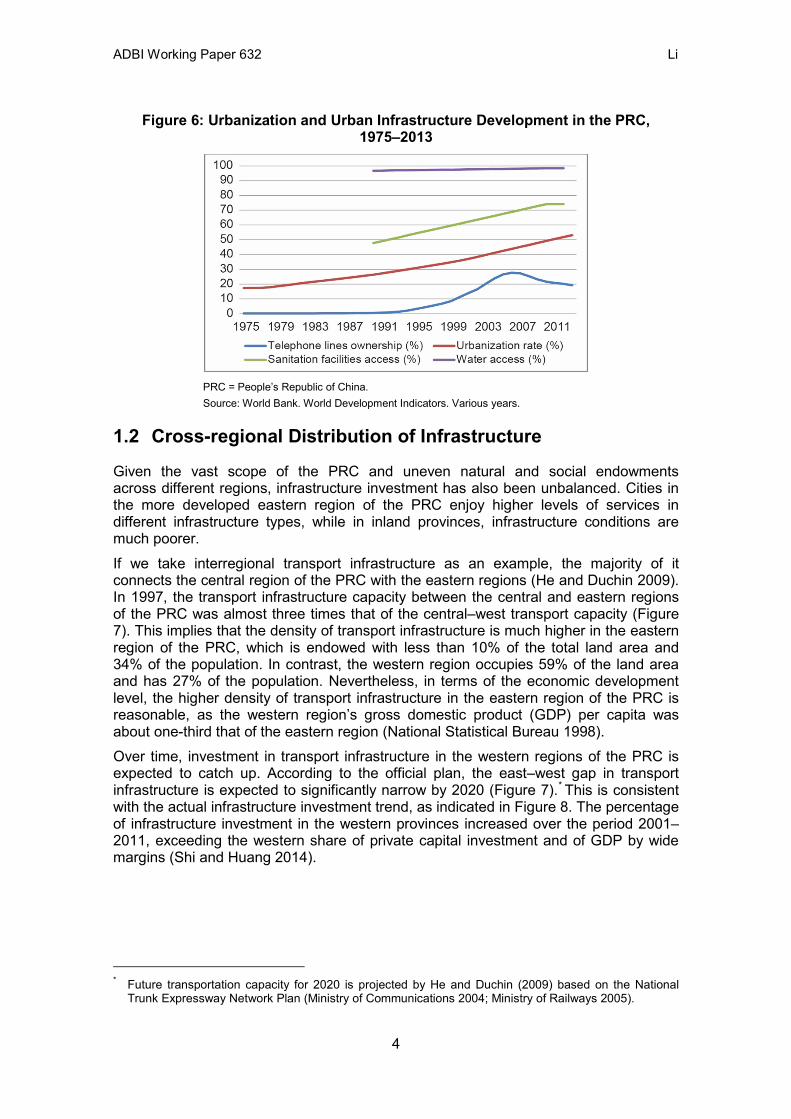
To provide an overview of the relation between urbanization and urban infrastructure development in the PRC, in Figure 6, we compare the urbanization process with telephone ownership, access to water facilities, and access to sanitation facilities. In general, we find that urban infrastructure in the PRC has improved with more urbanization. The improvement in urban infrastructure has been evident in telecommunication and sanitation, while water facilities of PRC cities have improved after 1990. Note that the telephone ownership rate started to decline in the mid-2000s, which should reflect the impact of the adoption of mobile telecommunication technologies.
3
ADBI Working Paper 632 Li
Figure 6: Urbanization and Urban Infrastructure Development in the PRC, 1975–2013
PRC = People’s Republic of China. Source: World Bank. World Development Indicators. Various years.
1.2 Cross-regional Distribution of Infrastructure
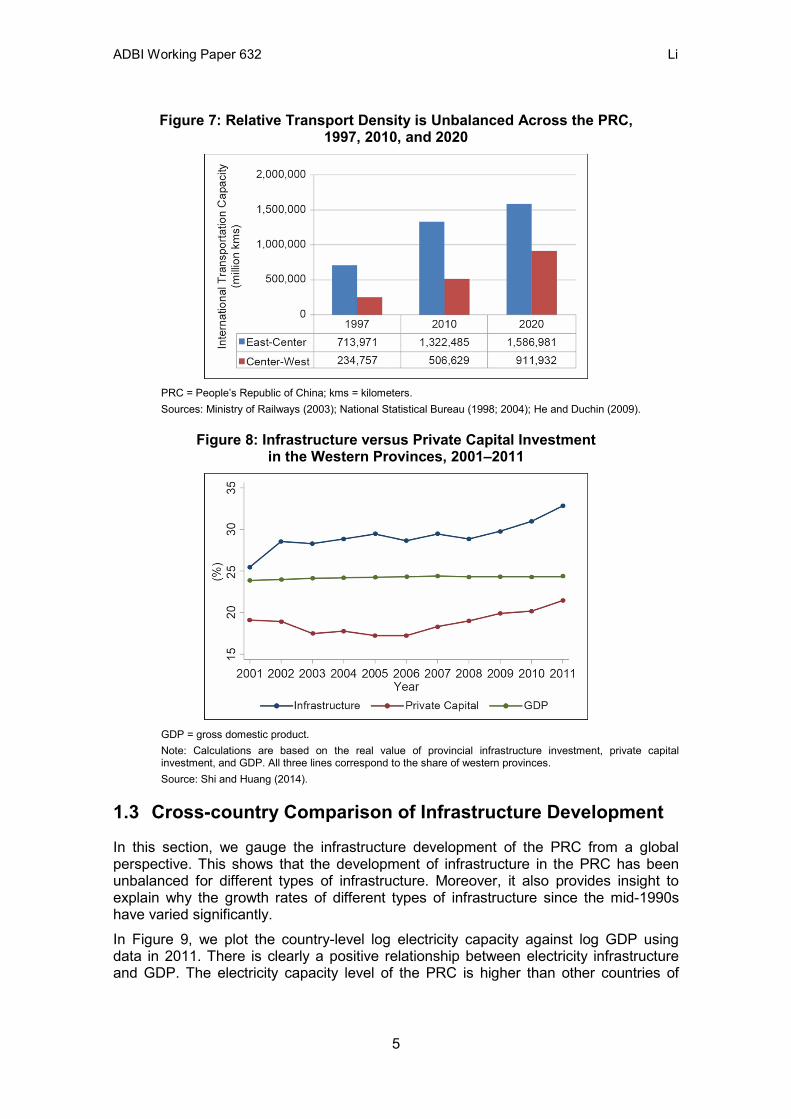
Given the vast scope of the PRC and uneven natural and social endowments across different regions, infrastructure investment has also been unbalanced. Cities in the more developed eastern region of the PRC enjoy higher levels of services in different infrastructure types, while in inland provinces, infrastructure conditions are much poorer. If we take interregional transport infrastructure as an example, the majority of it connects the central region of the PRC with the eastern regions (He and Duchin 2009). In 1997, the transport infrastructure capacity between the central and eastern regions of the PRC was almost three times that of the central–west transport capacity (Figure 7). This implies that the density of transport infrastructure is much higher in the eastern region of the PRC, which is endowed with less than 10% of the total land area and 34% of the population. In contrast, the western region occupies 59% of the land area and has 27% of the population. Nevertheless, in terms of the economic development level, the higher density of transport infrastructure in the eastern region of the PRC is reasonable, as the western region’s gross domestic product (GDP) per capita was about one-third that of the eastern region (National Statistical Bureau 1998). Over time, investment in transport infrastructure in the western regions of the PRC is expected to catch up. According to the official plan, the east–west gap in transport infrastructure is expected to significantly narrow by 2020 (Figure 7).* This is consistent with the actual infrastructure investment trend, as indicated in Figure 8. The percentage of infrastructure investment in the western provinces increased over the period 2001–2011, exceeding the western share of private capital investment and of GDP by wide margins (Shi and Huang 2014).
* Future transportation capacity for 2020 is projected by He and Duchin (2009) based on the National Trunk Expressway Network Plan (Ministry of Communications 2004; Ministry of Railways 2005).
4
ADBI Working Paper 632 Li
Figure 7: Relative Transport Density is Unbalanced Across the PRC, 1997, 2010, and 2020
PRC = People’s Republic of China; kms = kilometers. Sources: Ministry of Railways (2003); National Statistical Bureau (1998; 2004); He and Duchin (2009).
Figure 8: Infrastructure versus Private Capital Investment in the Western Provinces, 2001–2011
GDP = gross domestic product. Note: Calculations are based on the real value of provincial infrastructure investment, private capital investment, and GDP. All three lines correspond to the share of western provinces. Source: Shi and Huang (2014).
1.3 Cross-country Comparison of Infrastructure Development
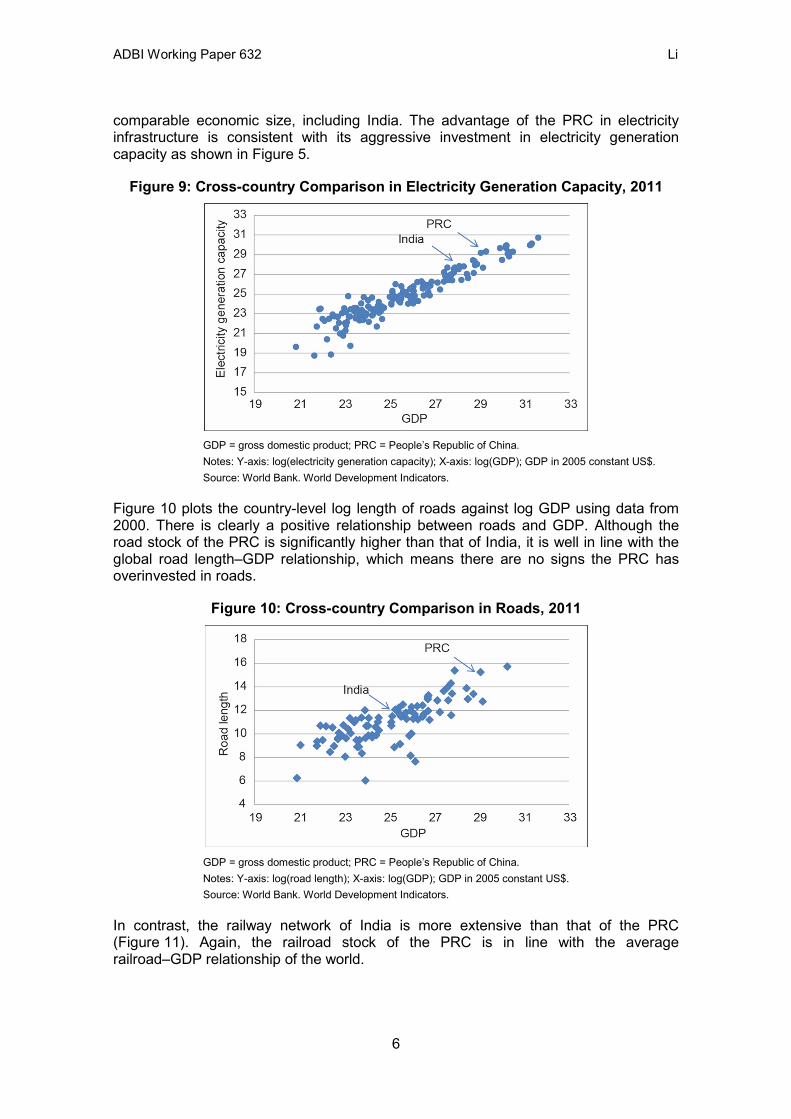
In this section, we gauge the infrastructure development of the PRC from a global perspective. This shows that the development of infrastructure in the PRC has been unbalanced for different types of infrastructure. Moreover, it also provides insight to explain why the growth rates of different types of infrastructure since the mid-1990s have varied significantly. In Figure 9, we plot the country-level log electricity capacity against log GDP using data in 2011. There is clearly a positive relationship between electricity infrastructure and GDP. The electricity capacity level of the PRC is higher than other countries of
5
ADBI Working Paper 632 Li
comparable economic size, including India. The advantage of the PRC in electricity infrastructure is consistent with its aggressive investment in electricity generation capacity as shown in Figure 5.
Figure 9: Cross-country Comparison in Electricity Generation Capacity, 2011
GDP = gross domestic product; PRC = People’s Republic of China. Notes: Y-axis: log(electricity generation capacity); X-axis: log(GDP); GDP in 2005 constant US$. Source: World Bank. World Development Indicators.
Figure 10 plots the country-level log length of roads against log GDP using data from 2000. There is clearly a positive relationship between roads and GDP. Although the road stock of the PRC is significantly higher than that of India, it is well in line with the global road length–GDP relationship, which means there are no signs the PRC has overinvested in roads.
Figure 10: Cross-country Comparison in Roads, 2011
GDP = gross domestic product; PRC = People’s Republic of China. Notes: Y-axis: log(road length); X-axis: log(GDP); GDP in 2005 constant US$. Source: World Bank. World Development Indicators.
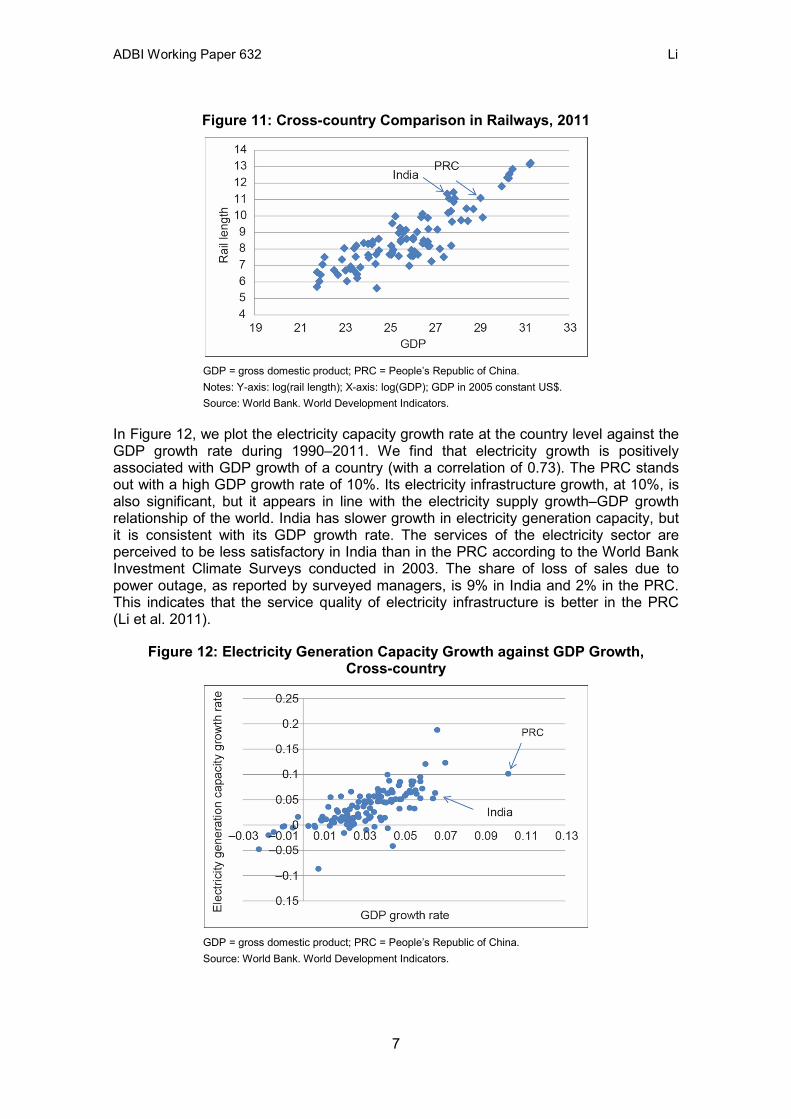
In contrast, the railway network of India is more extensive than that of the PRC (Figure 11). Again, the railroad stock of the PRC is in line with the average railroad–GDP relationship of the world.
6
ADBI Working Paper 632 Li
Figure 11: Cross-country Comparison in Railways, 2011
GDP = gross domestic product; PRC = People’s Republic of China. Notes: Y-axis: log(rail length); X-axis: log(GDP); GDP in 2005 constant US$. Source: World Bank. World Development Indicators.
In Figure 12, we plot the electricity capacity growth rate at the country level against the GDP growth rate during 1990–2011. We find that electricity growth is positively associated with GDP growth of a country (with a correlation of 0.73). The PRC stands out with a high GDP growth rate of 10%. Its electricity infrastructure growth, at 10%, is also significant, but it appears in line with the electricity supply growth–GDP growth relationship of the world. India has slower growth in electricity generation capacity, but it is consistent with its GDP growth rate. The services of the electricity sector are perceived to be less satisfactory in India than in the PRC according to the World Bank Investment Climate Surveys conducted in 2003. The share of loss of sales due to power outage, as reported by surveyed managers, is 9% in India and 2% in the PRC. This indicates that the service quality of electricity infrastructure is better in the PRC (Li et al. 2011).
Figure 12: Electricity Generation Capacity Growth against GDP Growth, Cross-country
GDP = gross domestic product; PRC = People’s Republic of China. Source: World Bank. World Development Indicators.
7
ADBI Working Paper 632 Li
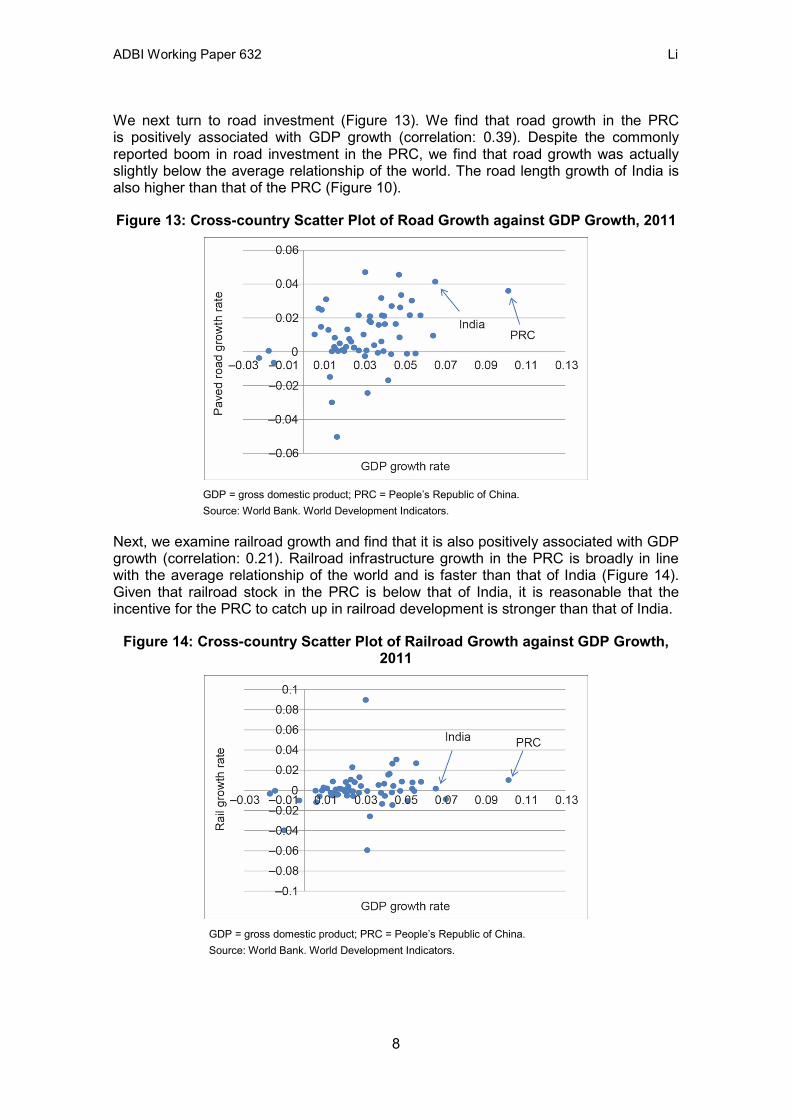
We next turn to road investment (Figure 13). We find that road growth in the PRC is positively associated with GDP growth (correlation: 0.39). Despite the commonly reported boom in road investment in the PRC, we find that road growth was actually slightly below the average relationship of the world. The road length growth of India is also higher than that of the PRC (Figure 10).
Figure 13: Cross-country Scatter Plot of Road Growth against GDP Growth, 2011
GDP = gross domestic product; PRC = People’s Republic of China. Source: World Bank. World Development Indicators.
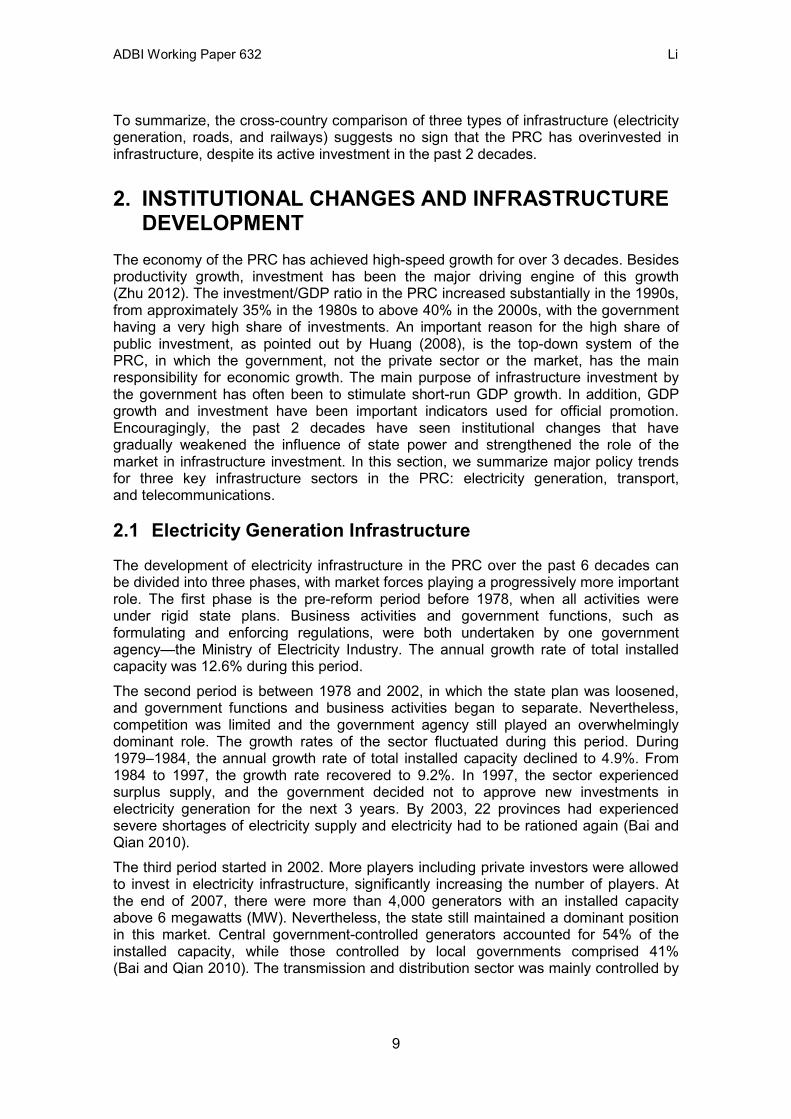
Next, we examine railroad growth and find that it is also positively associated with GDP growth (correlation: 0.21). Railroad infrastructure growth in the PRC is broadly in line with the average relationship of the world and is faster than that of India (Figure 14). Given that railroad stock in the PRC is below that of India, it is reasonable that the incentive for the PRC to catch up in railroad development is stronger than that of India.
Figure 14: Cross-country Scatter Plot of Railroad Growth against GDP Growth, 2011
GDP = gross domestic product; PRC = People’s Republic of China. Source: World Bank. World Development Indicators.
8
ADBI Working Paper 632 Li
To summarize, the cross-country comparison of three types of infrastructure (electricity generation, roads, and railways) suggests no sign that the PRC has overinvested in infrastructure, despite its active investment in the past 2 decades.
2. INSTITUTIONAL CHANGES AND INFRASTRUCTURE DEVELOPMENT
The economy of the PRC has achieved high-speed growth for over 3 decades. Besides productivity growth, investment has been the major driving engine of this growth (Zhu 2012). The investment/GDP ratio in the PRC increased substantially in the 1990s, from approximately 35% in the 1980s to above 40% in the 2000s, with the government having a very high share of investments. An important reason for the high share of public investment, as pointed out by Huang (2008), is the top-down system of the PRC, in which the government, not the private sector or the market, has the main responsibility for economic growth. The main purpose of infrastructure investment by the government has often been to stimulate short-run GDP growth. In addition, GDP growth and investment have been important indicators used for official promotion. Encouragingly, the past 2 decades have seen institutional changes that have gradually weakened the influence of state power and strengthened the role of the market in infrastructure investment. In this section, we summarize major policy trends for three key infrastructure sectors in the PRC: electricity generation, transport, and telecommunications.
2.1 Electricity Generation Infrastructure
The development of electricity infrastructure in the PRC over the past 6 decades can be divided into three phases, with market forces playing a progressively more important role. The first phase is the pre-reform period before 1978, when all activities were under rigid state plans. Business activities and government functions, such as formulating and enforcing regulations, were both undertaken by one government agency—the Ministry of Electricity Industry. The annual growth rate of total installed capacity was 12.6% during this period. The second period is between 1978 and 2002, in which the state plan was loosened, and government functions and business activities began to separate. Nevertheless, competition was limited and the government agency still played an overwhelmingly dominant role. The growth rates of the sector fluctuated during this period. During 1979–1984, the annual growth rate of total installed capacity declined to 4.9%. From 1984 to 1997, the growth rate recovered to 9.2%. In 1997, the sector experienced surplus supply, and the government decided not to approve new investments in electricity generation for the next 3 years. By 2003, 22 provinces had experienced severe shortages of electricity supply and electricity had to be rationed again (Bai and Qian 2010). The third period started in 2002. More players including private investors were allowed to invest in electricity infrastructure, significantly increasing the number of players. At the end of 2007, there were more than 4,000 generators with an installed capacity above 6 megawatts (MW). Nevertheless, the state still maintained a dominant position in this market. Central government-controlled generators accounted for 54% of the installed capacity, while those controlled by local governments comprised 41% (Bai and Qian 2010). The transmission and distribution sector was mainly controlled by
9
ADBI Working Paper 632 Li
two state grid corporations. Each of them is a monopoly transmitter, distributor, and retailer of electricity in its region. Generators sell power to the power grid companies.
2.2 Highways and Railroads
The dominant role of the state has also been the key feature of highway and railroad investment in the PRC. While investments in railways are mainly supported by the central government, most highways in the PRC are supported by local governments, while the central government targets strategically important national highways. Since the economic reforms started in 1978, the railways sector has been gradually undergoing marketization, but progress has been slow relative to other infrastructure regulation reforms. From 1949 to 1982, the railways sector featured rigid planning and unprofitably low prices, which were uniformly set by the central authority. From 1982 to 1985, some autonomy on planning, finance, employment, and personnel decisions was given to the local railway bureaus. At the same time, the railways system could retain some profit according to an after tax payment formula. Railway service prices were raised, but still lagged behind the general price level. Compared with 1955, the 1986 freight price dropped by 20.8% relative to the consumer price index and passenger price by 15.7% (Bai and Qian 2010). In 1993, the railways system started experimenting with corporatization. The Guangdong railway bureau was restructured into a corporate group in February 1993. Then the Dalian railway bureau became Dalian Railway Limited in 1995. The Guangzhou–Shenzhou railway was publicly listed in Hong Kong, China and in New York in 1996. The whole system went through corporatization in 1999 with the objective of separating government functions from business activities in the system. In the same period, the price policy became more flexible. Prices were allowed to depend on the quality, route, and season of the services. The marketization trend also occurred in road investment. Before 1980, road investment funds came from the state budget in the form of a grant that did not carry any financial cost. Users did not pay tolls, but they paid a monthly highway maintenance fee based on their vehicle tonnage. In the next stage, state investment funds in local projects were changed from grants to loans in 1980, and the cost of investment was shifted to the local governments. New fees were introduced in the following years to increase the amount of funds available to local governments for constructing highways. Among the newly introduced fees was a vehicle purchase surcharge, which began in 1985. The surcharge was 10% of the price for domestically produced vehicles and 15% for imported vehicles. This surcharge goes into the State Highway Construction Fund. Highway tolls were first tried out in Guangdong province in 1981. Gradually, toll collection became a widespread practice in the whole country. Currently, highway tolls are regulated by the Highway Law, which was promulgated in 1997 and revised in 1999 and 2004. Among other aspects, the law regulates the types of highway that are eligible for tolls, the number of years in which tolls can be collected on a highway, the toll rates, the transfer of the rights for toll collection, the setting up of toll gates, and the coordination between provinces when the highway crosses provincial borders (see Bai and Qian 2010 for more details on the toll regulation policy).
10
ADBI Working Paper 632 Li
2.3 Telecommunications Infrastructure
For a long time, the PRC’s telecommunications sector was viewed as an instrument of government control and national defense. The sector remained under tight control and was not opened to foreign investors until the 1990s, when the reform process started. The State Council started a round of reforms in 1998 involving the separation of government and enterprise functions, the improvement of market competition, and the removal of monopoly power. The country’s entry into the World Trade Organization in 2001 has hastened the reform process and stimulated the development and growth of the telecommunications sector. Since 2001, the PRC’s telecommunications system has expanded significantly and the number of subscribers has increased rapidly. In 2003, the number of mobile phone services subscribers surpassed that of fixed-line services subscribers (Shiu and Lam 2008).
3. INFRASTRUCTURE FINANCING The rapid growth in infrastructure investment in the PRC has been supported by a unique financing system, which is not limited to standard fiscal resources, but utilizes a number of non-budgetary sources of revenue. In this section, we summarize the structure and major features of this system.
3.1 Development of Infrastructure Financing System in the PRC
The urban infrastructure finance system of the PRC has undergone a series of major changes. Between 1949 and 1978, municipality authorities collected fiscal revenue and remitted it to the central government for reallocation; infrastructure investment funds were then allocated to local governments in the form of grants based on the expenditure needs of local jurisdictions (Wu 1999). This period was characterized by a lack of both political and financial support of urban infrastructure development. From the 1950s to the 1970s, investment in urban infrastructure was CNY12 billion in total, which was 1.43% of total fixed investment and 0.23% of GDP at the national level. These proportions are much lower than those in other countries (Chan 1998; Hua 1993). Between 1978 and 1994, the central government intensified its efforts to promote urban infrastructure development through laws and regulations. The central–local government relationship began to change when fiscal decentralization was introduced and local governments began to retain a higher rate of revenue and enjoy more freedom in discretionary spending. State investment funds in local projects were changed from grants to loans in 1980 and the cost of investment was shifted to the local governments. The Urban Maintenance and Construction Tax was imposed in 1985 after approximately 5 years of trial (Chan 1998). The tax was the only earmarked tax in the fiscal system and became an important tool for infrastructure funding. Land transfer fees are also a major source of funds for infrastructure investment in the PRC. They were introduced in 1981 in Shenzhen foreign enterprise-funded projects and then expanded to other cities (Chan 1998). Two laws were enforced in 1988 and 1990 that provided the legal foundation for land leasing as an infrastructure-funding tool by the PRC municipalities (China State Council 1988; 1990). In addition, the central government set its share of land leasing revenue at 60% at the beginning and
11
ADBI Working Paper 632 Li
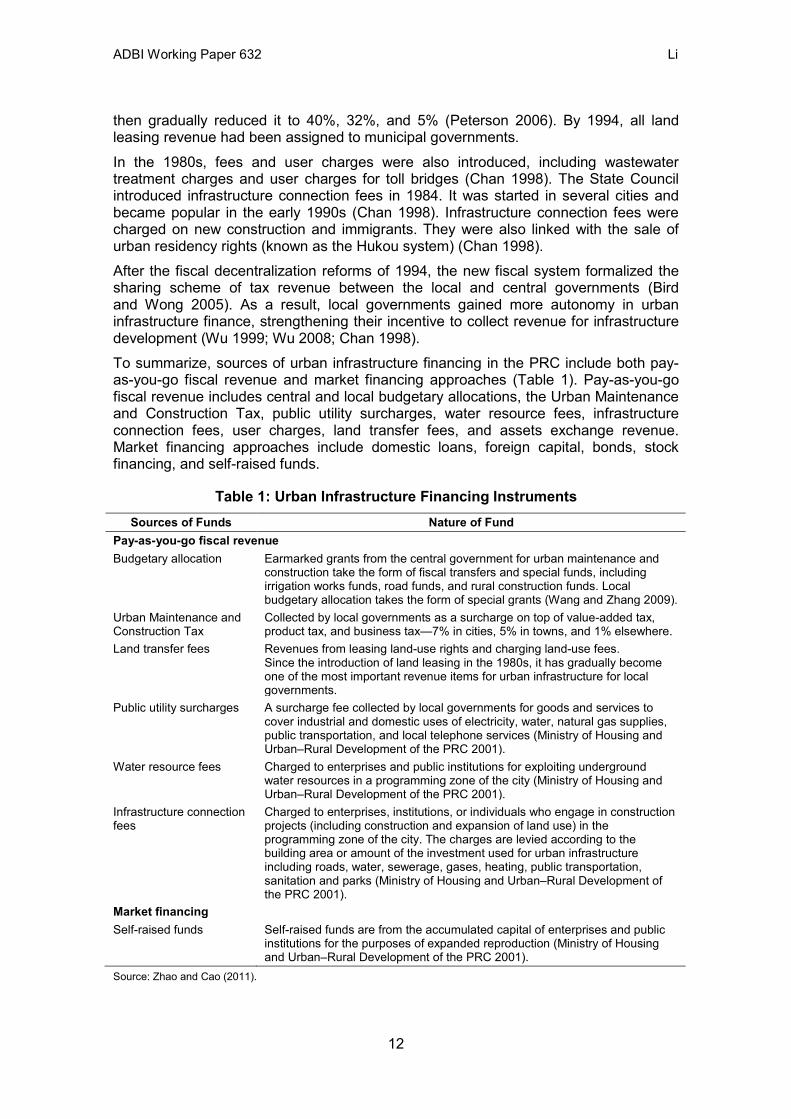
then gradually reduced it to 40%, 32%, and 5% (Peterson 2006). By 1994, all land leasing revenue had been assigned to municipal governments. In the 1980s, fees and user charges were also introduced, including wastewater treatment charges and user charges for toll bridges (Chan 1998). The State Council introduced infrastructure connection fees in 1984. It was started in several cities and became popular in the early 1990s (Chan 1998). Infrastructure connection fees were charged on new construction and immigrants. They were also linked with the sale of urban residency rights (known as the Hukou system) (Chan 1998). After the fiscal decentralization reforms of 1994, the new fiscal system formalized the sharing scheme of tax revenue between the local and central governments (Bird and Wong 2005). As a result, local governments gained more autonomy in urban infrastructure finance, strengthening their incentive to collect revenue for infrastructure development (Wu 1999; Wu 2008; Chan 1998). To summarize, sources of urban infrastructure financing in the PRC include both pay-as-you-go fiscal revenue and market financing approaches (Table 1). Pay-as-you-go fiscal revenue includes central and local budgetary allocations, the Urban Maintenance and Construction Tax, public utility surcharges, water resource fees, infrastructure connection fees, user charges, land transfer fees, and assets exchange revenue. Market financing approaches include domestic loans, foreign capital, bonds, stock financing, and self-raised funds.
Table 1: Urban Infrastructure Financing Instruments Sources of Funds Nature of Fund
Pay-as-you-go fiscal revenue Budgetary allocation Earmarked grants from the central government for urban maintenance and
construction take the form of fiscal transfers and special funds, including irrigation works funds, road funds, and rural construction funds. Local budgetary allocation takes the form of special grants (Wang and Zhang 2009).
Urban Maintenance and Construction Tax
Collected by local governments as a surcharge on top of value-added tax, product tax, and business tax—7% in cities, 5% in towns, and 1% elsewhere.
Land transfer fees Revenues from leasing land-use rights and charging land-use fees. Since the introduction of land leasing in the 1980s, it has gradually become one of the most important revenue items for urban infrastructure for local governments.
Public utility surcharges A surcharge fee collected by local governments for goods and services to cover industrial and domestic uses of electricity, water, natural gas supplies, public transportation, and local telephone services (Ministry of Housing and Urban–Rural Development of the PRC 2001).
Water resource fees Charged to enterprises and public institutions for exploiting underground water resources in a programming zone of the city (Ministry of Housing and Urban–Rural Development of the PRC 2001).
Infrastructure connection fees
Charged to enterprises, institutions, or individuals who engage in construction projects (including construction and expansion of land use) in the programming zone of the city. The charges are levied according to the building area or amount of the investment used for urban infrastructure including roads, water, sewerage, gases, heating, public transportation, sanitation and parks (Ministry of Housing and Urban–Rural Development of the PRC 2001).
Market financing Self-raised funds Self-raised funds are from the accumulated capital of enterprises and public
institutions for the purposes of expanded reproduction (Ministry of Housing and Urban–Rural Development of the PRC 2001).
Source: Zhao and Cao (2011).
12
ADBI Working Paper 632 Li
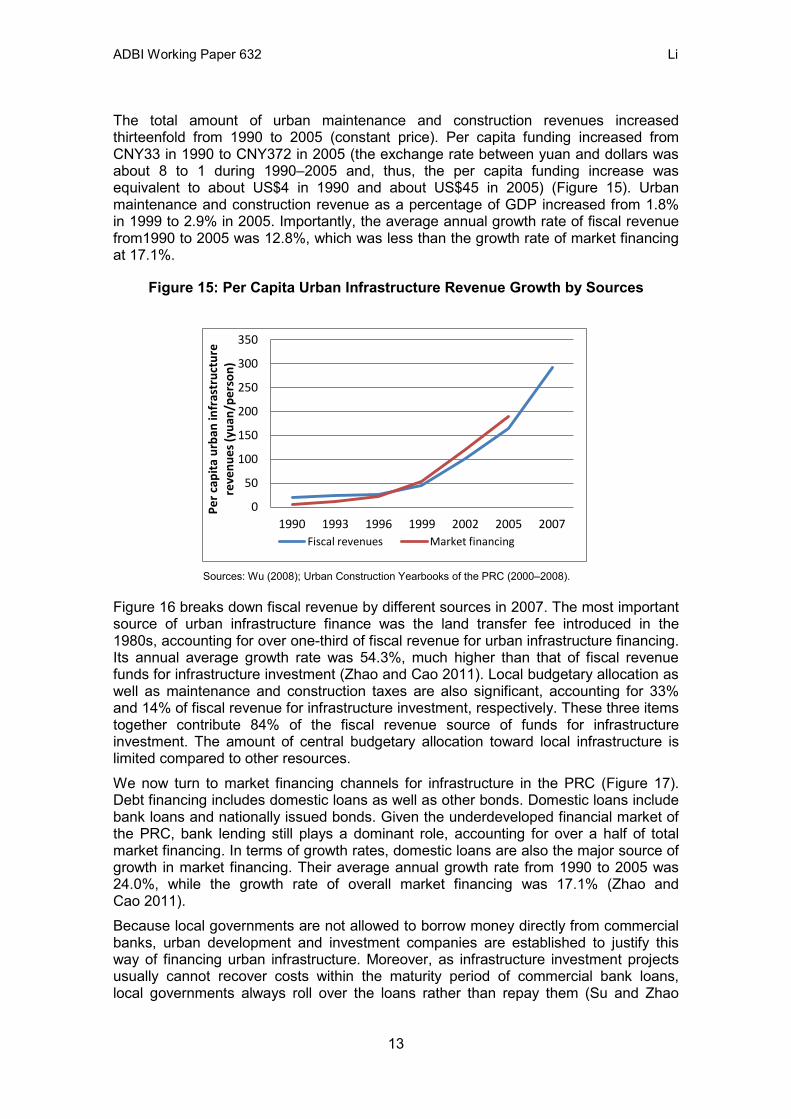
The total amount of urban maintenance and construction revenues increased thirteenfold from 1990 to 2005 (constant price). Per capita funding increased from CNY33 in 1990 to CNY372 in 2005 (the exchange rate between yuan and dollars was about 8 to 1 during 1990–2005 and, thus, the per capita funding increase was equivalent to about US$4 in 1990 and about US$45 in 2005) (Figure 15). Urban maintenance and construction revenue as a percentage of GDP increased from 1.8% in 1999 to 2.9% in 2005. Importantly, the average annual growth rate of fiscal revenue from1990 to 2005 was 12.8%, which was less than the growth rate of market financing at 17.1%.
Figure 15: Per Capita Urban Infrastructure Revenue Growth by Sources
Sources: Wu (2008); Urban Construction Yearbooks of the PRC (2000–2008).
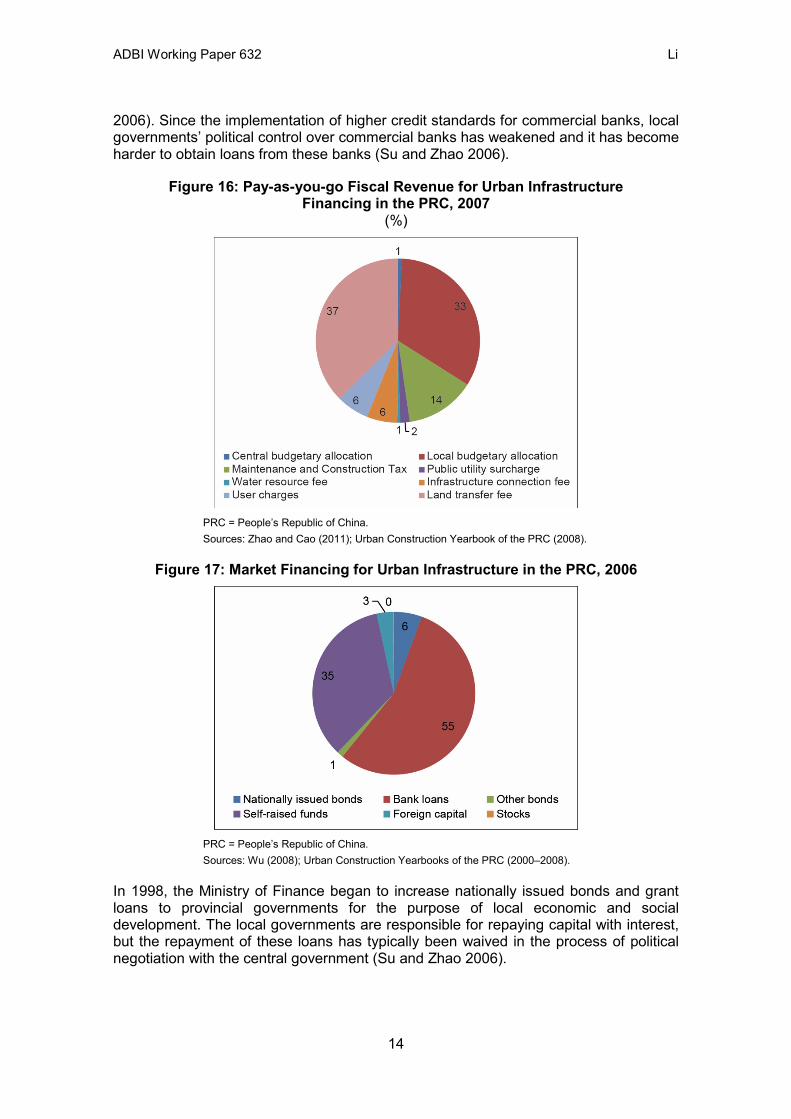
Figure 16 breaks down fiscal revenue by different sources in 2007. The most important source of urban infrastructure finance was the land transfer fee introduced in the 1980s, accounting for over one-third of fiscal revenue for urban infrastructure financing. Its annual average growth rate was 54.3%, much higher than that of fiscal revenue funds for infrastructure investment (Zhao and Cao 2011). Local budgetary allocation as well as maintenance and construction taxes are also significant, accounting for 33% and 14% of fiscal revenue for infrastructure investment, respectively. These three items together contribute 84% of the fiscal revenue source of funds for infrastructure investment. The amount of central budgetary allocation toward local infrastructure is limited compared to other resources. We now turn to market financing channels for infrastructure in the PRC (Figure 17). Debt financing includes domestic loans as well as other bonds. Domestic loans include bank loans and nationally issued bonds. Given the underdeveloped financial market of the PRC, bank lending still plays a dominant role, accounting for over a half of total market financing. In terms of growth rates, domestic loans are also the major source of growth in market financing. Their average annual growth rate from 1990 to 2005 was 24.0%, while the growth rate of overall market financing was 17.1% (Zhao and Cao 2011). Because local governments are not allowed to borrow money directly from commercial banks, urban development and investment companies are established to justify this way of financing urban infrastructure. Moreover, as infrastructure investment projects usually cannot recover costs within the maturity period of commercial bank loans, local governments always roll over the loans rather than repay them (Su and Zhao
0
50
100
150
200
250
300
350
1990 1993 1996 1999 2002 2005 2007
Per c
apita
urb
an in
fras
truc
ture
re
venu
es (y
uan/
pers
on)
Fiscal revenues Market financing
13
ADBI Working Paper 632 Li
2006). Since the implementation of higher credit standards for commercial banks, local governments’ political control over commercial banks has weakened and it has become harder to obtain loans from these banks (Su and Zhao 2006).
Figure 16: Pay-as-you-go Fiscal Revenue for Urban Infrastructure Financing in the PRC, 2007
(%)
PRC = People’s Republic of China. Sources: Zhao and Cao (2011); Urban Construction Yearbook of the PRC (2008).
Figure 17: Market Financing for Urban Infrastructure in the PRC, 2006
PRC = People’s Republic of China. Sources: Wu (2008); Urban Construction Yearbooks of the PRC (2000–2008).
In 1998, the Ministry of Finance began to increase nationally issued bonds and grant loans to provincial governments for the purpose of local economic and social development. The local governments are responsible for repaying capital with interest, but the repayment of these loans has typically been waived in the process of political negotiation with the central government (Su and Zhao 2006).
14
ADBI Working Paper 632 Li
Equity financing includes self-raised funds, foreign capital, and stock financing. Self-raised funds refer to those from the accumulated capital of enterprises and public institutions for the purpose of expanded reproduction (Ministry of Housing and Urban–Rural Development of the PRC 2001). The average annual growth rate of self-raised funds is 14.3%, which is lower than the 17.1% of market financing. According to Wang and Zhang (2009), about two-thirds of self-raised funds come from the direct investment of private enterprises. Foreign investment usually takes the form of public–private partnerships, in which the PRC government provides the land and foreign companies provide the funds needed (Bird and Wong 2005; Bellier and Zhou 2003). Foreign capital has a relatively low proportion in total infrastructure funding at about 1%–2%. Compared to other market financing approaches, the use of stock financing is minimal. In most years, it accounted for less than 5% of the overall urban maintenance and construction revenue.
3.2 Decentralized Infrastructure Financing in the PRC
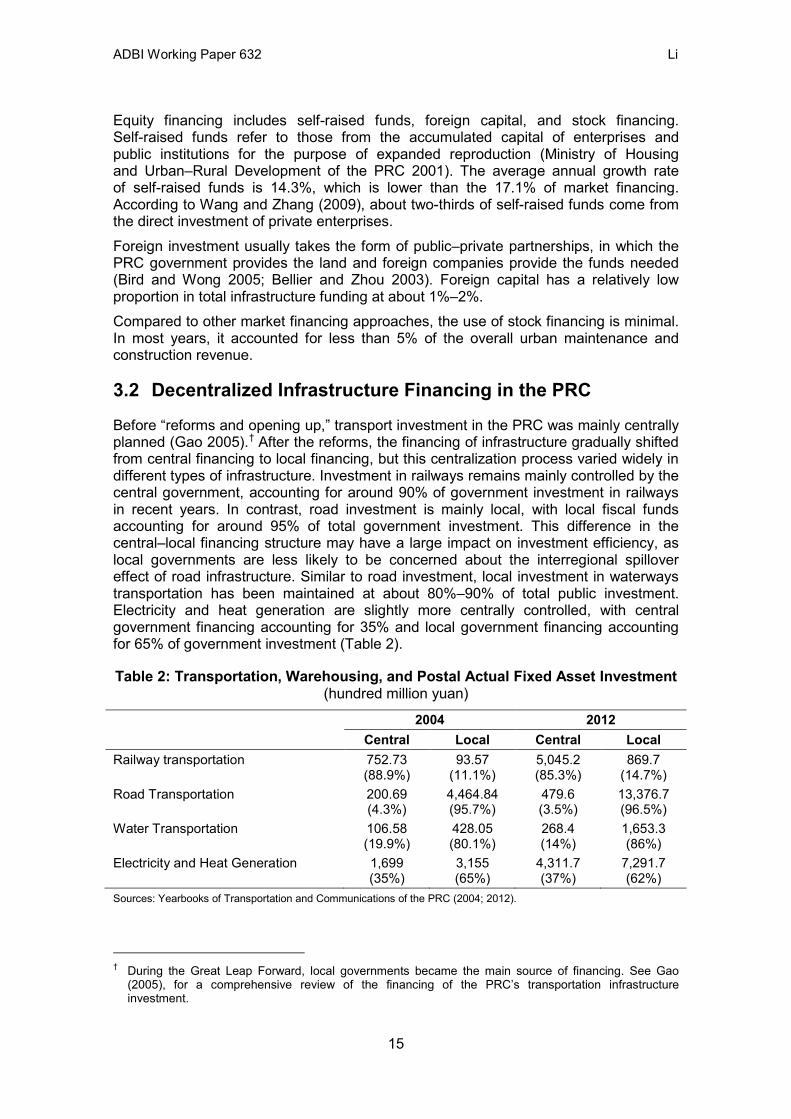
Before “reforms and opening up,” transport investment in the PRC was mainly centrally planned (Gao 2005).† After the reforms, the financing of infrastructure gradually shifted from central financing to local financing, but this centralization process varied widely in different types of infrastructure. Investment in railways remains mainly controlled by the central government, accounting for around 90% of government investment in railways in recent years. In contrast, road investment is mainly local, with local fiscal funds accounting for around 95% of total government investment. This difference in the central–local financing structure may have a large impact on investment efficiency, as local governments are less likely to be concerned about the interregional spillover effect of road infrastructure. Similar to road investment, local investment in waterways transportation has been maintained at about 80%–90% of total public investment. Electricity and heat generation are slightly more centrally controlled, with central government financing accounting for 35% and local government financing accounting for 65% of government investment (Table 2).
Table 2: Transportation, Warehousing, and Postal Actual Fixed Asset Investment (hundred million yuan)
2004 2012 Central Local Central Local
Railway transportation 752.73 (88.9%)
93.57 (11.1%)
5,045.2 (85.3%)
869.7 (14.7%)
Road Transportation 200.69 (4.3%)
4,464.84 (95.7%)
479.6 (3.5%)
13,376.7 (96.5%)
Water Transportation 106.58 (19.9%)
428.05 (80.1%)
268.4 (14%)
1,653.3 (86%)
Electricity and Heat Generation 1,699 (35%)
3,155 (65%)
4,311.7 (37%)
7,291.7 (62%)
Sources: Yearbooks of Transportation and Communications of the PRC (2004; 2012).
† During the Great Leap Forward, local governments became the main source of financing. See Gao (2005), for a comprehensive review of the financing of the PRC’s transportation infrastructure investment.
15
ADBI Working Paper 632 Li
In the latest reforms of the PRC since 2013, the government proposed to encourage private investment in the infrastructure sector. The State Council published 80 projects in 2014 to invite private investment. On 12 June 2014, the investment director of the National Development and Reform Commission confirmed that in the long run the government would continue to encourage private investment.‡ In sum, the infrastructure financing system of the PRC has made progress in allowing the participation of private funds, but local governments still play the most important role in allocating infrastructure capital. This is helpful for rapid urbanization as local governments have a strong incentive to build transport infrastructure to facilitate urbanization so as to increase fiscal revenue from land sales. However, due to the lack of a responsibility system to assess the effectiveness of local governments’ investment, overinvestment is likely, resulting in overexpansion of urban areas.
4. INFRASTRUCTURE–GROWTH–URBANIZATION RELATIONSHIP
The rapid infrastructure investment in the PRC is closely tied to two other important trends—economic growth and urbanization. It is crucial to understand their interrelation in order for policy makers, not only in the PRC but also other developing economies, to make efficient infrastructure investment policies. Although empirical evidence available is still limited due to a lack of data and empirical research, a number of recent studies have advanced understanding of this field. Below we summarize them and discuss their policy implications.
4.1 Infrastructure Investment and Growth in the PRC
Inspired by the unprecedented scale of infrastructure investment in the PRC, a rising number of econometric studies have been conducted on the effect of infrastructure investment on the growth of the PRC. In this section, we summarize the major findings of this small but rapidly growing body of research. An important question in this context is whether infrastructure investment in the PRC has helped to promote growth. This appears to be the case according to the studies available. Démurger (2001) showed that transport infrastructure and telecommunications facilities are important factors in relation to the growth performance of provinces in the PRC (transport infrastructure is particularly important). More recently, Shi and Huang (2014) improved the estimates to determine the causal effect of infrastructure on economic growth, and their results suggest that when the general infrastructure level increases by 1%, the GDP of a province in the PRC can increase by around 0.25%. In contrast, Banerjee, Duflo, and Qian (2012), who examined the effect of rail transport connections in the PRC after the mid-19th century advent of treaty ports, did not find any significant effect on counties with rail as compared with those farther off the grid. These findings lead to a question: How has infrastructure investment in the PRC affected economic growth? A number of recent studies have shed light on this question by econometrically examining the mechanisms through which infrastructure affects growth. Below we summarize the major findings.
‡ http://www.chinairn.com/news/20140612/113418879.shtml (in Chinese).
16
ADBI Working Paper 632 Li
Mechanism 1: Transaction Cost Reduction For infrastructure investment to affect the economy, a direct channel is to reduce transaction costs. According to Li et al. (2012), who used survey data on agricultural traders in the PRC in 2004, transport costs in the PRC are nontrivial, accounting for around 8% of agricultural goods’ trade value. In theory, transportation investment can improve the productivity of the economy by promoting trade patterns and reducing the prices of traded goods (Limao and Venables 2001). Evidence from the PRC indeed supports this cost-reduction effect. In terms of road infrastructure, Li et al. (2012) showed that road quality has been crucial for reducing transport costs within the PRC: by increasing transport speed by 1 km per hour, the total transport costs for agricultural traders would decrease by 0.6%, mainly due to improved fuel-burning efficiency and reduced labor requirements. Some evidence is also available for cost saving via railroad investment. Li and Chen (2013) examined the cost saving due to reduced congestion by expanding the transport capacity of a thousand-mile-long railroad that connects Xinjiang and Gansu provinces, both in the northwestern region of the PRC. They find that, after this investment in 1994, shipping volume increased by around 40% and the between-destination price differences of goods dropped by about 30%. This implies a sizable social return of approximately 30% per year for this particular investment. Besides saving transport costs for tradable goods, transport infrastructure can also save costs through facilitating the specialization of production to regions with comparative advantages. He and Duchin (2009) found that each dollar of investment in the interregional transport infrastructure of the PRC can generate as much as US$3.90 of total benefits through the cost saving of the specialization effect. Note that, unlike previous studies, the findings of He and Duchin (2009) are derived from the optimization of a multi-region trade model based on linear programming for 1997–2020 and not econometric analysis of the actual impact of transport infrastructure. Transport infrastructure can also reduce the commuting costs of passengers, thus improving the efficiency of spatial distribution in economic activities. Zheng and Kahn (2013) showed that the high-speed rail infrastructure has integrated housing markets between the city core and the surrounding second- and third-tier cities by reducing time costs for passengers. A key consequence and evidence of this cost saving is the rise of housing prices in the peripheral areas. Hence, investment in high-speed trains has played an important role in integrating the PRC’s cities into a system of open cities. In sum, econometric evidence available suggests that transport infrastructure investment in the PRC has contributed to the productivity of the economy by reducing transport costs for goods and passengers, as well as further spatial specialization of industries. The evidence available is far from comprehensive and representative as it largely focuses on transport infrastructure. Further research is needed to assess the total costs saved for the PRC by different types of infrastructure, as well as its economic impact.
Mechanism 2: Spatial Redistribution of Economic Activities Given the trade costs reduction, as suggested by the studies reviewed above, there should be a redistribution effect according to the theory of Krugman (1980). Existing evidence suggests that urban agglomeration of the PRC is insufficient due to institutional constraints, such as local protectionism.
17
ADBI Working Paper 632 Li
Although the available evidence is limited, it is generally in favor of the hypothesis that market integration can reinforce the concentration of economic activity, thus increasing the productivity of the economy. Specifically, the National Trunk Highway System of the PRC has driven industrial production activities to move from peripheral counties to metropolitan areas. As a result, the industrial output of metropolitan areas connected by the system has increased by around 30% (Faber 2009). The reduction of transport costs, as well as the agglomeration effect, has helped to lower product prices by around 1% nationwide, thus increasing aggregate welfare. This price effect is more significant in peripheral areas. What if the road does not directly pass by a jurisdiction? The empirical evidence available does not provide a clear answer. Banerjee, Duflo, and Qian (2012) estimated that the effect of distance to transportation networks on local economic outcomes in the PRC has been positive, but the magnitude of the effect has been modest. The elasticity of per capita GDP with respect to distance from historical transportation networks is approximately –0.07. Moreover, the authors find no effect of proximity to roads on per capita GDP growth. An important aspect of this spillover effect is that between countries, as shown by Conley and Ligon (2002). Within the context of the PRC, although Shi and Huang (2014) found little spillover effect of infrastructure investment, Li and Li (2013) showed a significant spillover effect of road investment on firms in neighboring provinces, which contributed to around two-thirds of the total inventory decline. These spillover benefits are likely to be even larger if the PRC can further remove its domestic trade barriers caused by local protectionism.
Mechanism 3: Productivity Growth The aforementioned evidence on the distributional effect of transport infrastructure investment implies productivity gain through the agglomeration effect. In addition to this redistribution effect, transport infrastructure improvement may also be able to raise the productivity of firms. Li and Li (2013) provide an example of this by examining the effect of road investment on the inventory holding of manufacturing firms. In particular, US$1 of road investment in the PRC was able to decrease input inventory by around 2 cents each year during 1998–2007. The implied inventory saving is around one-third of the estimate for the United States in the 1970s and is well below the capital costs. These estimates suggest that road investments in the PRC have improved the productivity of firms through inventory saving, although the investment efficiency was relatively low. The results also indicate that state-owned enterprises responded little to road improvement, while private entrepreneurs benefited much more. This implies that in order to improve benefits from road investments, the PRC government may want to further push the market reforms and allocate more resources to the private sector instead of building more roads. This would allow the thriving private enterprises to realize more benefits from infrastructure investments and contribute to economic growth. Li et al. (2014) provide a more comprehensive estimate of the effect of road investment on the productivity of firms in the PRC. They found that road investment in the PRC has significantly raised the productivity of firms. The elasticity of physical productivity with respect to road investment was around 0.1 in the PRC, and the implied aggregate rate of returns averaged 80%. Although these estimates suggest a significant productivity gain due to the road investment, they are both less than the estimates for the United States. This is consistent with the findings in Li and Li (2013), suggesting
18
ADBI Working Paper 632 Li
that road investment in the PRC may have been less efficient than that in the United States.§ By region, the productivity gain of road investment appears larger in the inland regions of the PRC than in coastal regions (Li et al. 2014), suggesting underinvestment in roads in the inland. This is contrary to the common criticism that roads have been oversupplied in the inland areas. In contrast, Shi and Huang (2014) found that most provinces in the PRC exhibited a shortage of infrastructure before 2008. After 2008, most of the western provinces already exhibited an oversupply of infrastructure relative to private capital, whereas some eastern and central provinces still showed a clear shortage of infrastructure. The seemingly contradicting findings of these two studies are due to the former study’s focus on roads, while the latter study examines general infrastructure. For some infrastructure, such as telecommunications, evidence suggests that it helps to improve GDP growth in the eastern PRC, but not in the inland region (Shiu and Lam 2008). Importantly, both Li et al. (2014) and Li and Li (2013) also found that the social returns to road infrastructure investment have been declining rapidly over time. Hence, future road investment in the PRC needs more scientific planning in order to achieve an optimal investment scale.
4.2 Infrastructure Investment and Urbanization
The evidence of transport infrastructure investment on the centralization of economic activities, as discussed above, suggests that transport infrastructure has facilitated urbanization in the PRC. In this section, we provide further evidence of the relationship between general infrastructure investment and urbanization. Evidence available on this topic is scarce. An exception is Démurger (2001) who showed that infrastructure investments that are urban-biased have led urbanized provinces to grow at a higher rate than rural provinces. A causal relationship, however, is unclear from this study. To shed further light on the inter-relationship between urbanization and infrastructure, we provide additional evidence by analyzing city-level data for the PRC. In theory, infrastructure investment can facilitate urbanization by increasing the attractiveness and capacity of urban areas. On the other hand, urbanization can also increase the demand for infrastructure investment. Below we provide a simple analysis of the relationship between infrastructure investment and urbanization in the PRC. In particular, we propose two alternative hypotheses. Hypothesis 1: Infrastructure investment drives urbanization in the PRC, with decreasing marginal effect.
According to Hulten (1994), building one network may have a high rate of return, but building a second network may have a lower marginal return. This implies that the marginal effect of infrastructure investment is likely to decrease, that is, there is an inverse-U effect of infrastructure investment on urbanization. Hypothesis 2: Urbanization drives infrastructure investment through a demand-side effect, with decreasing marginal return.
§ Vijverberg et al. (2011) also examined industrial enterprises, using province-level data from 1993 to 2003, but found the rate of returns to be 23%–25%. One possibility of this relative small rate of returns is the endogeneity in the infrastructure variable, such as measurement errors, which bias the estimates negatively.
19
ADBI Working Paper 632 Li
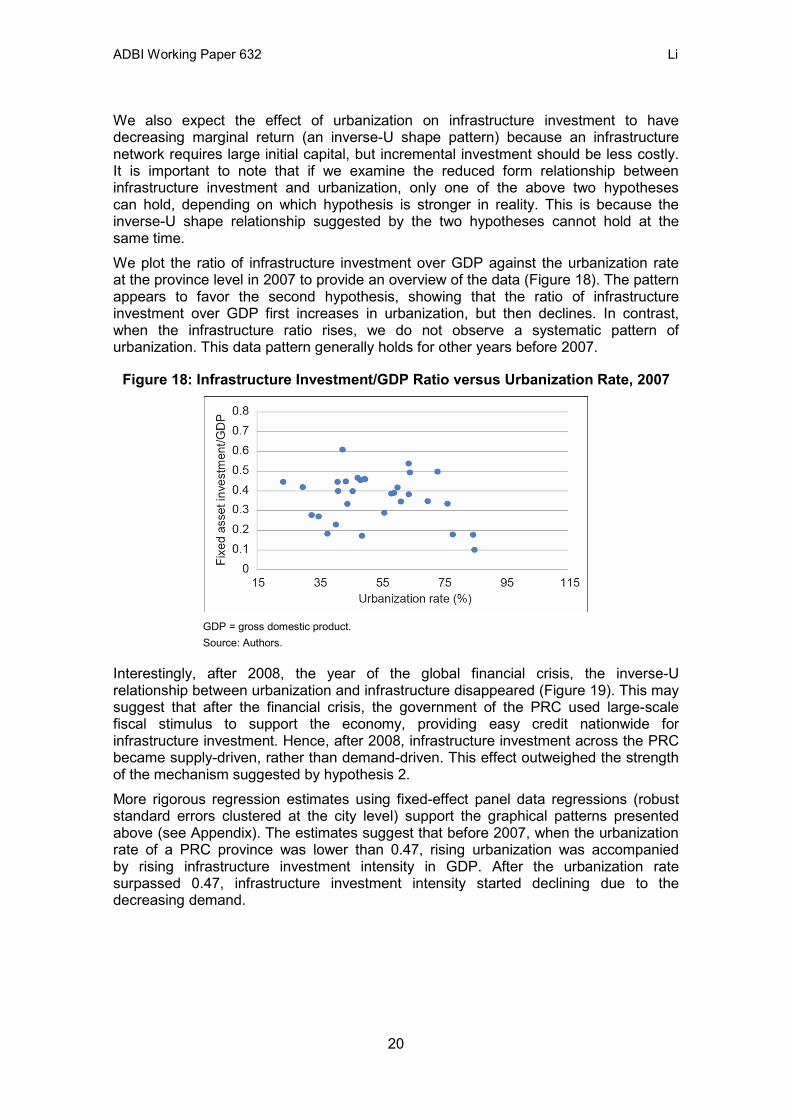
We also expect the effect of urbanization on infrastructure investment to have decreasing marginal return (an inverse-U shape pattern) because an infrastructure network requires large initial capital, but incremental investment should be less costly. It is important to note that if we examine the reduced form relationship between infrastructure investment and urbanization, only one of the above two hypotheses can hold, depending on which hypothesis is stronger in reality. This is because the inverse-U shape relationship suggested by the two hypotheses cannot hold at the same time. We plot the ratio of infrastructure investment over GDP against the urbanization rate at the province level in 2007 to provide an overview of the data (Figure 18). The pattern appears to favor the second hypothesis, showing that the ratio of infrastructure investment over GDP first increases in urbanization, but then declines. In contrast, when the infrastructure ratio rises, we do not observe a systematic pattern of urbanization. This data pattern generally holds for other years before 2007.
Figure 18: Infrastructure Investment/GDP Ratio versus Urbanization Rate, 2007
GDP = gross domestic product. Source: Authors.
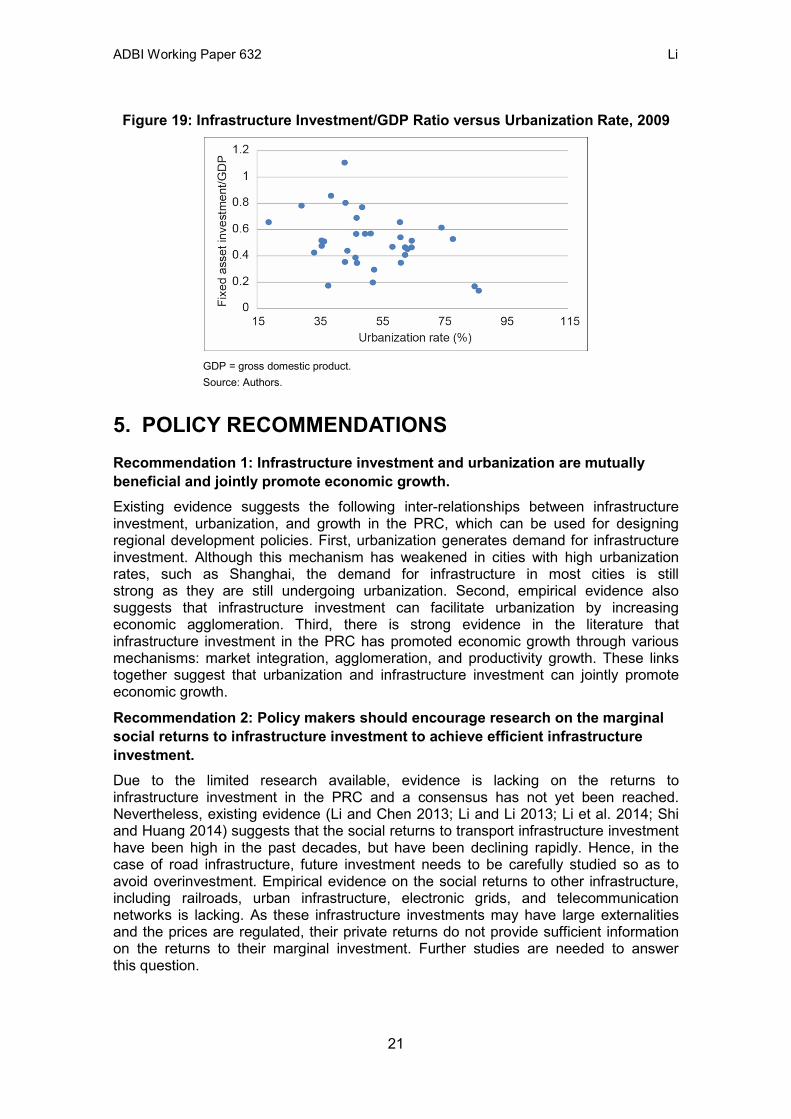
Interestingly, after 2008, the year of the global financial crisis, the inverse-U relationship between urbanization and infrastructure disappeared (Figure 19). This may suggest that after the financial crisis, the government of the PRC used large-scale fiscal stimulus to support the economy, providing easy credit nationwide for infrastructure investment. Hence, after 2008, infrastructure investment across the PRC became supply-driven, rather than demand-driven. This effect outweighed the strength of the mechanism suggested by hypothesis 2. More rigorous regression estimates using fixed-effect panel data regressions (robust standard errors clustered at the city level) support the graphical patterns presented above (see Appendix). The estimates suggest that before 2007, when the urbanization rate of a PRC province was lower than 0.47, rising urbanization was accompanied by rising infrastructure investment intensity in GDP. After the urbanization rate surpassed 0.47, infrastructure investment intensity started declining due to the decreasing demand.
20
ADBI Working Paper 632 Li
Figure 19: Infrastructure Investment/GDP Ratio versus Urbanization Rate, 2009
GDP = gross domestic product. Source: Authors.
5. POLICY RECOMMENDATIONS Recommendation 1: Infrastructure investment and urbanization are mutually beneficial and jointly promote economic growth. Existing evidence suggests the following inter-relationships between infrastructure investment, urbanization, and growth in the PRC, which can be used for designing regional development policies. First, urbanization generates demand for infrastructure investment. Although this mechanism has weakened in cities with high urbanization rates, such as Shanghai, the demand for infrastructure in most cities is still strong as they are still undergoing urbanization. Second, empirical evidence also suggests that infrastructure investment can facilitate urbanization by increasing economic agglomeration. Third, there is strong evidence in the literature that infrastructure investment in the PRC has promoted economic growth through various mechanisms: market integration, agglomeration, and productivity growth. These links together suggest that urbanization and infrastructure investment can jointly promote economic growth.
Recommendation 2: Policy makers should encourage research on the marginal social returns to infrastructure investment to achieve efficient infrastructure investment. Due to the limited research available, evidence is lacking on the returns to infrastructure investment in the PRC and a consensus has not yet been reached. Nevertheless, existing evidence (Li and Chen 2013; Li and Li 2013; Li et al. 2014; Shi and Huang 2014) suggests that the social returns to transport infrastructure investment have been high in the past decades, but have been declining rapidly. Hence, in the case of road infrastructure, future investment needs to be carefully studied so as to avoid overinvestment. Empirical evidence on the social returns to other infrastructure, including railroads, urban infrastructure, electronic grids, and telecommunication networks is lacking. As these infrastructure investments may have large externalities and the prices are regulated, their private returns do not provide sufficient information on the returns to their marginal investment. Further studies are needed to answer this question.
21
ADBI Working Paper 632 Li
Recommendation 3: The market or the government alone is not sufficient to provide optimal infrastructure investment, and a public–private partnership (PPP) mechanism is needed. Existing studies have a number of important implications for infrastructure financing in the PRC. First, infrastructure investment is currently monopolized by governments, especially local governments. Compared with other economies, participation of private investment on infrastructure investment is limited. According to Li et al. (2014), this lack of private financing may be a key reason for the low productivity of road infrastructure investment, especially in the coastal regions of the PRC. Hence, reducing the barriers to private investment in the infrastructure sector can help to increase the efficiency of investment. Second, infrastructure may have strong spillover benefits across provinces. For example, Li and Li (2013) found that road investment in a province of the PRC can affect the productivity of manufacturing firms in other provinces by reducing their inventory levels. Road investment, however, is mainly financed by local governments (Table 2). Hence, local governments may have little incentive to take other provinces’ benefits into account when they decide on road investment. This issue cannot be addressed by allowing private investments. One possible solution is to increase the share of the central government in infrastructure financing. Alternatively, taxes may be levied on firms in other provinces that benefit from road investment in local provinces (such as establishing toll stations between the borders of provinces). Although the evidence available is only for roads, it is likely that a similar situation may occur for other types of infrastructure. More studies are also needed in this direction.
Recommendation 4: When investment incentive is distorted, infrastructure investment will be biased by local institutional quality and financing ability, and correction is needed. There has been much discussion on whether infrastructure is oversupplied or undersupplied in the inland regions of the PRC, but evidence available is limited. Shi and Huang (2014) found that before 2008, infrastructure was generally undersupplied across the PRC. However, after 2008, most of the western provinces already exhibited an oversupply of infrastructure relative to private capital, whereas some eastern and central provinces still showed a shortage of infrastructure. It is important to note that this unbalanced investment across the PRC may vary across different types of infrastructure. For some infrastructure, such as telecommunications, evidence suggests that it does help to improve GDP growth in the provinces in the affluent eastern region, but not in the low-income central and western provinces (Shiu and Lam 2008). However, in terms of road investment, Li et al. (2014) found that road infrastructure in the inland regions was still severely undersupplied, while that in the coastal region had already been oversupplied by 2007. These findings suggest that there may not be a uniform policy to improve the infrastructure investment efficiency in the PRC. Instead, different policies need to be designed for different types of infrastructure.
22
ADBI Working Paper 632 Li
REFERENCES** Bai, C., and Y. Qian. 2010. Infrastructure Development in China: The Cases of
Electricity, Highways, and Railways. Journal of Comparative Economics 38: 34–51.
Banerjee, A., E. Duflo, and N. Qian. 2012. On the Road: Access to Transportation Infrastructure and Economic Growth in China. NBER Working Paper No. 17897. Cambridge, MA: National Bureau for Economic Research.
Bellier, M., and Y. M. Zhou. 2003. Private Participation in Infrastructure in China: Issues and Recommendations for the Road, Water and Power Sectors. Washington, DC: The World Bank and International Finance Corporation.
Bird, R. M., and C. C. P. Wong. 2005. China's Fiscal System: A Work in Progress. International Studies Program Working Paper 0520. Atlanta, GA: Andrew Young School of Policy Studies, Georgia State University.
Canning, D. 1998. A Database of World Stocks of Infrastructure,1950–95. World Bank Economic Review 12(3): 529–547.
Chan, K. W. 1998. Infrastructure Services and Financing in Chinese Cities. Pacific Rim Law and Policy Journal 7(3): 503–528.
Conley, T. G., and E. Ligo. 2002. Economic Distance and Cross-Country Spillovers. Journal of Economic Growth 7(2): 157–187.
Démurger, S. 2001. Infrastructure Development and Economic Growth: An Explanation for Regional Disparities in China? Journal of Comparative Economics 29(1): 95–117.
Faber, B. 2009. Integration and the Periphery: The Unintended Effects of New Highways in a Developing Country. LSE Working Papers. London: London School of Economics.
Fay, M., and T. Yepes. Investing in Infrastructure: What is Needed from 2000 to 2010? World Bank Working Paper WPS 3102. Washington, DC: The World Bank.
Fernald, J. G. 1999. Roads to Prosperity? Assessing the Link between Public Capital and Productivity. The American Economic Review 89(3): 619–638.
Gao, F. 2005. Transportation Infrastructure Investment and Economic Growth. Beijing: China Financial and Economic Publishing House.
Grimsey, D., and M. K. Lewis. 2002. Evaluating the Risks of Public Private Partnerships for Infrastructure Projects. International Journal of Project Management 20: 107–118.
He, L., and F. Duchin. 2009. Regional Development in China: Interregional Transportation Infrastructure and Regional Comparative Advantage. Economic Systems Research 21(1): 3–22.
Hua, K. 1993. Urban Infrastructural Construction, Development Problems and Prospects in China. Urban and Regional Development in China: Looking into the 21st Century. In Zhong Guo Cheng Shi yu Gu Yue Fa Zhan: Zhan Wen Er Shi Yi Shi Ji (in Chinese), edited by Yue-man Yueng.
** The Asian Development Bank recognizes China as the People’s Republic of China.
23
ADBI Working Paper 632 Li
Huang, Y. 2008. Capitalism with Chinese Characteristics: Entrepreneurship and the State. New York, NY: Cambridge University Press.
Hulten, C. R. 1994. Optimal Growth with Infrastructure Capital: Theory and Implications for Empirical Modeling. Working Paper. College Park, MD: University of Maryland.
Krugman, P. 1980. Scale Economies, Product Differentiation, and the Pattern of Trade. American Economic Review 70(5): 950–959.
Lee, D. Q., and C. A. Martini. 1996. Difficulties in Infrastructure Financing. Journal of Applied Finance and Investment 1(1): 24–27.
Li, H., and Z. Li. 2013. Road Investment and Inventory Reduction: Evidence from Chinese Manufacturers. Journal of Urban Economics 76: 43–52.
Li, Z. 2013. Transportation Infrastructure Investment and Economic Development. In China’s Regional Development: Review and Prospect, edited by M. Lu et al. New York, NY: Routledge.
Li, Z., and Y. Chen. 2013. Estimating the Social Return to Transport Infrastructure: A Price-Difference Approach Applied to a Quasi-Experiment. Journal of Comparative Economics 41(3): 669–683.
Li Z., X. Yu, Y. Zeng, and R. Holst. 2012. Estimating Transport Costs and Trade Barriers in China: Direct Evidence from Chinese Agricultural Traders. China Economic Review (23): 1003–1010.
Li, Z., C. Bin, and M. Wu. 2014. Is Road Infrastructure Investment in China Excessive? Evidence from Productivity of Firms. Mimeo.
Limao, N., and A. Venables. 2001. Infrastructure, Geographical Disadvantages, Transport Cost and Trade. World Bank Economic Review 15: 451–479.
Lin, S. 2001. Public Infrastructure Development in China. Comparative Economic Studies 43(2): 83–109.
Mikesell, J. L., A. T–K. Ho, J. Ma, and M. Niu. 2008. Financing Local Public Infrastructure in the People’s Republic of China: A Case Study of Guangdong Province. Peking University–Lincoln Center Working Paper Series. Beijing: Peking University–Lincoln Center.
Peterson, G. E. 2006. Land Leasing and Land Sale as An Infrastructure–Financing Option. World Bank Policy Research Working Paper 4043. Washington, DC: The World Bank.
Shi, H., and S. Huang. 2014. How Much Infrastructure Is Too Much? A New Approach and Evidence from China. World Development 56: 272–286.
Shiu, A., and P.–L. Lam. 2008. Causal Relationship between Telecommunications and Economic Growth in China and its Regions. Regional Studies 42(5): 705–718.
Su, M., and Q. Zhao. 2007. China: Fiscal Framework and Urban Infrastructure Finance. In Financing Cities: Fiscal Responsibility and Urban Infrastructure in Brazil, China, India, Poland and South, edited by G. E. Peterson and P. Clarke Annez. Washington, DC and New Delhi: World Bank and Sage Publications India.
Vijverberg, W. P. M., F–C. Fu, and C–P. C. Vijverberg. 2011. Public Infrastructure as a Determinant of Productive Performance in China. Journal of Productivity Analysis 36(1): 91–111.
24
ADBI Working Paper 632 Li
Wang, D., and Z. Zhang. 2009. A Research on the Mechanism of Urban Infrastructure Funding and Financing in China (Woguo Chengshi Jichusheshi Jianshe Zijin Yunzuo Moshi Yanjiu), Planning Research (Guihua Yanjiu) 3: 9–16 (in Chinese).
Wooldridge, J. M. 2002. Econometric Analysis of Cross Section and Panel Data. Cambridge, MA and London, United Kingdom: The MIT Press.
Wu, W. 1999. Reforming China's Institutional Environment for Urban Infrastructure Provision. Urban Studies 36(13): 2263–2282.
Wu, W. 2008. Urban Infrastructure Financing and Regional Economic Performance under China's Fiscal Decentralization. Symposium on Local Public Finance and Property Taxation in China. Lincoln Institute of Land Policy, Cambridge, MA. 12 May.
Zhao, Z., and C. Cao. 2011. Funding China’s Urban Infrastructure: Revenue Structure and Financing Approaches. Public Finance and Management 11(3): 284–305.
Zheng, S., and M. E. Kahn. 2013. China’s Bullet Trains Facilitate Market Integration and Mitigate the Cost of Megacity Growth. PNAS 110(14). http://www.pnas.org/content/110/14/E1248.full.pdf
25
ADBI Working Paper 632 Li
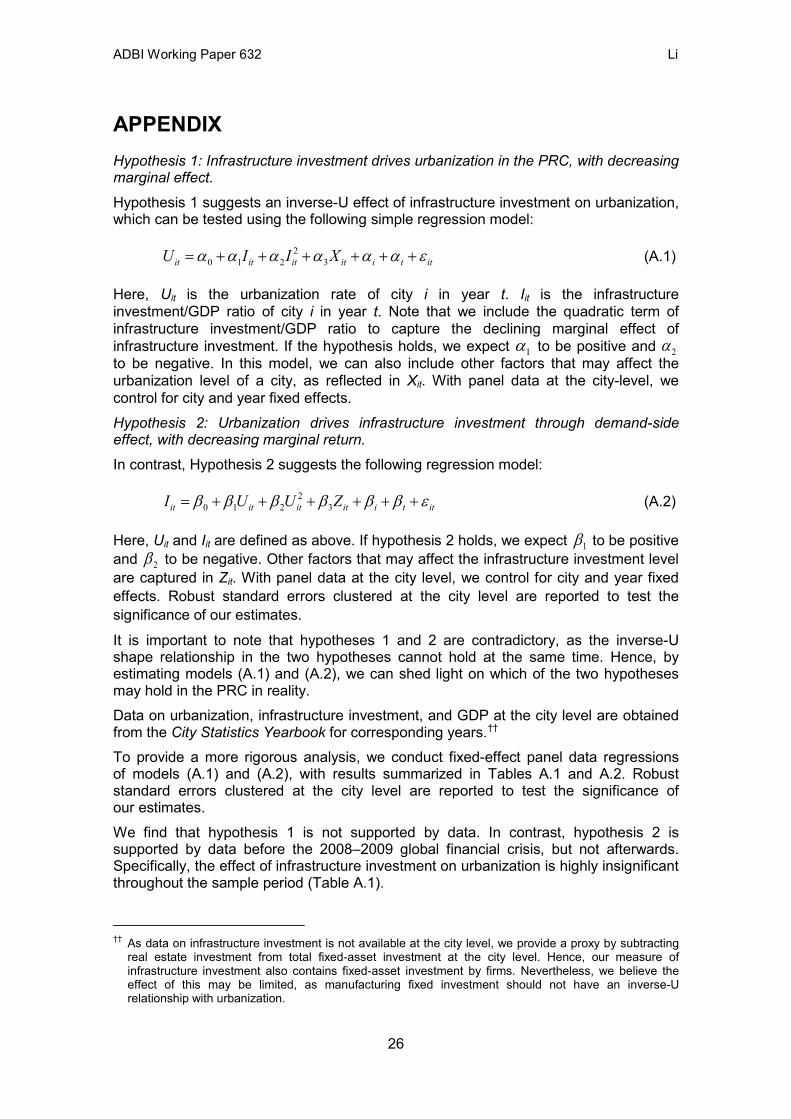
APPENDIX Hypothesis 1: Infrastructure investment drives urbanization in the PRC, with decreasing marginal effect.
Hypothesis 1 suggests an inverse-U effect of infrastructure investment on urbanization, which can be tested using the following simple regression model:
20 1 2 3it it it it i t itU I I Xα α α α α α ε= + + + + + + (A.1)
Here, Uit is the urbanization rate of city i in year t. Iit is the infrastructure investment/GDP ratio of city i in year t. Note that we include the quadratic term of infrastructure investment/GDP ratio to capture the declining marginal effect of infrastructure investment. If the hypothesis holds, we expect 1α to be positive and 2α to be negative. In this model, we can also include other factors that may affect the urbanization level of a city, as reflected in Xit. With panel data at the city-level, we control for city and year fixed effects. Hypothesis 2: Urbanization drives infrastructure investment through demand-side effect, with decreasing marginal return.
In contrast, Hypothesis 2 suggests the following regression model:
20 1 2 3it it it it i t itI U U Zβ β β β β β ε= + + + + + + (A.2)
Here, Uit and Iit are defined as above. If hypothesis 2 holds, we expect 1β to be positive and 2β to be negative. Other factors that may affect the infrastructure investment level are captured in Zit. With panel data at the city level, we control for city and year fixed effects. Robust standard errors clustered at the city level are reported to test the significance of our estimates.
It is important to note that hypotheses 1 and 2 are contradictory, as the inverse-U shape relationship in the two hypotheses cannot hold at the same time. Hence, by estimating models (A.1) and (A.2), we can shed light on which of the two hypotheses may hold in the PRC in reality. Data on urbanization, infrastructure investment, and GDP at the city level are obtained from the City Statistics Yearbook for corresponding years.†† To provide a more rigorous analysis, we conduct fixed-effect panel data regressions of models (A.1) and (A.2), with results summarized in Tables A.1 and A.2. Robust standard errors clustered at the city level are reported to test the significance of our estimates. We find that hypothesis 1 is not supported by data. In contrast, hypothesis 2 is supported by data before the 2008–2009 global financial crisis, but not afterwards. Specifically, the effect of infrastructure investment on urbanization is highly insignificant throughout the sample period (Table A.1).
†† As data on infrastructure investment is not available at the city level, we provide a proxy by subtracting real estate investment from total fixed-asset investment at the city level. Hence, our measure of infrastructure investment also contains fixed-asset investment by firms. Nevertheless, we believe the effect of this may be limited, as manufacturing fixed investment should not have an inverse-U relationship with urbanization.
26
ADBI Working Paper 632 Li
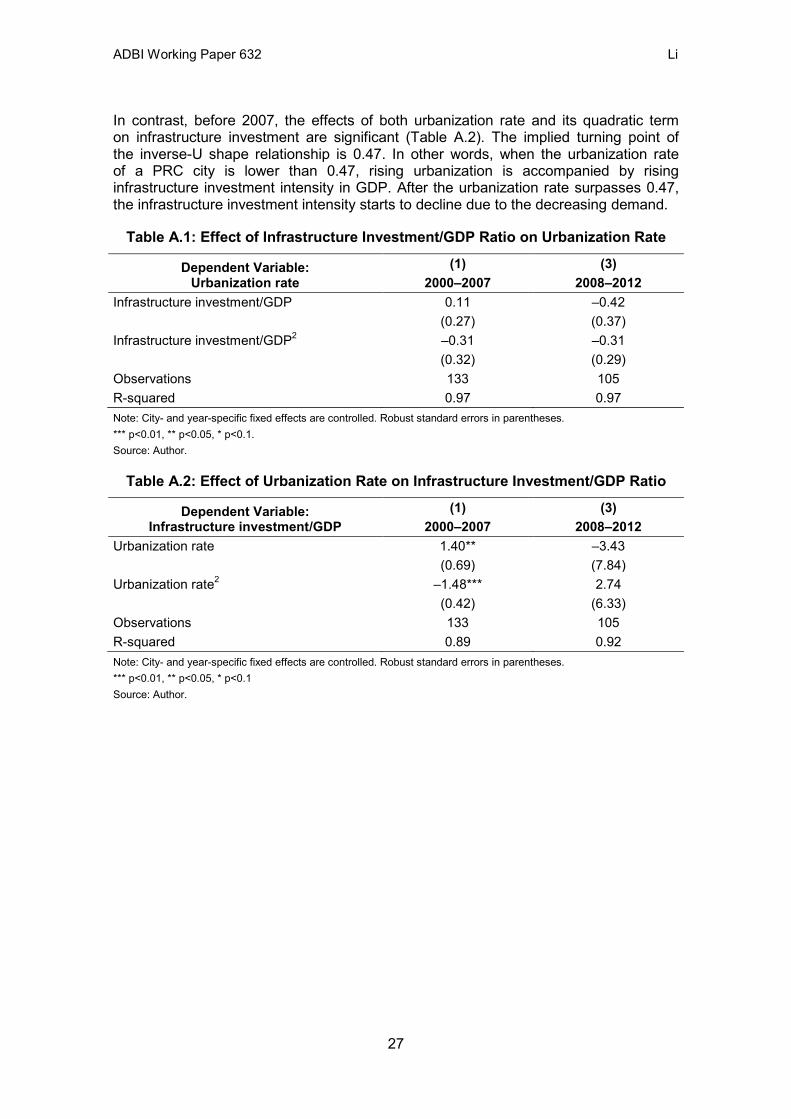
In contrast, before 2007, the effects of both urbanization rate and its quadratic term on infrastructure investment are significant (Table A.2). The implied turning point of the inverse-U shape relationship is 0.47. In other words, when the urbanization rate of a PRC city is lower than 0.47, rising urbanization is accompanied by rising infrastructure investment intensity in GDP. After the urbanization rate surpasses 0.47, the infrastructure investment intensity starts to decline due to the decreasing demand.
Table A.1: Effect of Infrastructure Investment/GDP Ratio on Urbanization Rate
Dependent Variable: Urbanization rate
(1) (3) 2000–2007 2008–2012
Infrastructure investment/GDP 0.11 –0.42 (0.27) (0.37) Infrastructure investment/GDP2 –0.31 –0.31 (0.32) (0.29) Observations 133 105 R-squared 0.97 0.97 Note: City- and year-specific fixed effects are controlled. Robust standard errors in parentheses. *** p<0.01, ** p<0.05, * p<0.1. Source: Author.
Table A.2: Effect of Urbanization Rate on Infrastructure Investment/GDP Ratio
Dependent Variable: Infrastructure investment/GDP
(1) (3) 2000–2007 2008–2012
Urbanization rate 1.40** –3.43 (0.69) (7.84) Urbanization rate2 –1.48*** 2.74 (0.42) (6.33) Observations 133 105 R-squared 0.89 0.92 Note: City- and year-specific fixed effects are controlled. Robust standard errors in parentheses. *** p<0.01, ** p<0.05, * p<0.1 Source: Author.
27