ASIAN DEVELOPMENT BANK - adb.org · PDF fileasian development bank pcr: phi 25386 project...
45
ASIAN DEVELOPMENT BANK PCR: PHI 25386 PROJECT COMPLETION REPORT ON THE NORTHERN LUZON TRANSMISSION AND GENERATION PROJECT (Loan 1398-PHI) IN THE PHILIPPINES August 2001
Transcript of ASIAN DEVELOPMENT BANK - adb.org · PDF fileasian development bank pcr: phi 25386 project...

ASIAN DEVELOPMENT BANK PCR: PHI 25386
PROJECT COMPLETION REPORT
ON THE
NORTHERN LUZON TRANSMISSION AND GENERATION PROJECT(Loan 1398-PHI)
IN THE
PHILIPPINES
August 2001

CURRENCY EQUIVALENTS
Currency Unit – Peso (P)
At Appraisal At Project Completion(May 1995) (March 1999)
P1.00 = $0.03844 P1.00 = $0.02564$1.00 = P26.011 $1.00 = P38.995
ABBREVIATIONS
ADB – Asian Development BankBOT – build-operate-transferBSP – Bangko Sentral Ng PilipinasDENR – Department of Environment and Natural ResourcesDOE – Department of EnergyDOF – Department of FinanceDSCR – debt-service coverage ratioEIRR – economic internal rate of returnFIRR – financial internal rate of returnGIS – gas insulated substationGWh – gigawatt-hourIDC – interest and commitment charges during constructionIPP – independent power producerJEXIM – Export-Import Bank of JapanKfW – Kreditanstalt für�Wiederaufbaukm – kilometerkV – kilovoltkWh – kilowatt-hourMeralco – Manila Electric CompanyMVAR – megavolt-ampere reactiveMW – megawattNGO – nongovernment organizationNPC – National Power CorporationO&M – operation and maintenancePCR – project completion reportPSRP – Power Sector Restructuring ProgramRORB – return-on-rate baseTA – technical assistanceTRANSCO – National Transmission Corporation
NOTES
(i) The fiscal year of the Government and the Executing Agency ends on31 December.
(ii) In this report, “$” refers to US dollars.

CONTENTS
Page
BASIC DATA i
MAP vii
I. PROJECT DESCRIPTION 1
II. EVALUATION OF IMPLEMENTATION 1
A. Project Components 1B. Implementation Arrangements 2C. Project Costs 2D. Project Schedule 3E. Engagement of Consultants and Procurement of Goods and Services 3F. Performance of Consultants, Contractors, and Suppliers 4G. Conditions and Covenants 4H. Disbursements 6I. Environmental and Social Impact 6J. Performance of the Borrower and the Executing Agency 8K. Performance of the Asian Development Bank 8
III. TECHNICAL ASSISTANCE 8
A. Objectives and Scope 8B. Evaluation of Inputs 8C. Evaluation of Outputs 9
IV. EVALUATION OF INITIAL PERFORMANCE AND BENEFITS 10
A. Technical Performance 10B. Financial Performance 11C. Economic Performance 12D. Attainment of Benefits 13
IV. CONCLUSIONS AND RECOMMENDATIONS 14
A. Conclusions 14B. Lessons Learned 14C. Recommendations 14
APPENDIXES 16

BASIC DATA
A. Loan Identification
1. Country : Philippines2. Loan Number : 1398–PHI3. Project Title : Northern Luzon Transmission and
Generation Project4. Guarantor : Republic of the Philippines5. Borrower/Executing Agency : National Power Corporation6. Amount of Loan : $244.00 million7. PCR Number : 636
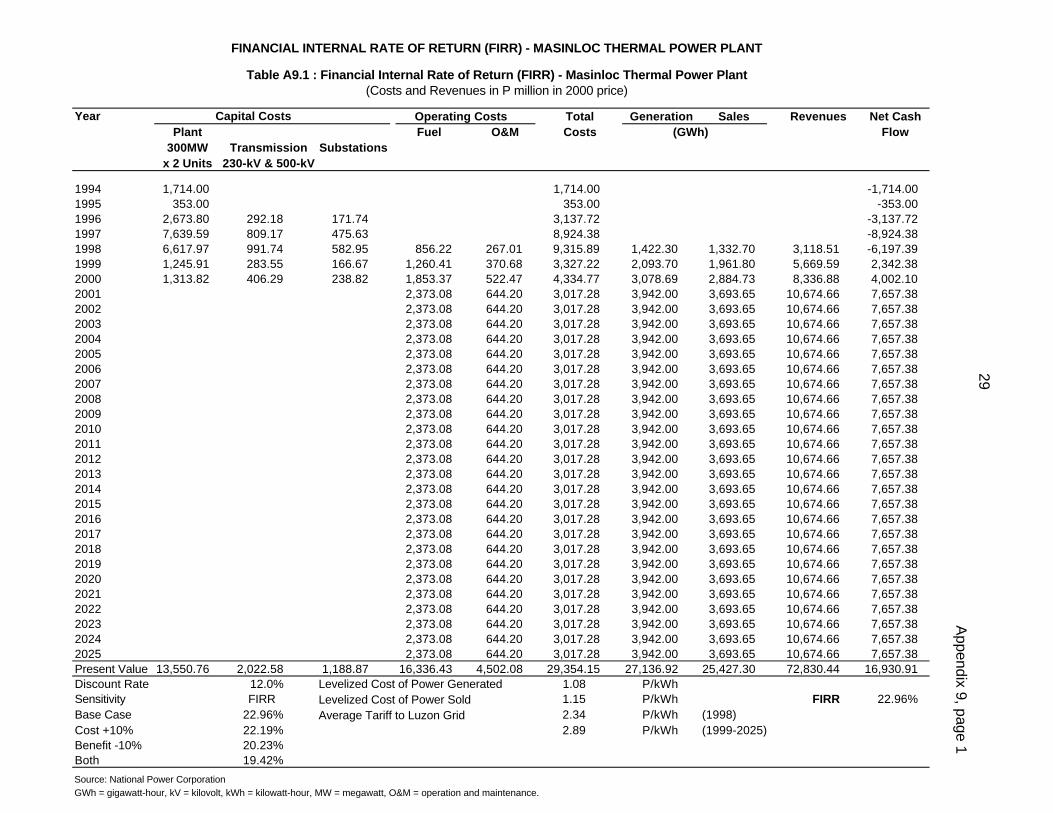
B. Loan Data
1. Appraisal- Date Started: 24 April 1995- Date Completed: 12 May 1995
2. Loan Negotiations- Date Started: 4 October 1995- Date Completed: 6 October 1995
3. Date of Board Approval: 2 November 1995
4. Date of Loan Agreement: 27 November 1995
5. Date of Loan Effectiveness- In Loan Agreement: 25 February 1996- Actual: 30 May 1996- Number of Extensions: One
6. Closing Date- In Loan Agreement: 30 June 1999- Actual: 4 October 2000- Number of Extensions: One
7. Terms of Loan- Interest Rate: Pool-based variable interest rate- Maturity (number of years): 24- Grace Period (number of years): 4

iii8. Disbursements
a. Dates
Initial Disbursement Final Disbursement Time Interval
6 September 1996 4 October 2000 49 months
Effective Date Original Closing Date Time Interval
30 May 1996 30 June 1999 37 months
b. Schedule ($ million)
Year Amount
1996 22.521997 55.571998 48.971999 15.082000 19.54
Total 161.68
c. Amount ($ million equivalent)
CategoryOriginal
Allocation
LastRevised
Allocation
AmountCancelled
DuringImplementation
AmountAvailable
ForDisbursement
Net AmountDisbursed
UndisbursedBalance
I - Substation(Part A2) 102.45 62.45 40.00 62.45 56.22 6.23
II - Masinloc II(Part B) 102.20 78.20 24.00 78.20 77.72 0.48
III -ConsultingServices(Part A2)
0.90 1.80 0 1.80 1.73 0.07
IV -ConsultingServices(Part D)
2.30 2.30 0 2.30 0.71 1.59
V - IDC 25.30 25.30 0 25.30 25.30 0
VI - Unallocated 10.85 9.95 0 9.95 0 9.95
Total 244.00 180.00 64.00 180.00 161.68 18.321
IDC = interest and commitment charges during construction.1 Cancelled on loan closing.
ivC. Project Data
1. Project Cost ($ million equivalent)
Item Appraisal Estimate Actual 1
Foreign Exchange Cost 752.60 575.08Local Cost 143.70 82.11Total Cost 896.30 657.191 Including National Power Corporation budget provision for resettlement compensation.
2. Financing Plan ($ million equivalent)
Appraisal Estimate Actual 1
Foreign Local Total Foreign Local Total
Implementation CostsADB Financed 218.70 0 218.70 136.38 0 136.38NPC Financed 13.60 115.40 129.00 101.59 60.41 162.00Other External Financing 461.70 28.30 490.00 253.91 21.70 275.61
Subtotal 694.00 143.70 837.70 491.88 82.11 573.99
IDC CostsADB Financed 25.30 0 25.30 25.30 0 25.30Other Financing 33.30 0 33.30 57.90 0 57.90
Subtotal 58.60 0 58.60 83.20 0 83.20
Total Project Cost 752.60 143.70 896.30 575.08 82.11 657.19
ADB = Asian Development Bank; NPC = National Power Corporation; IDC = interest andcommitment charges during construction.1 Including National Power Corporation budget provision for resettlement compensation.
3. Cost Breakdown by Project Components ($ million equivalent)
Appraisal Estimate Actual 1
Foreign Local Total Foreign Local Total
Part A1: Transmission Lines 137.30 63.40 200.70 127.07 45.72 172.79Part A2: Substations 227.30 75.70 303.00 114.17 28.33 142.50Part B: Masinloc Stage II 208.80 4.00 212.80 159.84 6.99 166.84Part C: Additional Costs (Masinloc I) 118.30 0 118.30 90.09 1.06 91.15Part D: Institutional Support 2.30 0.60 2.90 0.71 0.01 0.72Subtotal 694.00 143.70 837.70 491.88 82.11 573.99
IDC 58.60 0 58.60 83.20 0 83.20
Total Project Cost 752.60 143.70 896.30 575.08 82.11 657.19
IDC = interest and commitment charges during construction.1 Including National Power Corporation budget provision for resettlement compensation.
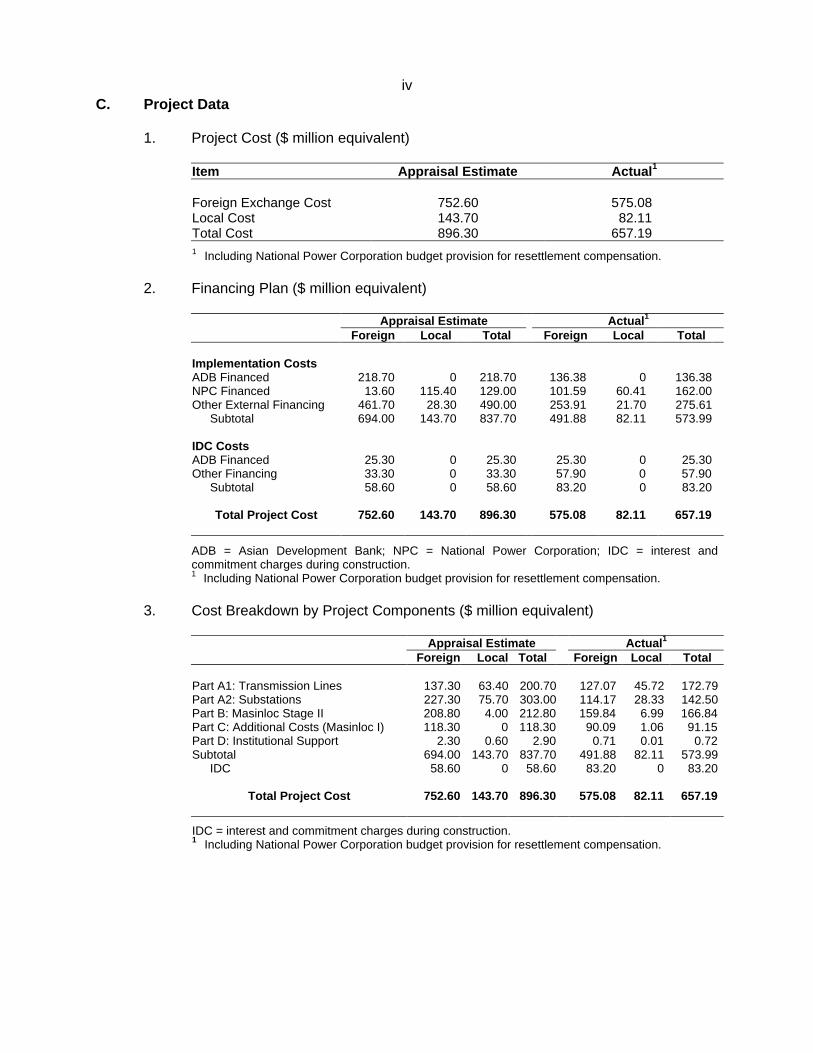
v4. Project Schedule
a. ADB-Financed Components
Appraisal Estimate Actual
(i) Labrador Substation
Bid Opening 30 November 1995 14 May 1996Contract Signing 31 March 1996 22 November 1996Start of Operations 28 February 1998 26 February 1999
(ii) San Manuel Substation
Bid Opening 30 November 1995 14 May 1996Contract Signing 31 March 1996 22 November 1996Start of Operations 28 February 1998 17 January 1999
(iii) San Jose Substation
Bid Opening 30 November 1995 14 May 1996Contract Signing 31 March 1996 22 November 1996Start of Operations 28 February 1998 27 January 1999
(iv) Communications andProtection System
Bid Opening 30 November 1995 14 May 1996Contract Signing 31 March 1996 22 November 1996Start of Operations 28 February 1998 31 March 1999
(v) Masinloc ThermalPower Plant
Stage I Commissioning 30 June 1998 18 June 1998Stage II Commissioning 29 November 1998 10 December 1998
b. Other Financiers’ Components
Appraisal Estimate Actual
(i) Masinloc-LabradorTransmission Line
Bid Opening 30 November 1995 16 April 1996Contract Signing 31 March 1996 13 November 1996Start of Operations 30 September 1997 30 April 19991
1 The Masinloc-Labrador line was ready to transmit power from the Masinloc thermalpower plant at reduced capacity as early as September 1997 by way of completing thefirst 5 km section and tapping to the existing Botolan-Labrador 230 kV line. The abovedate refers to the completion of the entire 89 km transmission line.

vi
Appraisal Estimate Actual
(ii) Sual-LabradorTransmission Line
Bid Opening 31 August 1995 29 February 1996Contract Signing 28 February 1996 13 November 1996Start of Operations 31 May 1997 2 August 1998
(iii) Labrador-San ManuelTransmission Line
Bid Opening 31 August 1995 29 February 1996Contract Signing 28 February 1996 13 November 1996Start of Operations 31 August 1997 12 March 1999
(iv) San Manuel-San JoseTransmission Line
Bid Opening 31 August 1995 29 February 1996Contract Signing 28 February 1996 13 November 1996Start of Operations 31 August 1997 31 March 1999
D. Data on Asian Development Bank Missions
Name ofMission
DateNo. of
PersonsNo. of
Person-Days
Specializationof Members 1
Fact-Finding 14 November-2 December 1994 5 49 a, b, f, gAppraisal 24 April-12 May 1995 8 108 b, c, d, f, g, jReview2 2-11 December 1996 2 10 a, kReview2 26 November-12 December 1997 3 21 b, j, kReview3 9-20 October 2000 3 12 d, kPCR4 19-22 March 2001 3 12 b, d, k
PCR = project completion report.1 a-engineer, b-financial analyst, c-counsel, d-economist/energy specialist, e-procurement, f-programs
officer, g-environmental specialist, h-consultant, i-consultant, j-economist/social sector, k-projectadministration staff.
2 In conjunction with Loan 1042-PHI.3 In conjunction with Loan 1288-PHI and Loan 1590-PHI.4 The PCR Mission comprised G. H. Wilson, Sr. Financial Analyst; Y. Zhai, Energy Specialist; and
P. Canlas, Operations Analyst.
vii

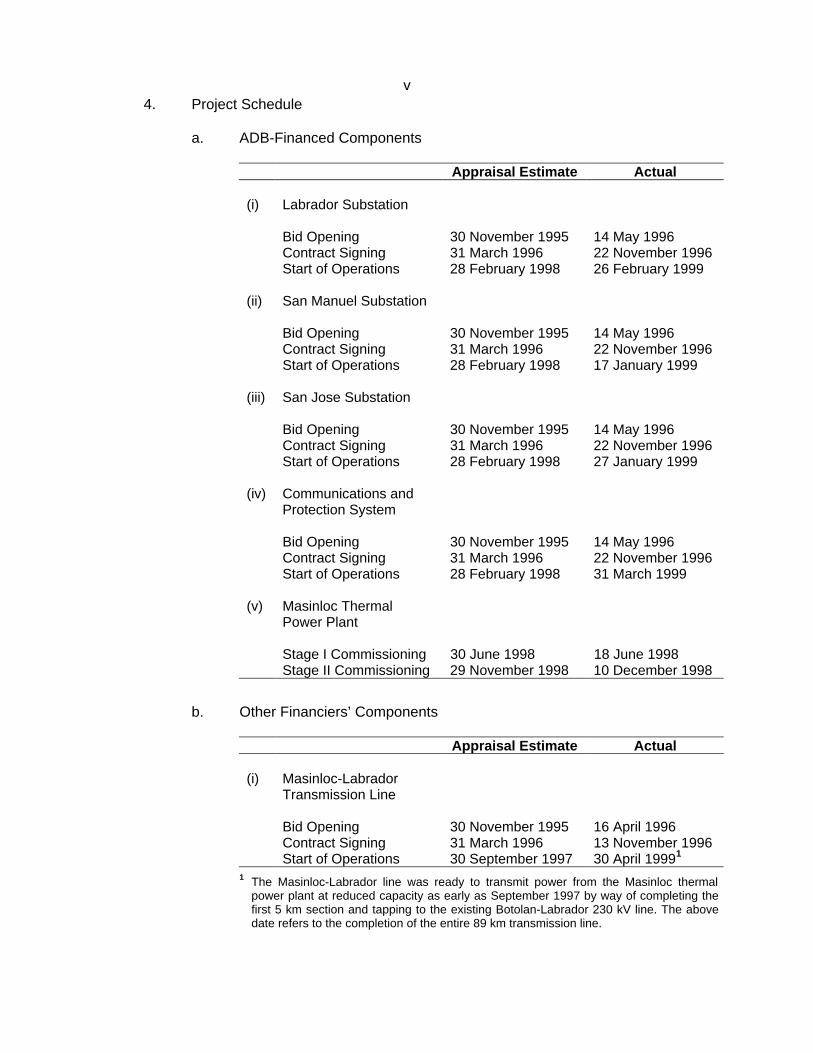
I. PROJECT DESCRIPTION
1. The principal objective of the Project was to ensure the reliability of electricity supply inLuzon through expansion of the transmission network and generation capacity of the NationalPower Corporation (NPC). As part of NPC’s least-cost expansion program, the transmissioncomponents were needed to integrate the output from the Sual and Masinloc power plants withthe Luzon grid. Stage II of the Masinloc power plant, the generation component, was needed toaddress power shortages anticipated after 1997.
2. At appraisal, the transmission components of the Project consisted of an 89-kilometer(km), 230-kilovolt (kV) double-circuit transmission line from Masinloc to Labrador (funded by theKreditanstalt für Wiederaufbau [KfW]); a 22 km, 230 kV double-circuit line from Sual to Labrador(funded by the World Bank); a 225 km of 500 kV line from Labrador to San Jose (funded by theWorld Bank); new 230/500 kV substations at Labrador and San Manuel, expansion andupgrading of the 230 kV San Jose substation, installation of the second 300-megawatt (MW)generating set at the Masinloc thermal power plant, and the provision of consulting services toassist NPC in its restructuring and privatization programs (funded by ADB/Japan Bank forInternational Cooperation [JBIC]); and co-financing support for completing Stage I of theMasinloc power plant and part of the unfunded cost of the Project (guaranteed by ADB).
3. The Masinloc power plant was constructed in two stages. Stage I, which consisted of thefirst 300 MW unit, and common facilities for the two stages, was funded under an earlier AsianDevelopment Bank (ADB) loan.1 Stage I covered all land acquisition and resettlement actionneeded for both stages and a project completion report (PCR) for Stage I was circulated inOctober 1999. The turnkey contract for Stage I of the Masinloc Project contained an option forthe supply and erection of the second 300 MW unit under Stage II. NPC exercised this option,and signed a supplementary contract for Stage II in June 1995. This was also financed as aProject component.
II. EVALUATION OF IMPLEMENTATION
A. Project Components
4. The chronology of major events in the implementation of the Project is given inAppendix 1. The Project, as envisaged during appraisal, included the following components:
Part A1: Northern Luzon transmission lines, consisting of (i) an 89 km, 230 kVtransmission line from Masinloc to Labrador; (ii) a 22 km 230 kV transmission line fromSual to Labrador; (iii) a 68 km, 500 kV transmission line from Labrador to San Manuel;and (iv) a 157 km, 500 kV transmission line from San Manuel to San Jose.
Part A2: Northern Luzon substation construction/expansion consisting of (i) new 230/500kV substations at Labrador and San Manuel; (ii) expanding the 230 kV substation at SanJose and upgrading it to 500 kV; and (iii) providing associated communications andprotection equipment.
1 Loan 1042-PHI: Sixteenth Power (Masinloc Thermal Power) Project, for $200 million, approved on 30 October
1990.

2
Part B: Masinloc Stage II, consisting of the installation of the second 300 MW generatingset at the Masinloc power plant.
Part C: Funding of additional costs for Stage I of the Masinloc project.
Part D: Institutional support to (i) design and implement an accounting system for NPC’sproposed holding company and its subsidiary companies; (ii) revalue NPC’s assets;(iii) advise on human resources and change management; (iv) establish wheeling tariffs;and (v) develop tools for financial evaluation.
5. The Project components were implemented as envisaged except for Part D items (i), (iii),(iv), and (v) which were incorporated into the World Bank component and were therefore nolonger required to be financed by ADB.
B. Implementation Arrangements
6. As envisaged during appraisal, NPC established a Project Management Office tocoordinate all activities related to the Project. The Office was headed by a Project Director withadequate qualifications and experience. In addition, a Project Manager was designated tooversee project implementation in the field with the assistance of site managers responsible foreach of the project components.
C. Project Costs
7. At appraisal, the total cost was estimated at $896.30 million equivalent, comprising$752.60 million equivalent in foreign exchange and $143.70 million equivalent in local currency(Table 1). The actual total cost of the Project was $657.19 million equivalent (a saving of26.7 percent), comprising $575.08 million equivalent in foreign exchange (a saving of23.6 percent) and $82.11 million equivalent in local currency (a saving of 42.9 percent).
Table 1: Estimated and Actual Project Cost($ million equivalent)
Appraisal Estimate Actual 1
Foreign Local Total Foreign Local Total
Part A1: Transmission Lines 137.30 63.40 200.70 127.07 45.72 172.79Part A2: Substations 227.30 75.70 303.00 114.17 28.33 142.50Part B: Masinloc Stage II 208.80 4.00 212.80 159.84 6.99 166.84Part C: Additional Costs (Masinloc I) 118.30 0 118.30 90.09 1.06 91.15Part D: Institutional Support 2.30 0.60 2.90 0.71 0.01 0.72Subtotal 694.00 143.70 837.70 491.88 82.11 573.99IDC 58.60 0 58.60 83.20 0 83.20
Total Project Cost 752.60 143.70 896.30 575.08 82.11 657.19
IDC = interest and commitment charges during construction.1 Including National Power Corporation budget provision for resettlement compensation.
8. The foreign exchange saving in items A1 and A2 can be attributed to intense competitionbetween equipment suppliers that drove the prices down. In fact, 14 suppliers prequalified forthe four packages offered under part A2. The foreign exchange saving in Part B is due to thefact that cost estimates were prepared on the basis of an exchange rate of Y84.56/$, which was

3
the rate prevailing at the time of project appraisal, whereas the average rate on actualdisbursements was Y124.55/$. The foreign exchange saving under Part D is due to the fact thatNPC decided to use ADB financing for only one of the five sub-components, the assetrevaluation exercise (para. 5). The saving in local cost is mainly due to depreciation of the peso,over the project construction period (P26.0/$ at appraisal vs P38.9/$ at project completion).ADB approved partial loan cancellations of $40 million, as of 8 October 1997, and $24 million,as of 10 November 1999. The undisbursed balance of $18,320,987 was cancelled on loanclosing on 4 October 2000.
9. As envisaged at project appraisal, a Y12 billion bond was issued in December 1995under an ADB partial credit guarantee to help NPC finance additional costs for Stage I of theMasinloc project and any unfunded portion of the Project.2 At project completion, the totalproceeds of the bond issue were fully utilized for the purposes mentioned above (Appendix 2).
D. Project Schedule
10. It was envisaged during appraisal (May 1995) that the transmission lines would becompleted by September 1997, the substations by February 1998, and Unit 2 of the Masinlocthermal power plant by December 1998. The actual dates of completion were March 1999 forthe transmission lines (a delay of 18 months), February 1999 for the substations (a delay of12 months), and December 1998 for Unit 2 (on schedule). A comparison of the appraised andactual implementation schedule is shown in Appendix 3.
11. For ADB-financed substation components, significant initial delays occurred as a resultof the slow procurement process (prequalification and tender evaluation). Moreover, as theLoan Agreement required NPC to acquire all land needed for the start of construction before theaward of each turnkey contract, the main concern was the delay in the land acquisition. ADBand NPC amended the Loan Agreement to require the Borrower to have acquired all land,properties, rights-of-way, etc., prior to completion of the substation equipment manufacturepursuant to such turnkey contracts. Project implementation delay due to land acquisition wastherefore minimized. The turnkey contracts were signed in November 1996 while the certificatesof handing over of site were issued in April 1997 for Labrador and San Manuel substations, andin October 1997 for the San Jose substation.3
E. Engagement of Consultants and Procurement of Goods and Services
12. Part A2: Substations . ADB approved advance procurement action on 25 January 1995for the purpose of prequalifying contractors for the four turnkey contract packages under PartA2, all of which were procured through international competitive bidding procedures(Appendix 4). The consultant for the construction supervision of the substation turnkey contractpackages was selected in accordance with ADB’s Guidelines on the Use of Consultants from anADB-approved shortlist of seven international consultants.
2 The ADB guarantee covers the bullet repayment of principal at maturity. This was the first guarantee used for a
long-term bond issue in the external yen market. ADB’s guarantee was instrumental in extending the final maturityof the bond from 10 years to 20 years and reducing the coupon rate (yield) to 4.65 percent per annum fixed for20 years.
3 The site for the San Jose Substation was partially handed over in April 1997 for the areas that were not affected bythe land acquisition problems to allow the contractor to start the activities on the 230 kV switchyard.

4
13. Part B: Stage 2 of the Masinloc Thermal Power Plant . ADB agreed to finance thesecond 300 MW unit, and at the request of NPC (para. 3), approved advance procurementaction and retroactive financing for Stage II. In June 1995, NPC signed a supplementarycontract with Mitsubishi Corporation. In the interest of economy and efficiency, NPC alsoextended the construction supervision consulting services contract of the firm working on StageI of the Masinloc project to supervise the construction of Stage II.4
14. Part D: Engagement of Consultants for Institutional Support . The consultant forNPC assets revaluation was selected in accordance with ADB’s Guidelines on the Use ofConsultants from an ADB-approved shortlist of seven international consultants.
F. Performance of Consultants, Contractors, and Suppliers
15. The performance of consultants engaged under the Project was generally satisfactory.No significant problems were encountered with the contractors or suppliers for the turnkeycontracts under the Project and good working relationships were developed among theconsultants, contractors, suppliers, NPC, and ADB. However, the performance of the equipmentsupplied under the turnkey contract for the San Jose substation has not been fully satisfactory(para. 37).
G. Conditions and Covenants
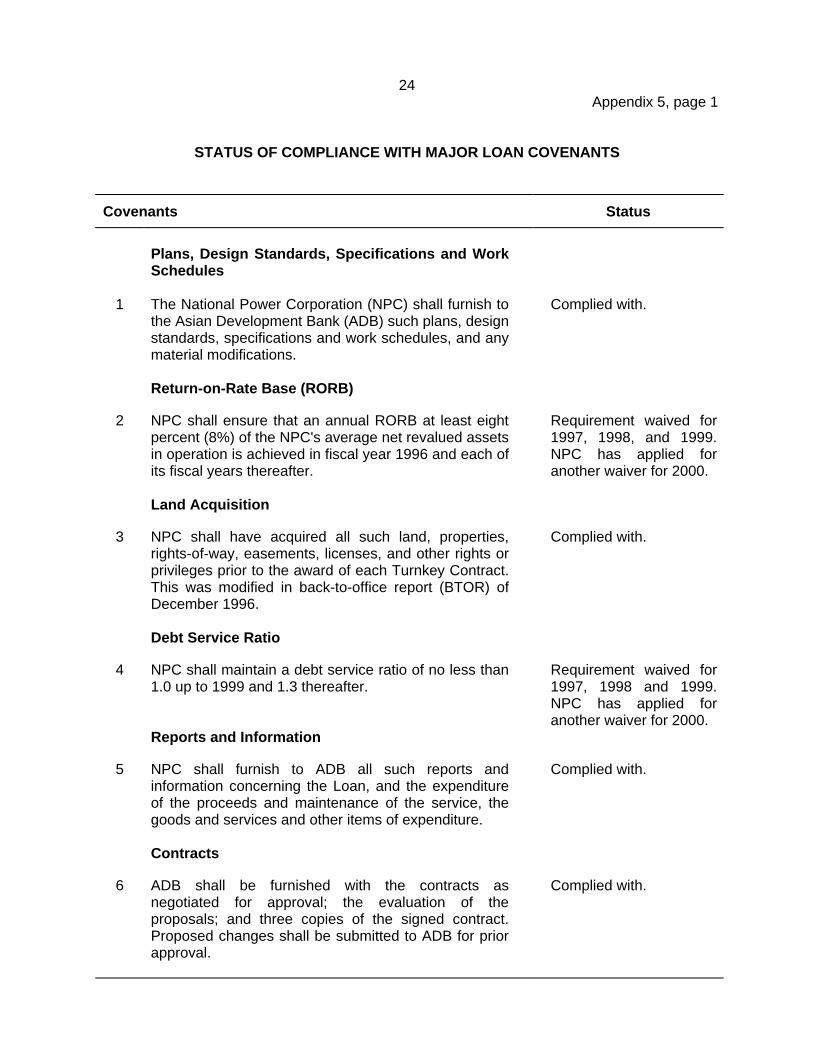
16. Appendix 5 gives the status of NPC’s compliance with the major covenants. The keyfinancial covenants agreed under the project were:
(i) A debt-service coverage ratio (DSCR) of at least 1.0 from 1995 to 1999 and notless than 1.3 thereafter; and
(ii) A return-on-rate base (RORB) of at least 8 percent in 1996 and thereafter. Loan1590-PHI subsequently modified the RORB requirement to 7 percent for 1998and 8 percent thereafter.
17. NPC regularly submitted quarterly progress reports and audited financial statementsthroughout project implementation. The quality of the reports is satisfactory. In accordance withSection 4.07 of the Loan Agreement, NPC’s accounts and financial statements have beenaudited annually by independent auditors. In particular, the auditors have provided their opinionon compliance with the loan covenants.5 Prior to 1997, energy sales increased at an averageannual rate of around 7-9 percent (Table 2). However, the financial crisis that affected the Asianregion starting in mid-1997 resulted in slower growth of energy sales. While the annual RORBfor 1996 was above the required 8 percent, it declined to 7.18 percent in 1997 and to2.22 percent in 2000. The debt service ratio was 1.56 in 1996, but fell below 1.0 from 1997 to2000.
4 NPC financed the construction supervision consulting services for both Stages I and II from its own funds.5 The audit report of 1999, the latest available audit report at the time of the PCR, stated that NPC did not achieve
the required 8 percent rate of return and that NPC’s internal cash generation was insufficient to meet DSCR of 1.3.

5
Table 2: NPC Financial Performance (1996 – 2000)
Indicators 1996 1997 1998 1999 2000
Sales (GWh) 33,381 36,442 37,321 36,987 37,320Sales Growth (%) 7.6 9.2 2.4 -0.9 0.9Average Rate (P/kWh) 1.96 2.15 2.58 2.65 3.12Operating Revenue (P million) 63,635 77,144 86,611 89,686 100,119Operating Expenditure (P million) 50,317 65,519 79,696 81,196 94,681Rate Base (P million) 161,536 161,808 215,053 251,989 243,805RORB (%) 8.24 7.18 3.22 3.37 2.22Debt-Service Coverage Ratio 1.56 0.98 0.92 0.92 0.70
GWh = gigawatt-hour, kWh = kilowatt-hour, RORB = return-on-rate base.
18. To address the problems facing the power sector, ADB is assisting the Government torestructure and privatize the electricity industry through the Power Sector RestructuringProgram (PSRP) Loan.6 NPC’s financial viability in the period prior to the power sector’srestructuring and NPC’s privatization has been a matter of concern. A number of measuresaimed at improving NPC’s income streams and cash flows, as well as addressing its high debtservice burden, were included in the PRSP. During late 1999, it became evident that NPC wouldbe unable to comply with either the RORB or debt-service ratio covenant in the aftermath of thefinancial crisis.
19. The major problems affecting NPC’s financial position were: (i) capacity surplus due tocompletion of high-priced independent power producer (IPP) contracts with take-or-payprovisions designated in foreign exchange that were entered into before the financial crisis;(ii) lower than expected levels of electricity sales; (iii) inadequate equity contributions from theGovernment; and (iv) increased debt service costs and IPP payments due to depreciation of thepeso. However, the generating capacity surplus would vanish once sales increased in themedium-term. The difference between IPP’s take-or-pay tariffs and a lower market-determinedtariff, which could prevail once competitive markets are introduced, would be treated as astranded cost which would be recovered from consumers. As NPC’s tariffs are already amongthe highest in the region, further tariff increases for RORB purposes may not be desirableconsidering the effect that this may have on the already lagging economic recovery.
20. The Government has formed a task force comprising representatives from theDepartment of Finance, NPC, and ADB to prepare an action plan to enable NPC to maintain areasonable financial position in the period prior to its privatization. One of the conditions for therelease of the second tranche of the PSRP Loan is for the Government to implement an actionplan to enable compliance with ADB financial covenants. In the recently enacted Electric PowerIndustry Reform Act, the Government has decided to assume a portion of the financialobligations of NPC in an amount not to exceed P200 billion. ADB is helping the Governmentdevelop a detailed financial model and identify necessary actions to enable NPC and itssuccessors to be financially sustainable in the future.
21. In November 1996, it became clear that NPC would be unable to meet the loan covenantregarding completion of land acquisition prior to the award of the turnkey contract forconstruction of substation and requested ADB to waive it. ADB and NPC subsequently
6 Loan 1162-PHI: Power Sector Restructuring Program, for $300 million, approved on 16 December 1998.
6
amended the Loan Agreement to require the Borrower to have acquired all land, properties,rights-of-way, etc., prior to completion of the substation equipment manufacture pursuant tosuch turnkey contracts (para. 11).
H. Disbursements
22. The loan was originally scheduled to be fully disbursed by 30 June 1999. However, theclosing date was extended to 30 June 2000 to give NPC sufficient time to negotiate finalpayments and evaluate claims for price variations. The loan account was closed on 4 October2000 after the final disbursement was made, and the balance of $18,320,987 was cancelled. Asummary of the loan disbursements is in Appendix 6.
I. Environmental and Social Impact
1. Environmental Matters
23. Substations. The environmental classification of the Labrador, San Manuel, and SanJose substations was Category B. As all the substations sites are in areas where ecology haslong been disrupted by human activities, the main environmental impact was related to theresettlement of affected people (para. 25) and the conversion of grassland to substations. Otherimpacts of the three substations were related to construction activities involving earth moving;construction of drainage, roads, buildings, and fencing; and installation of transformers, inrelation to which the contractors implemented mitigating measures. To reduce environmentalimpacts at the Labrador substation, the mango trees around the periphery have been retainedas green areas. Likewise, at the San Jose and San Manuel substations, NPC planted trees tominimize the impact of the humming noise generated by the high-voltage equipment. Overall,the impact was of a minimal nature and was managed adequately.
24. Masinloc Thermal Power Plant . The environmental classification of the construction ofthe Masinloc thermal power plant was Category A. The environmental impact assessment forStages I and II of the Project was prepared by NPC and was approved by the Department ofEnvironment and Natural Resources (DENR) in December 1992. The approval provided for(i) maximum limits on emissions of sulfur dioxide, nitrogen oxides, and suspended particulatematter (dust); (ii) maximum noise levels at selected locations; (iii) maintaining the quality ofgroundwater, marine water, and river water by monitoring specified parameters; (iv) establishinga buffer zone around the plant perimeter through tree planting; and (v) the use of low sulfur coal.It also required that the power plant’s stack height be increased from 120 meters (m) plannedduring feasibility study to 150 m. The loan for Stage I of the Masinloc thermal power plantproject was processed prior to the requirement for circulation of a summary environmentalimpact assessment, but such summary for Stage II was circulated in May 1995. According tothe latest monitored results, all environmental requirements have been met and all plantemissions are within the limits specified (Appendix 7). The technical support section of thepower plant is responsible for monitoring environmental aspects including air, water and waste,and continued compliance with requirements. NPC has initiated a regreening project andplanted 42,020 trees of different species (in addition to 8,109 existing trees upon landacquisition) around the power plant. A health impact assessment study indicated that there wereno adverse health effects on the people living around the plant.

7
2. Social Matters
25. Substations . This component affected the owners of 205 lots and 60.44 hectares ofland. NPC prepared a relocation plan in accordance with the Government policy and guidelines.ADB reviewed and approved the relocation plan for the ADB-funded components. Thecompensation package for the substation sites provided that (i) affected houses and buildingsbe replaced and paid for at their fair market replacement cost (costs of dismantling, transfer,and reconstruction based on the prevailing costs of construction materials and labor); (ii) treesand other crops be compensated for at fair market rates (using the municipal schedule ofvalues); (iii) land be compensated at prevailing market values (valued by city or provincialassessor’s office); (iv) disturbance compensation be paid equivalent to two months’ incomeequivalent to the minimum wage in the locality; (v) cash compensation be given to registeredtenants for cultivated land equivalent to one year’s gross harvest value; and (vi) each householdbe paid the cash equivalent of a residential lot.
26. Six lots of land had to be acquired for the Labrador substation, 30 for the San Manuelsubstation, and 169 for the San Jose substation. A summary of land acquisition and payment ofrelocation compensation is shown in Table 3.
Table 3: Summary of Project Land Acquisition as of April 2001
SubstationSite
ProjectAffected
Lots
Total Areato be
Acquired(hectares)
No. ofLots withSettledClaims
No. of LotsUnder
Process Comments
Labrador 6 32.03 5 1 Awaiting final decision oncompensation award case.
San Manuel 30 20.11 21 9 Awaiting final decision oncompensation award case.
San Jose 169 8.30 18 151 A court decision was madein January 2001 toincrease the price of theland to P1,900/sq m.Compromise agreementsare being negotiated with130 landowners (21 lotswith unaccounted-forlandowners).
Total 205 60.44 44 161
27. At the time of the PCR Mission, only 44 lots out of 205 have been paid for. Theremaining 161 were covered by compensation proceedings. Under this process, theconstruction work could begin while the Courts considered a fair level of compensation. Inparticular, 151 lots were under such process for the site of the San Jose substation. NPC hasmade a budget provision of P227.49 million for the compensation of the people affected (upfrom P97.3 million at the time of appraisal). However, due to the unsettled cases, disbursementat the time of the PCR Mission amounted to only P71.72 million. NPC has implemented a

8
resettlement action plan to complete all the compensations payments in accordance with courtdecisions.
28. Masinloc Thermal Power Plant . The PCR of Loan 1042-PHI provided a detailedanalysis of the social impacts of the Masinloc project. All persons who were displaced due toproject development were relocated with adequate compensation. A site inspection conductedduring the PCR Mission revealed that the resettlement site was generally well maintained. Inaccordance with ADB’s recommendation, a school (six classrooms, with canteen and teachers’office) has been built and opened for the 2000/01 school year. Two teachers and about120 pupils from grade 1 to grade 4 attend the school. NPC also appointed a community officerto liaise on a full-time basis with those relocated.
J. Performance of the Borrower and the Executing Agency
29. As the Borrower and the Executing Agency of the Project, NPC was responsible forproviding all funds and resources, in addition to those provided by ADB and other fundingagencies, to implement the Project in a timely manner. NPC’s performance during projectimplementation was generally satisfactory.
K. Performance of the Asian Development Bank
30. ADB’s administration of the Project was generally satisfactory. In addition to the formalreview missions, the proximity of ADB to NPC headquarters permitted continuous liaison whenmatters concerning procurement and land acquisition issues were needed to be addressed.ADB responded promptly to project implementation issues and provided policy guidance to NPCon resettlement.
III. TECHNICAL ASSISTANCE
A. Objectives and Scope
31. Technical Assistance (TA) was provided to the Government to assist with the formationof a transmission subsidiary of NPC. NPC was the Executing Agency for the TA. The TA’sscope included refining the organizational structure of the subsidiary, drafting detailed operatingprocedures, recommending technical interfaces with industry participants, preparing financialprojections and capital investment programs, assessing funding requirements andrecommending the needed debt/equity mix, and developing the regulatory structure in which thesubsidiary would operate. The total cost of the TA was estimated at $523,000 equivalent,comprising foreign costs of $498,000 and local currency costs of $25,000. ADB was to provide atotal of $500,000 representing the entire foreign exchange cost and $2,000 of the local costequivalent.
B. Evaluation of Inputs
32. A consulting firm from Singapore was engaged to provide the services. As per thecontract agreement, 13.5 person-months of international consultancy and 1.5 person-months oflocal consultancy were required to conduct the study. ADB provided the necessary support incoordinating the various activities. NPC was fully involved in all aspects of TA implementationand provided the required counterpart support, facilities, and information. The consultant teamwas generally knowledgeable and competent in its area of expertise and the fieldwork was
9
conducted satisfactorily. Overall, the performance of the consultant team is rated as good. TheTA was physically completed on 24 July 1998 at an actual cost of $482,406, of which ADBfinanced $461,191 equivalent. A comparison of the TA cost estimates and actual costs is shownin Table 4.
Table 4: Comparison of Estimated and Actual Technical Assistance Costs
Estimate ActualForeign Cost Local Cost Total Foreign Cost Local Cost Total
ADB 498,000 2,000 500,000 461,191 0 461,191Government 0 23,000 a 23,000 - 21,215a 21,215Total 498,000 25,000 523,000 461,191 21,215 482,406
a These are costs representing office accommodation and facilities, counterpart staff, administrative support andlocal transport, and other local support facilities.
C. Evaluation of Outputs
33. The TA agreement was signed on 27 November 1995, a notice to proceed was issuedon 10 February 1997, and the TA was scheduled for completion on 10 August 1997. Thebelated start-up was caused by delays in obtaining government approvals for amended terms ofreference needed to avoid overlap with other planned studies. The consultant submitted a draftfinal report on 4 September 1997, and a revised draft final report on 2 December 1997. Atripartite meeting to consider the latter was held on 25 February 1998, and additional work wasfound necessary to (i) update financial data to reflect the effects of the financial crisis, and(ii) take into consideration provisions contained in the Omnibus Power Bill then underpreparation by the House of Representatives Committee on Energy. A final report was issuedon 5 June 1998, and, following further discussions with ADB, a revised final report was issuedon 24 July 1998.
34. The TA report was prepared on the basis that the transmission company would be asubsidiary of NPC which was then the approach envisaged for the transmission facility.However, in the Electric Power Industry Reform Act approved on 8 June 2001, the transmissionfunction was vested in a separate government-owned National Transmission Corporation(TRANSCO). The TA is considered successful as it provided NPC and government personnelwith an understanding of the issues affecting the formation and operation of a transmissioncompany, the opportunities for creating a successful and viable commercial operation,organizational and staffing requirements, as well as a plan for achieving the corporateobjectives of the same. The TA report also advised that the Government’s plan for privatizationof the transmission entity was ambitious, and highlighted issues that needed to be resolved toenable it to be financially viable. These issues included the magnitude of the near-term capitalinvestment programs; legislative actions needed to dispose of subtransmission assets andhence significantly reduce the entity’s revenue streams; and the need for substantial increasesin transmission tariffs if these issues were not resolved.
35. The TA also dealt with the form of economic regulation that should be applied to thetransmission entity’s operations, and possible transitional arrangements from bundled tounbundled tariffs. The TA recommended that a price-capped performance-based regulatorysystem be adopted, and highlighted the need for capacity building for Energy Regulatory Boardstaff to enable them to effectively administer such a system. This analysis provided valuable

10
input to a subsequent TA on power sector regulatory practices required in a competitiveenvironment.7
IV. EVALUATION OF INITIAL PERFORMANCE AND BENEFITS
A. Technical Performance
1. Masinloc Thermal Power Plant
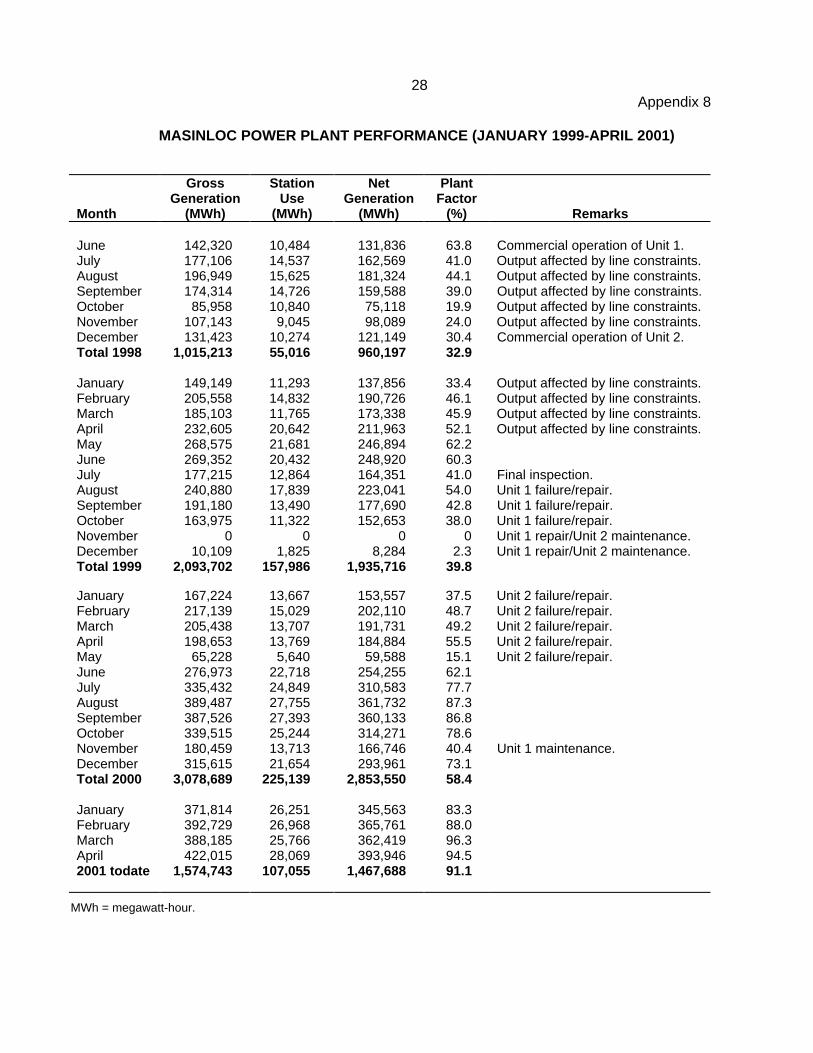
36. Unit 2 of the Masinloc thermal power plant was commissioned in December 1998 andsince then has been in commercial operation.8 Unit 2 generator tripped on 6 January 2000because two miniature circuit breakers, installed on the measuring/protection circuit wereopened unexpectedly with the result that the generator was operating without any regulation(loss of voltage reference) and any protection. As a consequence, the generator stator core andcoil were damaged. The Unit was shut down for repair for five months and restarted operationson 11 June 2000, one month ahead of the repair schedule. NPC has since reinforced stafftraining with the contractor to ensure strict compliance with the operational procedure to avoidsimilar incidents in the future. However, NPC is experiencing shortages of some key spare partsfor the power plant because the types of spare parts supplied under the contract wereinappropriate. Statistics on monthly energy generation of the plant since 1999 are given inAppendix 8, which shows that the plant’s performance was initially affected by the delay in thecompletion of the transmission lines and substations. Since they were commissioned, theplant’s performance has been steadily improving, with the average plant factor increasing from32.9 percent in 1998, 39.8 percent in 1999, and 58.4 percent in 2000 to 91.1 percent for the firstfour months of 2001.
2. Substations
37. The technical performance since commissioning of the Labrador and San Manuelsubstations constructed under the Project is highly satisfactory. However, the San Josesubstation experienced two incidents in 2000 that caused blackouts in parts of the Luzon grid.Unlike the conventional Labrador and San Manuel substations, San Jose is a gas insulatedsubstation (GIS), introduced for the first time in the NPC system. San Jose GIS includes one 90-megavolt-ampere reactive (MVAR) power shunt reactor for each of the two circuits and a spareone in case either of the two fails. Two of the three shunt reactors failed first in April and againin October 2000. Both shunt reactors have been sent to France to be repaired by thecontractor.9 According to the work schedule, the first shunt reactor is expected to be reinstalledin October 2001 and the second one by January 2002. Only one of the two 500 kV transmissionline circuits between San Manuel and San Jose is being operated using the spare shunt reactor.The other 500 kV line is being operated without the shunt reactor under special operationalprocedures. Therefore, notwithstanding substation failure, the transmission of the output of theMasinloc and Sual power plants has not been affected. As the reasons for the failure have notbeen clearly identified, the operation of the one remaining 500 kV circuit is at high risk. The
7 TA 3126-PHI: Electricity Pricing and Regulatory Practice in a Competitive Environment, for $600,000, approved on
16 December 1998.8 Unit 1 was commissioned in June 1998. In August 1999, it suffered damage to some parts of the heaters,
condenser, boiler and turbine. It was shut down for four months for repair works and restarted for normaloperations in January 1999.
9 The first shunt reactor is being repaired at contractor’s cost because the incident occurred within the warrantyperiod. The contractor has quoted Euro1.0 million for the repair of the second shunt reactor.

11
substation managers and operators have not received the comprehensive technical trainingrequired to ensure smooth operations and maintenance (O&M) of these highly computerizedmodern substations. NPC has prepared a contingency plan if the spare shunt reactor fails,and this entails operating both circuits of the 500 kV transmission line between Labrador andSan Jose at 230 kV by bypassing the GIS substation. If a fault occurs, the change-over from500 kV to 230 kV, however, is not automatic, and the power supply may be disrupted for severalhours.
B. Financial Performance
1. Masinloc Thermal Power Plant
38. The Masinloc thermal power plant was built in two stages, financed by ADB Loan 1042-PHI and Loan 1398-PHI, respectively. A financial analysis of stages I and II of the Masinlocpower plant was undertaken at project appraisal (taking account of a portion of capital costs forthe transmission network needed to link into the Luzon grid and substations, since the Masinlocpower plant cannot dispose its output without the associated transmission network). Its financialinternal rate of return (FIRR) was estimated at 22.7 percent at appraisal. In order to assess theactual financial performance of the power plant, the FIRR has been reassessed on the basis of(i) a project life of 30 years; (ii) actual total project costs of $782.83 million, which include thecosts of (a) both stages of the Masinloc coal-fired plant (600 MW), (b) 100 percent of theMasinloc-to-Labrador dedicated transmission line, (c) 33 percent of the cost of the Labrador-to-San Jose transmission line, and (d) 33 percent of the cost for substations; (iii) annual O&Mcosts of P0.14/kWh for the Masinloc power plant and 2 percent of capital costs for thetransmission lines and substations; (iv) fuel costs of P0.60/kWh for gross generation; (v) annualsales of 3,694 GWh to the Luzon grid based on 3,942 GWh of generation with 6.3 percent ofNPC system losses; and (vi) an average tariff for NPC to the Luzon Grid of P2.34/kWh in 1998and P2.89/kWh in 1999 and subsequently. Based on these assumptions, the project FIRR isrecalculated at 22.96 percent, which compares to a weighted average cost of capital of9.74 percent (in real terms as provided by NPC), and is therefore considered satisfactory. Thedetailed analysis is shown in Appendix 9.
39. Since the fuel and spare parts of the Masinloc power plant are imported, the sensitivityanalysis took account of annual average devaluation in the foreign exchange rate of 8.4 percentper annum from 1998 to 2001 after the financial crisis. It showed that the FIRR would decreaseto (i) 22.19 percent if the project experienced a cost overrun of 10 percent for fuel costsincluding imported coal, fuel oil, and chemicals and O&M costs; (ii) 20.23 percent if the benefitswere reduced by 10 percent; and (iii) 19.42 percent if both (i) and (ii) happened. Appendix 9 alsoshows the comparisons of costs, generation and sales volumes, revenues, and net cash flowestimated at appraisal and actually achieved from 1994 to 2000. The capital costs saving isattributed both to intense competition among power transmission contractors, which drove costsdown to a level way below estimate, and to depreciation of the local currency over the projectconstruction period (para. 8). The decrease in the project’s generation and sales volume, whichaffected sales revenues, is attributed to lower than expected electricity demand (para. 19) aswell as delay in the completion of the associated transmission lines.

12
2. Overall Project Performance
40. The Project includes the Masinloc power plant as well as the associated transmissionlines and substations for both Masinloc and Sual10 power plants. At the time of project appraisal,a time-slice analysis was undertaken for the Project and the FIRR was estimated at17.2 percent. As more detailed data are available at project completion, a specific financialanalysis has been undertaken of Stages I and II of the Masinloc project, as well as the totaltransmission network needed to link into the Luzon grid and substations, including incrementalrevenue from Sual coal-fired thermal power plant. Capital expenditure, for the purpose of thefinancial analysis, consists of (i) 100 percent of the 230 kV transmission line from Masinloc toLabrador, (ii) 100 percent of the 230 kV transmission line from Sual to Labrador, (iii) 100 percentof the 500 kV transmission line from Labrador to San Manuel, (iv) 100 percent of the 500 kVtransmission line from San Manuel to San Jose, (v) the 230/500 kV substation at Labrador andSan Manuel, (vi) expanding the 230 kV substation at San Jose, and (vii) upgrading the 230 kVstation at San Jose to 500 kV operation. The FIRR of the Project has been calculated at14.56 percent based on (i) NPC operating costs including O&M costs and fuel costs as specifiedabove, and NPC’s purchase costs of P2.96/kWh as specified in the power purchase agreement;(ii) net sales of 7,976 GWh to the Luzon Grid based on 3,694 GWh of Masinloc net generationand 4,818 GWh of Sual energy sales with 6.3 percent of NPC system losses; and (iii) anaverage tariff for NPC to the Luzon Grid of P2.34/kWh in 1998 and P2.89/kWh in 1999 andsubsequently. The sensitivity analysis took account of annual average devaluation in the foreignexchange rate of 8.4 percent per annum from 1998 to 2001. It showed that the FIRR woulddecrease to (i) 9.98 percent if the Project experienced a cost overrun of 10 percent for fuel costsincluding imported coal, fuel oil, chemicals, and O&M costs; (ii) 8.29 percent if the benefits werereduced by 10 percent; and (iii) 1.82 percent if both (i) and (ii) happened. As the Project’sfinancial performance becomes fairly fragile under unfavorable conditions, NPC and itssuccessor should take adequate measures to contain the operational costs and maximizerevenues to ensure the sustainability of the Project. As a response, NPC has introduced theOne-Day Ahead Power Sales System, the Economic Recovery Assistance System for PowerIntensive and Distressed Industries, and the Dump Power Rates System in Mindanao to utilizesurplus generation capacity. A detailed financial analysis is given in Appendix 10.
C. Economic Performance
1. Masinloc Thermal Power Plant
41. The economic internal rate of return (EIRR) of the Masinloc power plant was estimatedat 28.2 percent at project appraisal. To evaluate the actual economic performance of theproject, its costs and benefits have been reassessed based on updated information. These havebeen adjusted by using the world price numeraire to reflect economic opportunities foregoneand realized because of the Project. The economic analysis has been undertaken based on (i) astandard conversion factor of 0.82 applied to nontraded components to arrive at their borderprices; and (ii) an incremental Project output represented by sales benefits valued at anestimated willingness to pay of P4.26/kWh based on the average of the opportunity cost ofP4.43/kWh and the average consumer tariff for Luzon of P4.10/kWh. The opportunity cost isvalued at the sum of the average consumer tariff for Luzon and a resource saving ofP0.33/kWh. The resource cost savings were estimated based on the cost of operating of privategenerator sets that would be required in the absence of the Project. The distribution losses are
10 Sual coal-fired thermal power plant is a build-operate-transfer (BOT) project (2 x 500 MW), owned by Consolidated
Electric Power Asia Ltd., a subsidiary of Hopewell Holdings, Ltd. NPC is to install associated transmission lines thatwill enable it to receive contracted capacity from Sual power plant. The plant was commissioned in October 1999.

13
assumed to be constant at 10.7 percent. Distribution costs for Meralco and other distributioncooperatives are estimated at P0.46/kWh. As shown in Appendix 11, the EIRR for the project isrecalculated at 29.55 percent, which compares favorably with the opportunity costs of capital of12.0 percent. The sensitivity analysis took account of annual average devaluation in the foreignexchange rate of 8.4 percent per annum from 1998 to 2001 after the financial crisis. It showedthat the EIRR would decrease to (i) 28.62 percent if the project experienced a cost overrun of10 percent for the fuel and O&M costs, (ii) 26.20 percent if the benefits were reduced by10 percent, and (iii) 25.58 percent if both (i) and (ii) happened.
2. Overall Project Performance
42. At the time of Project appraisal, a time-slice analysis was undertaken and the EIRR wasestimated at 21.0 percent. As more detailed data are available at project completion, theProject’s EIRR has been assessed based on (i) the world price used as the numeraire; (ii) astandard conversion factor of 0.82 applied to nontraded components to arrive at their borderprices; and (iii) incremental subproject output represented by sales benefits valued atwillingness to pay of P4.26/kWh. which is estimated on the basis of the average of theopportunity cost of P4.43/kWh and the average consumer tariff for Luzon of P4.10/kWh. Theopportunity cost is valued at the sum of the average consumer tariff for Luzon and a resourcecost saving of P0.33/kWh. The distribution losses are assumed to be constant at 10.7 percent.Distribution costs for Meralco and other distribution cooperatives are estimated at P0.46/kWh.As shown in Appendix 12, the EIRR for the project is estimated at 29.76 percent, whichcompares favorably with the cut off EIRR at 12.0 percent. The sensitivity analysis took accountof annual average devaluation in the foreign exchange rate of 8.4 percent per annum from 1998to 2001 after the financial crisis. It showed that the EIRR would decrease to (i) 26.60 percent ifthe Project experienced a cost overrun of 10 percent for the fuel and O&M costs,(ii) 24.06 percent if the benefits were reduced by 10 percent, and (iii) 20.47 percent if both (i)and (ii) happened.
D. Attainment of Benefits
43. The Project successfully installed the transmission network necessary to feed the outputfrom the Masinloc and Sual power plants into the Luzon grid. In fact, the construction of theseplants, the northern Luzon 500 kV substations and transmission lines represent the mostreliable and economic solution to handle bulk power transmission in the grid. By the time theProject was commissioned in 1999, there was surplus generating capacity due to the slowdownin economic growth and the large number of IPPs operating in Luzon. At appraisal, NPC'selectricity sales were projected to grow at 9 percent annually from 1995 to 1997 and 5.5 percentannually from 1998 to 2000. NPC's actual sales increased at an average annual rate of8.1 percent during 1995-1997 and only about 0.5 percent during 1998-2000 due to the effect ofthe financial crisis. Thus, the Project’s benefits will be fully realized only when economic growthand corresponding power demand recover. Specifically, the Project attained the followingbenefits:
(i) it transmitted power from two major generation plants, the 2x300 MW Masinlocand 2x500 MW Sual coal-fired power plants in Zambales and Pangasinan to theLuzon grid;
(ii) it relieved overloaded substations and extended extra high-voltage grid inNorthwestern Luzon;

14
(iii) it strengthened the transmission system and the load dispatch operation tosupport the creation of an autonomous transmission company; and
(iv) it facilitated optimal development of indigenous hydropower and geothermalresources for future power development.
44. The revaluation of NPC operating assets undertaken under Part D - Institutional Supportwas successfully completed in November 1998. The exercise achieved its objective ofdetermining the fair market value of NPC power station/generation and transmission assetswhich would form the basis of the transfer of assets in the context of NPC’s privatization. Withthe enactment of the Electric Power Industry Reform Act on 8 June 2001, the government-owned Power Sector Assets and Liabilities Management Corporation has been created to takeownership of all existing NPC generation assets, liabilities, IPP contracts, real estate and allother disposable assets. The privitization of these assets is in progress with the objective to sellat least seventy percent of the assets located in Luzon and Visayas within three years from theeffectivity of the Act. Meanwhile, TRANSCO has been established to take ownership of NPC’stransmission assets and assume the electrical transmission function of NPC.
V. CONCLUSIONS AND RECOMMENDATIONS
A. Conclusions
45. The Project has contributed to the least-cost development of NPC’s generation andtransmission program for Luzon. As such the Project has substantially achieved the objectivesenvisaged at appraisal. It has also enhanced the efficiency and reliability of system operations.Overall, the Project is rated successful on the basis of its performance in the areas of relevance,efficacy, efficiency, sustainability and institutional development (Appendix 13).
B. Lessons Learned
46. Loan covenant concerning land acquisition should be set realistically to require theBorrower to have acquired all land, properties, rights of way, etc. prior to the completion of thesubstation equipment manufacture.
47. In view of the technical problems experienced in the operations of the Project, the tenderdocuments should clearly specify the types of spare parts to be supplied by the contractor andthe necessary training to be provided by the contractor to ensure the sustainability of theProject. If the equipment breaks down during the warranty period, the contractor must producespare materials and equipment to replace the damaged equipment or parts in a timely manner.
C. Recommendations
48. The Project-related recommendations are as follows:
(i) Future Monitoring . The operations of the 500 kV transmission network inNorthwestern Luzon require close monitoring because only one circuit is innormal operation using the spare shunt reactor in the San Jose substation.Although a contingency plan has been put in place, NPC has to follow up closelywith the contractor to ensure the completion of repairs to the two damaged shuntreactors by January 2002 and take the necessary preventive actions.
15
(ii) Covenants . As NPC is in the process of being restructured and privatizedfollowing the passage of the Electric Power Industry Reform Act, ADB shouldcontinue its policy dialogue with the Government and closely review the financialviability of NPC and its successors.
(iii) Follow-Up Action . ADB should continue to follow up with NPC to ensure that thefinal settlements of the compensation packages to the people affected have beenpaid. NPC should be required to report regularly on the progress of thecompensation proceedings in the Courts and payments made.
(iv) Future Assistance . Should ADB make any future loans to NPC or itssuccessors involving new technology (e.g., the GIS substation in this project),ADB should strengthen their institutional and technical capacities in managingsuch technology.
(v) Timing of Project Performance Audit Report (PPAR) Preparation . It isrecommended that the PPAR be undertaken in 2003 after the two shunt reactorshave been reinstalled for normal operations and the economy will haverecovered from the economic crisis.

16
APPENDIXES
Cited onNumber Title Page (page, para.)
1 Chronology of Events 17 1, 4
2 Utilization of Y12 Billion Bonds 19 3, 9
3 Implementation Schedule (Appraisal and Actual) 20 3, 10
4 Summary of ADB-Financed Contracts 23 3, 12
5 Status of Compliance with Major Loan Covenants 24 4, 16
6 Actual Disbursements 26 6, 22
7 Masinloc Thermal Power Plant: Ambient Air QualityMonitoring 27 7, 24
8 Masinloc Power Plant Performance (January 1999-April 2001) 28 10, 36
9 Financial Internal Rate of Return –Masinloc Thermal Power Plant 29 11, 38
10 Financial Internal Rate of Return –Northern Luzon Transmission and Generation Project 31 12, 40
11 Economic Internal Rate of Return –Masinloc Thermal Power Plant 32 13, 41
12 Economic Internal Rate of Return –Northern Luzon Transmission and Generation Project 33 13, 42
13 Project Performance Rating 34 14, 45
17Appendix 1, page 1
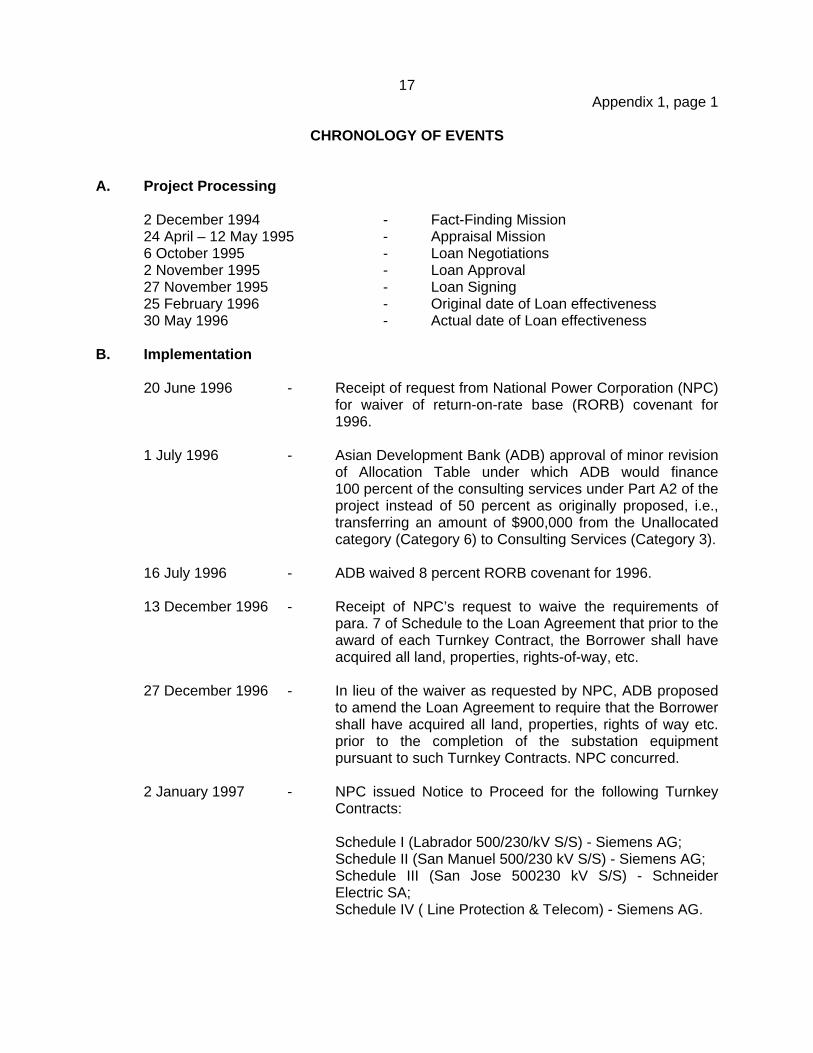
CHRONOLOGY OF EVENTS
A. Project Processing
2 December 1994 - Fact-Finding Mission24 April – 12 May 1995 - Appraisal Mission6 October 1995 - Loan Negotiations2 November 1995 - Loan Approval27 November 1995 - Loan Signing25 February 1996 - Original date of Loan effectiveness30 May 1996 - Actual date of Loan effectiveness
B. Implementation
20 June 1996 - Receipt of request from National Power Corporation (NPC)for waiver of return-on-rate base (RORB) covenant for1996.
1 July 1996 - Asian Development Bank (ADB) approval of minor revisionof Allocation Table under which ADB would finance100 percent of the consulting services under Part A2 of theproject instead of 50 percent as originally proposed, i.e.,transferring an amount of $900,000 from the Unallocatedcategory (Category 6) to Consulting Services (Category 3).
16 July 1996 - ADB waived 8 percent RORB covenant for 1996.
13 December 1996 - Receipt of NPC’s request to waive the requirements ofpara. 7 of Schedule to the Loan Agreement that prior to theaward of each Turnkey Contract, the Borrower shall haveacquired all land, properties, rights-of-way, etc.
27 December 1996 - In lieu of the waiver as requested by NPC, ADB proposedto amend the Loan Agreement to require that the Borrowershall have acquired all land, properties, rights of way etc.prior to the completion of the substation equipmentpursuant to such Turnkey Contracts. NPC concurred.
2 January 1997 - NPC issued Notice to Proceed for the following TurnkeyContracts:
Schedule I (Labrador 500/230/kV S/S) - Siemens AG;Schedule II (San Manuel 500/230 kV S/S) - Siemens AG;Schedule III (San Jose 500230 kV S/S) - SchneiderElectric SA;Schedule IV ( Line Protection & Telecom) - Siemens AG.

18Appendix 1, page 2
22 July 1997 - Receipt of NPC’s request for financing its Load and MarketResearch Study under Part D of the Project.
7 August 1997 - Receipt of request from NPC for partial cancellation of$80 million ($40 million from ADB and $40 million from theExport-Import Bank of Japan).
12 August 1997 - ADB approval of a minor change in scope to include Loadand Market Research Study under Part D of the Projectusing loan savings. However, the study was discontinuedin line with NPC’s policy of cost -cutting amid the Asianfinancial crisis.
8 October 1997 - ADB approval of cancellation of $40.0 million of loansavings and as such Category 1 of the loan was reducedby $40 million to $62,450,000.
8 June 1999 - Receipt of request from NPC for extension of loan closingdate from 30 June 1999 to 30 June 2000.
21 June 1999 - ADB approval of Contract Variation for an increase ofDM40,795 and a decrease of £5,247 for the ConsultingServices (Lahmeyer/Merz & Mclellan, Loan Category 3).No adjustment was made to Loan Category 3 as theallocation was only exceeded by $1,042 at the prevailingexchange rates.
2 July 1999 - ADB approval of loan closing date from 30 June 1999 to30 June 2000.
10 November 1999 - ADB approval of second partial cancellation of $24 million.
4 October 2000 - ADB approved cancellation of the undisbursed balance of$18,320,987.
18 December 2000 - Receipt from NPC of the Borrower’s project completionreport.

19Appendix 2
UTILIZATION Y12 BILLION BONDS
Proceeds of Y12 Billion Bond Issue
Credited to National Power Corporation Account withBangko Sentral ng Pilipinas (11 December 1995)
Y11,910,000,000
Utilization:
Masinloc I Downpayment Y24,036,511
Northwestern Luzon Transmission ContractsUnfunded Foreign Portion Y1,562,229,920Local Portion Y3,779,768,719
Interest and Commitment Charges during Construction Y6,543,964,850

Activities J F M A M J J A S O N D J F M A M J J A S O N D J F M A M J J A S O N D J F M A M J J A S O N D J F M A M J J A S O N D J F M A M J J A S O N D
Package 1 (Turnkey) Masinloc - Labrador, 230 kV
1. Tender Preparation
2. Tendering/Bid Opening
3. Evaluation/Award
4. Construction/Erection
Package 2 (Turnkey) Sual - Labrador, 230 kV
1. Tender Preparation
2. Prequalification
3. Tendering/Bid Opening
4. Evaluation/Award
5. Construction/Erection
Package 3 (Turnkey) Labrador - San Manuel, 500 kV
1. Tender Preparation
2. Prequalification
3. Tendering/Bid Opening
4. Evaluation/Award
5. Construction/Erection
IMPLEMENTATION SCHEDULE (APPRAISAL AND ACTUAL )
1998 19991994 1995 1996 1997
Appendix 3, page 1
20

Activities J F M A M J J A S O N D J F M A M J J A S O N D J F M A M J J A S O N D J F M A M J J A S O N D J F M A M J J A S O N D J F M A M J J A S O N D1998 19991994 1995 1996 1997
Package 4 (Turnkey) San Manuel- San Jose, 500 kV
1. Tender Preparation
2. Prequalification
3. Tendering/Bid Opening
4. Evaluation/Award
5. Construction/Erection
Package 5 (Turnkey) Labrador, 500/230 kV
1. Tender Preparation
2. Prequalification
3. Tendering/Bid Opening
4. Evaluation/Award
5. Construction/Erection
Package 6 (Turnkey) San Manuel, 500/230 kV
1. Tender Preparation
2. Prequalification
3. Tendering/Bid Opening
4. Evaluation/Award
5. Construction/Erection
Appendix 3, page 2
21

Activities J F M A M J J A S O N D J F M A M J J A S O N D J F M A M J J A S O N D J F M A M J J A S O N D J F M A M J J A S O N D J F M A M J J A S O N D1998 19991994 1995 1996 1997
Package 7 (Turnkey) San Jose, 500/230 kV
1. Tender Preparation
2. Prequalification
3. Tendering/Bid Opening
4. Evaluation/Award
5. Construction/Erection
Package 8 (Turnkey) Communication Systems
1. Tender Preparation
2. Prequalification
3. Tendering/Bid Opening
4. Evaluation/Award
5. Construction/Erection
Masinloc Stage II
1. Acceptance of Option
2. Effectiveness of Contract
3. Construction/Erection
4. Commissionning/Testing
AppraisalActiual
Appendix 3, page 3
22

ADB'sContract No./ Description/ Country of Contract US Dollar Mode of ApprovalPCSS No. Contractor Procurement Amount (FC) Equivalent Procurement of Award
SP90DLS-969/ Engineering, Supply, Construction, Japan ¥ 4,646,283,640 69,324,276 ICB 30-Mar-950001 Testing and Commissioning of $ 7,547,554 8,397,950
Masinloc II (Turnkey)/Mitsubishi
SP95NLEHV.LES-53/ Supply of Labrador substation Germany DM 26,893,321 14,931,945 ICB 30-Oct-960002 Equipment/Siemens
SP95NLEHV.LES-53 Supply of San Manuel substation Germany DM 14,825,095 8,219,663 ICB 30-Oct-96Schedule II/ Equipment/Siemens0003
SP95NLEHV.LES-53 Supply of San Jose substation France FF 177,121,131 29,782,734 ICB 30-Oct-96Schedule III/ Equipment/Schneider Electric0004
SP95NLEHV.LES-53 Protection and Telecommunication Sytems Germany DM 5,898,501 3,288,530 ICB 30-Oct-96Schedule IV/ for Schedules 1, 2, and 3/Siemens0005
SP96.BCMD-12/ Project Implementation Consultancy Services Germany 2,213,143 1,247,281 ICB 12-Jul-960006 Lahmeyer International/Merz & McMillan £ 290,535 480,437
- Consultancy - 1996 Asset Revaluation United States $ 706,196 706,196 ICB 10-Apr-970007 Resource Management International
ADB = Asian Development Bank, DM = Deutsch Mark, FC = foreign currency, FF = French Franc, ICB = international competitive bidding, PCSS = Procurement ContractSummary Sheet.
SUMMARY OF ADB-FINAN CED CONTRACTSA
ppendix 423
Appendix 5, page 124
STATUS OF COMPLIANCE WITH MAJOR LOAN COVENANTS
Covenants Status
Plans, Design Standards, Specifications and WorkSchedules
1 The National Power Corporation (NPC) shall furnish tothe Asian Development Bank (ADB) such plans, designstandards, specifications and work schedules, and anymaterial modifications.
Complied with.
Return-on-Rate Base (RORB)
2 NPC shall ensure that an annual RORB at least eightpercent (8%) of the NPC's average net revalued assetsin operation is achieved in fiscal year 1996 and each ofits fiscal years thereafter.
Requirement waived for1997, 1998, and 1999.NPC has applied foranother waiver for 2000.
Land Acquisition
3 NPC shall have acquired all such land, properties,rights-of-way, easements, licenses, and other rights orprivileges prior to the award of each Turnkey Contract.This was modified in back-to-office report (BTOR) ofDecember 1996.
Complied with.
Debt Service Ratio
4 NPC shall maintain a debt service ratio of no less than1.0 up to 1999 and 1.3 thereafter.
Requirement waived for1997, 1998 and 1999.NPC has applied foranother waiver for 2000.
Reports and Information
5 NPC shall furnish to ADB all such reports andinformation concerning the Loan, and the expenditureof the proceeds and maintenance of the service, thegoods and services and other items of expenditure.
Complied with.
Contracts
6 ADB shall be furnished with the contracts asnegotiated for approval; the evaluation of theproposals; and three copies of the signed contract.Proposed changes shall be submitted to ADB for priorapproval.
Complied with.

Appendix 5, page 225
Covenants Status
Resettlement
7 NPC shall complete a review of its corporate policiesand guidelines for resettlement in connection withtransmission line and substation projects on or before30 June 1996, and shall provide ADB with copies ofthe report on such review and any revisions in itscorporate policies and guidelines.
Complied with.
Environmental Monitoring
8 NPC shall ensure that the Project is designed andimplemented and the Project facilities are operated andmaintained in conformity with: ADB's EnvironmentalGuidelines for Selected Industrial and PowerDevelopment Projects; and the conditions andrestrictions included in the Environmental ClearanceCertificates issued by the Environment Bureau withinthe Department of Environment and NaturalResources.
Complied with.
Tariff restructuring
9 NPC shall submit, as soon as possible, to theGuarantor's Energy Regulatory Board (ERB) a newtariff structure to be implemented on or before 31December 1996.
Complied with.
Quarterly Reports/Financial Model
10 NPC shall furnish to ADB quarterly reports on theexecution of the Project and on the operation andmanagement of the Project facilities, and reportsconcerning its restructuring and privatization program.It shall also develop a financial model stimulating theeffect of overall corporate profitability of variousprivatization options.
Complied with.

Year Quarter
1996 3rd 16.135 16.135 4th 6.380 22.515 22.515
1997 1st 14.406 36.921 2nd 4.218 41.139 3rd 33.576 74.715 4th 3.371 78.086 55.571
1998 1st 22.461 100.547 2nd 14.815 115.362 3rd 9.692 125.054 4th 2.001 127.055 48.969
1999 1st 8.101 135.156 2nd 0.525 135.681 3rd 4.593 140.274 4th 1.856 142.130 15.075
2000 1st 14.672 156.802 2nd 0.061 156.863 3rd 3.976 160.839 4th 0.840 161.679 19.549
Amounts Cumulative Annual
26Appendix 6
ACTUAL DISBURSEMENTS($ million)

MASINLOC COAL THERMAL POWER PLANT: AMBIENT AIR QUALITY MONITORING
Time of SO 2 Concentration NO 2 Concentration Suspended Particulate MatterSamplingStation
Sampling Measured DENR Limit Measured DENR Limit Measured DENR Limit
1. Candelariaa 1440H – 1540H 11.56 ug/Ncm 340 ug/Ncm 4.05 ug/Ncm 260 ug/Ncm 62.02 ug/Ncm 300 ug/Ncm1547H – 1647H 11.11 ug/Ncm 340 ug/Ncm 4.05 ug/Ncm 260 ug/Ncm 17.37 ug/Ncm 300 ug/Ncm
2. Palauiga 1540H – 1640H 15.98 ug/Ncm 340 ug/Ncm 3.33 ug/Ncm 260 ug/Ncm 40.44 ug/Ncm 300 ug/Ncm1643H – 1743H 11.67 ug/Ncm 340 ug/Ncm 3.54 ug/Ncm 260 ug/Ncm 111.81 ug/Ncm 300 ug/Ncm
3. Poblacionb 0000H – 2300H 0.79 ppb 130 ppb 3.62 ppb 140 ppb 67.76 ug/Ncm 200 ug/Ncm
4. ResettlementSiteb 1800H – 2300H 1.40 ppb 130 ppb 3.24 ppb 140 ppb 76.31 ppb 200 ug/Ncm
DENR = Department of Environment and Natural Resources, Ncm = normal cubic meter, NO2 = nitrogen dioxide, ppb = parts per billion, SO2 = sulfur dioxide.a Second quarter 2001 Multipartite Monitoring.b First quarter 2001 Multipartite Monitoring.
Appendix 7
27
28Appendix 8
MASINLOC POWER PLANT PERFORMANCE (JANUARY 1999-APRIL 2001)
Month
GrossGeneration
(MWh)
StationUse
(MWh)
NetGeneration
(MWh)
PlantFactor
(%) Remarks
June 142,320 10,484 131,836 63.8 Commercial operation of Unit 1.July 177,106 14,537 162,569 41.0 Output affected by line constraints.August 196,949 15,625 181,324 44.1 Output affected by line constraints.September 174,314 14,726 159,588 39.0 Output affected by line constraints.October 85,958 10,840 75,118 19.9 Output affected by line constraints.November 107,143 9,045 98,089 24.0 Output affected by line constraints.December 131,423 10,274 121,149 30.4 Commercial operation of Unit 2.Total 1998 1,015,213 55,016 960,197 32.9
January 149,149 11,293 137,856 33.4 Output affected by line constraints.February 205,558 14,832 190,726 46.1 Output affected by line constraints.March 185,103 11,765 173,338 45.9 Output affected by line constraints.April 232,605 20,642 211,963 52.1 Output affected by line constraints.May 268,575 21,681 246,894 62.2June 269,352 20,432 248,920 60.3July 177,215 12,864 164,351 41.0 Final inspection.August 240,880 17,839 223,041 54.0 Unit 1 failure/repair.September 191,180 13,490 177,690 42.8 Unit 1 failure/repair.October 163,975 11,322 152,653 38.0 Unit 1 failure/repair.November 0 0 0 0 Unit 1 repair/Unit 2 maintenance.December 10,109 1,825 8,284 2.3 Unit 1 repair/Unit 2 maintenance.Total 1999 2,093,702 157,986 1,935,716 39.8
January 167,224 13,667 153,557 37.5 Unit 2 failure/repair.February 217,139 15,029 202,110 48.7 Unit 2 failure/repair.March 205,438 13,707 191,731 49.2 Unit 2 failure/repair.April 198,653 13,769 184,884 55.5 Unit 2 failure/repair.May 65,228 5,640 59,588 15.1 Unit 2 failure/repair.June 276,973 22,718 254,255 62.1July 335,432 24,849 310,583 77.7August 389,487 27,755 361,732 87.3September 387,526 27,393 360,133 86.8October 339,515 25,244 314,271 78.6November 180,459 13,713 166,746 40.4 Unit 1 maintenance.December 315,615 21,654 293,961 73.1Total 2000 3,078,689 225,139 2,853,550 58.4
January 371,814 26,251 345,563 83.3February 392,729 26,968 365,761 88.0March 388,185 25,766 362,419 96.3April 422,015 28,069 393,946 94.52001 todate 1,574,743 107,055 1,467,688 91.1
MWh = megawatt-hour.
Year Capital Costs
1994 1,714.00 1,714.00 -1,714.001995 353.00 353.00 -353.001996 2,673.80 292.18 171.74 3,137.72 -3,137.721997 7,639.59 809.17 475.63 8,924.38 -8,924.381998 6,617.97 991.74 582.95 856.22 267.01 9,315.89 1,422.30 1,332.70 3,118.51 -6,197.391999 1,245.91 283.55 166.67 1,260.41 370.68 3,327.22 2,093.70 1,961.80 5,669.59 2,342.382000 1,313.82 406.29 238.82 1,853.37 522.47 4,334.77 3,078.69 2,884.73 8,336.88 4,002.102001 2,373.08 644.20 3,017.28 3,942.00 3,693.65 10,674.66 7,657.382002 2,373.08 644.20 3,017.28 3,942.00 3,693.65 10,674.66 7,657.382003 2,373.08 644.20 3,017.28 3,942.00 3,693.65 10,674.66 7,657.382004 2,373.08 644.20 3,017.28 3,942.00 3,693.65 10,674.66 7,657.382005 2,373.08 644.20 3,017.28 3,942.00 3,693.65 10,674.66 7,657.382006 2,373.08 644.20 3,017.28 3,942.00 3,693.65 10,674.66 7,657.382007 2,373.08 644.20 3,017.28 3,942.00 3,693.65 10,674.66 7,657.382008 2,373.08 644.20 3,017.28 3,942.00 3,693.65 10,674.66 7,657.382009 2,373.08 644.20 3,017.28 3,942.00 3,693.65 10,674.66 7,657.382010 2,373.08 644.20 3,017.28 3,942.00 3,693.65 10,674.66 7,657.382011 2,373.08 644.20 3,017.28 3,942.00 3,693.65 10,674.66 7,657.382012 2,373.08 644.20 3,017.28 3,942.00 3,693.65 10,674.66 7,657.382013 2,373.08 644.20 3,017.28 3,942.00 3,693.65 10,674.66 7,657.382014 2,373.08 644.20 3,017.28 3,942.00 3,693.65 10,674.66 7,657.382015 2,373.08 644.20 3,017.28 3,942.00 3,693.65 10,674.66 7,657.382016 2,373.08 644.20 3,017.28 3,942.00 3,693.65 10,674.66 7,657.382017 2,373.08 644.20 3,017.28 3,942.00 3,693.65 10,674.66 7,657.382018 2,373.08 644.20 3,017.28 3,942.00 3,693.65 10,674.66 7,657.382019 2,373.08 644.20 3,017.28 3,942.00 3,693.65 10,674.66 7,657.382020 2,373.08 644.20 3,017.28 3,942.00 3,693.65 10,674.66 7,657.382021 2,373.08 644.20 3,017.28 3,942.00 3,693.65 10,674.66 7,657.382022 2,373.08 644.20 3,017.28 3,942.00 3,693.65 10,674.66 7,657.382023 2,373.08 644.20 3,017.28 3,942.00 3,693.65 10,674.66 7,657.382024 2,373.08 644.20 3,017.28 3,942.00 3,693.65 10,674.66 7,657.382025 2,373.08 644.20 3,017.28 3,942.00 3,693.65 10,674.66 7,657.38Present Value 13,550.76 2,022.58 1,188.87 16,336.43 4,502.08 29,354.15 27,136.92 25,427.30 72,830.44 16,930.91Discount Rate 12.0% 1.08 P/kWhSensitivity FIRR 1.15 P/kWh FIRR 22.96%Base Case 22.96% 2.34 P/kWh (1998)Cost +10% 22.19% 2.89 P/kWh (1999-2025)Benefit -10% 20.23%Both 19.42%
Source: National Power CorporationGWh = gigawatt-hour, kV = kilovolt, kWh = kilowatt-hour, MW = megawatt, O&M = operation and maintenance.
FINANCIAL INTERNAL RATE OF RETURN (FIRR) - MASINLOC THERMAL POWER PLANT
Plant300MW
Fuel O&MTotal
(GWh)
Table A9.1 : Financial Internal Rate of Return (FIRR) - Masinloc Thermal Power Plant(Costs and Revenues in P million in 2000 price)
Operating Costs
x 2 UnitsTransmission
230-kV & 500-kVSubstations
Average Tariff to Luzon Grid
Net CashFlow
Levelized Cost of Power GeneratedLevelized Cost of Power Sold
CostsGeneration Sales Revenues
Appendix 9, page 1
29

Year
1994 1,714.00 1,714.00 0.00 1,714.00 1,714.00 0.001995 3,117.00 353.00 -2,764.00 3,117.00 353.00 -2,764.001996 10,500.00 3,137.72 -7,362.28 10,500.00 3,137.72 -7,362.281997 6,641.00 8,924.38 2,283.38 492.00 0.00 -492.00 7,133.00 8,924.38 1,791.381998 2,539.00 8,192.66 5,653.66 2,106.00 1,123.24 -982.76 4,645.00 9,315.89 4,670.891999 1,696.13 1,696.13 2,504.00 1,631.09 -872.91 2,504.00 3,327.22 823.222000 1,958.93 1,958.93 2,588.00 2,375.84 -212.16 2,588.00 4,334.77 1,746.77
Total 24,511.00 25,976.82 1,465.82 7,690.00 5,130.17 -2,559.83 32,201.00 31,106.98 -1,094.021,465.82 -2,559.83 -1,094.02
Year
1994199519961997 493.00 0.00 -493.00 462.00 0.00 -462.00 1,082.00 0.00 -1,082.001998 3,304.00 1,422.30 -1,881.70 3,078.00 1,332.70 -1,745.30 7,215.00 3,118.51 -4,096.491999 3,942.00 2,093.70 -1,848.30 3,641.00 1,961.80 -1,679.20 8,535.00 5,669.59 -2,865.412000 3,942.00 3,078.69 -863.31 3,641.00 2,884.73 -756.27 8,535.00 8,336.88 -198.12
Total 11,681.00 6,594.69 -5,086.31 10,822.00 6,179.22 -4,642.78 25,367.00 17,124.98 -8,242.02-5,086.31 -4,642.78 -8,242.02
Year
1994 -1,714.00 -1,714.00 0.001995 -3,117.00 -353.00 2,764.001996 -10,500.00 -3,137.72 7,362.281997 -6,052.00 -8,924.38 -2,872.381998 2,570.00 -6,197.39 -8,767.391999 6,031.00 2,342.38 -3,688.622000 5,947.00 4,002.10 -1,944.90
Total -6,835.00 -13,982.01 -7,147.01-7,147.01
GWh = gigawatt-hour.
Source: National Power Corporation.
Actual Balance
Balance
Actual
Estimate Actual
Estimate Balance Estimate
Estimate Actual Balance
BalanceActual
Net Cash Flow
Estimate
Table A9.2 : Comparison of Costs and Revenues (Appraisal Estimate vs. Actual) - Masinloc Thermal Power Plant(Costs and Revenues in P million)
Generation (GWh) Sales (GWh) Revenues
Capital Costs Operating Costs Total CostsEstimate Actual Balance Estimate Actual Balance
Appendix 9, page 2
30

Year Capital Costs
1994 1,714.00 1,714.00 -1,714.001995 353.00 353.00 -353.001996 2,673.80 631.05 520.43 3,825.28 -3,825.281997 7,639.59 1,747.66 1,441.30 10,828.54 -10,828.541998 6,617.97 2,141.99 1,766.50 1,056.77 164.98 0.00 11,748.21 1,307.90 1,225.50 2,867.68 -8,880.531999 1,245.91 612.42 505.06 1,555.62 187.33 5,795.61 9,901.94 3,890.97 3,645.84 10,536.47 634.532000 1,313.82 877.52 723.69 2,287.47 219.35 14,281.48 19,703.33 7,671.75 7,188.43 20,774.56 1,071.232001 2,928.91 219.35 14,281.48 17,429.74 8,511.80 7,975.56 23,049.36 5,619.622002 2,928.91 219.35 14,281.48 17,429.74 8,511.80 7,975.56 23,049.36 5,619.622003 2,928.91 219.35 14,281.48 17,429.74 8,511.80 7,975.56 23,049.36 5,619.622004 2,928.91 219.35 14,281.48 17,429.74 8,511.80 7,975.56 23,049.36 5,619.622005 2,928.91 219.35 14,281.48 17,429.74 8,511.80 7,975.56 23,049.36 5,619.622006 2,928.91 219.35 14,281.48 17,429.74 8,511.80 7,975.56 23,049.36 5,619.622007 2,928.91 219.35 14,281.48 17,429.74 8,511.80 7,975.56 23,049.36 5,619.622008 2,928.91 219.35 14,281.48 17,429.74 8,511.80 7,975.56 23,049.36 5,619.622009 2,928.91 219.35 14,281.48 17,429.74 8,511.80 7,975.56 23,049.36 5,619.622010 2,928.91 219.35 14,281.48 17,429.74 8,511.80 7,975.56 23,049.36 5,619.622011 2,928.91 219.35 14,281.48 17,429.74 8,511.80 7,975.56 23,049.36 5,619.622012 2,928.91 219.35 14,281.48 17,429.74 8,511.80 7,975.56 23,049.36 5,619.622013 2,928.91 219.35 14,281.48 17,429.74 8,511.80 7,975.56 23,049.36 5,619.622014 2,928.91 219.35 14,281.48 17,429.74 8,511.80 7,975.56 23,049.36 5,619.622015 2,928.91 219.35 14,281.48 17,429.74 8,511.80 7,975.56 23,049.36 5,619.622016 2,928.91 219.35 14,281.48 17,429.74 8,511.80 7,975.56 23,049.36 5,619.622017 2,928.91 219.35 14,281.48 17,429.74 8,511.80 7,975.56 23,049.36 5,619.622018 2,928.91 219.35 14,281.48 17,429.74 8,511.80 7,975.56 23,049.36 5,619.622019 2,928.91 219.35 14,281.48 17,429.74 8,511.80 7,975.56 23,049.36 5,619.622020 2,928.91 219.35 14,281.48 17,429.74 8,511.80 7,975.56 23,049.36 5,619.622021 2,928.91 219.35 14,281.48 17,429.74 8,511.80 7,975.56 23,049.36 5,619.622022 2,928.91 219.35 14,281.48 17,429.74 8,511.80 7,975.56 23,049.36 5,619.622023 2,928.91 219.35 14,281.48 17,429.74 8,511.80 7,975.56 23,049.36 5,619.622024 2,928.91 219.35 14,281.48 17,429.74 8,511.80 7,975.56 23,049.36 5,619.622025 2,928.91 219.35 14,281.48 17,429.74 8,511.80 7,975.56 23,049.36 5,619.62Present Value 13,550.76 4,368.42 3,602.64 20,162.73 1,677.32 94,513.16 93,849.81 57,248.13 53,641.50 154,422.11 4,288.23Discount Rate 12.0% Levelized Cost of Power Generated 1.64 P/kWhSensitivity FIRR Levelized Cost of Power Sold 1.75 P/kWh FIRR 14.56%Base Case 14.56% Average Tariff to Luzon Grid 2.34 P/kWh 1998Cost +10% 9.98% 2.89 P/kWh 1999-2025Benefit -10% 8.29%Both 1.82%
GWh = gigawatt-hour, kV = kilovolt, kWh = kilowatt-hour, MW = megawatt, NPC = National Power Corporation, O&M = operation and maintenance, S/S = substation, T/L = transmission line.
Source: National Power Corporation.
(GWh)
(Costs and Revenues in P million in 2000 price)
NPC Operation Costs
O&MT/L & S/S
Costs
Purchase Price from
Sual
CostsSubstations
MasinlocGeneration
Costs300MW
x 2 UnitsTransmission
230-kV & 500-kV
Net CashFlow
Sales
FINANCIAL INTERNAL RATE OF RETURN (FIRR) - NORTHERN LUZON TRANSMISSION AND GENERATION PROJECT
PlantLuzon Grid
to RevenuesTotal
GenerationNet
Appendix 10
31

Year
1994 1,714.00 1,714.00 -1,714.001995 346.88 346.88 -346.881996 2,629.26 278.26 165.60 3,073.12 -3,073.121997 7,594.13 770.63 458.61 8,823.37 -8,823.371998 6,592.97 944.51 562.08 702.10 218.95 547.44 9,568.06 1,422.30 1,332.70 0.107 1,190.10 5,077.07 -4,490.981999 1,237.34 270.04 160.71 1,033.53 303.96 805.87 3,811.46 2,093.70 1,961.80 0.107 1,751.88 7,473.72 3,662.262000 1,306.45 386.94 230.27 1,519.76 428.43 1,184.99 5,056.85 3,078.69 2,884.73 0.107 2,576.07 10,989.76 5,932.912001 1,945.93 528.24 1,517.28 3,991.45 3,942.00 3,693.65 0.107 3,298.43 14,071.45 10,080.002002 1,945.93 528.24 1,517.28 3,991.45 3,942.00 3,693.65 0.107 3,298.43 14,071.45 10,080.002003 1,945.93 528.24 1,517.28 3,991.45 3,942.00 3,693.65 0.107 3,298.43 14,071.45 10,080.002004 1,945.93 528.24 1,517.28 3,991.45 3,942.00 3,693.65 0.107 3,298.43 14,071.45 10,080.002005 1,945.93 528.24 1,517.28 3,991.45 3,942.00 3,693.65 0.107 3,298.43 14,071.45 10,080.002006 1,945.93 528.24 1,517.28 3,991.45 3,942.00 3,693.65 0.107 3,298.43 14,071.45 10,080.002007 1,945.93 528.24 1,517.28 3,991.45 3,942.00 3,693.65 0.107 3,298.43 14,071.45 10,080.002008 1,945.93 528.24 1,517.28 3,991.45 3,942.00 3,693.65 0.107 3,298.43 14,071.45 10,080.002009 1,945.93 528.24 1,517.28 3,991.45 3,942.00 3,693.65 0.107 3,298.43 14,071.45 10,080.002010 1,945.93 528.24 1,517.28 3,991.45 3,942.00 3,693.65 0.107 3,298.43 14,071.45 10,080.002011 1,945.93 528.24 1,517.28 3,991.45 3,942.00 3,693.65 0.107 3,298.43 14,071.45 10,080.002012 1,945.93 528.24 1,517.28 3,991.45 3,942.00 3,693.65 0.107 3,298.43 14,071.45 10,080.002013 1,945.93 528.24 1,517.28 3,991.45 3,942.00 3,693.65 0.107 3,298.43 14,071.45 10,080.002014 1,945.93 528.24 1,517.28 3,991.45 3,942.00 3,693.65 0.107 3,298.43 14,071.45 10,080.002015 1,945.93 528.24 1,517.28 3,991.45 3,942.00 3,693.65 0.107 3,298.43 14,071.45 10,080.002016 1,945.93 528.24 1,517.28 3,991.45 3,942.00 3,693.65 0.107 3,298.43 14,071.45 10,080.002017 1,945.93 528.24 1,517.28 3,991.45 3,942.00 3,693.65 0.107 3,298.43 14,071.45 10,080.002018 1,945.93 528.24 1,517.28 3,991.45 3,942.00 3,693.65 0.107 3,298.43 14,071.45 10,080.002019 1,945.93 528.24 1,517.28 3,991.45 3,942.00 3,693.65 0.107 3,298.43 14,071.45 10,080.002020 1,945.93 528.24 1,517.28 3,991.45 3,942.00 3,693.65 0.107 3,298.43 14,071.45 10,080.002021 1,945.93 528.24 1,517.28 3,991.45 3,942.00 3,693.65 0.107 3,298.43 14,071.45 10,080.002022 1,945.93 528.24 1,517.28 3,991.45 3,942.00 3,693.65 0.107 3,298.43 14,071.45 10,080.002023 1,945.93 528.24 1,517.28 3,991.45 3,942.00 3,693.65 0.107 3,298.43 14,071.45 10,080.002024 1,945.93 528.24 1,517.28 3,991.45 3,942.00 3,693.65 0.107 3,298.43 14,071.45 10,080.002025 1,945.93 528.24 1,517.28 3,991.45 3,942.00 3,693.65 0.107 3,298.43 14,071.45 10,080.00Present Value 13,463.43 1,926.25 1,146.33 13,395.87 3,691.71 10,445.02 33,410.33 27,136.92 25,427.30 22,706.58 96,868.52 28,151.36Discount Rate 12.00% 0.85 P/kWh Sensitivity EIRR
0.82 1.47 P/kWh Base Case 29.55% EIRR 29.55%Value Resources Savings 0.33 P/kWh Cost +10% 28.62%Average Consumer Tariff Luzon 4.10 P/kWh Benefit -10% 26.20%Opportunity Cost 4.43 P/kWh Both 25.58%Willingness to Pay 4.27 P/kWh
GWh = gigawatt-hour, kV = kilovolt, kWh = kilowatt-hour, MW = megawatt, NPC = National Power Corporation, O&M = operation and maintenance.
Source: National Power Corporation.
300MWx 2 Units
Transmission
Standard Conversion Factor
230-kV & 500-kVPlant Substations NetDistribution
GenerationCosts Costs
ECONOMIC INTERNAL RATE OF RETURN (EIRR) - MASINLOC THERMAL POWER PLANT(Costs and Benefits in P million in 2000 price)
Operating CostsCapital Costs Sales toDistribution Total
(GWh)
NPCFuel O&M Cooperatives
Meralco and NPC
Levelized Cost of Power GeneratedLevelized Cost of Power Sold
BenefitsSales to
Consumers(GWh)
SalesBenefitsLosses
(%)
Appendix 11
32

Sales NetYear Benefits Benefits
x 2 Units
1994 1,714.00 1,714.00 -1,714.001995 346.88 346.88 -346.881996 2,629.26 617.13 514.28 3,760.68 -3,760.681997 7,594.13 1,709.12 1,424.28 10,727.53 -10,727.531998 6,592.97 2,094.76 1,745.64 866.55 135.28 0.00 503.41 11,938.61 1,307.90 1,225.50 0.107 1,094.37 4,668.71 -7,269.901999 1,237.34 598.91 499.10 1,275.61 153.61 4,752.40 1,497.64 10,014.61 3,890.97 3,645.84 0.107 3,255.73 13,889.28 3,874.672000 1,306.45 858.17 715.15 1,875.72 179.87 11,710.81 2,952.86 19,599.04 7,671.75 7,188.43 0.107 6,419.27 27,385.24 7,786.202001 2,401.70 179.87 11,710.81 3,276.20 17,568.58 8,511.80 7,975.56 0.107 7,122.17 30,383.90 12,815.312002 2,401.70 179.87 11,710.81 3,276.20 17,568.58 8,511.80 7,975.56 0.107 7,122.17 30,383.90 12,815.312003 2,401.70 179.87 11,710.81 3,276.20 17,568.58 8,511.80 7,975.56 0.107 7,122.17 30,383.90 12,815.312004 2,401.70 179.87 11,710.81 3,276.20 17,568.58 8,511.80 7,975.56 0.107 7,122.17 30,383.90 12,815.312005 2,401.70 179.87 11,710.81 3,276.20 17,568.58 8,511.80 7,975.56 0.107 7,122.17 30,383.90 12,815.312006 2,401.70 179.87 11,710.81 3,276.20 17,568.58 8,511.80 7,975.56 0.107 7,122.17 30,383.90 12,815.312007 2,401.70 179.87 11,710.81 3,276.20 17,568.58 8,511.80 7,975.56 0.107 7,122.17 30,383.90 12,815.312008 2,401.70 179.87 11,710.81 3,276.20 17,568.58 8,511.80 7,975.56 0.107 7,122.17 30,383.90 12,815.312009 2,401.70 179.87 11,710.81 3,276.20 17,568.58 8,511.80 7,975.56 0.107 7,122.17 30,383.90 12,815.312010 2,401.70 179.87 11,710.81 3,276.20 17,568.58 8,511.80 7,975.56 0.107 7,122.17 30,383.90 12,815.312011 2,401.70 179.87 11,710.81 3,276.20 17,568.58 8,511.80 7,975.56 0.107 7,122.17 30,383.90 12,815.312012 2,401.70 179.87 11,710.81 3,276.20 17,568.58 8,511.80 7,975.56 0.107 7,122.17 30,383.90 12,815.312013 2,401.70 179.87 11,710.81 3,276.20 17,568.58 8,511.80 7,975.56 0.107 7,122.17 30,383.90 12,815.312014 2,401.70 179.87 11,710.81 3,276.20 17,568.58 8,511.80 7,975.56 0.107 7,122.17 30,383.90 12,815.312015 2,401.70 179.87 11,710.81 3,276.20 17,568.58 8,511.80 7,975.56 0.107 7,122.17 30,383.90 12,815.312016 2,401.70 179.87 11,710.81 3,276.20 17,568.58 8,511.80 7,975.56 0.107 7,122.17 30,383.90 12,815.312017 2,401.70 179.87 11,710.81 3,276.20 17,568.58 8,511.80 7,975.56 0.107 7,122.17 30,383.90 12,815.312018 2,401.70 179.87 11,710.81 3,276.20 17,568.58 8,511.80 7,975.56 0.107 7,122.17 30,383.90 12,815.312019 2,401.70 179.87 11,710.81 3,276.20 17,568.58 8,511.80 7,975.56 0.107 7,122.17 30,383.90 12,815.312020 2,401.70 179.87 11,710.81 3,276.20 17,568.58 8,511.80 7,975.56 0.107 7,122.17 30,383.90 12,815.312021 2,401.70 179.87 11,710.81 3,276.20 17,568.58 8,511.80 7,975.56 0.107 7,122.17 30,383.90 12,815.312022 2,401.70 179.87 11,710.81 3,276.20 17,568.58 8,511.80 7,975.56 0.107 7,122.17 30,383.90 12,815.312023 2,401.70 179.87 11,710.81 3,276.20 17,568.58 8,511.80 7,975.56 0.107 7,122.17 30,383.90 12,815.312024 2,401.70 179.87 11,710.81 3,276.20 17,568.58 8,511.80 7,975.56 0.107 7,122.17 30,383.90 12,815.312025 2,401.70 179.87 11,710.81 3,276.20 17,568.58 8,511.80 7,975.56 0.107 7,122.17 30,383.90 12,815.31PresentValue 13,463.43 4,272.09 3,560.09 16,533.44 1,375.41 77,500.79 22,034.85 94,345.30 57,248.13 53,641.50 47,901.86 204,354.10 35,525.43Discount Rate 12.00% 1.26 P/kWh EIRRStandard Conversion Factor 0.82 1.97 P/kWh 29.76% EIRR 29.76%Value Resources Savings 0.33 P/kWh 26.60%Average Consumer Tariff Luzon 4.10 P/kWh 24.06%Opportunity Cost 4.43 P/kWh 20.47%Willingness to Pay 4.27 P/kWh
GWh = gigawatt-hour, kV = kilovolt, kWh = kilowatt-hour, MW = megawatt, NPC = National Power Corporation, O&M = operation and maintenance, S/S = substation, T/L = transmission line.Source: National Power Corporation.
Both
Levelized Cost of Power GeneratedLevelized Cost of Power Sold
SensitivityBase CaseCost +10%Benefit -10%
ECONOMIC INTERNAL RATE OF RETURN (EIRR) - NORTHERN LUZON TRANSMISSION AND GENERATION PROJECT(Costs and Benefits in P million in 2000 prices)
Distribution LossesPurchase from
Sales toMeralco and Co-
TotalCosts
(%)
Sales toConsumers
(GWh)
NPC Net Generation and Purchase
Price from Sual
DistributionCosts
MasinlocGeneration
Costs
T/L & S/SO&MCosts
Plant (GWh)operatives
Capital Costs NPC Operating CostsPlant
300 MWTransmission
230 kV & 500 kV SubstationsSual Power
Appendix 12
33

Appendix 13, page 134
PROJECT PERFORMANCE RATING
A. Relevance
Subcriterion Results/Remarks
Relevance of project preparation to project output at the timeof approval
Yes
Relevance of project output to achieve project goals andpurposes at the time of approval
Yes
Priority in the context of the country’s development strategyat the time of approval
Yes
Priority in the context of the development strategy of theAsian Development Bank (ADB) for the country at the timeof approval
Yes
Priority in the context of the country’s development strategyat the time of evaluation
Yes
Priority in the context of ADB’s development strategy for thecountry at the time of evaluation
Yes
Priority in the context of one or more of ADB’s strategicobjectives at the time of evaluation
Yes
Appropriate changes made at the midterm review/otherreviews to make the Project more relevant
No
Percentage of subcriteria that met assessment 87.5Equivalent rating 3
B. Efficacy
Subcriterion Results/Remarks
Achievement of most project physical outcomes Yes
Achievement of most project intangible outcomes (e.g.,technical assistance)
Yes
The likelihood of project outcomes leading to project goals Yes
Percentage of subcriteria that met assessment 100Evaluation rating 3

Appendix 13, page 235
C. Efficiency
Subcriterion Results/Remarks
Manner of ADB’s internal processing of the Project Yes
Organization and management of Executing Agency andimplementing agencies
No
Effectiveness of project management Yes
Efficiency in recruitment of consultants and otherprocurement
Yes
Timely and adequate availability of counterpart funding Yes
Percentage of subcriteria that met assessment 80Evaluation rating 3
D. Sustainability
Subcriterion Results/Remarks
Availability of adequate and effective demand for Projectservices and products
No
Probable operating and financial performance of theoperational entity and ability to recover costs
No
Probability of the existence of appropriate maintenancepolicy and procedures
Yes
Probability of fund availability (cash flow) for continuedoperations, maintenance, and growth requirements
No
Probable availability of skills to continue project availability Yes
Probable availability of appropriate technology andequipment to operate the Project
Yes
Probable availability of the enabling environment (subsidies,tariffs, prices, competitiveness, and political developments)in which the Project is operating at the time of evaluation
Yes
Government ownership and commitment to the Project Yes
The extent to which the operation affect the environment andrenewable or nonrenewable resources
No

Appendix 13, page 336
The extent to which the community participation andbeneficiary incentives are adequate to maintain the projectbenefits
No
Percentage of subcriteria that met assessment 50Equivalent rating 2
E. Institutional Development and Other Impacts
Subcriterion Results/Remarks
Country formal laws, regulations, and procedures Yes
The people’s informal norms and practices No
Institutional or organizational strengthening No
Institutional skill levels and capacities Yes
Participatory attitudes of society No
Macroeconomic or sector policy framework No
Impacts on poverty No
Impacts on the environment No
Impacts on social organization No
Impacts on political developments No
Percentage of subcriteria that met assessment 20Equivalent rating 0
Assessment of Overall Project Performance
Criteria Weights (%)Assessment
Rating Wei ghted Ratin g
Relevance 20 3 0.60Efficacy 25 3 0.75Efficiency 25 3 0.75Sustainability 15 2 0.30Institutional Development and Other
Impacts15 0 0.00
Overall Rating 2.40(Successful)