Asia Strategy - privatebank.citibank.com
14
INVESTMENT PRODUCTS: NOT FDIC INSURED • NOT CDIC INSURED • NOT GOVERNMENT INSURED • NO BANK GUARANTEE • MAY LOSE VALUE March 5 2021 Asia Strategy Vaccination, Reflation, Resumption The recent market shake-up from higher real rates reflect progress in recovery, rather than the end of it. As we’ve emphasized since vaccines became available late last year, recovery and reflation would engender a rotation in equities, while long end interest rates are likely to rise and steepen the yield curve. All of these are making good progress. In Asia, inflationary pressures and external financing needs are both in good shape. o Average CPI is lower than that of the US, while real rates are much higher. o Current account surpluses have widened markedly during the pandemic, building up FX reserves while external debt issuance had been limited. These offer policymakers (with the notable exception of China’s) ample room to nurse the economic recovery, without having to worry much about capital outflows and the exchange rate impact of higher US real rates. The pace of vaccinations in Asia is relatively slow compared to many Western countries, partly because of the large population and partly because of the far lower rates of infections and outstanding cases. But some acceleration is likely in coming months. o China now has four approved vaccines, including a highly effective single- dose product from CanSino. o India is a vaccine production hub and is gearing up capacity. Together with China, they account for half of global production. Moreover, India may be much closer to herd immunity than the vaccination data would suggest. o Singapore has become the model for efficient vaccination rollout and planning, which could put it at the top of the list for travel resumption agreements in Asia. Along with the vaccinations, travel resumption is just a matter of time. When it happens, we look at China’s recent experience for clues on pent-up demand. In 2H 2020 and during the Lunar New Year holiday this year, China has shown massive demand growth for some of most pandemic battered industries, such as travel & leisure, retail, hospitality, and gaming, as both revenue and pricing power return to the businesses. This could be repeated elsewhere in the region when travel resumes. Ken Peng Head – Asia Investment Strategy +852 2868-8904 [email protected] Calvin Ha +852 2868-8477 [email protected] Cecilia Chen +852 2298-6180 [email protected]
Transcript of Asia Strategy - privatebank.citibank.com

INVESTMENT PRODUCTS: NOT FDIC INSURED • NOT CDIC INSURED • NOT GOVERNMENT INSURED • NO BANK GUARANTEE • MAY LOSE VALUE
March 5 2021
Asia Strategy
Vaccination, Reflation, Resumption
The recent market shake-up from higher real rates reflect progress in recovery, rather than the end of it. As we’ve emphasized since vaccines became available late last year, recovery and reflation would engender a rotation in equities, while long end interest rates are likely to rise and steepen the yield curve. All of these are making good progress.
In Asia, inflationary pressures and external financing needs are both in good shape.
o Average CPI is lower than that of the US, while real rates are much higher.
o Current account surpluses have widened markedly during the pandemic, building up FX reserves while external debt issuance had been limited.
These offer policymakers (with the notable exception of China’s) ample room to nurse the economic recovery, without having to worry much about capital outflows and the exchange rate impact of higher US real rates.
The pace of vaccinations in Asia is relatively slow compared to many Western countries, partly because of the large population and partly because of the far lower rates of infections and outstanding cases. But some acceleration is likely in coming months.
o China now has four approved vaccines, including a highly effective single-dose product from CanSino.
o India is a vaccine production hub and is gearing up capacity. Together with China, they account for half of global production. Moreover, India may be much closer to herd immunity than the vaccination data would suggest.
o Singapore has become the model for efficient vaccination rollout and planning, which could put it at the top of the list for travel resumption agreements in Asia.
Along with the vaccinations, travel resumption is just a matter of time. When it happens, we look at China’s recent experience for clues on pent-up demand. In 2H 2020 and during the Lunar New Year holiday this year, China has shown massive demand growth for some of most pandemic battered industries, such as travel & leisure, retail, hospitality, and gaming, as both revenue and pricing power return to the businesses. This could be repeated elsewhere in the region when travel resumes.
Ken Peng Head – Asia Investment Strategy +852 2868-8904 [email protected] Calvin Ha +852 2868-8477 [email protected] Cecilia Chen +852 2298-6180 [email protected]

Asia Strategy 2
Vaccination, Reflation, Resumption
The recent market shake up stemmed from a catch up of bond yields to be more
consistent with the solid pace of recovery, and the associated climb in inflation. As we’ve
emphasized since vaccines became available last November, recovery and reflation
would engender a rotation in equities, while long end interest rates are likely to rise and
steepen the yield curve. All of these are making good progress, and we expect them to
continue for some time.
As a result, the setbacks from rising real interest rates reflects the progress of
recovery and may lift volatility in the coming year, but are unlikely to stop the
recovery.
In Asia, the progress of recovery and reflation is more advanced in manufacturing, but
remains woefully lagging in services. Inflation momentum in Asia is so far lagging
that of the US, yet policymakers in Asia appear much more conservative in stimulus
compared to the Fed or the US government. Strong export recovery have also led to
unusually large current account surpluses and comfortable FX reserves, which
makes EM Asia more resilient towards rising real rates in the US. This combination
provides some anchor for exchange rates in Asia despite already impressive
performance.
Looking at Asia, the administration of vaccines appear to be lagging the developed
world, especially relative to Asia’s large population. However, we found that many key
markets only began large scale vaccinations in February, with more doing so in March-
April. Meanwhile, both the number of new cases and outstanding cases have fallen
dramatically across the region, especially in India (Figure 1 and Figure 2). The capacity
for vaccine production in China and India account for half of the world’s capacity (Figure
8).
As a result, we expect vaccine progress to pick up materially from March and into 2Q.
More importantly, travel bubble talks have resumed and social distancing rules are being
gradually relaxed. These are likely to lead to greater mobility in Asia in the first half. As
vaccinations and re-opening would likely lead to massive improvements in
valuations and corporate profits in the industries most impaired by the pandemic,
such as travel & leisure, hospitality, retail and gaming. We look to these areas for
opportunities of equity outperformance.
Figure 1: Outstanding COVID cases in Asia amount to just over 1% of the global figure
Figure 2: Daily new COVID cases in Asia have collapsed after India’s infection rates fell
Source: Bloomberg, as of 28 Feb 2021 Source: Bloomberg, as of 28 Feb 2021 All forecasts are expressions of opinion and are subject to change without notice and are not intended to be a guarantee of future events. Indices are unmanaged. An investor cannot invest directly in an index. They are shown for illustrative purposes only. Past performance is no guarantee of future returns. Real results may vary.
0.0
0.2
0.4
0.6
0.8
1.0
1.2
1.4
1.6
0.0
5.0
10.0
15.0
20.0
25.0
30.0
35.0
40.0
45.0
Apr-20 Jul-20 Oct-20 Jan-21
AP
AC
(M
illio
ns)
Wo
rld
(M
illio
ns)
Outstanding Confirmed Cases(Total less deaths and recoveries)
World
APAC
-
10,000
20,000
30,000
40,000
50,000
60,000
70,000
80,000
90,000
100,000
-
10,000
20,000
30,000
40,000
50,000
60,000
70,000
80,000
90,000
100,000
Apr-20 Jul-20 Oct-20 Jan-21
Daily New Confirmed Cases in APAC(7-day average)
India
Other APAC
Asia Strategy 3
Reflation in Asia: Milder and with stronger defense
Asian economies were relatively resilient thanks to better pandemic management and
strong export growth, particularly in North Asia. However, the state of inflation had
remained very subdued throughout the region. Moreover, thanks to the strong rebound
in exports amid sharp import declines, EM Asian current accounts are in significant
surplus, adding to ample FX reserves. These keep the region in a solid position to fend
off rising rates pressures from the US.
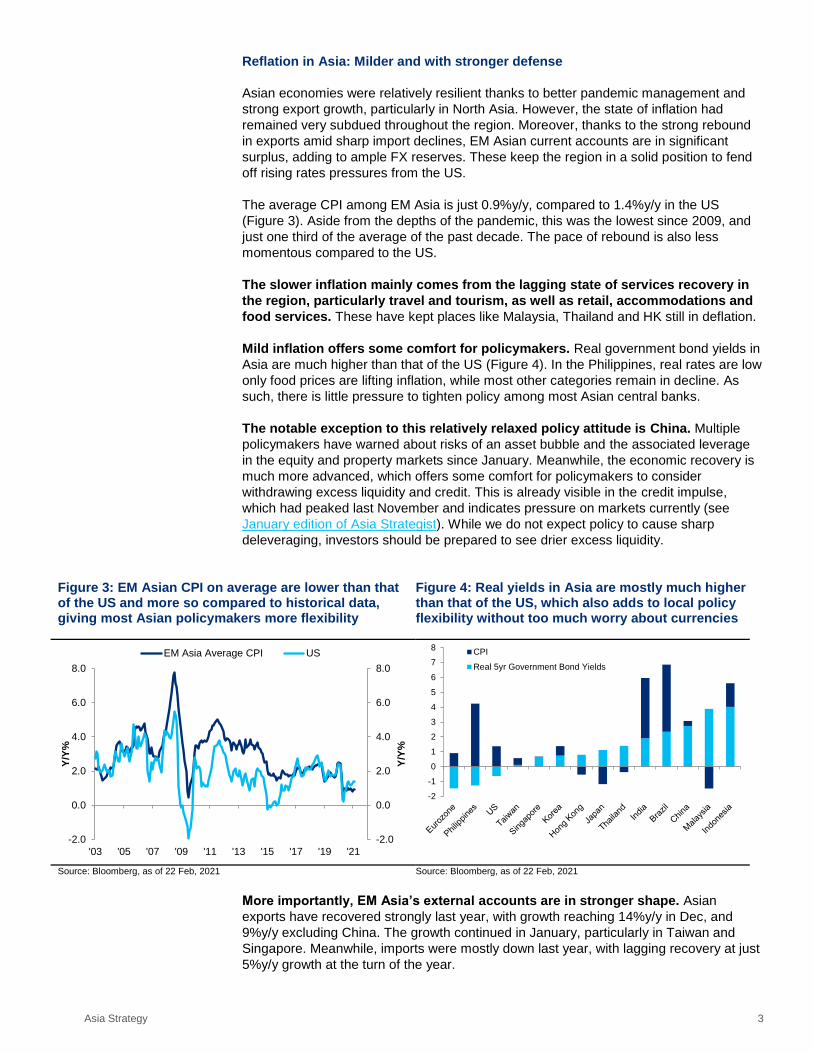
The average CPI among EM Asia is just 0.9%y/y, compared to 1.4%y/y in the US
(Figure 3). Aside from the depths of the pandemic, this was the lowest since 2009, and
just one third of the average of the past decade. The pace of rebound is also less
momentous compared to the US.
The slower inflation mainly comes from the lagging state of services recovery in
the region, particularly travel and tourism, as well as retail, accommodations and
food services. These have kept places like Malaysia, Thailand and HK still in deflation.
Mild inflation offers some comfort for policymakers. Real government bond yields in
Asia are much higher than that of the US (Figure 4). In the Philippines, real rates are low
only food prices are lifting inflation, while most other categories remain in decline. As
such, there is little pressure to tighten policy among most Asian central banks.
The notable exception to this relatively relaxed policy attitude is China. Multiple
policymakers have warned about risks of an asset bubble and the associated leverage
in the equity and property markets since January. Meanwhile, the economic recovery is
much more advanced, which offers some comfort for policymakers to consider
withdrawing excess liquidity and credit. This is already visible in the credit impulse,
which had peaked last November and indicates pressure on markets currently (see
January edition of Asia Strategist). While we do not expect policy to cause sharp
deleveraging, investors should be prepared to see drier excess liquidity.
Figure 3: EM Asian CPI on average are lower than that of the US and more so compared to historical data, giving most Asian policymakers more flexibility
Figure 4: Real yields in Asia are mostly much higher than that of the US, which also adds to local policy flexibility without too much worry about currencies
Source: Bloomberg, as of 22 Feb, 2021 Source: Bloomberg, as of 22 Feb, 2021
More importantly, EM Asia’s external accounts are in stronger shape. Asian
exports have recovered strongly last year, with growth reaching 14%y/y in Dec, and
9%y/y excluding China. The growth continued in January, particularly in Taiwan and
Singapore. Meanwhile, imports were mostly down last year, with lagging recovery at just
5%y/y growth at the turn of the year.
-2.0
0.0
2.0
4.0
6.0
8.0
-2.0
0.0
2.0
4.0
6.0
8.0
'03 '05 '07 '09 '11 '13 '15 '17 '19 '21
Y/Y
%
Y/Y
%
EM Asia Average CPI US
-2
-1
0
1
2
3
4
5
6
7
8CPI
Real 5yr Government Bond Yields

Asia Strategy 4
This has sent Asian current account (CA) balances surging. This was the case for the
big surplus markets like China, Taiwan and Korea who have benefited from effective
COVID management and the tech boom. But even excluding these, the more
externally vulnerable parts of EM Asia saw a sharp swing from CA deficit of
$7.7bn in 2019 to a surplus of $50bn in 2020, taking FX reserves up sharply to
over $1 trillion for the first time ever (Figure 5). Meanwhile, external debt largely
stayed flat last year. Together, the amount of external financing needs is well covered by
FX reserves (Figure 6).
More fortified external accounts means that EM Asia can better withstand higher
US interest rates, as the need to raise external financing is low. This gives
policymakers more flexibility to support the domestic economies, while not having to
worry too much about capital outflows and the exchange rate. As a result, the prospects
for EM Asian currencies remain relatively robust despite already impressive
performance.
Figure 5: Rising current account surpluses accelerated FX reserve accumulation, while external debt increases were moderate during the pandemic even in the more vulnerable parts of EM Asia
Figure 6: FX reserves comfortably cover Net External Financing Needs compared to 1997 or 2013
Note: chart data includes India, Indonesia, Malaysia, Philippines, and Thailand. Source: Haver Analytics, as of 4Q 2020
Source: Bank of International Settlements, Haver Analytics, as of 3Q 2020
All forecasts are expressions of opinion and are subject to change without notice and are not intended to be a guarantee of future events. Indices are unmanaged. An investor cannot invest directly in an index. They are shown for illustrative purposes only. Past performance is no guarantee of future returns. Real results may vary.
Vaccination: Delayed start, but poised to Accelerate
In the race against the pandemic, Western countries like the US and the UK have pulled
ahead, with 31.9 and 23.7 doses administered per 100 people respectively at the
beginning of March. In contrast, Asian countries are still lagging.
China and India are ahead in Asia in total doses, but still lag coverage of their large
populations. Some Asian markets are about to rollout vaccination programs after a long
wait for authorization from local regulators, while others are still in the process of signing
deals with pharmaceutical companies to secure supply. As our investment view greatly
depends the success of the vaccination and economic reopening, we highlight major
progress in China, India, Japan and Singapore, where acceleration is likely in coming
months.
China: Four home made vaccines approved, including a single-shot product
China has been among global leaders in vaccine development and rollout. In late Feb,
China approved its third and fourth vaccines, including a single-shot adenovirus-
vectored vaccine called Convidecia developed by CanSino Biologics and the Academy
0
200
400
600
800
1000
1200
-100
-80
-60
-40
-20
0
20
40
60
80
96 98 00 02 04 06 08 10 12 14 16 18 20
ED &
FX
R (
$B
n)
CA
B (
$B
n)
Curr Acct Bal (CAB)
External Debt (ED)
FX Reserves (FXR)
0
1
2
3
4
5
6
FX R
eser
ves
/ Ex
tern
al F
inan
cin
g N
eed
s1997
2013
2020
Asia Strategy 5
of Military Medical Sciences. Phase 3 data of the CanSino vaccine showed 68% efficacy
in preventing Covid, and 95% effectiveness in preventing severe symptoms. At the same
time, another vaccine developed by the Wuhan subsidiary of Sinopharm was approved.
These came after the first Sinopharm vaccine approved on December 31 and the
Sinovac vaccine approved in early February.
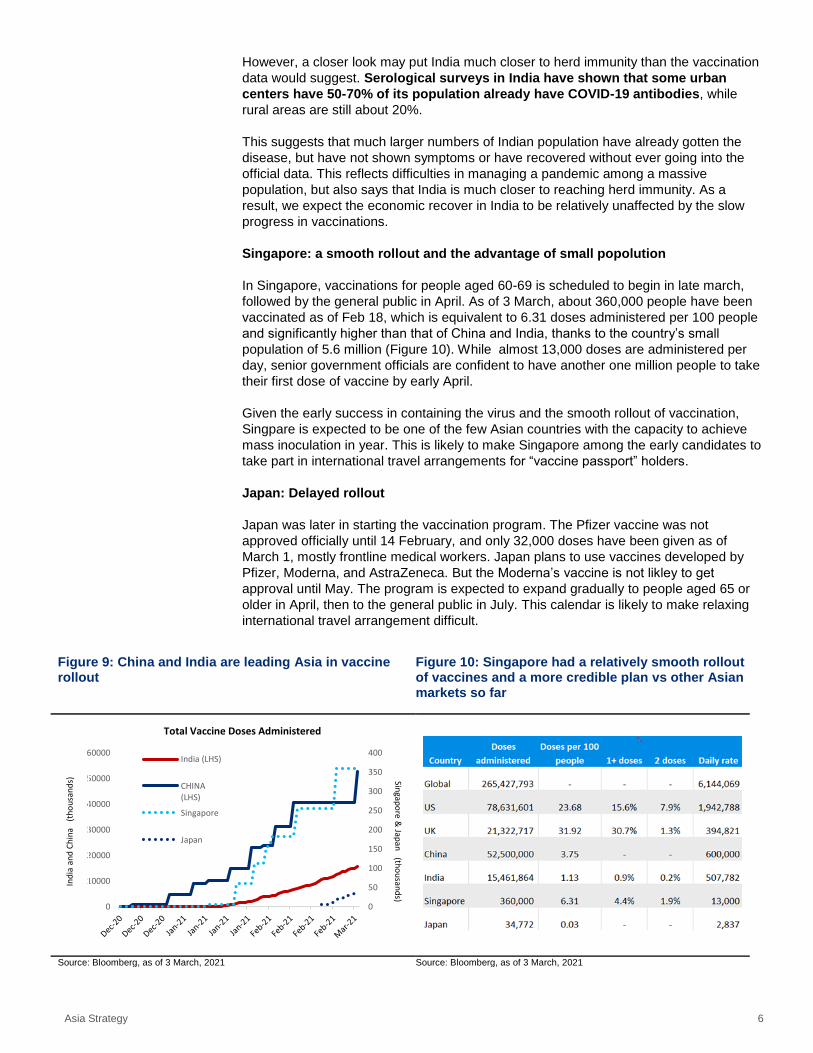
Less promising is the progress of administering the vaccines. 52.5mn doses had been
administered as of 3 March, or only 3.75 doses per 100 people, rising at roughly
600,000 doses per day. But even at 10 million per day, it would take about 7 months to
reach herd immunity for China’s 1.4bn population.
One of the holdbacks is that China is deploying more vaccines outside of China than
inside. Over half billion doses of ready made vaccines or materials for production have
been shipped or promised to other countries that are deemed diplomatically important,
nearly 10 times the amount administered at home.
Still, looking forward, the pace of vaccinations is likely to accelerate, especially with the
CanSino single-shot product now approved. The target of 10mn people per day would
also likely require policy incentives for relaxing travel for those who are vaccinated,
which have yet to be formulated, and would involve international agreements.
India: Hub for vaccine production, and closer to herd immunity
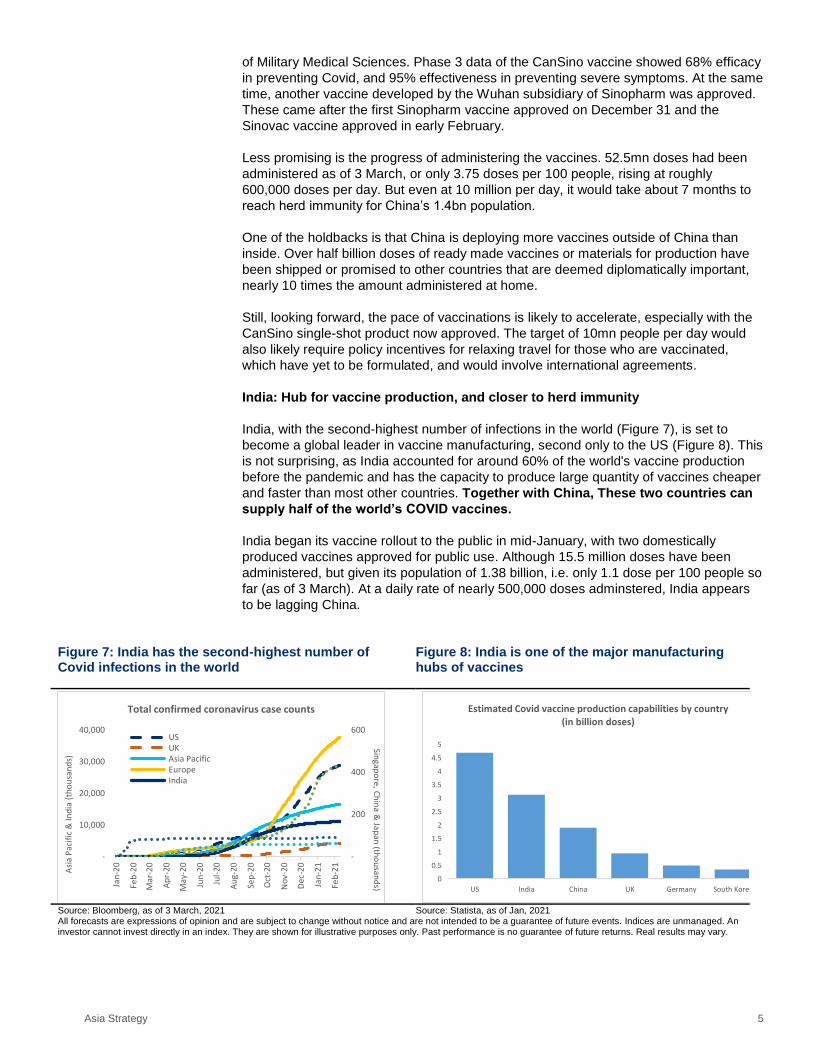
India, with the second-highest number of infections in the world (Figure 7), is set to
become a global leader in vaccine manufacturing, second only to the US (Figure 8). This
is not surprising, as India accounted for around 60% of the world's vaccine production
before the pandemic and has the capacity to produce large quantity of vaccines cheaper
and faster than most other countries. Together with China, These two countries can
supply half of the world’s COVID vaccines.
India began its vaccine rollout to the public in mid-January, with two domestically
produced vaccines approved for public use. Although 15.5 million doses have been
administered, but given its population of 1.38 billion, i.e. only 1.1 dose per 100 people so
far (as of 3 March). At a daily rate of nearly 500,000 doses adminstered, India appears
to be lagging China.
Figure 7: India has the second-highest number of Covid infections in the world
Figure 8: India is one of the major manufacturing hubs of vaccines
Source: Bloomberg, as of 3 March, 2021 Source: Statista, as of Jan, 2021 All forecasts are expressions of opinion and are subject to change without notice and are not intended to be a guarantee of future events. Indices are unmanaged. An investor cannot invest directly in an index. They are shown for illustrative purposes only. Past performance is no guarantee of future returns. Real results may vary.
-
200
400
600
-
10,000
20,000
30,000
40,000
Jan
-20
Feb
-20
Mar
-20
Ap
r-20
May
-20
Jun
-20
Jul-
20
Au
g-20
Sep
-20
Oct
-20
No
v-20
Dec
-20
Jan
-21
Feb
-21
Singap
ore, C
hin
a & Jap
an (th
ou
sand
s)
Asi
a P
acif
ic &
Ind
ia (
tho
usa
nd
s)
Total confirmed coronavirus case counts
USUKAsia PacificEuropeIndia
0
0.5
1
1.5
2
2.5
3
3.5
4
4.5
5
US India China UK Germany South Korea
Estimated Covid vaccine production capabilities by country (in billion doses)
Asia Strategy 6
However, a closer look may put India much closer to herd immunity than the vaccination
data would suggest. Serological surveys in India have shown that some urban
centers have 50-70% of its population already have COVID-19 antibodies, while
rural areas are still about 20%.
This suggests that much larger numbers of Indian population have already gotten the
disease, but have not shown symptoms or have recovered without ever going into the
official data. This reflects difficulties in managing a pandemic among a massive
population, but also says that India is much closer to reaching herd immunity. As a
result, we expect the economic recover in India to be relatively unaffected by the slow
progress in vaccinations.
Singapore: a smooth rollout and the advantage of small popolution
In Singapore, vaccinations for people aged 60-69 is scheduled to begin in late march,
followed by the general public in April. As of 3 March, about 360,000 people have been
vaccinated as of Feb 18, which is equivalent to 6.31 doses administered per 100 people
and significantly higher than that of China and India, thanks to the country’s small
population of 5.6 million (Figure 10). While almost 13,000 doses are administered per
day, senior government officials are confident to have another one million people to take
their first dose of vaccine by early April.
Given the early success in containing the virus and the smooth rollout of vaccination,
Singpare is expected to be one of the few Asian countries with the capacity to achieve
mass inoculation in year. This is likely to make Singapore among the early candidates to
take part in international travel arrangements for “vaccine passport” holders.
Japan: Delayed rollout
Japan was later in starting the vaccination program. The Pfizer vaccine was not
approved officially until 14 February, and only 32,000 doses have been given as of
March 1, mostly frontline medical workers. Japan plans to use vaccines developed by
Pfizer, Moderna, and AstraZeneca. But the Moderna’s vaccine is not likley to get
approval until May. The program is expected to expand gradually to people aged 65 or
older in April, then to the general public in July. This calendar is likely to make relaxing
international travel arrangement difficult.
Figure 9: China and India are leading Asia in vaccine rollout
Figure 10: Singapore had a relatively smooth rollout of vaccines and a more credible plan vs other Asian markets so far
Source: Bloomberg, as of 3 March, 2021 Source: Bloomberg, as of 3 March, 2021
0
50
100
150
200
250
300
350
400
0
10000
20000
30000
40000
50000
60000
Singap
ore &
Japan
(tho
usan
ds)
Ind
ia a
nd
Ch
ina
(th
ou
san
ds)
Total Vaccine Doses Administered
India (LHS)
CHINA(LHS)
Singapore
Japan

Asia Strategy 7
Recovery opportunities in Asian Travel, Retail and Leisure
Given challenges named above, cross-border travel remains in hibernation, as are
the associated services. However, one need to only look at China’s recent Lunar
New Year holiday to get a glimpse into the future of what pent-up demand might
look like.
As early as 3Q 2020, China’s domestic tourism had already rebounded sharply, with
domestic air passenger traffic back to 90% of 2019 levels (Figure 11). Shares of local
brand names in hospitality, online travel agency (OTA), airlines and restaurants have
already enjoyed a stellar year in returns, while equities of these industries in the rest of
Asia still lagged (Figure 12).
Within the China tourism group in Figure 12, there were several noteworthy stars.
Haidilao* for example, a popular hotpot restaurant mostly in mainland China, gained
92% in 2020 as customers poured to dine-in venues after local infections become
largely under control. China Tourism Group* and Spring Airlines* advanced by 240%
and 35% respectively.
*For illustrative purposes only. This should not be construed as an offer of, or
recommendation of companies discussed.
Figure 11: Chinese airline passenger traffic: domestic routes vs international routes
Figure 12: Outside China, the catch-up in Asia tourism equities is just getting started
Source: Bloomberg, as of Feb 2021, passenger revenue data is based on leading airlines in each area.
Source: Bloomberg, as of Feb 26, 2021. Tourism includes stocks in restaurants, airlines, hotels, department stores and online tourism agents
Indices are unmanaged. An investor cannot invest directly in an index. They are shown for illustrative purposes only. Past performance is no guarantee of future returns. Real results may vary.
During the 2021 Lunar New Year holiday (Feb 11-17), Chinese authorities called for
“Celebrating in Place” to encourage residents to stay where they are and not return to
hometowns or go visiting other holiday spots, which used to drive the greatest human
migration on earth, annually.
However, the lack of intercity and international travel didn’t discourage consumption, just
redirected it to local demand in a massive way. For example, catering sales during the
week of Feb 11-17 grew 28.7%y/y and was up 4.9% even compared to the same period
of 2019. Catering related revenue at key digital payment platforms jumped 130%y/y
during the CNY holiday week. Outskirts of Shanghai and Beijing saw close to pre-
COVID level (~90%) in hotel occupation rates amid surging staycation demand. And the
national box office hit a record high for the holiday period and have already exceeded
half of the revenue made in the entire 2020.
When travel is possible again, this demand would likely also travel in an outpour
of demand for tourism and related businesses in the rest of the region. This would

Asia Strategy 8
add to the eventual recovery in local demand once COVID restrictions are largely
relaxed.
The key industries that are likely to benefit the most from this pent-up demand are
tourism, hospitality, airlines, retail and gaming.
Online tourism agents (OTA), domestic airlines and restaurants were the first to
benefit from booming consumption in China. According to the data released by a
leading OTA, Ctrip, online booking for local attractions surged more than 300% from pre-
COVID level. Average booking prices of domestic hotels in January increased by
407%y/y, as customers ratcheted up spending at luxury hotels during their staycations.
Airlines in China have already seen substantial rally as China’s domestic flights
recovered. But for airlines in HK and Singapore, “domestic flights” do not really exist.
That is why the potential travel bubble between Singapore and Hong Kong would be
critical to these airlines (Figure 13).
A traditional retail boom is likely at the resumption of traveling. Aside from
accelerating online purchases, people are longing for physical shopping experience
offline after an entire year without traveling abroad. Duty-free stores in Hainan, China
welcomed more than 200,000 predominantly domestic visitors with total sales surging to
over RMB1.5bn during this year’s holiday week, doubling from the same period of 2019.
Along similar lines, shopping demand at travel destinations may be poise for a boom
when travel resumes.
Macau, Hong Kong and Singapore may benefit first from mutual traveling
agreements, given their short distances to Mainland China and relatively stronger
capacity in controlling the disease. Macau, with majority of its visitors coming from
Mainland China and Hong Kong, has seen gradual pick up in visitor arrivals since May
last year. Even then, visitors remained at mere 17% pre-COVID level at the end of 2020
(Figure 14).
Following the news of potential travel bubbles with Guangdong and Hong Kong, shares
of Macau Casinos surged 18% in less than one month. This was after a deep drawdown
of -16% in 2020 when the broader Asia market returned 17% the same period.
Prospects are improving for Macau visitors to return to close to 80% of normal, which
should be supportive for another leg up in the sector in coming months.
Figure 13: China led the way in Airline revenue recovery, while rest of Asia remains in deep depression
Figure 14: Visitors to Macau remained at 17% pre-COVID level by end of last year
Source: Bloomberg, as of Feb 2021 Source: Bloomberg, as of Feb 2021, passenger revenue data is based on
leading airlines in each area

Asia Strategy 9
Glossary
Terms Definition
AxJ Asia ex-Japan
AFC Asian Financial Crisis (1998-99)
GFC Global Financial Crisis (2008-09)
Asset allocation definitions
Asset classes Benchmarked against
Global equities MSCI All Country World Index, which represents 48 developed and emerging equity markets. Index components are weighted by market capitalization.
Global bonds Barclays Capital Multiverse (Hedged) Index, which contains the government -related portion of the Multiverse Index, and accounts for approximately 14% of the larger index.
Hedge funds HFRX Global Hedge Fund Index, which is designed to be representative of the overall composition of the hedge fund universe. It comprises all eligible hedge fund strategies; including but not limited to convertible arbitrage, distressed securities, equity hedge, equity market neutral, event driven, macro, merger arbitrage and relative value arbitrage. The strategies are asset-weighted based on the distribution of assets in the hedge fund industry.
Commodities Dow Jones-UBS Commodity Index, which is composed of futures contracts on physical commodities traded on US exchanges, with the exception of aluminum, nickel and zinc, which trade on the London Metal Exchange (LME). The major commodity sectors are represented including energy, petroleum, precious metals, industrial metals, grains, livestock, softs, agriculture and ex-energy.
Cash Three-month LIBOR, which is the interest rates that banks charge each other in the international inter -bank market for three-month loans (usually denominated in Eurodollars).
Equities
Developed market large cap MSCI World Large Cap Index, which is free-float adjusted and weighted by market capitalization. The index is designed to measure the equity market performance of the large cap stocks in 23 developed markets. Large cap is defined as stocks representing roughly 70% of each market’s capitalization.
US Standard & Poor’s 500 Index, which is a capitalization -weighted index that includes a representative sample of 500 leading companies in leading industries of the US economy. Although the S&P 500 focuses on the large cap segment of the market, with over 80% coverage of US equities, it is also an ideal proxy for the total market.
Europe ex UK MSCI Europe ex UK Large Cap Index, which is free-float adjusted and weighted by market capitalization. The index is designed to measure large cap stock performance in each of Europe’s developed markets, except for the UK.
STOXX 600 The STOXX Europe 600 Index has a fixed number of 600 components, representing large, mid and small capitalization companies across 18 countries of the European region.
Japan MSCI Japan Large Cap Index, which is free-float adjusted and weighted by market capitalization. The index is designed to measure large cap stock performance in Japan.
Asia Pacific ex Japan
MSCI Asia Pacific ex Japan Large Cap Index, which is free-float adjusted and weighted by market capitalization. The index is designed to measure the performance of large cap stocks in Australia, Hong Kong, New Zealand and Singapore.
China & HK The MSCI China Index is a free-float weighted equity index, representing Chinese companies listed in Hong Kong, as well as American Depository Receipts listed in the US. MSCI HK Index is a free-float weighted equity index, representing HK companies listed in HK.
Emerging market MSCI Emerging Markets Index, which is free-float adjusted and weighted by market capitalization. The index is designed to measure equity market performance of 22 emerging markets.
Asia Strategy 10
Asset allocation definitions
Bonds
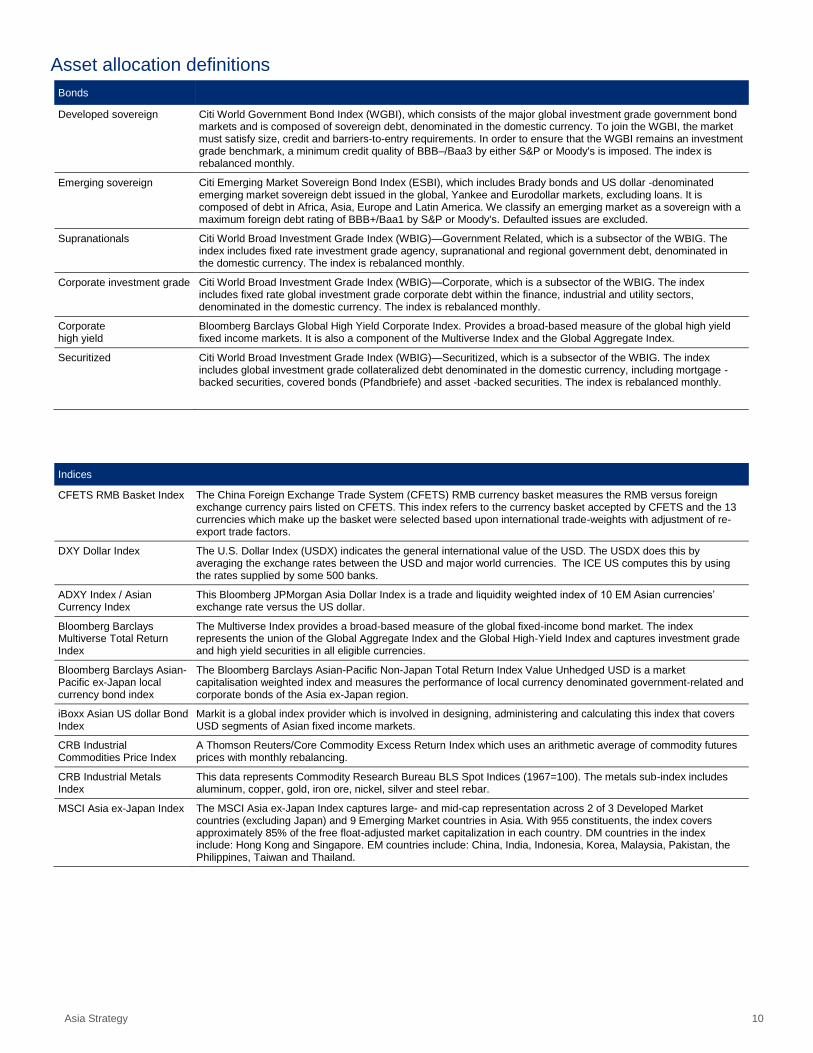
Developed sovereign Citi World Government Bond Index (WGBI), which consists of the major global investment grade government bond markets and is composed of sovereign debt, denominated in the domestic currency. To join the WGBI, the market must satisfy size, credit and barriers-to-entry requirements. In order to ensure that the WGBI remains an investment grade benchmark, a minimum credit quality of BBB–/Baa3 by either S&P or Moody's is imposed. The index is rebalanced monthly.
Emerging sovereign Citi Emerging Market Sovereign Bond Index (ESBI), which includes Brady bonds and US dollar -denominated emerging market sovereign debt issued in the global, Yankee and Eurodollar markets, excluding loans. It is composed of debt in Africa, Asia, Europe and Latin America. We classify an emerging market as a sovereign with a maximum foreign debt rating of BBB+/Baa1 by S&P or Moody's. Defaulted issues are excluded.
Supranationals Citi World Broad Investment Grade Index (WBIG)—Government Related, which is a subsector of the WBIG. The index includes fixed rate investment grade agency, supranational and regional government debt, denominated in the domestic currency. The index is rebalanced monthly.
Corporate investment grade Citi World Broad Investment Grade Index (WBIG)—Corporate, which is a subsector of the WBIG. The index includes fixed rate global investment grade corporate debt within the finance, industrial and utility sectors, denominated in the domestic currency. The index is rebalanced monthly.
Corporate high yield
Bloomberg Barclays Global High Yield Corporate Index. Provides a broad-based measure of the global high yield fixed income markets. It is also a component of the Multiverse Index and the Global Aggregate Index.
Securitized Citi World Broad Investment Grade Index (WBIG)—Securitized, which is a subsector of the WBIG. The index includes global investment grade collateralized debt denominated in the domestic currency, including mortgage -backed securities, covered bonds (Pfandbriefe) and asset -backed securities. The index is rebalanced monthly.
Indices
CFETS RMB Basket Index The China Foreign Exchange Trade System (CFETS) RMB currency basket measures the RMB versus foreign exchange currency pairs listed on CFETS. This index refers to the currency basket accepted by CFETS and the 13 currencies which make up the basket were selected based upon international trade-weights with adjustment of re-export trade factors.
DXY Dollar Index The U.S. Dollar Index (USDX) indicates the general international value of the USD. The USDX does this by averaging the exchange rates between the USD and major world currencies. The ICE US computes this by using the rates supplied by some 500 banks.
ADXY Index / Asian Currency Index
This Bloomberg JPMorgan Asia Dollar Index is a trade and liquidity weighted index of 10 EM Asian currencies’ exchange rate versus the US dollar.
Bloomberg Barclays Multiverse Total Return Index
The Multiverse Index provides a broad-based measure of the global fixed-income bond market. The index represents the union of the Global Aggregate Index and the Global High-Yield Index and captures investment grade and high yield securities in all eligible currencies.
Bloomberg Barclays Asian-Pacific ex-Japan local currency bond index
The Bloomberg Barclays Asian-Pacific Non-Japan Total Return Index Value Unhedged USD is a market capitalisation weighted index and measures the performance of local currency denominated government-related and corporate bonds of the Asia ex-Japan region.
iBoxx Asian US dollar Bond Index
Markit is a global index provider which is involved in designing, administering and calculating this index that covers USD segments of Asian fixed income markets.
CRB Industrial Commodities Price Index
A Thomson Reuters/Core Commodity Excess Return Index which uses an arithmetic average of commodity futures prices with monthly rebalancing.
CRB Industrial Metals Index
This data represents Commodity Research Bureau BLS Spot Indices (1967=100). The metals sub-index includes aluminum, copper, gold, iron ore, nickel, silver and steel rebar.
MSCI Asia ex-Japan Index The MSCI Asia ex-Japan Index captures large- and mid-cap representation across 2 of 3 Developed Market countries (excluding Japan) and 9 Emerging Market countries in Asia. With 955 constituents, the index covers approximately 85% of the free float-adjusted market capitalization in each country. DM countries in the index include: Hong Kong and Singapore. EM countries include: China, India, Indonesia, Korea, Malaysia, Pakistan, the Philippines, Taiwan and Thailand.

Asia Strategy 11
Disclosures
In any instance where distribution of this communication (“Communication”) is subject to the rules of the US Commodity Futures Trading Commission (“CFTC”), this communication constitutes an invitation to consider entering into a derivatives transaction under US CFTC Regulations §§ 1.71 and 23.605, where applicable, but is not a binding offer to buy/sell any financial instrument.
This Communication is prepared by Citi Private Bank (“CPB”), a business of Citigroup, Inc. (“Citigroup”), which provides its clients access to a broad array of products and services available through Citigroup, its bank and non-bank affiliates worldwide (collectively, “Citi”). Not all products and services are provided by all affiliates, or are available at all locations.
CPB personnel are not research analysts, and the information in this Communication is not intended to constitute “research”, as that term is defined by applicable regulations. Unless otherwise indicated, any reference to a research report or research recommendation is not intended to represent the whole report and is not in itself considered a recommendation or research report.
This Communication is provided for information and discussion purposes only, at the recipient’s request. The recipient should notify CPB immediately should it at any time wish to cease being provided with such information. Unless otherwise indicated, (i) it does not constitute an offer or recommendation to purchase or sell any security, financial instrument or other product or service, or to attract any funding or deposits, and (ii) it does not constitute a solicitation if it is not subject to the rules of the CFTC (but see discussion above regarding communication subject to CFTC rules) and (iii) it is not intended as an official confirmation of any transaction.
Unless otherwise expressly indicated, this Communication does not take into account the investment objectives, risk profile or financial situation of any particular person and as such, investments mentioned in this document may not be suitable for all investors. Citi is not acting as an investment or other advisor, fiduciary or agent. The information contained herein is not intended to be an exhaustive discussion of the strategies or concepts mentioned herein or tax or legal advice. Recipients of this Communication should obtain advice based on their own individual circumstances from their own tax, financial, legal and other advisors about the risks and merits of any transaction before making an investment decision, and only make such decisions on the basis of their own objectives, experience, risk profile and resources.
The information contained in this Communication is based on generally available information and, although obtained from sources believed by Citi to be reliable, its accuracy and completeness cannot be assured, and such information may be incomplete or condensed. Any assumptions or information contained in this Communication constitute a judgment only as of the date of this document or on any specified dates and is subject to change without notice. Insofar as this Communication may contain historical and forward looking information, past performance is neither a guarantee nor an indication of future results, and future results may not meet expectations due to a variety of economic, market and other factors. Further, any projections of potential risk or return are illustrative and should not be taken as limitations of the maximum possible loss or gain. Any prices, values or estimates provided in this Communication (other than those that are identified as being historical) are indicative only, may change without notice and do not represent firm quotes as to either price or size, nor reflect the value Citi may assign a security in its inventory. Forward looking information does not indicate a level at which Citi is prepared to do a trade and may not account for all relevant assumptions and future conditions. Actual conditions may vary substantially from estimates which could have a negative impact on the value of an instrument.
Views, opinions and estimates expressed herein may differ from the opinions expressed by other Citi businesses or affiliates, and are not intended to be a forecast of future events, a guarantee of future results, or investment advice, and are subject to change without notice based on market and other conditions. Citi is under no duty to update this document and accepts no liability for any loss (whether direct, indirect or consequential) that may arise from any use of the information contained in or derived from this Communication.
Investments in financial instruments or other products carry significant risk, including the possible loss of the principal amount invested. Financial instruments or other products denominated in a foreign currency are subject to exchange rate fluctuations, which may have an adverse effect on the price or value of an investment in such products. This Communication does not purport to identify all risks or material considerations which may be associated with entering into any transaction.
Structured products can be highly illiquid and are not suitable for all investors. Additional information can be found in the disclosure documents of the issuer for each respective structured product described herein. Investing in structured products is intended only for experienced and sophisticated investors who are willing and able to bear the high economic risks of such an investment. Investors should carefully review and consider potential risks before investing.
OTC derivative transactions involve risk and are not suitable for all investors. Investment products are not insured, carry no bank or government guarantee and may lose value. Before entering into these transactions, you should: (i) ensure that you have obtained and considered relevant information from independent reliable sources concerning the financial, economic and political conditions of the relevant markets; (ii) determine that you have the necessary knowledge, sophistication and experience in financial, business and investment matters to be able to evaluate the risks involved, and that you are financially able to bear such risks; and (iii) determine, having considered the foregoing points, that capital markets transactions are suitable and appropriate for your financial, tax, business and investment objectives.
This material may mention options regulated by the US Securities and Exchange Commission. Before buying or selling options you should obtain and review the current version of the Options Clearing Corporation booklet, Characteristics and Risks of Standardized Options. A copy of the booklet can be obtained upon request from Citigroup Global Markets Inc., 390 Greenwich Street, 3rd Floor, New York, NY 10013 or by clicking the following links,
http://www.theocc.com/components/docs/riskstoc.pdf and http://www.theocc.com/components/docs/about/publications/november_2012_supplement.pdf and https://www.theocc.com/components/docs/about/publications/october_2018_supplement.pdf
If you buy options, the maximum loss is the premium. If you sell put options, the risk is the entire notional below the strike. If you sell call options, the risk is unlimited. The actual profit or loss from any trade will depend on the price at which the trades are executed. The prices used herein are historical and may not be available when you order is entered. Commissions and other transaction costs are not considered in these examples. Option trades in general and these trades in particular may not be appropriate for every investor. Unless noted otherwise, the source of all graphs and tables in this report is Citi. Because of the importance of tax considerations to all option transactions, the investor considering options should consult with his/her tax advisor as to how their tax situation is affected by the outcome of contemplated options transactions.
None of the financial instruments or other products mentioned in this Communication (unless expressly stated otherwise) is (i) insured by the Federal Deposit Insurance Corporation or any other governmental authority, or (ii) deposits or other obligations of, or guaranteed by, Citi or any other insured depository institution.
Citi often acts as an issuer of financial instruments and other products, acts as a market maker and trades as principal in many different financial instruments and other products, and can be expected to perform or seek to perform investment banking and other services for the issuer of such financial instruments or other products. The author of this Communication may have discussed the information contained therein with others within or outside Citi, and the author and/or such other Citi personnel may have already acted on the basis of this information (including by trading for Citi's proprietary accounts or communicating the information contained herein to other customers of Citi). Citi, Citi's personnel (including those with whom the author may have consulted in the preparation of this communication), and other customers of Citi may be long or short the financial instruments or

Asia Strategy 12
other products referred to in this Communication, may have acquired such positions at prices and market conditions that are no longer available, and may have interests different from or adverse to your interests.
IRS Circular 230 Disclosure: Citi and its employees are not in the business of providing, and do not provide, tax or legal advice to any taxpayer outside Citi. Any statement in this Communication regarding tax matters is not intended or written to be used, and cannot be used or relied upon, by any taxpayer for the purpose of avoiding tax penalties. Any such taxpayer should seek advice based on the taxpayer’s particular circumstances from an independent tax advisor.
Neither Citi nor any of its affiliates can accept responsibility for the tax treatment of any investment product, whether or not the investment is purchased by a trust or company administered by an affiliate of Citi. Citi assumes that, before making any commitment to invest, the investor and (where applicable, its beneficial owners) have taken whatever tax, legal or other advice the investor/beneficial owners consider necessary and have arranged to account for any tax lawfully due on the income or gains arising from any investment product provided by Citi.
This Communication is for the sole and exclusive use of the intended recipients, and may contain information proprietary to Citi which may not be reproduced or circulated in whole or in part without Citi’s prior consent. The manner of circulation and distribution may be restricted by law or regulation in certain countries. Persons who come into possession of this document are required to inform themselves of, and to observe such restrictions. Citi accepts no liability whatsoever for the actions of third parties in this respect. Any unauthorized use, duplication, or disclosure of this document is prohibited by law and may result in prosecution.
Other businesses within Citigroup Inc. and affiliates of Citigroup Inc. may give advice, make recommendations, and take action in the interest of their clients, or for their own accounts, that may differ from the views expressed in this document. All expressions of opinion are current as of the date of this document and are subject to change without notice. Citigroup Inc. is not obligated to provide updates or changes to the information contained in this document.
The expressions of opinion are not intended to be a forecast of future events or a guarantee of future results. Past performance is not a guarantee of future results. Real results may vary.
Although information in this document has been obtained from sources believed to be reliable, Citigroup Inc. and its affiliates do not guarantee its accuracy or completeness and accept no liability for any direct or consequential losses arising from its use. Throughout this publication where charts indicate that a third party (parties) is the source, please note that the attributed may refer to the raw data received from such parties. No part of this document may be copied, photocopied or duplicated in any form or by any means, or distributed to any person that is not an employee, officer, director, or authorized agent of the recipient without Citigroup Inc.’s prior written consent.
Citigroup Inc. may act as principal for its own account or as agent for another person in connection with transactions placed by Citigroup Inc. for its clients involving securities that are the subject of this document or future editions of the Quadrant.
Bonds are affected by a number of risks, including fluctuations in interest rates, credit risk and prepayment risk. In general, as prevailing interest rates rise, fixed income securities prices will fall. Bonds face credit risk if a decline in an issuer’s credit rating, or creditworthiness, causes a bond’s price to decline. High yield bonds are subject to additional risks such as increased risk of default and greater volatility because of the lower credit quality of the issues. Finally, bonds can be subject to prepayment risk. When interest rates fall, an issuer may choose to borrow money at a lower interest rate, while paying off its previously issued bonds. As a consequence, underlying bonds will lose the interest payments from the investment and will be forced to reinvest in a market where prevailing interest rates are lower than when the initial investment was made.
(MLP’s) - Energy Related MLPs May Exhibit High Volatility. While not historically very volatile, in certain market environments Energy Related MLPS may exhibit high volatility.
Changes in Regulatory or Tax Treatment of Energy Related MLPs. If the IRS changes the current tax treatment of the master limited partnerships included in the Basket of Energy Related MLPs thereby subjecting them to higher rates of taxation, or if other regulatory authorities enact regulations which negatively affect the ability of the master limited partnerships to generate income or distribute dividends to holders of common units, the return on the Notes, if any, could be dramatically reduced. Investment in a basket of Energy Related MLPs may expose the investor to concentration risk due to industry, geographical, political, and regulatory concentration.
Mortgage-backed securities ("MBS"), which include collateralized mortgage obligations ("CMOs"), also referred to as real estate mortgage investment conduits ("REMICs"), may not be suitable for all investors. There is the possibility of early return of principal due to mortgage prepayments, which can reduce expected yield and result in reinvestment risk. Conversely, return of principal may be slower than initial prepayment speed assumptions, extending the average life of the security up to its listed maturity date (also referred to as extension risk).
Additionally, the underlying collateral supporting non-Agency MBS may default on principal and interest payments. In certain cases, this could cause the income stream of the security to decline and result in loss of principal. Further, an insufficient level of credit support may result in a downgrade of a mortgage bond's credit rating and lead to a higher probability of principal loss and increased price volatility. Investments in subordinated MBS involve greater credit risk of default than the senior classes of the same issue. Default risk may be pronounced in cases where the MBS security is secured by, or evidencing an interest in, a relatively small or less diverse pool of underlying mortgage loans.
Asia Strategy 13
MBS are also sensitive to interest rate changes which can negatively impact the market value of the security. During times of heightened volatility, MBS can experience greater levels of illiquidity and larger price movements. Price volatility may also occur from other factors including, but not limited to, prepayments, future prepayment expectations, credit concerns, underlying collateral performance and technical changes in the market.
Alternative investments referenced in this report are speculative and entail significant risks that can include losses due to leveraging or other speculative investment practices, lack of liquidity, volatility of returns, restrictions on transferring interests in the fund, potential lack of diversification, absence of information regarding valuations and pricing, complex tax structures and delays in tax reporting, less regulation and higher fees than mutual funds and advisor risk.
Asset allocation does not assure a profit or protect against a loss in declining financial markets.
The indexes are unmanaged. An investor cannot invest directly in an index. They are shown for illustrative purposes only and do not represent the performance of any specific investment. Index returns do not include any expenses, fees or sales charges, which would lower performance.
Past performance is no guarantee of future results.
International investing entails greater risk, as well as greater potential rewards compared to US investing. These risks include political and economic uncertainties of foreign countries as well as the risk of currency fluctuations. These risks are magnified in countries with emerging markets, since these countries may have relatively unstable governments and less established markets and economics.
Investing in smaller companies involves greater risks not associated with investing in more established companies, such as business risk, significant stock price fluctuations and illiquidity.
Factors affecting commodities generally, index components composed of futures contracts on nickel or copper, which are industrial metals, may be subject to a number of additional factors specific to industrial metals that might cause price volatility. These include changes in the level of industrial activity using industrial metals (including the availability of substitutes such as manmade or synthetic substitutes); disruptions in the supply chain, from mining to storage to smelting or refining; adjustments to inventory; variations in production costs, including storage, labor and energy costs; costs associated with regulatory compliance, including environmental regulations; and changes in industrial, government and consumer demand, both in individual consuming nations and internationally. Index components concentrated in futures contracts on agricultural products, including grains, may be subject to a number of additional factors specific to agricultural products that might cause price volatility. These include weather conditions, including floods, drought and freezing conditions; changes in government policies; planting decisions; and changes in demand for agricultural products, both with end users and as inputs into various industries.
The information contained herein is not intended to be an exhaustive discussion of the strategies or concepts mentioned herein or tax or legal advice. Readers interested in the strategies or concepts should consult their tax, legal, or other advisors, as appropriate.
Diversification does not guarantee a profit or protect against loss. Different asset classes present different risks.
Citi Private Bank is a business of Citigroup Inc. (“Citigroup”), which provides its clients access to a broad array of products and services available through bank and non-bank affiliates of Citigroup. Not all products and services are provided by all affiliates or are available at all locations. In the U.S., investment products and services are provided by Citigroup Global Markets Inc. (“CGMI”), member FINRA and SIPC, and Citi Private Advisory, LLC (“Citi Advisory”), member FINRA and SIPC. CGMI accounts are carried by Pershing LLC, member FINRA, NYSE, SIPC. Citi Advisory acts as distributor of certain alternative investment products to clients of Citi Private Bank. CGMI, Citi Advisory and Citibank, N.A. are affiliated companies under the common control of Citigroup.
Outside the U.S., investment products and services are provided by other Citigroup affiliates. Investment Management services (including portfolio management) are available through CGMI, Citi Advisory, Citibank, N.A. and other affiliated advisory businesses. These Citigroup affiliates, including Citi Advisory, will be compensated for the respective investment management, advisory, administrative, distribution and placement services they may provide.
Citibank, N.A., Hong Kong / Singapore organised under the laws of U.S.A. with limited liability. This communication is distributed in Hong Kong by Citi Private Bank operating through Citibank N.A., Hong Kong Branch, which is registered in Hong Kong with the Securities and Futures Commission for Type 1 (dealing in securities), Type 4 (advising on securities), Type 6 (advising on corporate finance) and Type 9 (asset management) regulated activities with CE No: (AAP937) or in Singapore by Citi Private Bank operating through Citibank, N.A., Singapore Branch which is regulated by the Monetary Authority of Singapore. Any questions in connection with the contents in this communication should be directed to registered or licensed representatives of the relevant aforementioned entity. The contents of this communication have not been reviewed by any regulatory authority in Hong Kong or any regulatory authority in Singapore. This communication contains confidential and proprietary information and is intended only for recipient in accordance with accredited investors requirements in Singapore (as defined under the Securities and Futures Act (Chapter 289 of Singapore) (the “Act” )) and professional investors requirements in Hong Kong(as defined under the Hong Kong Securities and Futures Ordinance and its subsidiary legislation). For regulated asset management services, any mandate will be entered into only with Citibank, N.A., Hong Kong Branch and/or Citibank, N.A. Singapore Branch, as applicable. Citibank, N.A., Hong Kong Branch or Citibank, N.A., Singapore Branch may sub-delegate all or part of its mandate to another Citigroup affiliate or other branch of Citibank, N.A. Any references to named portfolio managers are for your information only, and this communication shall not be construed to be an offer to enter into any portfolio management mandate with any other Citigroup affiliate or other branch of Citibank, N.A. and, at no time will any other Citigroup affiliate or other branch of Citibank, N.A. or any other Citigroup affiliate enter into a mandate relating to the above portfolio with you. To the extent this communication is provided to clients who are booked and/or managed in Hong Kong: No other statement(s) in this communication shall operate to remove, exclude or restrict any of your rights or obligations of Citibank under applicable laws and regulations. Citibank, N.A., Hong Kong Branch does not intend to rely on any provisions herein which are inconsistent with its obligations under the Code of Conduct for Persons Licensed by or Registered with the Securities and Futures Commission, or which mis-describes the actual services to be provided to you.
Citibank, N.A. is incorporated in the United States of America and its principal regulators are the US Office of the Comptroller of Currency and Federal Reserve under US laws, which differ from Australian laws. Citibank, N.A. does not hold an Australian Financial Services Licence under the Corporations Act 2001 as it enjoys the benefit of an exemption under ASIC Class Order CO 03/1101 (remade as ASIC Corporations (Repeal and Transitional) Instrument 2016/396 and extended by ASIC Corporations (Amendment) Instrument 2020/200).
In the United Kingdom, Citibank N.A., London Branch (registered branch number BR001018), Citigroup Centre, Canada Square, Canary Wharf, London, E14 5LB, is authorised and regulated by the Office of the Comptroller of the Currency (USA) and authorised by the Prudential Regulation Authority. Subject to regulation by the Financial Conduct Authority and limited regulation by the Prudential Regulation Authority. Details about the extent of our regulation by the Prudential Regulation Authority are available from us on request. The contact number for Citibank N.A., London Branch is +44 (0)20 7508 8000.
Citibank Europe plc is registered in Ireland with company registration number 132781. It is regulated by the Central Bank of Ireland under the reference number C26553 and supervised by the European Central Bank. Its registered office is at 1 North Wall Quay, Dublin 1, Ireland. Ultimately owned by Citigroup Inc., New York, USA. Citibank Europe plc, UK Branch is registered as a branch in the register of companies for England and Wales with registered branch number BR017844. Its registered address is Citigroup Centre, Canada Square, Canary Wharf, London E14 5LB. VAT No.: GB 429 6256 29. It is authorised by the Central Bank of Ireland and by the Prudential Regulation Authority. It is subject to supervision by the Central Bank of

Asia Strategy 14
Ireland, and subject to limited regulation by the Financial Conduct Authority and the Prudential Regulation Authority. Details about the extent of our authorisation and regulation by the Prudential Regulation Authority, and regulation by the Financial Conduct Authority are available from us on request.
Citibank Europe plc, Luxembourg Branch is a branch of Citibank Europe plc with trade and companies register number B 200204. It is authorised in Luxembourg and supervised by the Commission de Surveillance du Secteur Financier. It appears on the Commission de Surveillance du Secteur Financier register with company number B00000395. Its business office is at 31, Z.A. Bourmicht, 8070 Bertrange, Grand Duchy of Luxembourg. Citibank Europe plc is registered in Ireland with company registration number 132781. It is regulated by the Central Bank of Ireland under the reference number C26553 and supervised by the European Central Bank. Its registered office is at 1 North Wall Quay, Dublin 1, Ireland.
In Jersey, this document is communicated by Citibank N.A., Jersey Branch which has its registered address at PO Box 104, 38 Esplanade, St Helier, Jersey JE4 8QB. Citibank N.A., Jersey Branch is regulated by the Jersey Financial Services Commission. Citibank N.A. Jersey Branch is a participant in the Jersey Bank Depositors Compensation Scheme. The Scheme offers protection for eligible deposits of up to £50,000. The maximum total amount of compensation is capped at £100,000,000 in any 5 year period. Full details of the Scheme and banking groups covered are available on the States of Jersey website www.gov.je/dcs, or on request.
In Canada, Citi Private Bank is a division of Citibank Canada, a Schedule II Canadian chartered bank. References herein to Citi Private Bank and its activities in Canada relate solely to Citibank Canada and do not refer to any affiliates or subsidiaries of Citibank Canada operating in Canada. Certain investment products are made available through Citibank Canada Investment Funds Limited (“CCIFL”), a wholly owned subsidiary of Citibank Canada. Investment Products are subject to investment risk, including possible loss of principal amount invested. Investment Products are not insured by the CDIC, FDIC or depository insurance regime of any jurisdiction and are not guaranteed by Citigroup or any affiliate thereof.
CCIFL is not currently a member, and does not intend to become a member of the Mutual Fund Dealers Association of Canada (“MFDA”); consequently, clients of CCIFL will not have available to them investor protection benefits that would otherwise derive from membership of CCIFL in the MFDA, including coverage under any investor protection plan for clients of members of the MFDA.
This document is for information purposes only and does not constitute an offer to sell or a solicitation of an offer to buy any securities to any person in any jurisdiction. The information set out herein may be subject to updating, completion, revision, verification and amendment and such information may change materially.
Citigroup, its affiliates and any of the officers, directors, employees, representatives or agents shall not be held liable for any direct, indirect, incidental, special, or consequential damages, including loss of profits, arising out of the use of information contained herein, including through errors whether caused by negligence or otherwise.
© 2021 Citigroup Inc. Citi, Citi and Arc Design and other marks used herein are service marks of Citigroup Inc. or its affiliates, used and registered throughout the world.