Asia Pacific: Korea Healthcare Outlook 2010
43
P3B5-54 April 2010 Asia Pacific Healthcare Outlook Focus : South Korea Analysis of Best Opportunities
-
Upload
frost-sullivan -
Category
Health & Medicine
-
view
4.697 -
download
4
Transcript of Asia Pacific: Korea Healthcare Outlook 2010

P3B5-54
April 2010
Asia Pacific Healthcare Outlook
Focus : South Korea Analysis of Best Opportunities
2P3B5-54
Disclaimer
• Frost & Sullivan takes no responsibility for the incorrect information supplied to us by manufacturers or users.
• Quantitative market information is based primarily on interviews and therefore, is subject to fluctuation.
• Frost & Sullivan Research Services are limited publications containing valuable market information provided to a select group of customers in response to orders. Our customers acknowledge, when ordering, that Frost & Sullivan Research Services are for customers’ internal use and not for general publication or disclosure to third parties.
• No part of this Research Service may be given, lent, resold, or disclosed to non-customers without written permission.
• Furthermore, no part may be reproduced, stored in a retrieval system, or transmitted in any form or by any means, electronic, mechanical, photocopying, recording or otherwise, without the permission of the publisher.
• For information regarding permission, write to:
Frost & Sullivan GIC Malaysia Sdn. Bhd.
Suite E-08-15, Block E
Plaza Mont’ Kiara
2 Jalan Kiara, Mont’ Kiara
50480 Kuala Lumpur.
© 2010 Frost & Sullivan. All rights reserved. This document contains highly confidential information and is the sole property of Frost & Sullivan. No part of it may be circulated, quoted, copied or otherwise reproduced without the written approval of Frost & Sullivan.
3P3B5-54
Certification
• We hereby certify that the views expressed in this research service accurately reflect our views based on primary
and secondary research with industry participants, industry experts, end users, regulatory organizations, financial
and investment community, and other related sources.
• In addition to the above, our robust in-house forecast & benchmarking models along with the Frost & Sullivan
Decision Support Databases have been instrumental in the completion and publishing of this research service.
• We also certify that no part of our analyst compensation was, is or will be, directly or indirectly, related to the
specific recommendations or views expressed in this research service.
4P3B5-54
TABLE OF CONTENT
1. Overview of Healthcare Market : Key Takeaways
• Setting the Scene: Outlook for Healthcare Industry from 2010-12
• Global vs. APAC: The New Frontier
2. In-depth Sectoral Analysis, APAC and South Korea
• APAC Pharmaceuticals & Biotechnology Market
• South Korea Pharmaceuticals & Biotechnology Market
• Top Growth Opportunities : S. Korea Pharmaceuticals and Biotech Market
• APAC Medical Equipment Market
• South Korea Medical Equipment Market
• Top Growth Opportunities : S Korea Medical Equipment Market
• APAC Lifesciences and Health IT Market
• South Korea Health IT Market
• Top Growth Opportunities : South Korea Health IT Market
3. Summary : Best Opportunity Analysis, APAC and South Korea
• Where to place your bets in APAC: 2010- 2012
• Where to place your bets in S. Korea : 2010- 2012
5P3B5-54
TABLE OF CONTENT
4. Decision Support Database
• Total Health Expenditure
• Private Health Expenditure
• Government Health Expenditure
• Percent Healthcare Expenditure in GDP
• Population Aged Above 65
5. About Frost & Sullivan

6
Overview of Healthcare Market : Key Takeaways
7P3B5-54
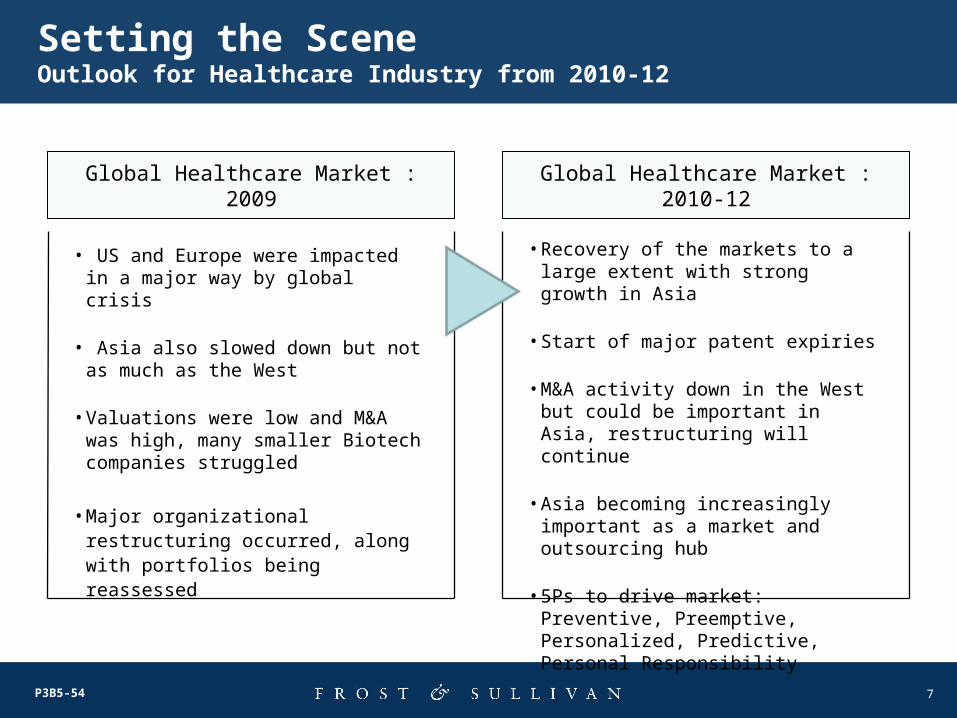
Setting the Scene Outlook for Healthcare Industry from 2010-12
Global Healthcare Market : 2009
• US and Europe were impacted in a major way by global crisis
• Asia also slowed down but not as much as the West
• Valuations were low and M&A was high, many smaller Biotech companies struggled
• Major organizational restructuring occurred, along with portfolios being reassessed
Global Healthcare Market : 2010-12
• Recovery of the markets to a large extent with strong growth in Asia
• Start of major patent expiries
• M&A activity down in the West but could be important in Asia, restructuring will continue
• Asia becoming increasingly important as a market and outsourcing hub
• 5Ps to drive market: Preventive, Preemptive, Personalized, Predictive, Personal Responsibility
8P3B5-54
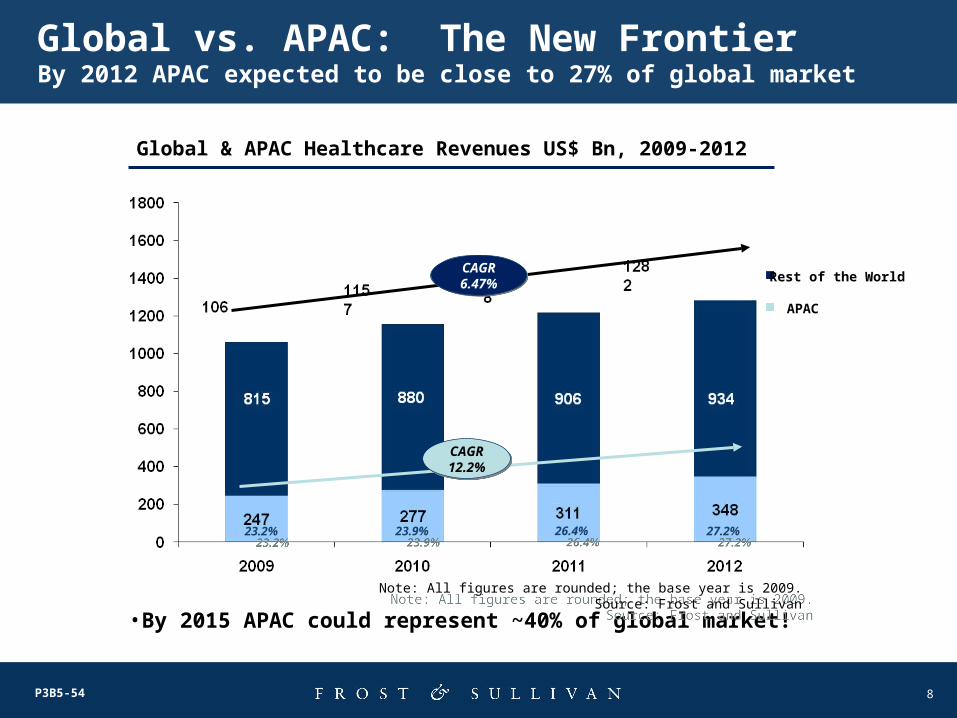
Global vs. APAC: The New FrontierBy 2012 APAC expected to be close to 27% of global market
23.9%23.9%
27.2%27.2%
23.2%23.2%
26.4%26.4%
CAGR12.2%CAGR12.2%
CAGR6.47%CAGR6.47%
Global & APAC Healthcare Revenues US$ Bn, 2009-2012
• By 2015 APAC could represent ~40% of global market!
Rest of the World
APAC
Note: All figures are rounded; the base year is 2009. Source: Frost and SullivanNote: All figures are rounded; the base year is 2009. Source: Frost and Sullivan
9P3B5-54
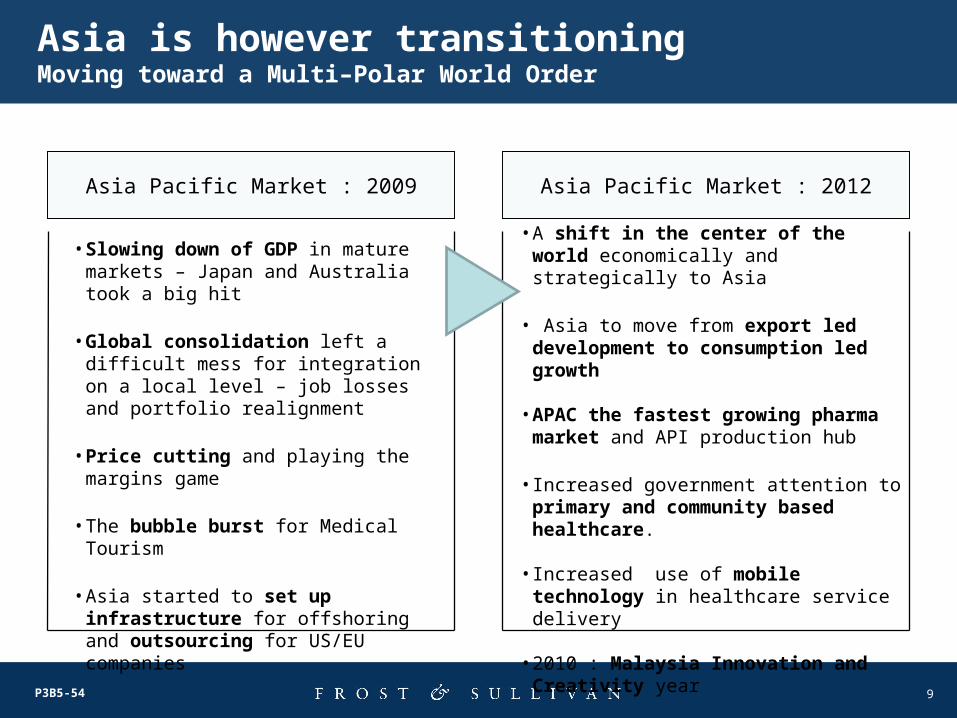
Asia is however transitioningMoving toward a Multi–Polar World Order
Asia Pacific Market : 2009
• Slowing down of GDP in mature markets – Japan and Australia took a big hit
• Global consolidation left a difficult mess for integration on a local level – job losses and portfolio realignment
• Price cutting and playing the margins game
• The bubble burst for Medical Tourism
• Asia started to set up infrastructure for offshoring and outsourcing for US/EU companies
Asia Pacific Market : 2012
• A shift in the center of the world economically and strategically to Asia
• Asia to move from export led development to consumption led growth
• APAC the fastest growing pharma market and API production hub
• Increased government attention to primary and community based healthcare.
• Increased use of mobile technology in healthcare service delivery
• 2010 : Malaysia Innovation and Creativity year
10
In-depth Sectoral Analysis, APAC and South Korea
11P3B5-54
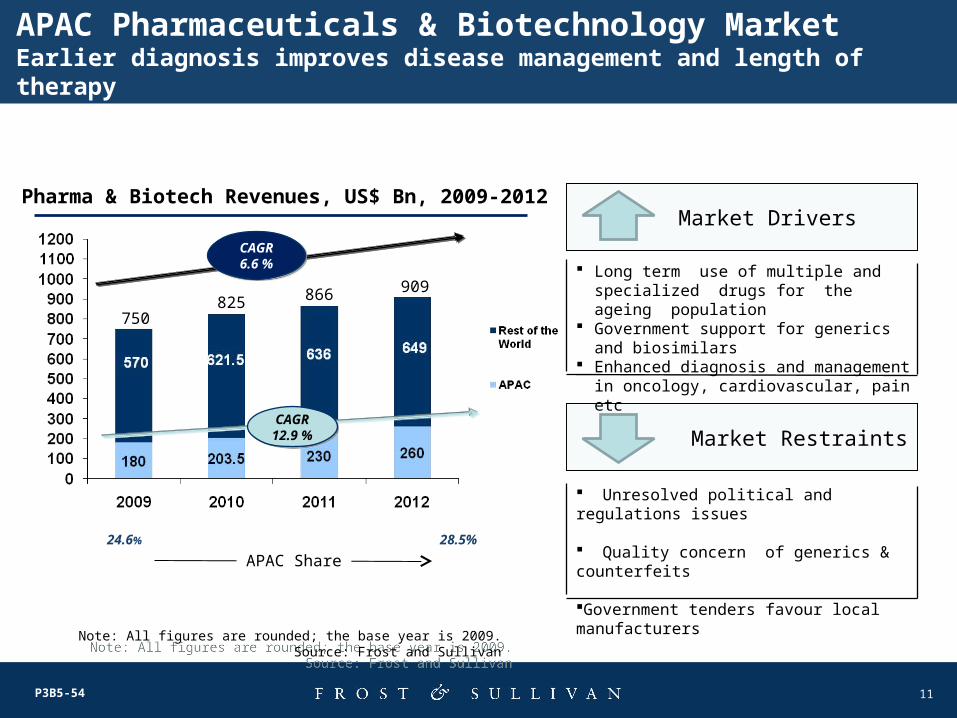
APAC Pharmaceuticals & Biotechnology MarketEarlier diagnosis improves disease management and length of therapy
Note: All figures are rounded; the base year is 2009. Source: Frost and SullivanNote: All figures are rounded; the base year is 2009. Source: Frost and Sullivan
Market Drivers
Market Restraints
Long term use of multiple and specialized drugs for the ageing population
Government support for generics and biosimilars
Enhanced diagnosis and management in oncology, cardiovascular, pain etc
Unresolved political and regulations issues Quality concern of generics & counterfeits
Government tenders favour local manufacturers
24.6% 28.5%
CAGR6.6 %
CAGR6.6 %
CAGR12.9 %CAGR12.9 %
Pharma & Biotech Revenues, US$ Bn, 2009-2012
APAC Share
750825 866 909
12P3B5-54
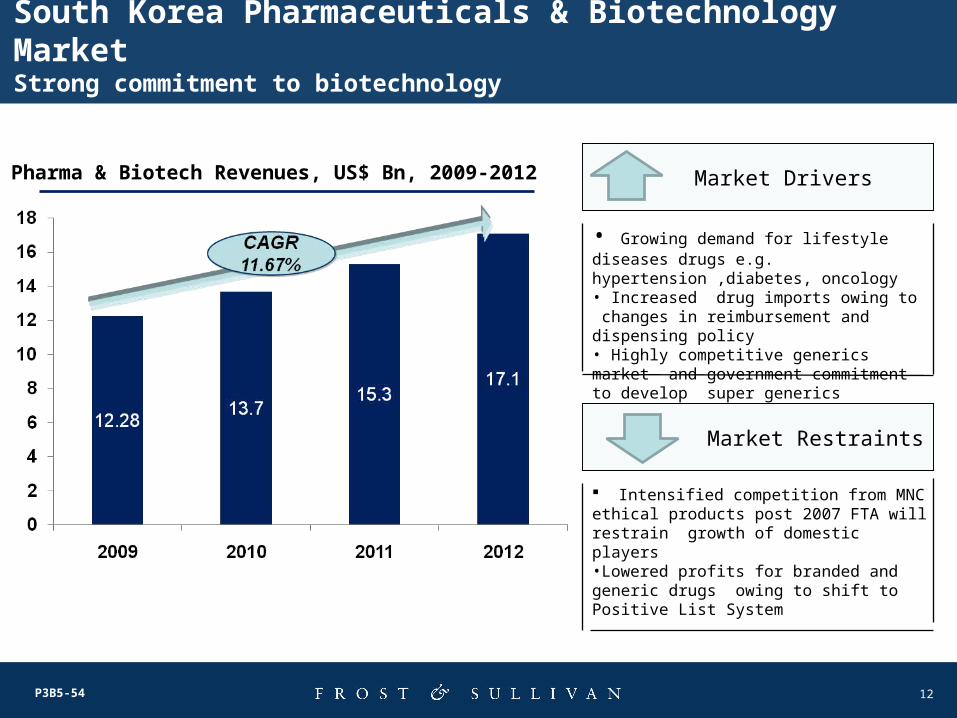
South Korea Pharmaceuticals & Biotechnology MarketStrong commitment to biotechnology
Pharma & Biotech Revenues, US$ Bn, 2009-2012 Market Drivers
Market Restraints
Intensified competition from MNC ethical products post 2007 FTA will restrain growth of domestic players•Lowered profits for branded and generic drugs owing to shift to Positive List System
• Growing demand for lifestyle diseases drugs e.g. hypertension ,diabetes, oncology• Increased drug imports owing to changes in reimbursement and dispensing policy• Highly competitive generics market and government commitment to develop super generics
13P3B5-54
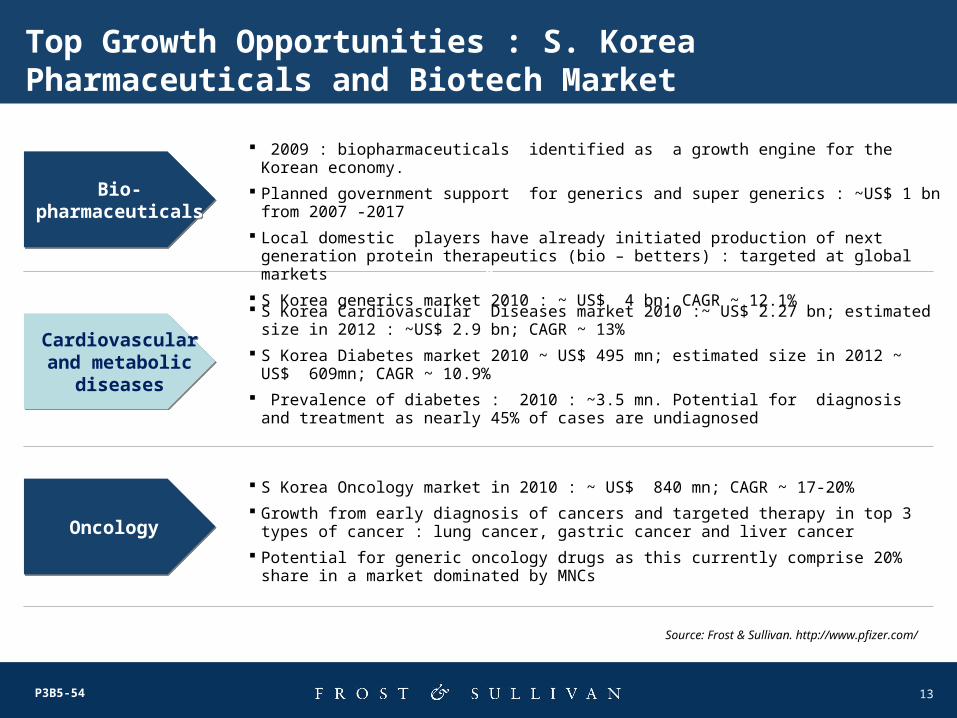
S Korea Cardiovascular Diseases market 2010 :~ US$ 2.27 bn; estimated size in 2012 : ~US$ 2.9 bn; CAGR ~ 13%
S Korea Diabetes market 2010 ~ US$ 495 mn; estimated size in 2012 ~ US$ 609mn; CAGR ~ 10.9%
Prevalence of diabetes : 2010 : ~3.5 mn. Potential for diagnosis and treatment as nearly 45% of cases are undiagnosed
0
0
Source: Frost & Sullivan. http://www.pfizer.com/
Bio-pharmaceuticals
Bio-pharmaceuticals
Cardiovascular and metabolic
diseases
Cardiovascular and metabolic
diseases
Oncology Oncology
S Korea Oncology market in 2010 : ~ US$ 840 mn; CAGR ~ 17-20%
Growth from early diagnosis of cancers and targeted therapy in top 3 types of cancer : lung cancer, gastric cancer and liver cancer
Potential for generic oncology drugs as this currently comprise 20% share in a market dominated by MNCs
Top Growth Opportunities : S. Korea Pharmaceuticals and Biotech Market
2009 : biopharmaceuticals identified as a growth engine for the Korean economy.
Planned government support for generics and super generics : ~US$ 1 bn from 2007 -2017
Local domestic players have already initiated production of next generation protein therapeutics (bio – betters) : targeted at global markets
S Korea generics market 2010 : ~ US$ 4 bn; CAGR ~ 12.1%
14P3B5-54
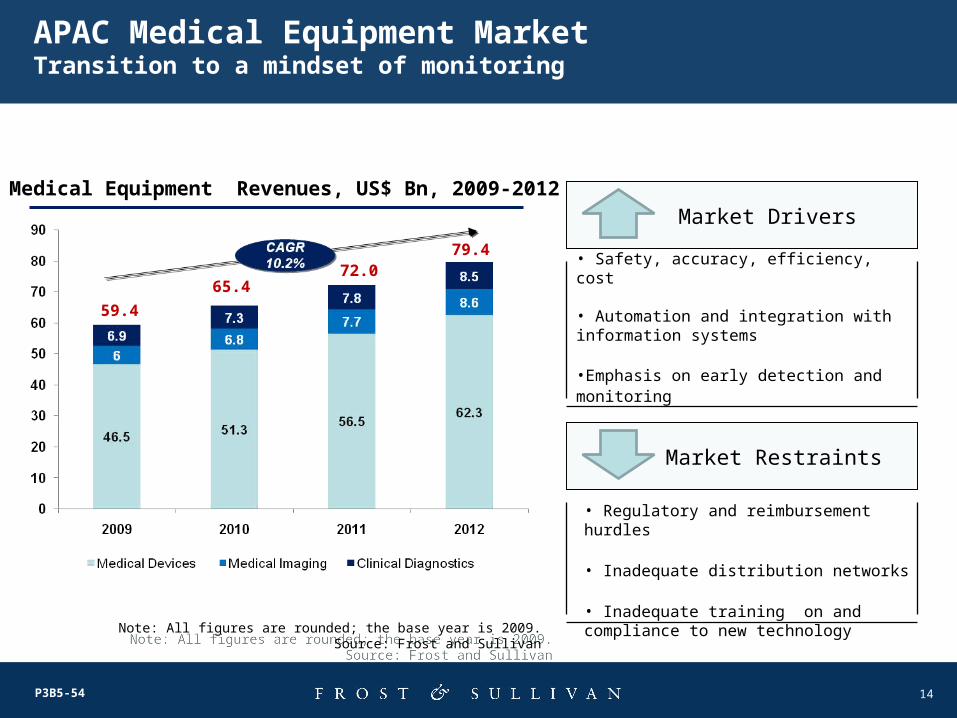
APAC Medical Equipment MarketTransition to a mindset of monitoring
Medical Equipment Revenues, US$ Bn, 2009-2012
59.4
65.472.0
79.4
Note: All figures are rounded; the base year is 2009. Source: Frost and SullivanNote: All figures are rounded; the base year is 2009. Source: Frost and Sullivan
Market Drivers
• Safety, accuracy, efficiency, cost
• Automation and integration with information systems
•Emphasis on early detection and monitoring
•Silver industry requirements
Market Restraints
• Regulatory and reimbursement hurdles
• Inadequate distribution networks
• Inadequate training on and compliance to new technology
15P3B5-54
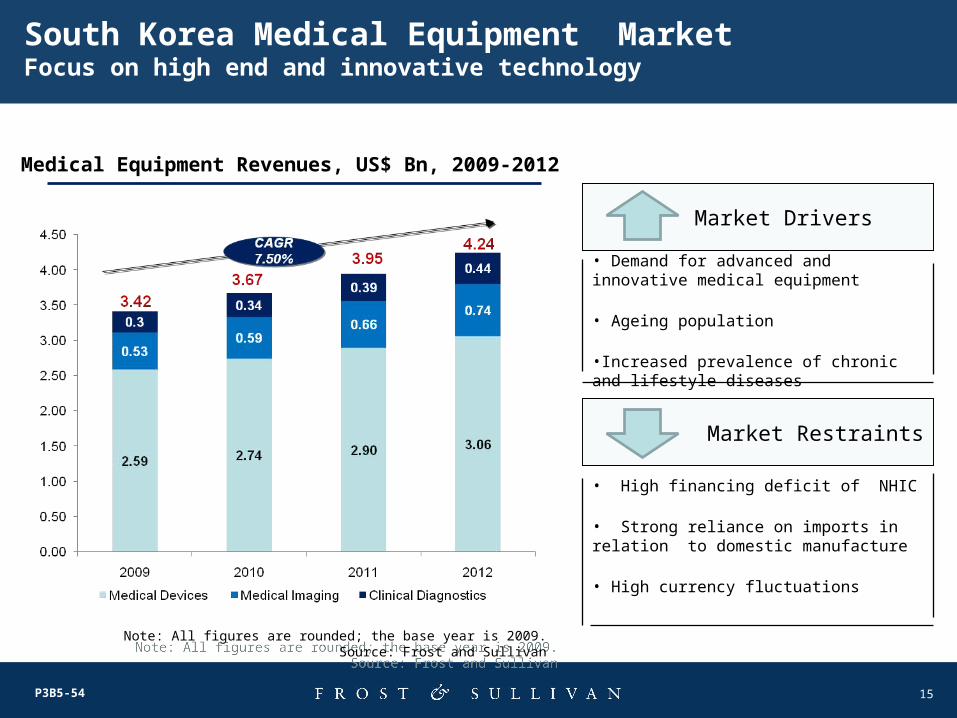
South Korea Medical Equipment MarketFocus on high end and innovative technology
Medical Equipment Revenues, US$ Bn, 2009-2012
Market Drivers
Market Restraints
• Demand for advanced and innovative medical equipment
• Ageing population
•Increased prevalence of chronic and lifestyle diseases
• High financing deficit of NHIC
• Strong reliance on imports in relation to domestic manufacture
• High currency fluctuations
Note: All figures are rounded; the base year is 2009. Source: Frost and SullivanNote: All figures are rounded; the base year is 2009. Source: Frost and Sullivan
16P3B5-54
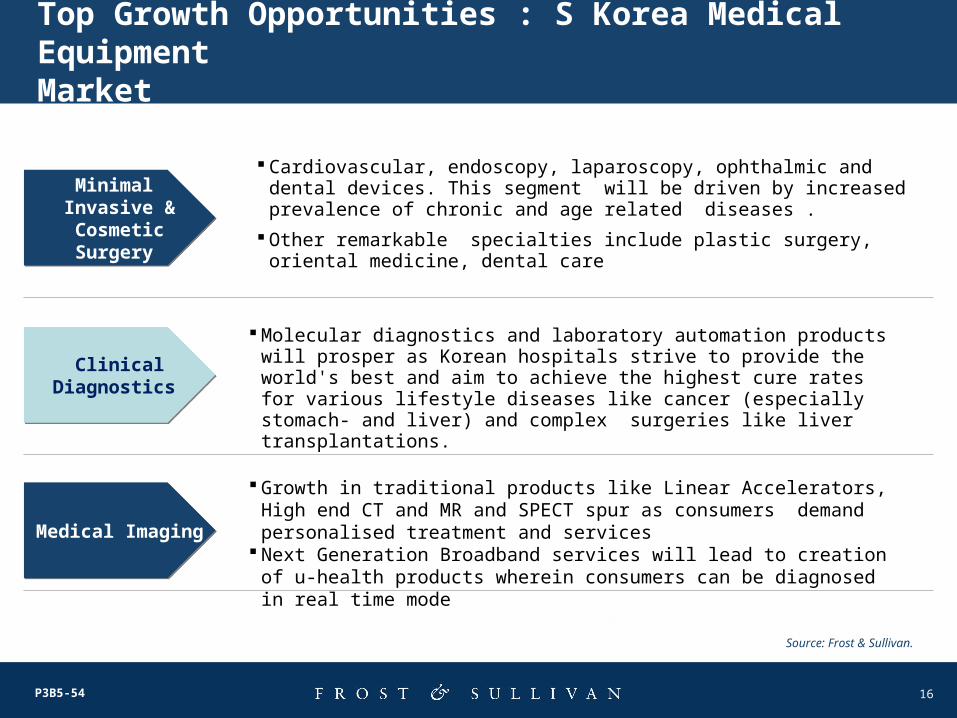
Molecular diagnostics and laboratory automation products will prosper as Korean hospitals strive to provide the world's best and aim to achieve the highest cure rates for various lifestyle diseases like cancer (especially stomach- and liver) and complex surgeries like liver transplantations.
0
0
Top Growth Opportunities : S Korea Medical EquipmentMarket
Minimal Invasive &
Cosmetic Surgery
Minimal Invasive &
Cosmetic Surgery
Clinical Diagnostics
Clinical Diagnostics
Medical Imaging Medical Imaging
Growth in traditional products like Linear Accelerators, High end CT and MR and SPECT spur as consumers demand personalised treatment and services
Next Generation Broadband services will lead to creation of u-health products wherein consumers can be diagnosed in real time mode
Source: Frost & Sullivan.
Cardiovascular, endoscopy, laparoscopy, ophthalmic and dental devices. This segment will be driven by increased prevalence of chronic and age related diseases .
Other remarkable specialties include plastic surgery, oriental medicine, dental care
17P3B5-54
Note: All figures are rounded; the base year is 2009. Source: Frost and SullivanNote: All figures are rounded; the base year is 2009. Source: Frost and Sullivan
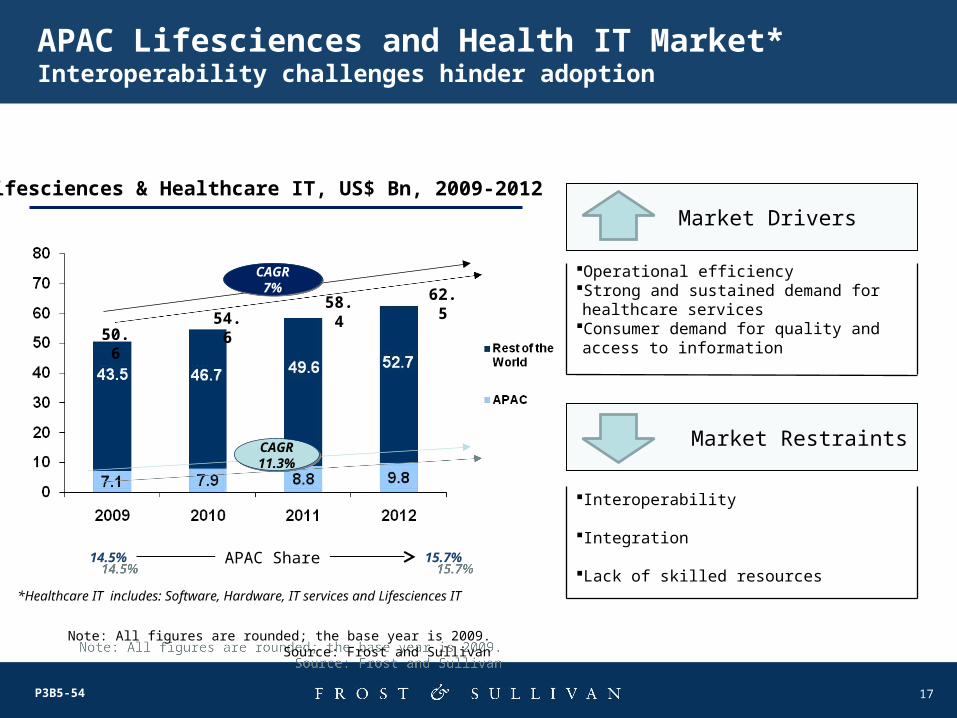
*Healthcare IT includes: Software, Hardware, IT services and Lifesciences IT
APAC Lifesciences and Health IT Market*Interoperability challenges hinder adoption
14.5%14.5%
15.7%15.7%
Market Drivers
Market Restraints
Operational efficiency Strong and sustained demand for healthcare services
Consumer demand for quality and access to information
Interoperability
Integration
Lack of skilled resources
Lifesciences & Healthcare IT, US$ Bn, 2009-2012
CAGR7%
CAGR7%
CAGR11.3%CAGR11.3%
APAC Share
50.654.6
58.4 62.5
18P3B5-54
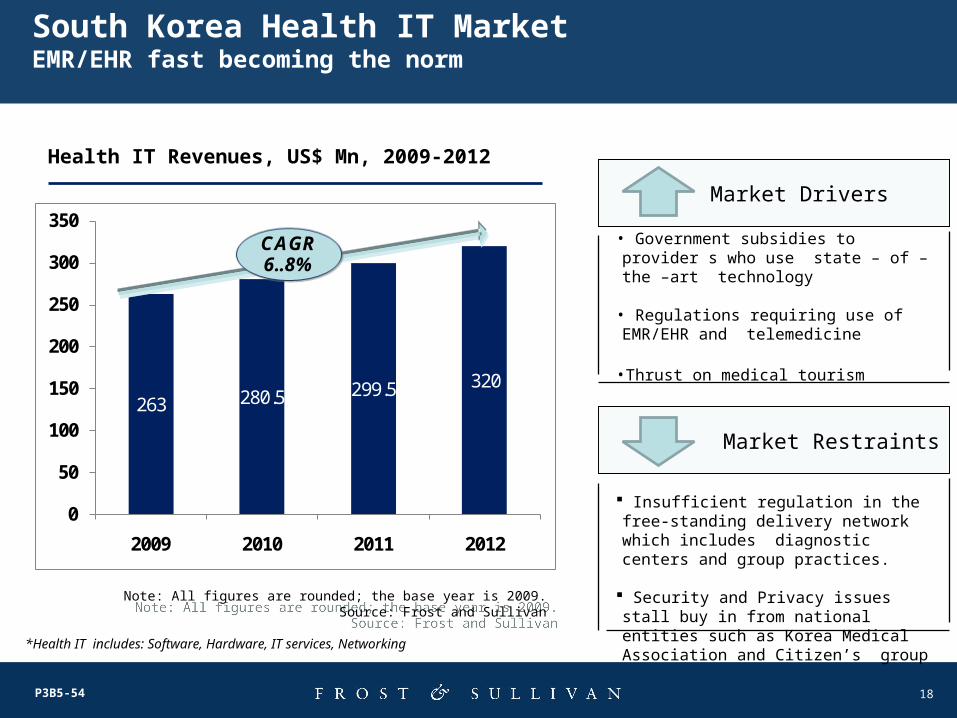
South Korea Health IT MarketEMR/EHR fast becoming the norm
263 280.5 299.5 320
0
50
100
150
200
250
300
350
2009 2010 2011 2012
CAGR 6..8%
Health IT Revenues, US$ Mn, 2009-2012
Market Drivers
Market Restraints
*Health IT includes: Software, Hardware, IT services, Networking
• Government subsidies to provider s who use state – of – the –art technology
• Regulations requiring use of EMR/EHR and telemedicine
•Thrust on medical tourism
Insufficient regulation in the free-standing delivery network which includes diagnostic centers and group practices.
Security and Privacy issues stall buy in from national entities such as Korea Medical Association and Citizen’s group
Note: All figures are rounded; the base year is 2009. Source: Frost and SullivanNote: All figures are rounded; the base year is 2009. Source: Frost and Sullivan
19P3B5-54
0
0
0Electronic Health
RecordElectronic Health
Record
Business Intelligence
Solution
Business Intelligence
Solution
Healthcare Interoperability Standards and
Platform
Healthcare Interoperability Standards and
Platform
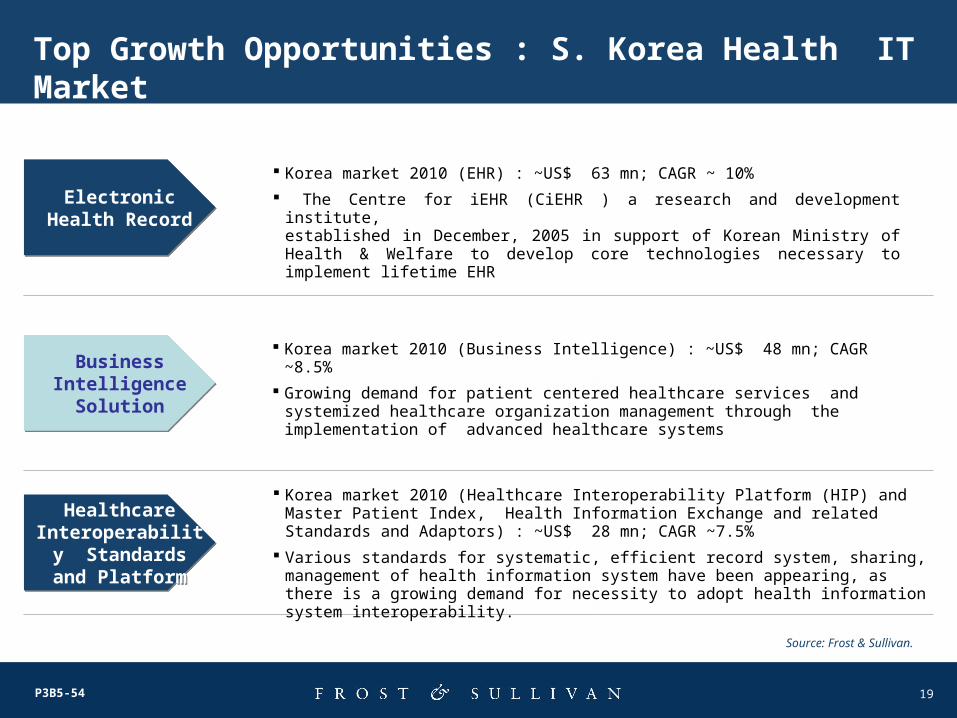
Top Growth Opportunities : S. Korea Health IT Market
Korea market 2010 (Business Intelligence) : ~US$ 48 mn; CAGR ~8.5%
Growing demand for patient centered healthcare services and systemized healthcare organization management through the implementation of advanced healthcare systems
Korea market 2010 (Healthcare Interoperability Platform (HIP) and Master Patient Index, Health Information Exchange and related Standards and Adaptors) : ~US$ 28 mn; CAGR ~7.5%
Various standards for systematic, efficient record system, sharing, management of health information system have been appearing, as there is a growing demand for necessity to adopt health information system interoperability.
Source: Frost & Sullivan.
Korea market 2010 (EHR) : ~US$ 63 mn; CAGR ~ 10%
The Centre for iEHR (CiEHR ) a research and development institute,established in December, 2005 in support of Korean Ministry of Health & Welfare to develop core technologies necessary to implement lifetime EHR
20
Summary : Best Opportunity Analysis APAC and South Korea
21P3B5-54
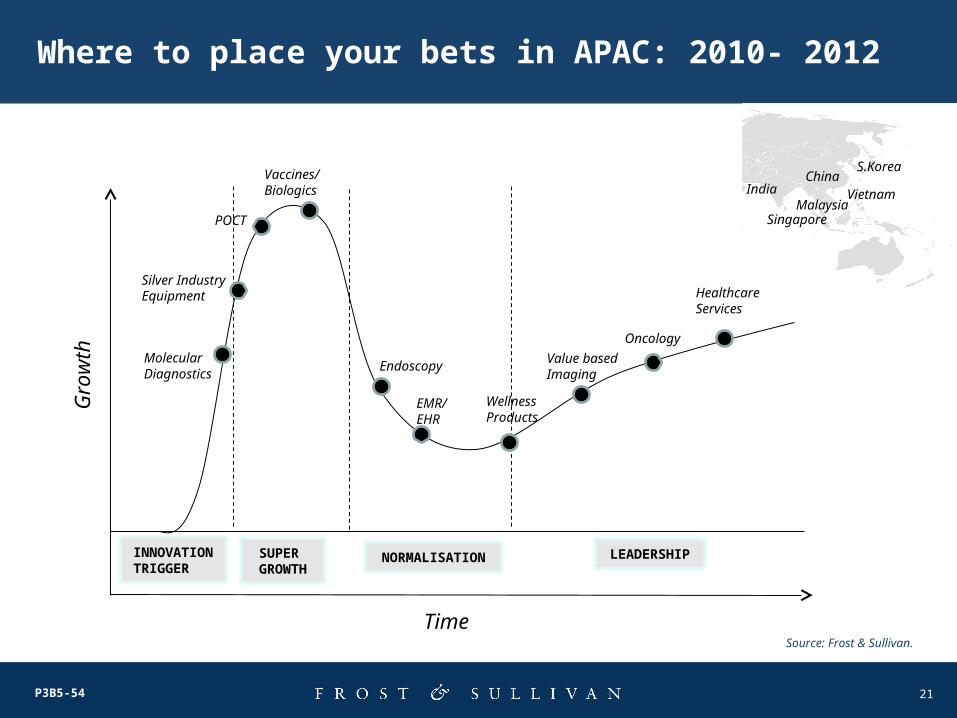
Where to place your bets in APAC: 2010- 2012
Time
Gro
wth Molecular
Diagnostics
Silver IndustryEquipment
POCT
Vaccines/Biologics
Endoscopy
EMR/EHR
WellnessProducts
Oncology
Value basedImaging
INNOVATIONTRIGGER
SUPERGROWTH
NORMALISATION LEADERSHIP
IndiaChina
S.Korea
SingaporeMalaysia
Vietnam
HealthcareServices
Source: Frost & Sullivan.
22P3B5-54
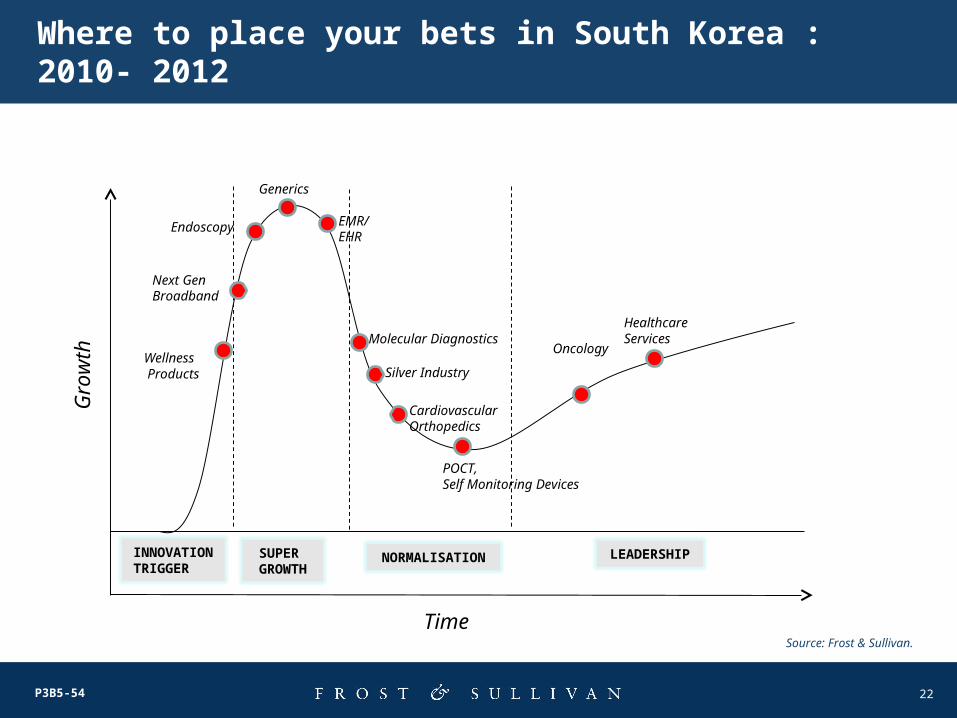
Where to place your bets in South Korea : 2010- 2012
Time
Gro
wth Wellness
Products
Next Gen Broadband
Endoscopy EMR/EHR
Molecular Diagnostics Oncology
INNOVATIONTRIGGER
SUPERGROWTH
NORMALISATION LEADERSHIP
HealthcareServices
Source: Frost & Sullivan.
Generics
Silver Industry
CardiovascularOrthopedics
POCT, Self Monitoring Devices
23
Decision Support Database
• Total Health Expenditure
• Private Health Expenditure
• Government Health Expenditure
• Percent Healthcare Expenditure in GDP
• Population Aged Above 65
24P3B5-54
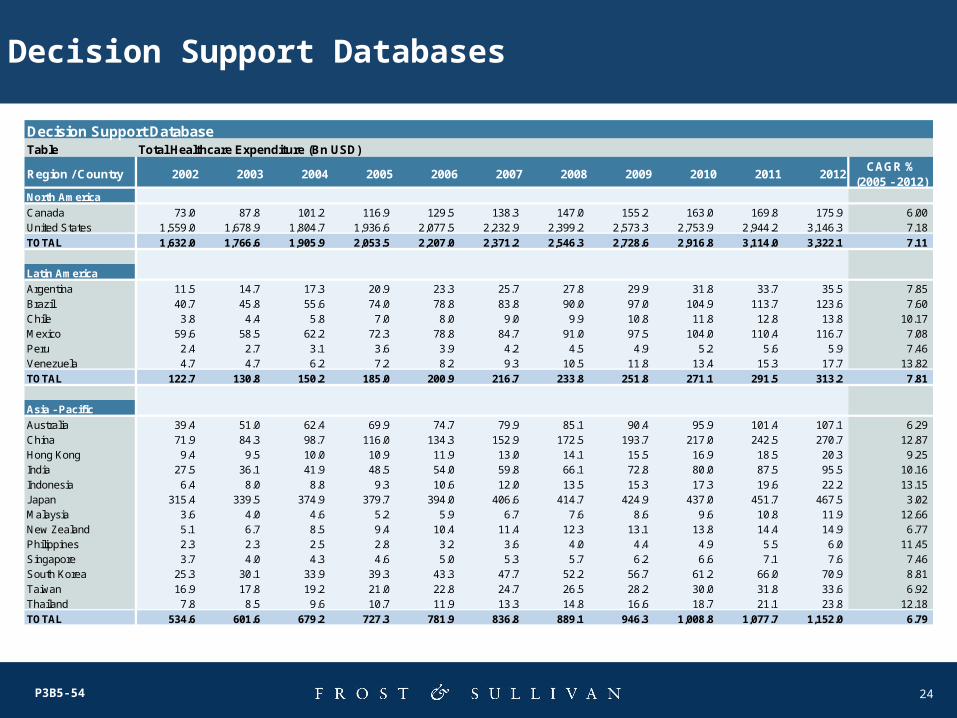
Decision Support Databases
Decision Support DatabaseTable Total Healthcare Expenditure (Bn USD)
Region / Country 2002 2003 2004 2005 2006 2007 2008 2009 2010 2011 2012CAGR %
(2005 - 2012)North America
Canada 73.0 87.8 101.2 116.9 129.5 138.3 147.0 155.2 163.0 169.8 175.9 6.00United States 1,559.0 1,678.9 1,804.7 1,936.6 2,077.5 2,232.9 2,399.2 2,573.3 2,753.9 2,944.2 3,146.3 7.18
TOTAL 1,632.0 1,766.6 1,905.9 2,053.5 2,207.0 2,371.2 2,546.3 2,728.6 2,916.8 3,114.0 3,322.1 7.11
Latin America
Argentina 11.5 14.7 17.3 20.9 23.3 25.7 27.8 29.9 31.8 33.7 35.5 7.85Brazil 40.7 45.8 55.6 74.0 78.8 83.8 90.0 97.0 104.9 113.7 123.6 7.60Chile 3.8 4.4 5.8 7.0 8.0 9.0 9.9 10.8 11.8 12.8 13.8 10.17Mexico 59.6 58.5 62.2 72.3 78.8 84.7 91.0 97.5 104.0 110.4 116.7 7.08Peru 2.4 2.7 3.1 3.6 3.9 4.2 4.5 4.9 5.2 5.6 5.9 7.46Venezuela 4.7 4.7 6.2 7.2 8.2 9.3 10.5 11.8 13.4 15.3 17.7 13.82
TOTAL 122.7 130.8 150.2 185.0 200.9 216.7 233.8 251.8 271.1 291.5 313.2 7.81
Asia - Pacific
Australia 39.4 51.0 62.4 69.9 74.7 79.9 85.1 90.4 95.9 101.4 107.1 6.29China 71.9 84.3 98.7 116.0 134.3 152.9 172.5 193.7 217.0 242.5 270.7 12.87Hong Kong 9.4 9.5 10.0 10.9 11.9 13.0 14.1 15.5 16.9 18.5 20.3 9.25India 27.5 36.1 41.9 48.5 54.0 59.8 66.1 72.8 80.0 87.5 95.5 10.16Indonesia 6.4 8.0 8.8 9.3 10.6 12.0 13.5 15.3 17.3 19.6 22.2 13.15Japan 315.4 339.5 374.9 379.7 394.0 406.6 414.7 424.9 437.0 451.7 467.5 3.02Malaysia 3.6 4.0 4.6 5.2 5.9 6.7 7.6 8.6 9.6 10.8 11.9 12.66New Zealand 5.1 6.7 8.5 9.4 10.4 11.4 12.3 13.1 13.8 14.4 14.9 6.77Philippines 2.3 2.3 2.5 2.8 3.2 3.6 4.0 4.4 4.9 5.5 6.0 11.45Singapore 3.7 4.0 4.3 4.6 5.0 5.3 5.7 6.2 6.6 7.1 7.6 7.46South Korea 25.3 30.1 33.9 39.3 43.3 47.7 52.2 56.7 61.2 66.0 70.9 8.81Taiwan 16.9 17.8 19.2 21.0 22.8 24.7 26.5 28.2 30.0 31.8 33.6 6.92Thailand 7.8 8.5 9.6 10.7 11.9 13.3 14.8 16.6 18.7 21.1 23.8 12.18
TOTAL 534.6 601.6 679.2 727.3 781.9 836.8 889.1 946.3 1,008.8 1,077.7 1,152.0 6.79
25P3B5-54
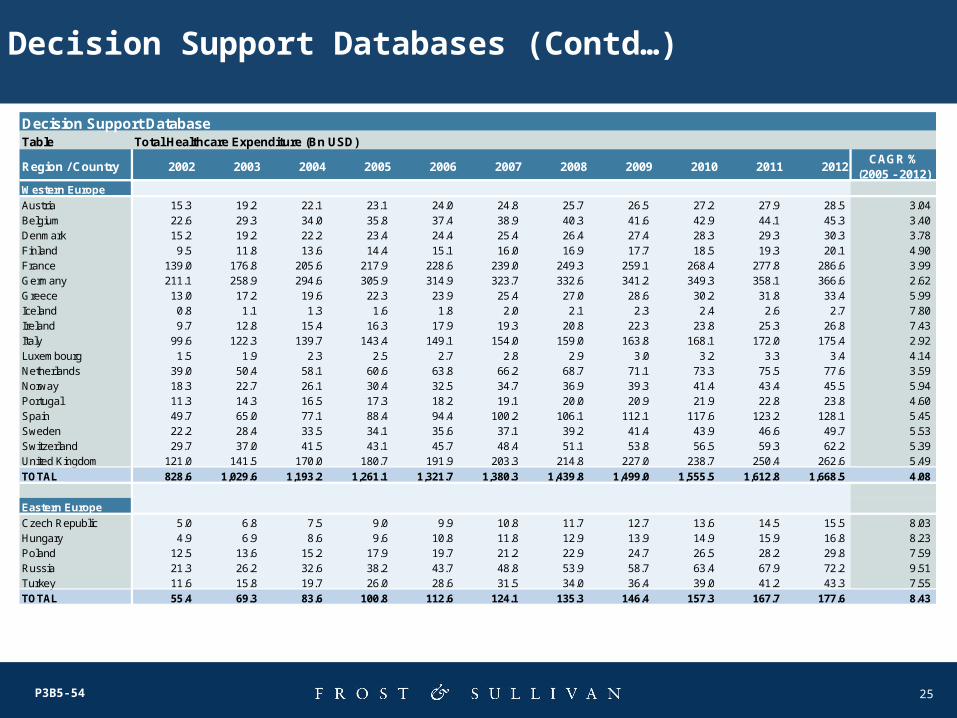
Decision Support Databases (Contd…)
Decision Support DatabaseTable Total Healthcare Expenditure (Bn USD)
Region / Country 2002 2003 2004 2005 2006 2007 2008 2009 2010 2011 2012CAGR %
(2005 - 2012)Western Europe
Austria 15.3 19.2 22.1 23.1 24.0 24.8 25.7 26.5 27.2 27.9 28.5 3.04Belgium 22.6 29.3 34.0 35.8 37.4 38.9 40.3 41.6 42.9 44.1 45.3 3.40Denmark 15.2 19.2 22.2 23.4 24.4 25.4 26.4 27.4 28.3 29.3 30.3 3.78Finland 9.5 11.8 13.6 14.4 15.1 16.0 16.9 17.7 18.5 19.3 20.1 4.90France 139.0 176.8 205.6 217.9 228.6 239.0 249.3 259.1 268.4 277.8 286.6 3.99Germany 211.1 258.9 294.6 305.9 314.9 323.7 332.6 341.2 349.3 358.1 366.6 2.62Greece 13.0 17.2 19.6 22.3 23.9 25.4 27.0 28.6 30.2 31.8 33.4 5.99Iceland 0.8 1.1 1.3 1.6 1.8 2.0 2.1 2.3 2.4 2.6 2.7 7.80Ireland 9.7 12.8 15.4 16.3 17.9 19.3 20.8 22.3 23.8 25.3 26.8 7.43Italy 99.6 122.3 139.7 143.4 149.1 154.0 159.0 163.8 168.1 172.0 175.4 2.92Luxembourg 1.5 1.9 2.3 2.5 2.7 2.8 2.9 3.0 3.2 3.3 3.4 4.14Netherlands 39.0 50.4 58.1 60.6 63.8 66.2 68.7 71.1 73.3 75.5 77.6 3.59Norway 18.3 22.7 26.1 30.4 32.5 34.7 36.9 39.3 41.4 43.4 45.5 5.94Portugal 11.3 14.3 16.5 17.3 18.2 19.1 20.0 20.9 21.9 22.8 23.8 4.60Spain 49.7 65.0 77.1 88.4 94.4 100.2 106.1 112.1 117.6 123.2 128.1 5.45Sweden 22.2 28.4 33.5 34.1 35.6 37.1 39.2 41.4 43.9 46.6 49.7 5.53Switzerland 29.7 37.0 41.5 43.1 45.7 48.4 51.1 53.8 56.5 59.3 62.2 5.39United Kingdom 121.0 141.5 170.0 180.7 191.9 203.3 214.8 227.0 238.7 250.4 262.6 5.49
TOTAL 828.6 1,029.6 1,193.2 1,261.1 1,321.7 1,380.3 1,439.8 1,499.0 1,555.5 1,612.8 1,668.5 4.08
Eastern Europe
Czech Republic 5.0 6.8 7.5 9.0 9.9 10.8 11.7 12.7 13.6 14.5 15.5 8.03Hungary 4.9 6.9 8.6 9.6 10.8 11.8 12.9 13.9 14.9 15.9 16.8 8.23Poland 12.5 13.6 15.2 17.9 19.7 21.2 22.9 24.7 26.5 28.2 29.8 7.59Russia 21.3 26.2 32.6 38.2 43.7 48.8 53.9 58.7 63.4 67.9 72.2 9.51Turkey 11.6 15.8 19.7 26.0 28.6 31.5 34.0 36.4 39.0 41.2 43.3 7.55
TOTAL 55.4 69.3 83.6 100.8 112.6 124.1 135.3 146.4 157.3 167.7 177.6 8.43
26P3B5-54
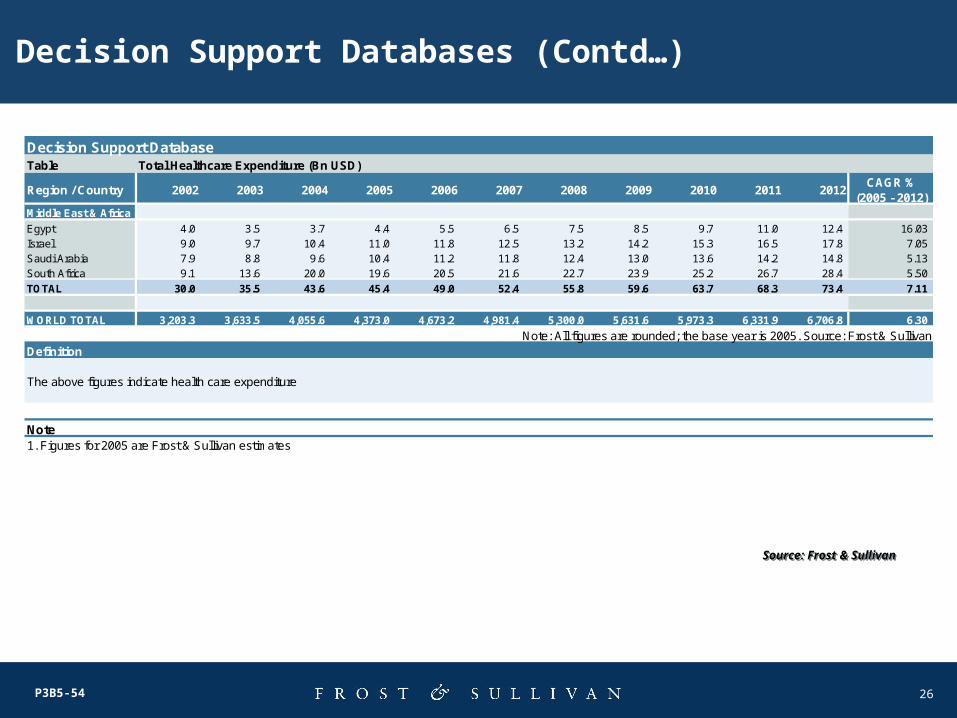
Decision Support Databases (Contd…)
Decision Support DatabaseTable Total Healthcare Expenditure (Bn USD)
Region / Country 2002 2003 2004 2005 2006 2007 2008 2009 2010 2011 2012CAGR %
(2005 - 2012)Middle East & Africa
Egypt 4.0 3.5 3.7 4.4 5.5 6.5 7.5 8.5 9.7 11.0 12.4 16.03Israel 9.0 9.7 10.4 11.0 11.8 12.5 13.2 14.2 15.3 16.5 17.8 7.05Saudi Arabia 7.9 8.8 9.6 10.4 11.2 11.8 12.4 13.0 13.6 14.2 14.8 5.13South Africa 9.1 13.6 20.0 19.6 20.5 21.6 22.7 23.9 25.2 26.7 28.4 5.50
TOTAL 30.0 35.5 43.6 45.4 49.0 52.4 55.8 59.6 63.7 68.3 73.4 7.11
WORLD TOTAL 3,203.3 3,633.5 4,055.6 4,373.0 4,673.2 4,981.4 5,300.0 5,631.6 5,973.3 6,331.9 6,706.8 6.30
Note: All figures are rounded; the base year is 2005. Source: Frost & SullivanDefinition
Note1. Figures for 2005 are Frost & Sullivan estimates
The above figures indicate health care expenditure
Source: Frost & SullivanSource: Frost & Sullivan
27P3B5-54
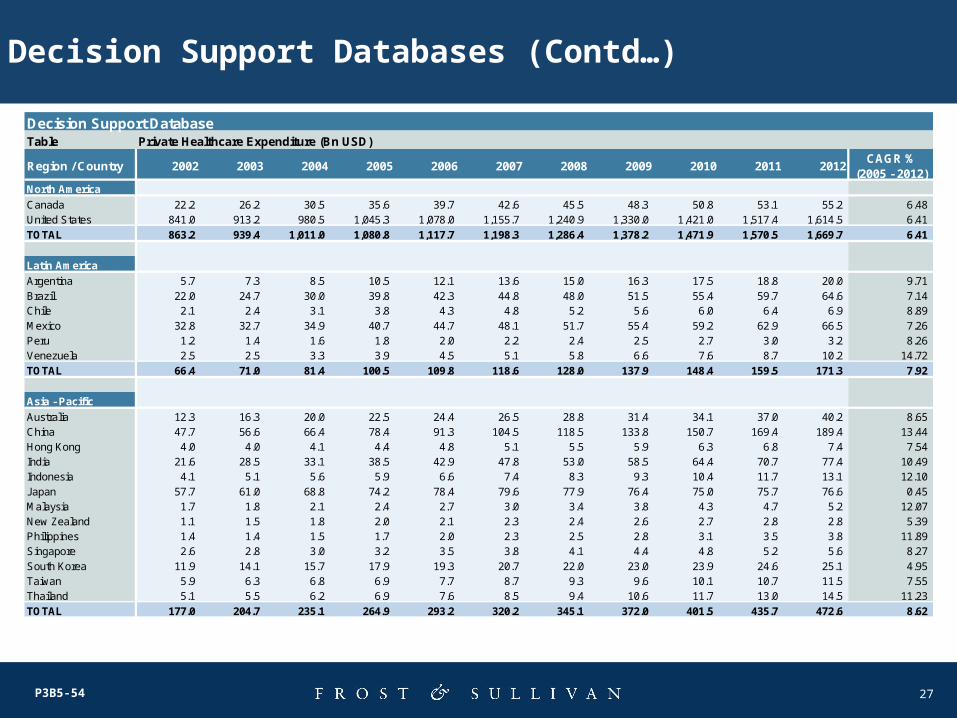
Decision Support Databases (Contd…)
Decision Support DatabaseTable Private Healthcare Expenditure (Bn USD)
Region / Country 2002 2003 2004 2005 2006 2007 2008 2009 2010 2011 2012CAGR %
(2005 - 2012)North America
Canada 22.2 26.2 30.5 35.6 39.7 42.6 45.5 48.3 50.8 53.1 55.2 6.48United States 841.0 913.2 980.5 1,045.3 1,078.0 1,155.7 1,240.9 1,330.0 1,421.0 1,517.4 1,614.5 6.41
TOTAL 863.2 939.4 1,011.0 1,080.8 1,117.7 1,198.3 1,286.4 1,378.2 1,471.9 1,570.5 1,669.7 6.41
Latin America
Argentina 5.7 7.3 8.5 10.5 12.1 13.6 15.0 16.3 17.5 18.8 20.0 9.71Brazil 22.0 24.7 30.0 39.8 42.3 44.8 48.0 51.5 55.4 59.7 64.6 7.14Chile 2.1 2.4 3.1 3.8 4.3 4.8 5.2 5.6 6.0 6.4 6.9 8.89Mexico 32.8 32.7 34.9 40.7 44.7 48.1 51.7 55.4 59.2 62.9 66.5 7.26Peru 1.2 1.4 1.6 1.8 2.0 2.2 2.4 2.5 2.7 3.0 3.2 8.26Venezuela 2.5 2.5 3.3 3.9 4.5 5.1 5.8 6.6 7.6 8.7 10.2 14.72
TOTAL 66.4 71.0 81.4 100.5 109.8 118.6 128.0 137.9 148.4 159.5 171.3 7.92
Asia - Pacific
Australia 12.3 16.3 20.0 22.5 24.4 26.5 28.8 31.4 34.1 37.0 40.2 8.65China 47.7 56.6 66.4 78.4 91.3 104.5 118.5 133.8 150.7 169.4 189.4 13.44Hong Kong 4.0 4.0 4.1 4.4 4.8 5.1 5.5 5.9 6.3 6.8 7.4 7.54India 21.6 28.5 33.1 38.5 42.9 47.8 53.0 58.5 64.4 70.7 77.4 10.49Indonesia 4.1 5.1 5.6 5.9 6.6 7.4 8.3 9.3 10.4 11.7 13.1 12.10Japan 57.7 61.0 68.8 74.2 78.4 79.6 77.9 76.4 75.0 75.7 76.6 0.45Malaysia 1.7 1.8 2.1 2.4 2.7 3.0 3.4 3.8 4.3 4.7 5.2 12.07New Zealand 1.1 1.5 1.8 2.0 2.1 2.3 2.4 2.6 2.7 2.8 2.8 5.39Philippines 1.4 1.4 1.5 1.7 2.0 2.3 2.5 2.8 3.1 3.5 3.8 11.89Singapore 2.6 2.8 3.0 3.2 3.5 3.8 4.1 4.4 4.8 5.2 5.6 8.27South Korea 11.9 14.1 15.7 17.9 19.3 20.7 22.0 23.0 23.9 24.6 25.1 4.95Taiwan 5.9 6.3 6.8 6.9 7.7 8.7 9.3 9.6 10.1 10.7 11.5 7.55Thailand 5.1 5.5 6.2 6.9 7.6 8.5 9.4 10.6 11.7 13.0 14.5 11.23
TOTAL 177.0 204.7 235.1 264.9 293.2 320.2 345.1 372.0 401.5 435.7 472.6 8.62
28P3B5-54
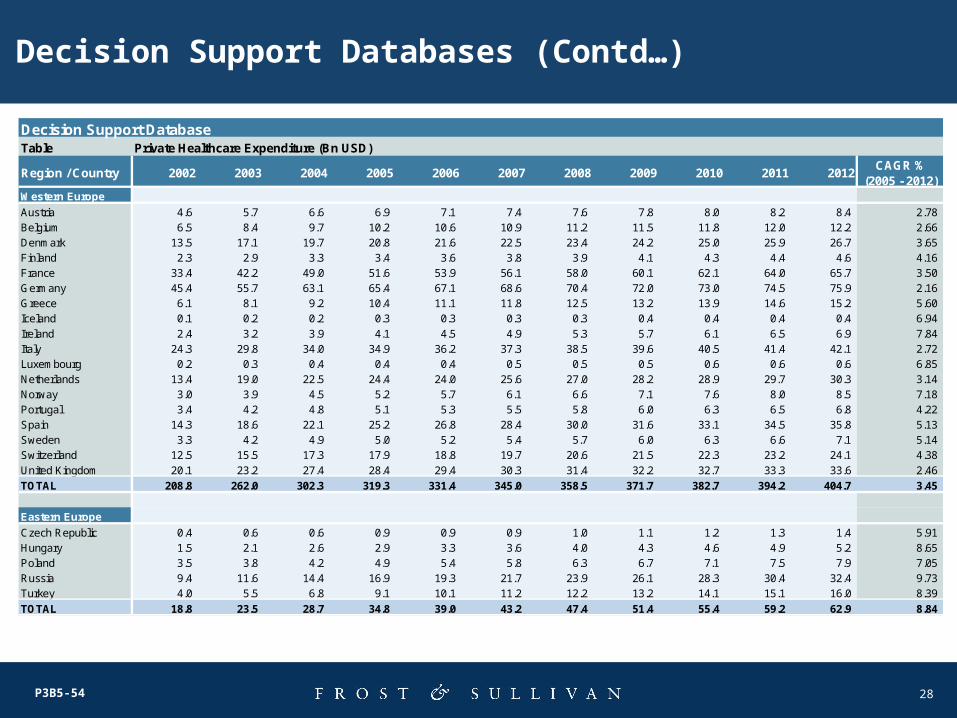
Decision Support Databases (Contd…)
Decision Support DatabaseTable Private Healthcare Expenditure (Bn USD)
Region / Country 2002 2003 2004 2005 2006 2007 2008 2009 2010 2011 2012CAGR %
(2005 - 2012)Western Europe
Austria 4.6 5.7 6.6 6.9 7.1 7.4 7.6 7.8 8.0 8.2 8.4 2.78Belgium 6.5 8.4 9.7 10.2 10.6 10.9 11.2 11.5 11.8 12.0 12.2 2.66Denmark 13.5 17.1 19.7 20.8 21.6 22.5 23.4 24.2 25.0 25.9 26.7 3.65Finland 2.3 2.9 3.3 3.4 3.6 3.8 3.9 4.1 4.3 4.4 4.6 4.16France 33.4 42.2 49.0 51.6 53.9 56.1 58.0 60.1 62.1 64.0 65.7 3.50Germany 45.4 55.7 63.1 65.4 67.1 68.6 70.4 72.0 73.0 74.5 75.9 2.16Greece 6.1 8.1 9.2 10.4 11.1 11.8 12.5 13.2 13.9 14.6 15.2 5.60Iceland 0.1 0.2 0.2 0.3 0.3 0.3 0.3 0.4 0.4 0.4 0.4 6.94Ireland 2.4 3.2 3.9 4.1 4.5 4.9 5.3 5.7 6.1 6.5 6.9 7.84Italy 24.3 29.8 34.0 34.9 36.2 37.3 38.5 39.6 40.5 41.4 42.1 2.72Luxembourg 0.2 0.3 0.4 0.4 0.4 0.5 0.5 0.5 0.6 0.6 0.6 6.85Netherlands 13.4 19.0 22.5 24.4 24.0 25.6 27.0 28.2 28.9 29.7 30.3 3.14Norway 3.0 3.9 4.5 5.2 5.7 6.1 6.6 7.1 7.6 8.0 8.5 7.18Portugal 3.4 4.2 4.8 5.1 5.3 5.5 5.8 6.0 6.3 6.5 6.8 4.22Spain 14.3 18.6 22.1 25.2 26.8 28.4 30.0 31.6 33.1 34.5 35.8 5.13Sweden 3.3 4.2 4.9 5.0 5.2 5.4 5.7 6.0 6.3 6.6 7.1 5.14Switzerland 12.5 15.5 17.3 17.9 18.8 19.7 20.6 21.5 22.3 23.2 24.1 4.38United Kingdom 20.1 23.2 27.4 28.4 29.4 30.3 31.4 32.2 32.7 33.3 33.6 2.46
TOTAL 208.8 262.0 302.3 319.3 331.4 345.0 358.5 371.7 382.7 394.2 404.7 3.45
Eastern Europe
Czech Republic 0.4 0.6 0.6 0.9 0.9 0.9 1.0 1.1 1.2 1.3 1.4 5.91Hungary 1.5 2.1 2.6 2.9 3.3 3.6 4.0 4.3 4.6 4.9 5.2 8.65Poland 3.5 3.8 4.2 4.9 5.4 5.8 6.3 6.7 7.1 7.5 7.9 7.05Russia 9.4 11.6 14.4 16.9 19.3 21.7 23.9 26.1 28.3 30.4 32.4 9.73Turkey 4.0 5.5 6.8 9.1 10.1 11.2 12.2 13.2 14.1 15.1 16.0 8.39
TOTAL 18.8 23.5 28.7 34.8 39.0 43.2 47.4 51.4 55.4 59.2 62.9 8.84
29P3B5-54
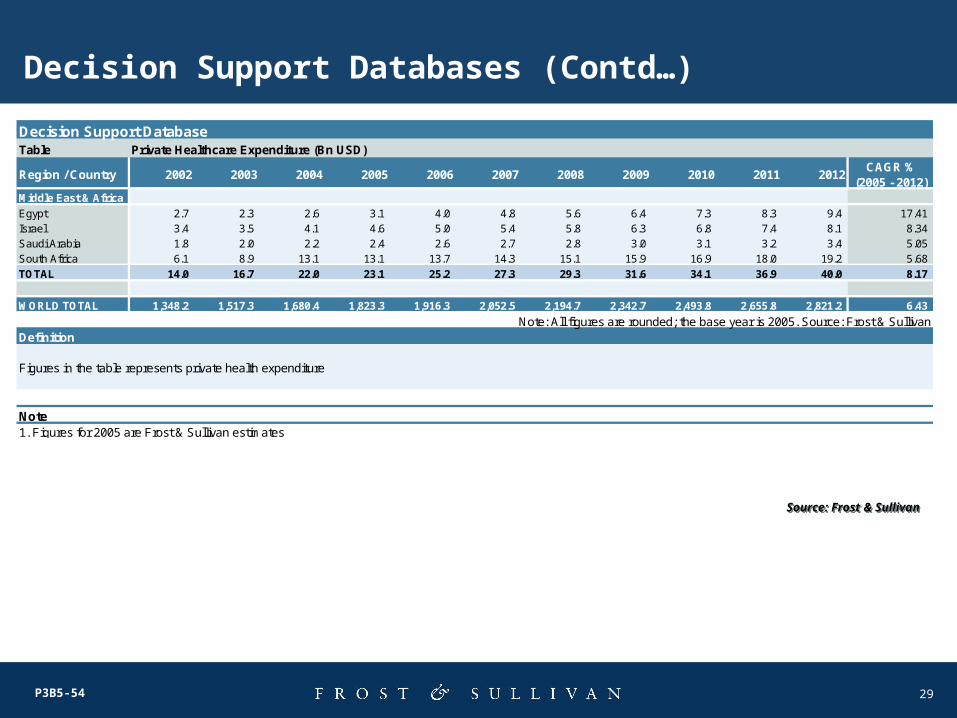
Decision Support Databases (Contd…)
Decision Support DatabaseTable Private Healthcare Expenditure (Bn USD)
Region / Country 2002 2003 2004 2005 2006 2007 2008 2009 2010 2011 2012CAGR %
(2005 - 2012)Middle East & Africa
Egypt 2.7 2.3 2.6 3.1 4.0 4.8 5.6 6.4 7.3 8.3 9.4 17.41Israel 3.4 3.5 4.1 4.6 5.0 5.4 5.8 6.3 6.8 7.4 8.1 8.34Saudi Arabia 1.8 2.0 2.2 2.4 2.6 2.7 2.8 3.0 3.1 3.2 3.4 5.05South Africa 6.1 8.9 13.1 13.1 13.7 14.3 15.1 15.9 16.9 18.0 19.2 5.68
TOTAL 14.0 16.7 22.0 23.1 25.2 27.3 29.3 31.6 34.1 36.9 40.0 8.17
WORLD TOTAL 1,348.2 1,517.3 1,680.4 1,823.3 1,916.3 2,052.5 2,194.7 2,342.7 2,493.8 2,655.8 2,821.2 6.43
Note: All figures are rounded; the base year is 2005. Source: Frost & SullivanDefinition
Note1. Figures for 2005 are Frost & Sullivan estimates
Figures in the table represents private health expenditure
Source: Frost & SullivanSource: Frost & Sullivan
30P3B5-54
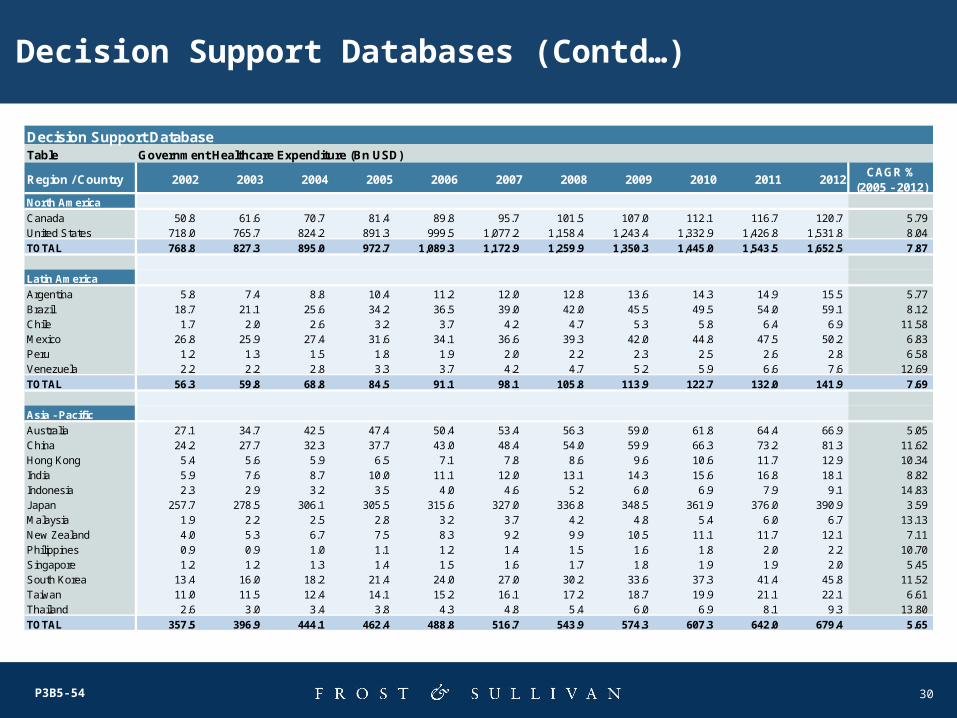
Decision Support Databases (Contd…)
Decision Support DatabaseTable Government Healthcare Expenditure (Bn USD)
Region / Country 2002 2003 2004 2005 2006 2007 2008 2009 2010 2011 2012CAGR %
(2005 - 2012)North America
Canada 50.8 61.6 70.7 81.4 89.8 95.7 101.5 107.0 112.1 116.7 120.7 5.79United States 718.0 765.7 824.2 891.3 999.5 1,077.2 1,158.4 1,243.4 1,332.9 1,426.8 1,531.8 8.04
TOTAL 768.8 827.3 895.0 972.7 1,089.3 1,172.9 1,259.9 1,350.3 1,445.0 1,543.5 1,652.5 7.87
Latin America
Argentina 5.8 7.4 8.8 10.4 11.2 12.0 12.8 13.6 14.3 14.9 15.5 5.77Brazil 18.7 21.1 25.6 34.2 36.5 39.0 42.0 45.5 49.5 54.0 59.1 8.12Chile 1.7 2.0 2.6 3.2 3.7 4.2 4.7 5.3 5.8 6.4 6.9 11.58Mexico 26.8 25.9 27.4 31.6 34.1 36.6 39.3 42.0 44.8 47.5 50.2 6.83Peru 1.2 1.3 1.5 1.8 1.9 2.0 2.2 2.3 2.5 2.6 2.8 6.58Venezuela 2.2 2.2 2.8 3.3 3.7 4.2 4.7 5.2 5.9 6.6 7.6 12.69
TOTAL 56.3 59.8 68.8 84.5 91.1 98.1 105.8 113.9 122.7 132.0 141.9 7.69
Asia - Pacific
Australia 27.1 34.7 42.5 47.4 50.4 53.4 56.3 59.0 61.8 64.4 66.9 5.05China 24.2 27.7 32.3 37.7 43.0 48.4 54.0 59.9 66.3 73.2 81.3 11.62Hong Kong 5.4 5.6 5.9 6.5 7.1 7.8 8.6 9.6 10.6 11.7 12.9 10.34India 5.9 7.6 8.7 10.0 11.1 12.0 13.1 14.3 15.6 16.8 18.1 8.82Indonesia 2.3 2.9 3.2 3.5 4.0 4.6 5.2 6.0 6.9 7.9 9.1 14.83Japan 257.7 278.5 306.1 305.5 315.6 327.0 336.8 348.5 361.9 376.0 390.9 3.59Malaysia 1.9 2.2 2.5 2.8 3.2 3.7 4.2 4.8 5.4 6.0 6.7 13.13New Zealand 4.0 5.3 6.7 7.5 8.3 9.2 9.9 10.5 11.1 11.7 12.1 7.11Philippines 0.9 0.9 1.0 1.1 1.2 1.4 1.5 1.6 1.8 2.0 2.2 10.70Singapore 1.2 1.2 1.3 1.4 1.5 1.6 1.7 1.8 1.9 1.9 2.0 5.45South Korea 13.4 16.0 18.2 21.4 24.0 27.0 30.2 33.6 37.3 41.4 45.8 11.52Taiwan 11.0 11.5 12.4 14.1 15.2 16.1 17.2 18.7 19.9 21.1 22.1 6.61Thailand 2.6 3.0 3.4 3.8 4.3 4.8 5.4 6.0 6.9 8.1 9.3 13.80
TOTAL 357.5 396.9 444.1 462.4 488.8 516.7 543.9 574.3 607.3 642.0 679.4 5.65
31P3B5-54
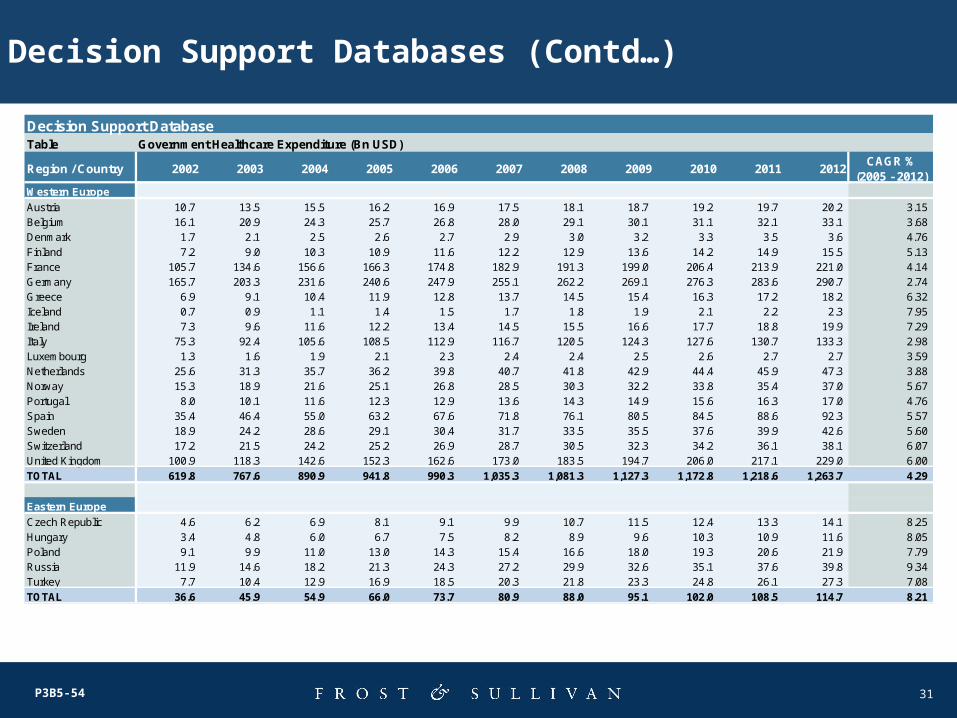
Decision Support Databases (Contd…)
Decision Support DatabaseTable Government Healthcare Expenditure (Bn USD)
Region / Country 2002 2003 2004 2005 2006 2007 2008 2009 2010 2011 2012CAGR %
(2005 - 2012)Western Europe
Austria 10.7 13.5 15.5 16.2 16.9 17.5 18.1 18.7 19.2 19.7 20.2 3.15Belgium 16.1 20.9 24.3 25.7 26.8 28.0 29.1 30.1 31.1 32.1 33.1 3.68Denmark 1.7 2.1 2.5 2.6 2.7 2.9 3.0 3.2 3.3 3.5 3.6 4.76Finland 7.2 9.0 10.3 10.9 11.6 12.2 12.9 13.6 14.2 14.9 15.5 5.13France 105.7 134.6 156.6 166.3 174.8 182.9 191.3 199.0 206.4 213.9 221.0 4.14Germany 165.7 203.3 231.6 240.6 247.9 255.1 262.2 269.1 276.3 283.6 290.7 2.74Greece 6.9 9.1 10.4 11.9 12.8 13.7 14.5 15.4 16.3 17.2 18.2 6.32Iceland 0.7 0.9 1.1 1.4 1.5 1.7 1.8 1.9 2.1 2.2 2.3 7.95Ireland 7.3 9.6 11.6 12.2 13.4 14.5 15.5 16.6 17.7 18.8 19.9 7.29Italy 75.3 92.4 105.6 108.5 112.9 116.7 120.5 124.3 127.6 130.7 133.3 2.98Luxembourg 1.3 1.6 1.9 2.1 2.3 2.4 2.4 2.5 2.6 2.7 2.7 3.59Netherlands 25.6 31.3 35.7 36.2 39.8 40.7 41.8 42.9 44.4 45.9 47.3 3.88Norway 15.3 18.9 21.6 25.1 26.8 28.5 30.3 32.2 33.8 35.4 37.0 5.67Portugal 8.0 10.1 11.6 12.3 12.9 13.6 14.3 14.9 15.6 16.3 17.0 4.76Spain 35.4 46.4 55.0 63.2 67.6 71.8 76.1 80.5 84.5 88.6 92.3 5.57Sweden 18.9 24.2 28.6 29.1 30.4 31.7 33.5 35.5 37.6 39.9 42.6 5.60Switzerland 17.2 21.5 24.2 25.2 26.9 28.7 30.5 32.3 34.2 36.1 38.1 6.07United Kingdom 100.9 118.3 142.6 152.3 162.6 173.0 183.5 194.7 206.0 217.1 229.0 6.00
TOTAL 619.8 767.6 890.9 941.8 990.3 1,035.3 1,081.3 1,127.3 1,172.8 1,218.6 1,263.7 4.29
Eastern Europe
Czech Republic 4.6 6.2 6.9 8.1 9.1 9.9 10.7 11.5 12.4 13.3 14.1 8.25Hungary 3.4 4.8 6.0 6.7 7.5 8.2 8.9 9.6 10.3 10.9 11.6 8.05Poland 9.1 9.9 11.0 13.0 14.3 15.4 16.6 18.0 19.3 20.6 21.9 7.79Russia 11.9 14.6 18.2 21.3 24.3 27.2 29.9 32.6 35.1 37.6 39.8 9.34Turkey 7.7 10.4 12.9 16.9 18.5 20.3 21.8 23.3 24.8 26.1 27.3 7.08
TOTAL 36.6 45.9 54.9 66.0 73.7 80.9 88.0 95.1 102.0 108.5 114.7 8.21
32P3B5-54
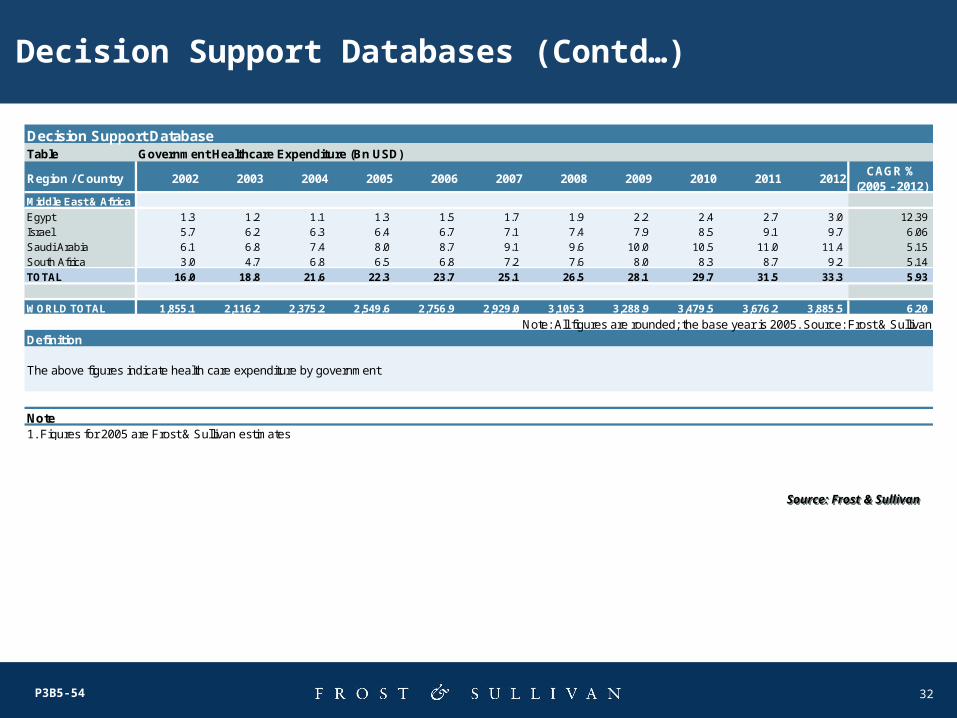
Decision Support Databases (Contd…)
Decision Support DatabaseTable Government Healthcare Expenditure (Bn USD)
Region / Country 2002 2003 2004 2005 2006 2007 2008 2009 2010 2011 2012CAGR %
(2005 - 2012)Middle East & Africa
Egypt 1.3 1.2 1.1 1.3 1.5 1.7 1.9 2.2 2.4 2.7 3.0 12.39Israel 5.7 6.2 6.3 6.4 6.7 7.1 7.4 7.9 8.5 9.1 9.7 6.06Saudi Arabia 6.1 6.8 7.4 8.0 8.7 9.1 9.6 10.0 10.5 11.0 11.4 5.15South Africa 3.0 4.7 6.8 6.5 6.8 7.2 7.6 8.0 8.3 8.7 9.2 5.14
TOTAL 16.0 18.8 21.6 22.3 23.7 25.1 26.5 28.1 29.7 31.5 33.3 5.93
WORLD TOTAL 1,855.1 2,116.2 2,375.2 2,549.6 2,756.9 2,929.0 3,105.3 3,288.9 3,479.5 3,676.2 3,885.5 6.20
Note: All figures are rounded; the base year is 2005. Source: Frost & SullivanDefinition
Note1. Figures for 2005 are Frost & Sullivan estimates
The above figures indicate health care expenditure by government
Source: Frost & SullivanSource: Frost & Sullivan
33P3B5-54
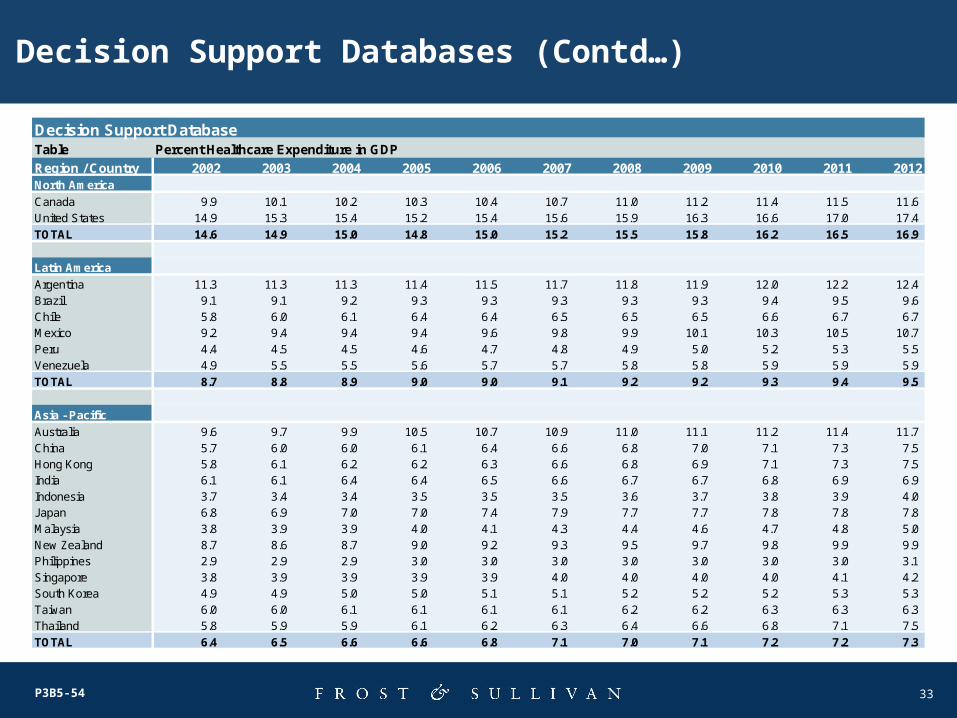
Decision Support DatabaseTable Percent Healthcare Expenditure in GDP
Region / Country 2002 2003 2004 2005 2006 2007 2008 2009 2010 2011 2012North America
Canada 9.9 10.1 10.2 10.3 10.4 10.7 11.0 11.2 11.4 11.5 11.6United States 14.9 15.3 15.4 15.2 15.4 15.6 15.9 16.3 16.6 17.0 17.4
TOTAL 14.6 14.9 15.0 14.8 15.0 15.2 15.5 15.8 16.2 16.5 16.9
Latin America
Argentina 11.3 11.3 11.3 11.4 11.5 11.7 11.8 11.9 12.0 12.2 12.4Brazil 9.1 9.1 9.2 9.3 9.3 9.3 9.3 9.3 9.4 9.5 9.6Chile 5.8 6.0 6.1 6.4 6.4 6.5 6.5 6.5 6.6 6.7 6.7Mexico 9.2 9.4 9.4 9.4 9.6 9.8 9.9 10.1 10.3 10.5 10.7Peru 4.4 4.5 4.5 4.6 4.7 4.8 4.9 5.0 5.2 5.3 5.5Venezuela 4.9 5.5 5.5 5.6 5.7 5.7 5.8 5.8 5.9 5.9 5.9
TOTAL 8.7 8.8 8.9 9.0 9.0 9.1 9.2 9.2 9.3 9.4 9.5
Asia - Pacific
Australia 9.6 9.7 9.9 10.5 10.7 10.9 11.0 11.1 11.2 11.4 11.7China 5.7 6.0 6.0 6.1 6.4 6.6 6.8 7.0 7.1 7.3 7.5Hong Kong 5.8 6.1 6.2 6.2 6.3 6.6 6.8 6.9 7.1 7.3 7.5India 6.1 6.1 6.4 6.4 6.5 6.6 6.7 6.7 6.8 6.9 6.9Indonesia 3.7 3.4 3.4 3.5 3.5 3.5 3.6 3.7 3.8 3.9 4.0Japan 6.8 6.9 7.0 7.0 7.4 7.9 7.7 7.7 7.8 7.8 7.8Malaysia 3.8 3.9 3.9 4.0 4.1 4.3 4.4 4.6 4.7 4.8 5.0New Zealand 8.7 8.6 8.7 9.0 9.2 9.3 9.5 9.7 9.8 9.9 9.9Philippines 2.9 2.9 2.9 3.0 3.0 3.0 3.0 3.0 3.0 3.0 3.1Singapore 3.8 3.9 3.9 3.9 3.9 4.0 4.0 4.0 4.0 4.1 4.2South Korea 4.9 4.9 5.0 5.0 5.1 5.1 5.2 5.2 5.2 5.3 5.3Taiwan 6.0 6.0 6.1 6.1 6.1 6.1 6.2 6.2 6.3 6.3 6.3Thailand 5.8 5.9 5.9 6.1 6.2 6.3 6.4 6.6 6.8 7.1 7.5
TOTAL 6.4 6.5 6.6 6.6 6.8 7.1 7.0 7.1 7.2 7.2 7.3
Decision Support Databases (Contd…)
34P3B5-54
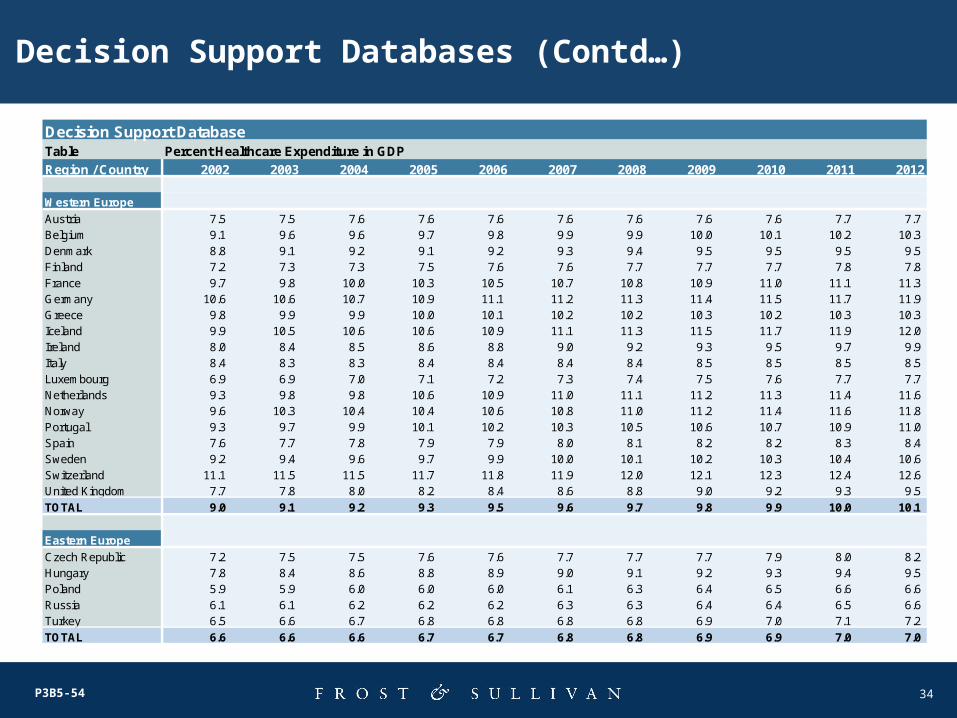
Decision Support Databases (Contd…)
Decision Support DatabaseTable Percent Healthcare Expenditure in GDP
Region / Country 2002 2003 2004 2005 2006 2007 2008 2009 2010 2011 2012
Western Europe
Austria 7.5 7.5 7.6 7.6 7.6 7.6 7.6 7.6 7.6 7.7 7.7Belgium 9.1 9.6 9.6 9.7 9.8 9.9 9.9 10.0 10.1 10.2 10.3Denmark 8.8 9.1 9.2 9.1 9.2 9.3 9.4 9.5 9.5 9.5 9.5Finland 7.2 7.3 7.3 7.5 7.6 7.6 7.7 7.7 7.7 7.8 7.8France 9.7 9.8 10.0 10.3 10.5 10.7 10.8 10.9 11.0 11.1 11.3Germany 10.6 10.6 10.7 10.9 11.1 11.2 11.3 11.4 11.5 11.7 11.9Greece 9.8 9.9 9.9 10.0 10.1 10.2 10.2 10.3 10.2 10.3 10.3Iceland 9.9 10.5 10.6 10.6 10.9 11.1 11.3 11.5 11.7 11.9 12.0Ireland 8.0 8.4 8.5 8.6 8.8 9.0 9.2 9.3 9.5 9.7 9.9Italy 8.4 8.3 8.3 8.4 8.4 8.4 8.4 8.5 8.5 8.5 8.5Luxembourg 6.9 6.9 7.0 7.1 7.2 7.3 7.4 7.5 7.6 7.7 7.7Netherlands 9.3 9.8 9.8 10.6 10.9 11.0 11.1 11.2 11.3 11.4 11.6Norway 9.6 10.3 10.4 10.4 10.6 10.8 11.0 11.2 11.4 11.6 11.8Portugal 9.3 9.7 9.9 10.1 10.2 10.3 10.5 10.6 10.7 10.9 11.0Spain 7.6 7.7 7.8 7.9 7.9 8.0 8.1 8.2 8.2 8.3 8.4Sweden 9.2 9.4 9.6 9.7 9.9 10.0 10.1 10.2 10.3 10.4 10.6Switzerland 11.1 11.5 11.5 11.7 11.8 11.9 12.0 12.1 12.3 12.4 12.6United Kingdom 7.7 7.8 8.0 8.2 8.4 8.6 8.8 9.0 9.2 9.3 9.5
TOTAL 9.0 9.1 9.2 9.3 9.5 9.6 9.7 9.8 9.9 10.0 10.1
Eastern Europe
Czech Republic 7.2 7.5 7.5 7.6 7.6 7.7 7.7 7.7 7.9 8.0 8.2Hungary 7.8 8.4 8.6 8.8 8.9 9.0 9.1 9.2 9.3 9.4 9.5Poland 5.9 5.9 6.0 6.0 6.0 6.1 6.3 6.4 6.5 6.6 6.6Russia 6.1 6.1 6.2 6.2 6.2 6.3 6.3 6.4 6.4 6.5 6.6Turkey 6.5 6.6 6.7 6.8 6.8 6.8 6.8 6.9 7.0 7.1 7.2
TOTAL 6.6 6.6 6.6 6.7 6.7 6.8 6.8 6.9 6.9 7.0 7.0
35P3B5-54
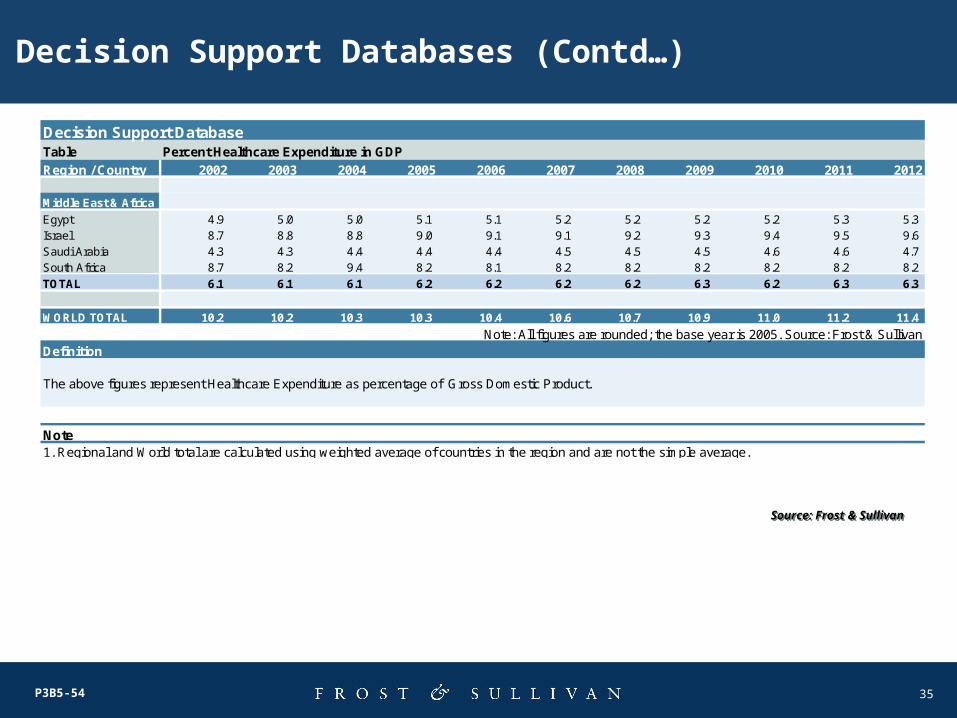
Decision Support Databases (Contd…)
Decision Support DatabaseTable Percent Healthcare Expenditure in GDP
Region / Country 2002 2003 2004 2005 2006 2007 2008 2009 2010 2011 2012
Middle East & Africa
Egypt 4.9 5.0 5.0 5.1 5.1 5.2 5.2 5.2 5.2 5.3 5.3Israel 8.7 8.8 8.8 9.0 9.1 9.1 9.2 9.3 9.4 9.5 9.6Saudi Arabia 4.3 4.3 4.4 4.4 4.4 4.5 4.5 4.5 4.6 4.6 4.7South Africa 8.7 8.2 9.4 8.2 8.1 8.2 8.2 8.2 8.2 8.2 8.2
TOTAL 6.1 6.1 6.1 6.2 6.2 6.2 6.2 6.3 6.2 6.3 6.3
WORLD TOTAL 10.2 10.2 10.3 10.3 10.4 10.6 10.7 10.9 11.0 11.2 11.4
Note: All figures are rounded; the base year is 2005. Source: Frost & SullivanDefinition
Note1. Regional and World total are calculated using weighted average of countries in the region and are not the simple average.
The above figures represent Healthcare Expenditure as percentage of Gross Domestic Product.
Source: Frost & SullivanSource: Frost & Sullivan
36P3B5-54
Decision Support Databases (Contd…)
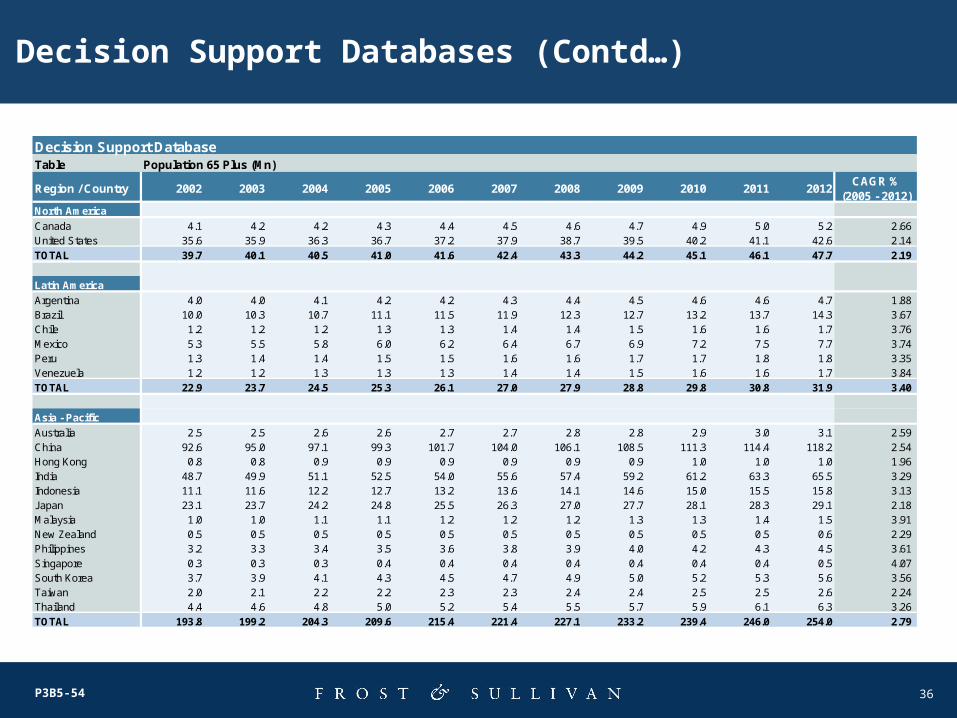
Decision Support DatabaseTable Population 65 Plus (Mn)
Region / Country 2002 2003 2004 2005 2006 2007 2008 2009 2010 2011 2012CAGR %
(2005 - 2012)North America
Canada 4.1 4.2 4.2 4.3 4.4 4.5 4.6 4.7 4.9 5.0 5.2 2.66United States 35.6 35.9 36.3 36.7 37.2 37.9 38.7 39.5 40.2 41.1 42.6 2.14
TOTAL 39.7 40.1 40.5 41.0 41.6 42.4 43.3 44.2 45.1 46.1 47.7 2.19
Latin America
Argentina 4.0 4.0 4.1 4.2 4.2 4.3 4.4 4.5 4.6 4.6 4.7 1.88Brazil 10.0 10.3 10.7 11.1 11.5 11.9 12.3 12.7 13.2 13.7 14.3 3.67Chile 1.2 1.2 1.2 1.3 1.3 1.4 1.4 1.5 1.6 1.6 1.7 3.76Mexico 5.3 5.5 5.8 6.0 6.2 6.4 6.7 6.9 7.2 7.5 7.7 3.74Peru 1.3 1.4 1.4 1.5 1.5 1.6 1.6 1.7 1.7 1.8 1.8 3.35Venezuela 1.2 1.2 1.3 1.3 1.3 1.4 1.4 1.5 1.6 1.6 1.7 3.84
TOTAL 22.9 23.7 24.5 25.3 26.1 27.0 27.9 28.8 29.8 30.8 31.9 3.40
Asia - Pacific
Australia 2.5 2.5 2.6 2.6 2.7 2.7 2.8 2.8 2.9 3.0 3.1 2.59China 92.6 95.0 97.1 99.3 101.7 104.0 106.1 108.5 111.3 114.4 118.2 2.54Hong Kong 0.8 0.8 0.9 0.9 0.9 0.9 0.9 0.9 1.0 1.0 1.0 1.96India 48.7 49.9 51.1 52.5 54.0 55.6 57.4 59.2 61.2 63.3 65.5 3.29Indonesia 11.1 11.6 12.2 12.7 13.2 13.6 14.1 14.6 15.0 15.5 15.8 3.13Japan 23.1 23.7 24.2 24.8 25.5 26.3 27.0 27.7 28.1 28.3 29.1 2.18Malaysia 1.0 1.0 1.1 1.1 1.2 1.2 1.2 1.3 1.3 1.4 1.5 3.91New Zealand 0.5 0.5 0.5 0.5 0.5 0.5 0.5 0.5 0.5 0.5 0.6 2.29Philippines 3.2 3.3 3.4 3.5 3.6 3.8 3.9 4.0 4.2 4.3 4.5 3.61Singapore 0.3 0.3 0.3 0.4 0.4 0.4 0.4 0.4 0.4 0.4 0.5 4.07South Korea 3.7 3.9 4.1 4.3 4.5 4.7 4.9 5.0 5.2 5.3 5.6 3.56Taiwan 2.0 2.1 2.2 2.2 2.3 2.3 2.4 2.4 2.5 2.5 2.6 2.24Thailand 4.4 4.6 4.8 5.0 5.2 5.4 5.5 5.7 5.9 6.1 6.3 3.26
TOTAL 193.8 199.2 204.3 209.6 215.4 221.4 227.1 233.2 239.4 246.0 254.0 2.79
37P3B5-54
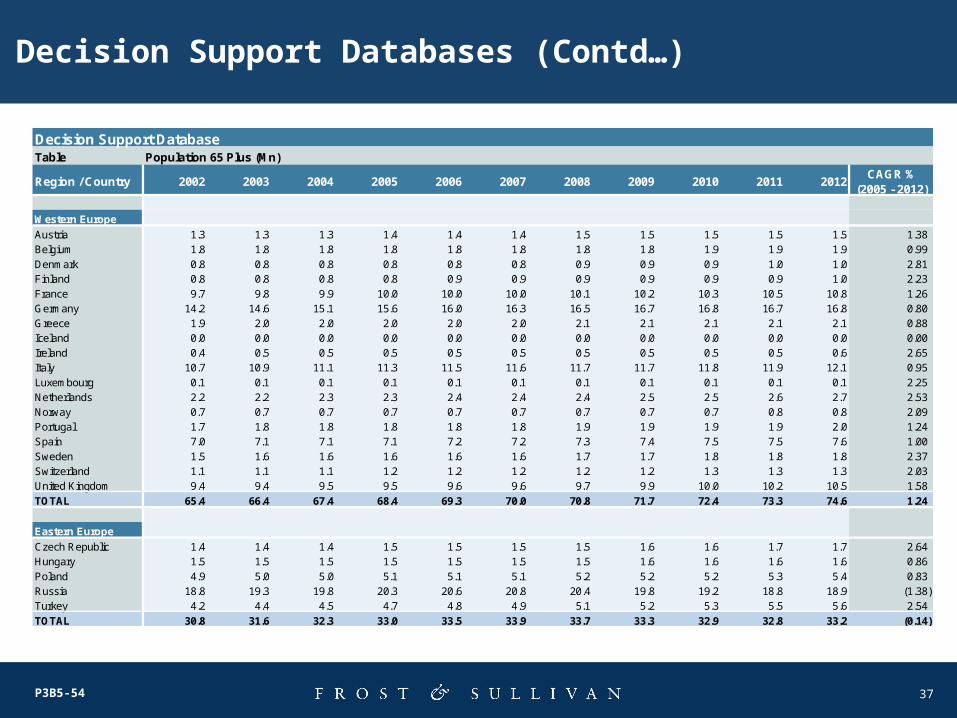
Decision Support Databases (Contd…)
Decision Support DatabaseTable Population 65 Plus (Mn)
Region / Country 2002 2003 2004 2005 2006 2007 2008 2009 2010 2011 2012CAGR %
(2005 - 2012)
Western Europe
Austria 1.3 1.3 1.3 1.4 1.4 1.4 1.5 1.5 1.5 1.5 1.5 1.38Belgium 1.8 1.8 1.8 1.8 1.8 1.8 1.8 1.8 1.9 1.9 1.9 0.99Denmark 0.8 0.8 0.8 0.8 0.8 0.8 0.9 0.9 0.9 1.0 1.0 2.81Finland 0.8 0.8 0.8 0.8 0.9 0.9 0.9 0.9 0.9 0.9 1.0 2.23France 9.7 9.8 9.9 10.0 10.0 10.0 10.1 10.2 10.3 10.5 10.8 1.26Germany 14.2 14.6 15.1 15.6 16.0 16.3 16.5 16.7 16.8 16.7 16.8 0.80Greece 1.9 2.0 2.0 2.0 2.0 2.0 2.1 2.1 2.1 2.1 2.1 0.88Iceland 0.0 0.0 0.0 0.0 0.0 0.0 0.0 0.0 0.0 0.0 0.0 0.00Ireland 0.4 0.5 0.5 0.5 0.5 0.5 0.5 0.5 0.5 0.5 0.6 2.65Italy 10.7 10.9 11.1 11.3 11.5 11.6 11.7 11.7 11.8 11.9 12.1 0.95Luxembourg 0.1 0.1 0.1 0.1 0.1 0.1 0.1 0.1 0.1 0.1 0.1 2.25Netherlands 2.2 2.2 2.3 2.3 2.4 2.4 2.4 2.5 2.5 2.6 2.7 2.53Norway 0.7 0.7 0.7 0.7 0.7 0.7 0.7 0.7 0.7 0.8 0.8 2.09Portugal 1.7 1.8 1.8 1.8 1.8 1.8 1.9 1.9 1.9 1.9 2.0 1.24Spain 7.0 7.1 7.1 7.1 7.2 7.2 7.3 7.4 7.5 7.5 7.6 1.00Sweden 1.5 1.6 1.6 1.6 1.6 1.6 1.7 1.7 1.8 1.8 1.8 2.37Switzerland 1.1 1.1 1.1 1.2 1.2 1.2 1.2 1.2 1.3 1.3 1.3 2.03United Kingdom 9.4 9.4 9.5 9.5 9.6 9.6 9.7 9.9 10.0 10.2 10.5 1.58
TOTAL 65.4 66.4 67.4 68.4 69.3 70.0 70.8 71.7 72.4 73.3 74.6 1.24
Eastern Europe
Czech Republic 1.4 1.4 1.4 1.5 1.5 1.5 1.5 1.6 1.6 1.7 1.7 2.64Hungary 1.5 1.5 1.5 1.5 1.5 1.5 1.5 1.6 1.6 1.6 1.6 0.86Poland 4.9 5.0 5.0 5.1 5.1 5.1 5.2 5.2 5.2 5.3 5.4 0.83Russia 18.8 19.3 19.8 20.3 20.6 20.8 20.4 19.8 19.2 18.8 18.9 (1.38)Turkey 4.2 4.4 4.5 4.7 4.8 4.9 5.1 5.2 5.3 5.5 5.6 2.54
TOTAL 30.8 31.6 32.3 33.0 33.5 33.9 33.7 33.3 32.9 32.8 33.2 (0.14)
38P3B5-54
Decision Support Databases (Contd…)
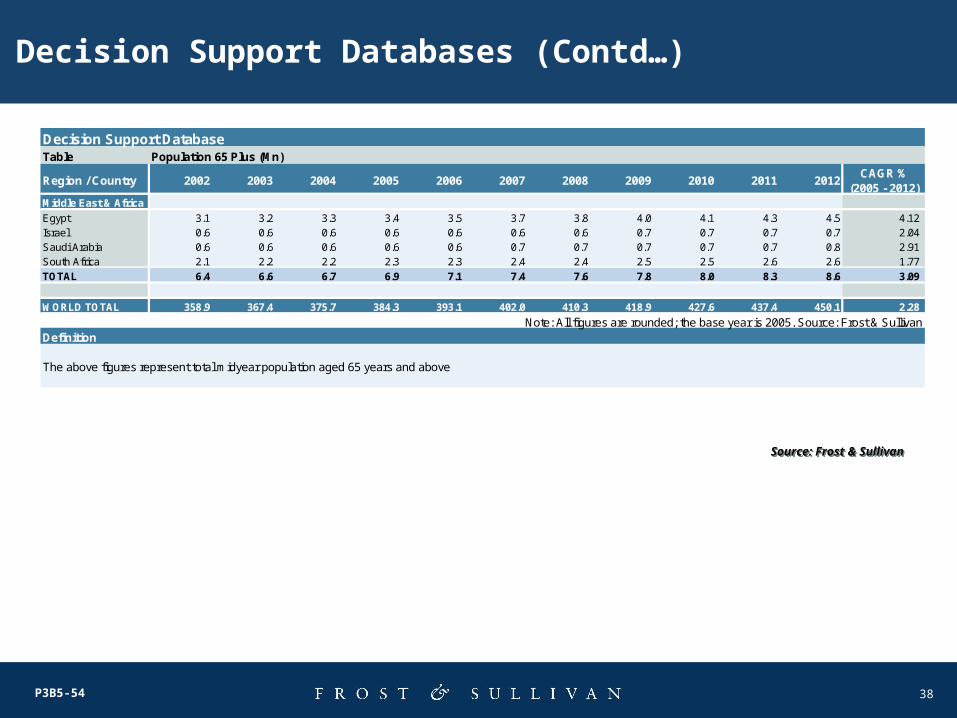
Decision Support DatabaseTable Population 65 Plus (Mn)
Region / Country 2002 2003 2004 2005 2006 2007 2008 2009 2010 2011 2012CAGR %
(2005 - 2012)Middle East & Africa
Egypt 3.1 3.2 3.3 3.4 3.5 3.7 3.8 4.0 4.1 4.3 4.5 4.12Israel 0.6 0.6 0.6 0.6 0.6 0.6 0.6 0.7 0.7 0.7 0.7 2.04Saudi Arabia 0.6 0.6 0.6 0.6 0.6 0.7 0.7 0.7 0.7 0.7 0.8 2.91South Africa 2.1 2.2 2.2 2.3 2.3 2.4 2.4 2.5 2.5 2.6 2.6 1.77
TOTAL 6.4 6.6 6.7 6.9 7.1 7.4 7.6 7.8 8.0 8.3 8.6 3.09
WORLD TOTAL 358.9 367.4 375.7 384.3 393.1 402.0 410.3 418.9 427.6 437.4 450.1 2.28
Note: All figures are rounded; the base year is 2005. Source: Frost & SullivanDefinition
The above figures represent total midyear population aged 65 years and above
Source: Frost & SullivanSource: Frost & Sullivan

39
About Frost & Sullivan
40P3B5-54
Who is Frost & Sullivan
The Growth Partnership Company
• Founded in 1961, Frost & Sullivan has over 45 years of assisting clients with their decision-making
and growth issues.
• Over 1,700 Growth Consultants and Industry Analysts across 32 global locations
• Over 10,000 clients worldwide - emerging companies, the global 1000 and the investment community
• Developers of the Growth Excellence Matrix – industry leading growth positioning tool for corporate
executives
• Developers of TEAM Methodology, proprietary process to ensure that clients receive a 360o
perspective of technology, markets and growth opportunities
• Three core services: Growth Partnership Services, Growth Consulting and Career Best
Practices
41P3B5-54
What Makes Us Unique
Exclusively Focused on Growth
Global thought leader exclusively focused on addressing client growth strategies and plans – Team actively engaged in researching and developing of growth models that enable clients to achieve aggressive growth objectives.
Industry Breadth
Cover the broad spectrum of industries and technologies to provide clients with the ability to look outside the box and discover new and innovative ideas.
Global Perspective
32 global offices ensure that clients receive a global coverage/perspective based on regional expertise.
360o Perspective
Proprietary TEAM Methodology integrates all 6 critical research methodologies to significantly enhance the accuracy of decision making and lower the risk of implementing growth strategies.
Growth Monitoring
Continuously monitor changing technology, markets and economics and proactively address clients growth initiatives and position.
Trusted Partner
Working closely with client Growth Teams – helping them generate new growth initiatives and leverage all of Frost & Sullivan assets to accelerate their growth.
42P3B5-54
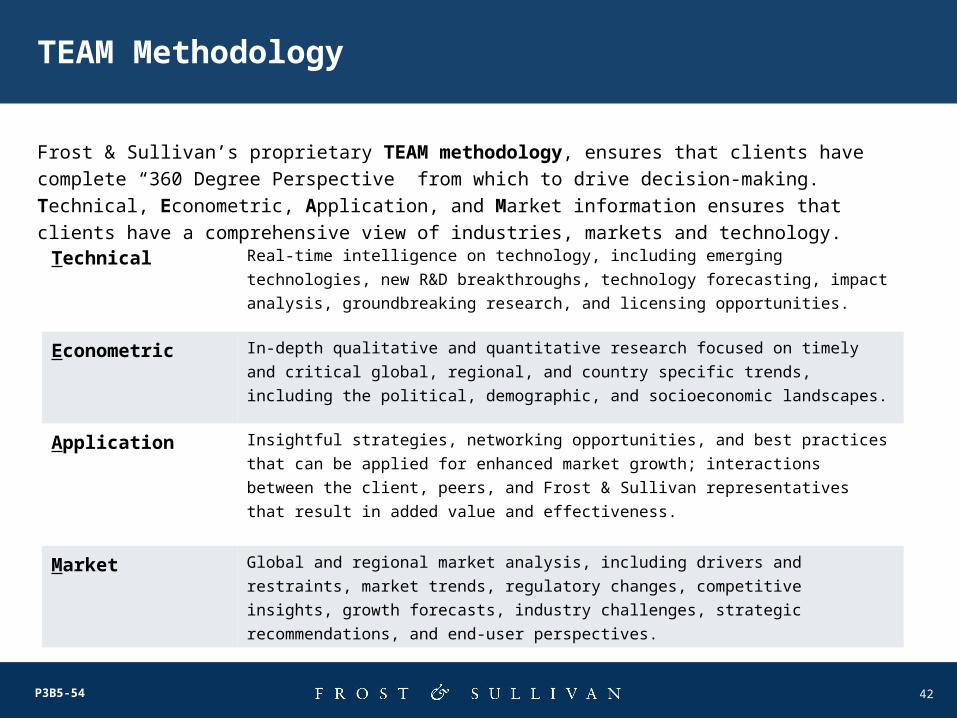
TEAM Methodology
Frost & Sullivan’s proprietary TEAM methodology, ensures that clients have complete “360 Degree
Perspective” from which to drive decision-making. Technical, Econometric, Application, and Market
information ensures that clients have a comprehensive view of industries, markets and technology.
Technical Real-time intelligence on technology, including emerging technologies, new
R&D breakthroughs, technology forecasting, impact analysis, groundbreaking
research, and licensing opportunities.
Econometric In-depth qualitative and quantitative research focused on timely and critical
global, regional, and country specific trends, including the political,
demographic, and socioeconomic landscapes.
Application Insightful strategies, networking opportunities, and best practices that can be
applied for enhanced market growth; interactions between the client, peers, and
Frost & Sullivan representatives that result in added value and effectiveness.
Market Global and regional market analysis, including drivers and restraints, market
trends, regulatory changes, competitive insights, growth forecasts, industry
challenges, strategic recommendations, and end-user perspectives.
43P3B5-54
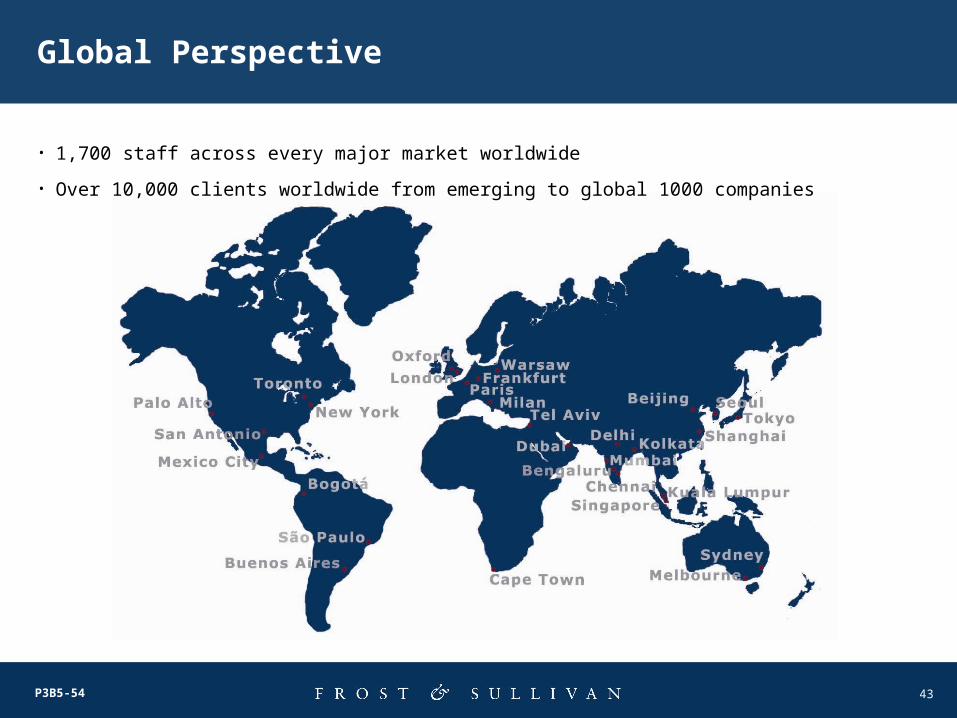
Global Perspective
• 1,700 staff across every major market worldwide
• Over 10,000 clients worldwide from emerging to global 1000 companies