Asia Pacific: Industrial
21
Asia Pacific: Industrial and logistics property Accelerating success. Where are the opportunities in manufacturing, last mile and cold chain? April 2021 1
Transcript of Asia Pacific: Industrial

Asia Pacific: Industrial
and logistics property
Accelerating success.
Where are the opportunities in manufacturing, last mile and cold chain?
April 2021
1

Companies in Asia Pacific (APAC) adopt ChinaPlus One strategies for risk mitigation, cost reduction, and access to new markets, while many governments have offered incentives for companies to shift supply chains. The emergence of new or rejuvenated production locations outside China is driving demand for manufacturing facilities. This shift has been reflected in high greenfield foreign direct investment (FDI) in 2019 into APAC manufacturing and high capital flows in 2020 in the combined industrial and logistics property sector, pointing to the growing importance of manufacturing property as an asset class. This report highlights the most attractive cities in APAC outside China for industrial occupiers; it is recommended for property owners to find investment and development opportunities in the same cities.
From 2019 to 2024, online retail sales in APAC is predicted to grow 1.7x to USD2.5 trillion, with the fastest-growing category, online grocery, rising by 30% p.a. This expansion is driving demand for last mile delivery. Thecold chain segment is growing particularly fast, driven by storage and distribution needs for food, pharmaceuticals and other products. This report also explains how occupiers and owners are recommended to participate in the last mile and cold chain segments of the logistics property market.
Finally, the report discusses transaction volumes, rent growth and yields in the combined industrial and logistics property sector, and summarises options and opportunities in manufacturing and logistics property for occupiers and owners across individual markets.
Introduction
Summary and Insights
3
1. China Plus One Strategies:
Significance for Industrial Property
6 – 8
2. Logistics Property:
Last Mile and Cold Chain Segments
9 – 13
3. Investment Perspectives:
Sector Growth Creates Bright
Opportunities for Owners
14-17
Table of Contents
All information of this report as of 23 April 2021 2

Summary and Insights
3
Manufacturing property as an asset class is rising
in importance; since 2011, transactions of
manufacturing assets have grown 19% p.a.
We believe Singapore, Tokyo, Taipei, Ho Chi
Minh City and Bengaluru are particularly likely
to attract industrial occupiers, creating new
opportunities for owners.
Most leading Chinese cities also remain strong
manufacturing locations.
Attractive emerging market cities for other manufacturing activities
Most attractive high-tech manufacturing markets for industrial occupiers outside China
China/Developed
3.4Singapore
3.4Tokyo
Taipei 3.2
Emerging
3.2Ho Chi Minh City
3.1Jakarta
Bengaluru 3.15.0 Most attractive
1.0 Least attractive
China Plus One strategies:
New manufacturing locations appearing in developed and emerging markets
19% p.a.
Since 2011
Logistics property:
Varied approaches necessary to participate in fast-growing last mile
and cold chain
30% p.a. grocery sales growth 2019 2024
Over 2019-2024, online grocery sales in APAC
should grow 30% p.a., driving demand for the
last mile delivery facilities of logistics networks.
We advise investors to focus on logistics
warehouses on city fringes, while occupiers
can leverage the expertise of third-party
logistics (3PL) providers to enter the sector.
Demand for cold chain facilities is surging.
Occupiers can work with 3PLs to find the right
solution to fit their needs, while investors can
refit existing assets or build dedicated
warehouses as a long-run option.
Yields on logistics assets are likely to fall further in
China, Australia, Japan, Korea and Taiwan.
Japan is notably underserved by quality logistics
stock, while in Korea foreign investors can compete
with domestic investors by focusing on logistics.
3

44
Summary of opportunities in selected industrial and logistics markets
Japan (Greater Tokyo, Greater Osaka)
Taiwan
• Northern Taiwan is currently the biggest logistics hub with Taichung and Tainan emerging.
• Occupiers are recommended to work with 3PLs to strengthen their cold-chain networks.
• Asset owners should adopt cloud data and AI to differentiate their services.
• Tenants in Tokyo should seek last mile space out-side the central five wards, in mixed-use developments.
• Investors may apply value-add strategies to older stock. Sites closer to central areas of Tokyo command higher rents and are to be preferred.
South Korea(Greater Seoul)
• Occupiers should target Incheon and Gyeonggi-do due to proximity to Seoul.
• Prices of prime logistics assets are likely to rise over 2021, with yields falling.
• Foreign investors may pursue value-add or opportunistic strategies in logistics.
China(North, East, South)
• As a short-term option, owners may retrofit dry warehouses for cold storage together with a specialist restructurer or operator. In the long run, they should seek sites for dedicated cold chain warehouses on city edges.
• In North China, occupiers and owners are recommended to target Tianjin and Langfang.
• Macro demand drivers remain favourable and we expect elevated leasing activity and rent growth to pick up in 2021.
• We expect yield compression over the next 12 months. Cold storage should attract high investor demand.
• Landlords are recommended to adopt Industry 4.0 guidelines and higher specifications while being flexible in lease negotiations.
• E-commerce majors and 3PLs drive demand in Bengaluru.
• Chennai is seeing growth in renewables and electronics.
• Investors should focus on e-commerce, 3PL and FCMG occupiers and industrial exporters.
India (South)
Singapore
Australia
For more information, please refer to p.19-20
4

01 02 03 04 05
Leasing activity in logistics should grow further in 2021, supported by demand from e-commerce and 3PLs. Supply in most cities is limited. Hence, we expect demand to outstrip supply in the short term, notably in the Grade A class. This market situation favourslandlords.
Rents should rise across APAC in 2021, except in Hong Kong. In China, rents in the big cities should pick up as economic growth and new, more efficient ware-house designs fuel demand. Notably, in Shanghai, we see rents rising 3.0% in 2021.
Sydney and Melbourne had favoured tenants. Looking ahead, however, prospects for demand seem bright, and we expect growth in effective rents of 1.0-2.5% in 2021 after falls of 3.0-5.0% in 2020.
Initial yields for logistics assets range from 3.0%to over 8.0%. Given rising rents and the positive demand-supply balance, we believe yields will decline furtherover the next few years, notably in China. Logistics assets are quite scarce in Shenzhen and Beijing.
Due to lower deal volumes, prices and yields of manufacturing and cold chain assets are hard to track, though this should change as deals increase. In China, cap rates for cold chain assets are typically 0.5-1.0pp higher than for dry storage units.
5
Top 10 industrial and logistics APAC cities in 2019 and 2020
3
Ranking by deal volume in 2020
Total deal volume 2020 (USD billion)
Total deal volume 2019 (USD billion)
YOY growth (%)
Greater Seoul
1
4.663.07
52.0%
Greater Tokyo
2
4.254.94
-14.0%
Sydney
2.352.02
16.2%
Taiwan (excl Taipei)
Hong Kong
6
1.491.84
-19.3%
Shenzhen
9
0.780.38
106.3%
Melbourne
4
1.671.632.5%
Guangzhou7
1.44
0.17
725.9%
1.501.50
-0.3%
Source: RCA
Note: The figures in this graphic include manufacturing, logistics and cold chain assets; they exclude data centres and R&D assets.
APAC
27.08
26.46
2.3%
Brisbane
80.881.04
-15.7%
5
Singapore
100.680.96
-29.0%
Strong demand is driving lower yields in the sector
All information of this report as of 16 April 2021

Capital flows in industrial
• In 2019, APAC received 31% of inward foreign direct investment (FDI) according to the World Investment Report 2020 from UNCTAD (United Nations Conference on Trade and Development), highlighting the region’s attractions to multinational enterprises.
• Within APAC, the bulk of FDI inflows (80%) went to East Asian and South East Asian markets.
• Manufacturing made up over 50% of greenfield FDI inflows in APAC with key beneficiaries including the oil refining, chemicals, IT and electronics, and automotive sectors.
• High FDI into APAC manufacturing and strong capital flows point to the growing importance of industrial property as an asset class.
APAC: Capital flows between markets in
industrial and logistics property (in USD billions)
0.0
1.0
2.0
3.0
4.0
5.0
6.0
7.0
8.0
9.0
10.0
Global to APAC APAC to APAC
China Plus One is a term referring to business strategies by which companies expand their operations to another location outside China, the economic powerhouse of Asia Pacific. Access to new markets, rising costs, risk diversification and tax incentives are some of the main reasons for companies based in China to adopt such strategies.
Companies usually consider wage levels, operating set-up costs, government incentives, land costs and real estate costs. These factors make emerging markets like Vietnam, Thailand, Malaysia, the Philippines and Indonesia in South East Asia and Bangladesh and India in South Asia attractive for companies seeking to expand beyond China. However, developed markets such as Japan, Taiwan, and South Korea are also trying to attract enterprises from China through incentives. For high-technology manufacturing, these markets make sense despite their higher cost base.
Source: RCA
6
USD9.2 billion
China Plus One Strategies –Significance for Industrial Property
1
Data from Real Capital Analytics (RCA) show that aggregate capital flows in APAC’s industrial and logistics property sector reached USD9.2 billion in 2020, up by 5% over 2019 to a ten-year high, despite the COVID-19 recession.
10 yearhigh

China
Colliers manufacturing attractiveness index
Colliers has devised an index to determine the
attractiveness of 31 cities across APAC for
manufacturing occupiers. The index incorporates
GDP, manufacturing gross value added and wages,
logistics networks and rents, total and working
population, consumer spending and disposable
incomes, doing business, technology market
Japan
Tokyo 3.4
Osaka 2.5
Nagoya 2.1
Yokohama 2.1
South Korea
Seoul 2.7
Busan 2.4
Hong Kong SAR¹
Hong Kong 2.7
Taiwan
Greater Taipei
3.2
Australia
Melbourne 3.0
Perth 2.8
Sydney 2.6
Brisbane 2.5
New Zealand
Auckland 2.4
Key manufacturing sectors
• China is the world’s top manufacturing nation.
• Taiwan is known for its semiconductor industry. The key metropolitan area covers the cities of Taipei, New Taipei and Keelung.
• South Korea focuses on high-technology electronics and semiconductors.
• Within South East Asia, Thailand is known for its automotive sector.
• India’s pharmaceuticals prowess has come to the forefront during COVID-19.
• Singapore focuses on high-tech manufacturing.
• Indonesia’s automotive sector is second to Thailand in South East Asia.
• Whilst not China Plus One markets, Australia and New Zealand have strong food and beverage industries. Melbourne, the Australian city ranking highest in our index, has seen rising demand from the food and pharmaceutical sectors.
Developed China Plus One markets
Australia and New Zealand
Emerging China Plus One Markets
Source: Oxford Economics, Bloomberg, World Bank, Numbeo, and Colliers
China
Shanghai 3.9
Shenzhen 3.8
Guangzhou 3.7
Tianjin 3.6
Beijing 3.4
Chengdu 3.4
India
Bengaluru 3.1
Delhi 2.9
Hyderabad 2.8
Mumbai 2.8
Kolkata 2.8
Chennai 2.7
South East Asia (City)
Singapore 3.4
Ho Chi Minh City
3.2
Jakarta 3.1
Kuala Lumpur
2.9
Manila 2.7
Bangkok 2.5
5.0Most
attractive
1.0Least
attractive
Markets scoring 3.0 and above
capitalisation, and growth forecasts over 2020-
2025. The chart below illustrates the cities and
their ranking in the index for both China itself and
developed and emerging China Plus One markets.
Cities scoring 3.0 and above are highlighted.
¹ Special Administrative Region [of the People’s Republic of China]
“Industrial occupiers have the opportunity to locate high-technology manufacturing operations in centres such as Singapore, Tokyo and Taipei, as well as China. Vietnam (Ho Chi Minh City) and Indonesia (greater Jakarta) are attractive for other manufacturing operations.”
Lynus Pook, Senior Director
Regional Industrial Advisory | Asia
7

Opportunities for occupiers and owners
• Based on Colliers’ manufacturing attractiveness index, most leading Chinese cities are strong manufacturing locations.
• Within the wider APAC region, the other cities ranking within the top 10 on the manufacturing attractiveness index are Singapore, Tokyo and Greater Taipei. These cities are primarily attractive for high-technology manufacturing, while Melbourne is seeing a resurgence in food and pharmaceutical manufacturing.
• Among emerging China Plus One markets, Ho Chi Minh City ranks within APAC’s top 10 cities. Jakarta, Bengaluru and Delhi NCR also rank among the top 15. These cities are attractive for other manufacturing activities.
• Investors and developers are already active in the key APAC manufacturing markets. Deal volumes of manufacturing assets in APAC have grown at 19% p.a. since 2011.
• We think Singapore, Tokyo, Taipei, Ho Chi Minh City and Bengaluru are especially likely to attract industrial occupiers, creating new opportunities for owners.
• Existing asset owners should be willing to invest in upgradingtheir facilities to attract international occupiers.
• For emerging China Plus One markets, investors may seek to partner with occupiers and invest in built-to-suit facilities.
• Investors may also consider sale and leaseback of manufacturing facilities in both the developed and emerging China Plus One markets with existing multinational occupiers.
Occupiers
Owners
Why emerging markets?
Emerging China Plus One markets (India, Vietnam,
Indonesia, Thailand and the Philippines) present the
following attractions for manufacturing occupiers:
Challenges remain, Thailand is the only emerging
China Plus One market within the top 50 in the
World Bank's Ease of Doing Business ranking.
Besides economic incentives, these governments
should create and foster a conducive business
environment.
“Over the course of the last 24 months, we have assisted many multinational manufacturing companies acquire land and establish built-to-suit operations in these specific emerging markets.”
Rick Thomas, Managing Director
Emerging Markets| Singapore
3
1 Manufacturing represents 15-26% of GDP in these markets, growing at about 6% p.a. in contrast to leading Chinese cities growing at under 4.5% p.a.
2
Internet penetration rates are under 70%, versus over 85% in developed markets. This indicates better prospects for e-commerce growth and consequently manufacturing output.
While aggregate industrial transaction volumes only reached USD250 million in 2020, they have been growing 25%+ p.a.
8

A recent report from Forrester predicts that online
grocery shopping in APAC will grow at 30% p.a.
from 2019 to 2024, and suggests that it is one of
the fastest growing e-commerce segments.
This surging growth in retail e-commerce has been
the driving force behind greatly increased activity
in the logistics market (i.e., distribution), and hence
behind rapid growth in demand for space in
logistics warehouses.
Improvements in the last mile delivery segment of
the logistics market, (i.e., the part of distribution
networks closest to customers), have fuelled
growth in the sector overall. Another segment
expanding quickly is cold chain, which is
refrigerated or air-conditioned storage and
distribution, reflecting rising demand for
shipments of fresh food and pharmaceuticals
products.
0.0
2.0
4.0
6.0
8.0
10.0
12.0
14.0
16.0
Distribution Refrigerated
Growth in logistics and cold chain deal volumes (USD bn)
Source: RCA
Exceptional growth: Key facts and figures
¹ Source: Forrester
² Source: Business Market Insights3 Source: IMARC Group4 Source: Colliers5 Source: PwC6 Source: RCA
Logistics assets account for over 60% of combined industrial and logistics deals in APAC.6
Although transaction volumes for last mile assets are limited, the growth in online shopping and the rapid growth of cold chain logistics point towards rising transactions from now on.
Transaction volumes for cold chain storage facilities totaled USD2.0 billionin 2020 and have been growing at an average annual rate of 21% since 2011.6
Aggregate retail e-commerce to grow 1.7x from USD1.5 trillion in 2019 to USD2.5 trillion by 2024. Online grocery is the fastest-growing category, and is predicted to expand by 30% p.a.1
APAC last mile delivery segment to grow 4.6x from USD0.5 billion in 2018 to USD2.3 billion by 2027, implying average annual growth of 19%.²
APAC cold chain segment to grow 2.3x from USD111 billion in 2020 to USD255 billion by 2026, implying average annual growth of 15%.³
Colliers’ survey of professionals in the Philippines finds that over 75% are prepared to pay more for same day delivery.⁴ Similarly, over 60% of Southeast Asian shoppers are ready to pay more for same day delivery.5
9
Logistics Property: Last Mile and Cold Chain Segments
2

Last mile property: key asset types
Last mile delivery is the transfer of goods from the
warehouse or delivery hub to the end-user. The
challenge for last mile facilities is that they must be
very close to customers for fast delivery times.
While urban warehouses are solutions, sometimes
they may not be situated in the right location.
Typically, last mile delivery facilities take the
following formats:
“The inner ring of Sydney is set to become Sydney’s
last mile logistics epicentre given the high
population density and access to a large population
base. Securing a site in this area maximises an
occupier’s last mile footprint by positioning the
occupier closer to the end-user.”
Gavin Bishop, Head of
Industrial Capital Markets | Australia
Urban
warehouses
Full-specification
logistics
warehouses
Off-CBD and
fringe CBD
catering to the
urban market
Local and
international
companies
Supermarket
retailer, Coles,
employs this
strategy in
Sydney and
Melbourne
Retail
outlets
Part of retailers'
networks,
typically the back-
of-house of retail
stores
Predominantly in
residential
neighbourhoods
Local and
international
companies
Fairprice in
Singapore,
Woolworths in
Australia, Alibaba
through Hema
stores in China
Micro fulfilment
centres or front
distribution
centres in China
Retail outlets,
warehouses,
repurposed
commercial real
estate
Predominantly in
residential
neighbourhoods
Individual or
strata-titled
E-commerce
majors as well
as 3PL service
providers
‘Dark’
stores
Retail outlets that
do not allow
customers to
browse or
purchase
Residential
neighbourhoods
and urban
centres
Individual or
strata-titled
Large retailers,
e-commerce
majors as well as
3PL service
providers
CharacteristicsProperty Type Location Ownership Occupiers
Source: Colliers
10

Characteristics of last mile assetsMarket perspective
s
• In Australia, for centrally located
prime last mile properties, annual
rents range from USD100-124
per sq metre in Sydney and
approximately USD77-93 per sq
metre in Melbourne. Smaller
facilities (<2,500 sq metres) have
higher rents.
• In the rest of APAC, rents depend
on location and original use of the
premises. For instance, in China,
front distribution centres are often
located in shopping malls, and so
are subject to retail rents (much
higher than typical logistics rents).
• Last mile facilities by their very
nature are smaller units, with most
having sizes of 2,000 sq metres or
below. These assets are typically
owned by individual entities or are
located within strata-titled
buildings.
• Given the fragmented nature of
these facilities and small holding
sizes, direct investment in last
mile facilities is challenging.
Location
Located in or near high-density
residential areas or major
roadways for fast delivery times.
Building quality
Facility must process large volumes
of goods and allow efficient flow
both in and out of the premises.
Good ceiling heights
Should accommodate vertical
racking systems. Speed bays and
wider column spacing also allow
efficient racking systems.
Cross-docking
Minimising handling is critical for
food and other perishable goods.
Cross-docking facilities allow for
efficient and smooth transfer of
goods.
Energy efficiency
Operating cost is a major concern.
Since 30-50% of delivery costs take
place in the last mile, asset owners
and investors should employ
sustainable solutions to safeguard
facilities against challenges in the
future.
“China has one of the world’s highest levels of retail e-commerce: 30% of China’s retail sales were online in 2020.¹ Due to the growing emphasis on same day delivery, we expect usage of front distribution centres –the last stage of logistics distribution in
China – to maintain rapid expansion over the next few years.”
Tammy Tang,
Managing Director | China
11
¹ Source: State Statistics Bureau

Limited land supply
Securing a suitable site for new cold storage warehouses is a major challenge –perhaps the biggest overall for both developers and occupiers. In China, landlords and tenants are retrofitting existing warehouses to meet cold chain demand.
High investment needs
Design complexity and the use of high-quality materials such as insulation mean construction costs are up to three times higher than traditional warehouses. Construction duration is also appreciably longer.
High operating costs
Specialised cooling and air conditioning systems require higher power and greater maintenance than traditional warehouses. High technical design standards and specifications are key to reducing costs.
Four cold chain asset types
Frozen(-16℃ to -26℃)
These facilities are used for food and perishable produce, pharmaceutical products,
and other goods such as chemicals, wine or works of art. Typical occupiers include
cold storage logistics specialists, 3PLs, supermarkets or other retailers, and end-users
such as grocery, FMCG and pharmaceutical companies.
Cold storage(-1℃ to 4℃)
Fresh produce(0℃ to 8℃)
Air-conditioned (17℃ to 22℃)
What are the cold chain challenges?
Transaction volumes of cold chain assets have been growing across APAC, reflecting rising demand and the rental premium (up to 100% or even higher) that dedicated cold chain assets command over dry warehouses. However, some of the development challenges in this sector include:
Cold chain property: A rising asset class
Cold chain warehouses are used to store, pack, and distribute temperature-sensitive and perishable products in a controlled environment.
APAC’s large population is a key demand driver in this sector. Forecasts from Oxford Economics suggest that domestic consumption expenditure will grow by 6.2% annually between 2021 and 2025, with China and India leading the trend with forecast annual growth rates of 8.7% and 8.2%, respectively.
“Demand for cold chain facilities has been surging across APAC as shipments of food and perishable goods rise, and this will continue. Investors and developers should embrace the opportunity in the cold chain segment to achieve a premium rental outcome.”
CK Lau, Managing Director |
Valuation & Advisory Services | Asia
Government support also plays a role. For example, the Indian government offers 100% tax deduction on profits earned in cold chain for the first five years, followed by a 25%-30% deduction for the next five. In addition, 100% FDI is allowed within the sector. Finally, the government grants financial assistance of 35%-50% of the admissible cost of cold chain projects1. With the current emphasis on vaccine distribution, we expect to see more government initiatives in the sector.
¹ Source: Govt Incentives and Schemes for the Cold Chain Industry
12

for cold chain. We believe property investors and private equity firms will consider investment in cold chain operating companies.
Despite high investment needs and machinery maintenance costs, this strategy should prove attractive to cold chain operators and investors alike. Investors should note, however, that the rental premium is likely to narrow over time as more cold chain facilities are constructed.
• Last mile facilities are mostly fragmented, and so direct investment is challenging. Investors should focus on logistics warehouses on city fringes, which act as hubs for the last mile.
• While cold chain is seeing surging growth, owners face various challenges in this segment, in particular limited land supply. The reward for investment in cold chain facilities is a 50-100% rental premium, although this is likely to narrow over time.
• Renovating and retrofitting standard dry warehouses for cold storage is a short-term option for owners. In China, this may most easily be done in partnership with a specialist cold chain restructurer or operating company.
• In the long term, investors should look for viable locations to develop dedicated cold chain warehouses in the peripheries of urban areas.
• Depending on the market, occupiers have a choice of urban warehouses, retail outlets, micro fulfilment centres (front distribution centres) and dark stores for last mile delivery.
• Urban warehouses are an organised sector and leasing deals can be facilitated through existing logistics service providers.
• Micro fulfilment centres are usually owned by individual entities or located in strata-titled buildings. For services offered via these centres, it is appropriate for occupiers to work with 3PL service providers.
• Cold chain is more organised. As a result, occupiers can shop around for the right solution to meet their requirements.
End-user10-20 yearsHigh standard warehouse
3rd party cold chain restructurer
(operating company)
3+3 years
Leased at rents ofRMB1.50-1.90 per day
Rent + renovation cost + profit (RMB3.0-3.5 per day, excluding electricity)
Typical Conversion Process
Source: Colliers
Value-add opportunities
As cold chain facilities have higher profit margins, conversions are popular in China. Typically, operators obtain long leases in Grade A dry warehouses at market rates. The facility is then retrofitted for cold storage and sublet to end-users at a 50-100% rent premium.
Traditionally, developers have acquired land to build dry warehouses, but they can now partner with specialist restructurers to refit the assets
Opportunities for occupiers and owners
Occupiers
Owners
13
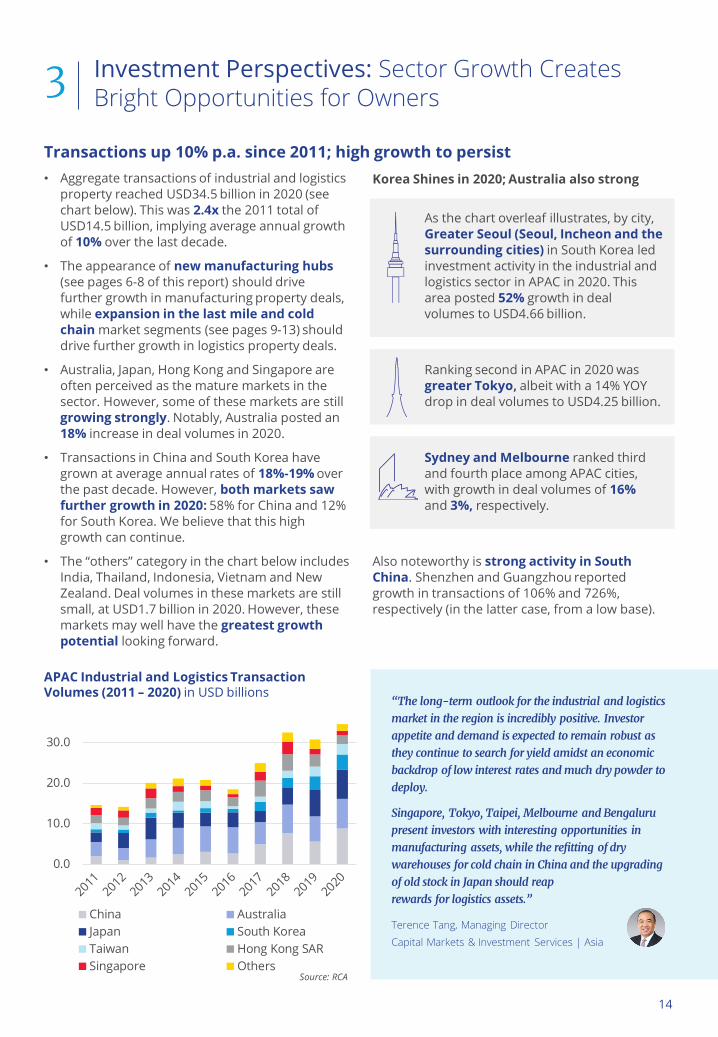
Transactions up 10% p.a. since 2011; high growth to persist
Korea Shines in 2020; Australia also strong
As the chart overleaf illustrates, by city, Greater Seoul (Seoul, Incheon and the surrounding cities) in South Korea led investment activity in the industrial and logistics sector in APAC in 2020. This area posted 52% growth in deal volumes to USD4.66 billion.
Ranking second in APAC in 2020 was greater Tokyo, albeit with a 14% YOY drop in deal volumes to USD4.25 billion.
Sydney and Melbourne ranked third and fourth place among APAC cities, with growth in deal volumes of 16%and 3%, respectively.
Also noteworthy is strong activity in South China. Shenzhen and Guangzhou reported growth in transactions of 106% and 726%, respectively (in the latter case, from a low base).
Investment Perspectives: Sector Growth CreatesBright Opportunities for Owners
0.0
10.0
20.0
30.0
China Australia
Japan South Korea
Taiwan Hong Kong SAR
Singapore Others
APAC Industrial and Logistics Transaction Volumes (2011 – 2020) in USD billions
Source: RCA
14
• Aggregate transactions of industrial and logistics property reached USD34.5 billion in 2020 (see chart below). This was 2.4x the 2011 total of USD14.5 billion, implying average annual growth of 10% over the last decade.
• The appearance of new manufacturing hubs (see pages 6-8 of this report) should drive further growth in manufacturing property deals, while expansion in the last mile and cold chain market segments (see pages 9-13) should drive further growth in logistics property deals.
• Australia, Japan, Hong Kong and Singapore are often perceived as the mature markets in the sector. However, some of these markets are still growing strongly. Notably, Australia posted an 18% increase in deal volumes in 2020.
• Transactions in China and South Korea have grown at average annual rates of 18%-19% over the past decade. However, both markets saw further growth in 2020: 58% for China and 12% for South Korea. We believe that this high growth can continue.
• The “others” category in the chart below includes India, Thailand, Indonesia, Vietnam and New Zealand. Deal volumes in these markets are still small, at USD1.7 billion in 2020. However, these markets may well have the greatest growth potential looking forward.
“The long-term outlook for the industrial and logistics market in the region is incredibly positive. Investor appetite and demand is expected to remain robust as they continue to search for yield amidst an economic backdrop of low interest rates and much dry powder to deploy.
Singapore, Tokyo, Taipei, Melbourne and Bengaluru present investors with interesting opportunities in manufacturing assets, while the refitting of dry warehouses for cold chain in China and the upgrading of old stock in Japan should reap rewards for logistics assets.”
Terence Tang, Managing Director
Capital Markets & Investment Services | Asia
3

3
Greater Seoul
1
4.663.07
52.0%
Greater Tokyo
2
4.254.94
-14.0%
Sydney
2.352.02
16.2%
Taiwan (excl Taipei)
Hong Kong
61.491.84
-19.3%
Shenzhen
90.780.38
106.3%
Singapore
Melbourne
4
1.671.632.5%
Guangzhou71.44
0.17
725.9%
1.501.50
-0.3%
APAC industrial and logistics transaction
volumes (2011 – 2020) in USD billions by category
Source: RCA
Notes: “Unclassified” refers to industrial assets whose use has not been specified, “Distribution” refers to logistics assets, “Technology” refers to data centres, “Refrigerated” refers to properties with cold storage facilities, and “R&D” refers to assets occupied by medical, lab, and scientific research purposes
Top 10 APAC industrial and logistics cities in 2019 and 2020
Source: RCA
Note: The figures in this graphic include manufacturing, logistics and cold chain assets; they exclude data centres and R&D assets.
0.0
5.0
10.0
15.0
20.0
25.0
30.0
35.0
2011 2012 2013 2014 2015 2016 2017 2018 2019 2020
Unclassified Distribution Manufacturing
Technology Refrigerated R&D
Brisbane
80.881.04
-15.7%
5100.680.96
-29.0%
Growth in data centres is itself a sign of fast growth in e-commerce, and adoption of 5G, the Internet of Things, video streaming and gaming. This growth should indirectly boost demand for manufacturing and distribution facilities, given the need to fabricate and store end-products.
Key market segments 2011-2020
7%42%
Distribution assets (logistics)
Manufacturing assets
Technology assets (data centres)
Refrigerated facilities (cold storage)
62%12%
% of classified transactions9-Year avg growth rate p.a. (%)
20%19%
7%21%
Ranking by deal volume in 2020
Total deal volume 2020 (USD billion)
Total deal volume 2019 (USD billion)
YOY growth (%)
1
APAC
27.08
26.46
2.3%
Source: RCA
15

APAC Logistics: forecasts and trends for occupiers and investors
Note: 1. Rent refers to Grade A and/or more premium grade warehouse net effective rent on
a GFA basis, except for Taipei which is reporting industrial park rent. Singapore rent refers to average rents for the overall warehouse market.
2. Capital values are based on Grade A and/or premium grade warehouse lettable area on a GFA basis.
3. Yields shown are initial yields, i.e net effective rent over price. Cap rates based on net operating income including operating costs will be slightly lower.
Delhi-NCR
2.9
435
7.5%–8.5%
Source: RCA, Colliers
01 02 03 04 05
Leasing activity in logistics should grow further in 2021, supported by demand from e-commerce and 3PLs. Supply in most cities is limited. Hence, we expect demand to outstrip supply in the short term, notably in the Grade A class. This market situation favourslandlords.
Rents should rise across APAC in 2021 except in Hong Kong. In China, rents in the big cities should pick up as economic growth and new, more efficient warehouse designs fuel demand. Notably, in Shanghai, we see rents rising 3.0% in 2021.
Sydney and Melbourne had favouredtenants. Looking ahead, however, prospects for demand seem bright, and we expect growth in effective rents of 1.0-2.5% in 2021 after falls of 3.0-5.0% in 2020.
Initial yields for logistics assets range from 3.0%to over 8.0%. Given rising rents and the positive demand-supply balance, we think yields will decline further over the next few years, notably in China. Logistics assets are quite scarce in Shenzhen and Beijing.
Due to lower deal volumes, prices and yields of manufacturing and cold chain assets are hard to track, though this should change as deals increase. In China, cap rates for cold chain assets are typically 0.5-1.0pp higher than for dry storage units.
Strong demand is driving lower yields in the sector
Capital Value
Initial Yield
Rent USD/sq m/monthYE 2020
2021 2022 2023
USD/sq m YE 2020 2021 2022 2023
% YE 2020 2021 2022 2023
Mumbai
3.0
424
8%–9%
Bengaluru
2.4
339
8%–9%
Ho Chi Minh City
5.0
750
8.0%
Singapore
8.2
4,100
6.0%
Jakarta
4.9
563
7.8%
Melbourne
6.5
1,540
5.1%
Sydney
9.9
2,640
4.5%
Auckland
7.3
2,300
4.5%
Beijing
8.1
1,890
5.1%
Shanghai
7.0
1,580
5.3%
Greater Seoul
8.0
1,600
4.5%
Taipei
13.1
2,720
3.4%
Hong Kong SAR
17.1
6,290
3.3%
Guangzhou
6.3
1,400
5.4%
Shenzhen
7.6
1,600
5.0%
Tokyo
Beijing
Shanghai
CALABA
Singapore
Guangzhou TaipeiMumbai
Delhi-NCR
Seoul
Hong KongShenzhen
Sydney
Melbourne
BengaluruHo Chi Minh City
Jakarta
Auckland
Greater Tokyo
12.3
3,950
3.5-4.0%
16

Opportunities for asset owners and investors
• High capital flows and deal volumes in the industrial and logistics sector show the rising importance of manufacturing property as an asset class. Transactions of industrial assets in APAC have grown at 19% p.a. since 2011.
• New manufacturing hubs (Singapore, Tokyo, Taipei, Melbourne, Bengaluru) should attract high-quality industrial occupiers, creating new investment and development opportunities for owners.
• Industrial deal volumes remain well below logistics deal volumes, so yields and prices in this sub-sector are hard to track.
Opportunities for asset owners and investors
Opportunities for asset owners and investors
• Direct investment in last mile assets is difficult. We advise investors to focus on logistics warehouses on city fringes.
• Despite ample challenges (see page 12), the reward for investment in cold chain assets is a 50-100% rent premium, though this should narrow over time.
• Retrofitting standard dry warehouses for cold storage is a short-term option for owners. In China, this may be done in partnership with a specialist cold chain restructurer (see page 13).
• In the long run, investors should seek sites to develop dedicated cold chain warehouses on the edges of cities.
• Logistics rents are generally rising. Yields look set to fall further in China, Australia, Japan, Korea and Taiwan.
• Japan is notably underserved by logistics stock. In Korea, foreign firms can compete with domestic investors by focusing on logistics.
Investors
China Plus One strategies
• Companies adopt China Plus One strategies for risk mitigation, cost reduction, and access to new markets.
• Based on the Colliers Manufacturing Attractiveness Index, good locations for advanced manufacturing include most leading Chinese cities plus Singapore, Tokyo and Greater Taipei. Also ranking among the top 15 in APAC is Melbourne.
• Manufacturing hubs in emerging markets include Ho Chi Minh City, Jakarta, Bengaluru and Delhi NCR. These cities are attractive sites for other manufacturing operations.
Logistics property: Last mile and cold chain segments
• Over 2019-2024, online grocery shopping in APAC should grow by 30% p.a., driving demand for last mile delivery facilities.
• The cold chain segment is growing fast, driven by storage and distribution needs for food and perishable goods.
• Urban warehouses are an organisedmarket. Most other last mile facilities are small and fragmented.
• Most logistics markets favour landlords, with high demand and limited supply.
Investors
1717

Conclusion
Outside China, industrial occupiers should target
Singapore, Tokyo and greater Taipei for high-
technology manufacturing, Melbourne for food and
pharmaceutical manufacturing, and emerging cities
such as Ho Chi Minh City, Jakarta and Bengaluru for
other manufacturing activities. With manufacturing
property rising in importance as an asset class,
property investors and developers should pay
greater attention to this market. We think
Singapore, Tokyo, Taipei, Ho Chi Minh City and
Bengaluru are especially likely to attract
industrial enterprises, creating new
opportunities for owners.
Rapid growth in online retail sales is driving
demand for the last mile delivery facilities of
logistics networks, but this segment is fragmented
in many markets. Occupiers have various options
but should work with 3PL providers to offer
services via micro fulfilment or front
distribution centres. For owners, direct
investment in last mile assets is challenging, and so
we recommend that investors focus on logistics
warehouses on city fringes. Colliers’ industrial
and capital markets teams are available to advise
further on appropriate solutions for entry to this
segment.
The fastest-growing category of online retail is
online grocery, and delivery of food and perishable
goods is driving surging demand for cold chain
facilities. This market segment is more organised.
Tenants can shop around for the right solution
to their needs, while owners can refit existing
assets or build dedicated warehouses as a long-
run option. Refitting of dry warehouses for cold
chain in China is an attractive option for investors.
Most APAC logistics markets favour landlords, with
rents rising steadily. Yields should fall further in
China, Australia, Japan, Korea and Taiwan.
Upgrading of old stock in Japan should also reap
rewards for investors and developers, while in
Korea foreign investors can compete with
domestic investors by employing value-add or
opportunistic strategies in logistics.
18

Australia • After stagnating in 2020, rent growth should pick up in 2021 in most cities. Similarly, high leasing demand should help depress incentives.
• Given the shift towards consumer staples, investors are seeking strong F&B occupiers. Assets including cold storage will continue to attract high investor demand.
• Macro drivers for industrial and logistics tenancy demand remain favourable for 2021 and we expect elevated leasing activity.
• There exists a significant level of capital looking to expand or enter the market which will drive further yield compression over the next 12 months.
North China • Due to logistics land development restrictions in Beijing, we expect supply to remain limited, allowing further rent increases.
• Occupiers looking for space should focus on markets surrounding Beijing, such as Tianjin and Langfang. Investors and developers should follow suit.
East China • Demand remains strong across all logistics and industrial facilities types.
• Cold chain facilities are in short supply.• Some of the logistics hubs serving central
Shanghai are up to 60km away.
• Occupiers should retrofit warehouses with cold chain capacity if possible.
• Asset owners should invest in greater automation to meet e-commerce demand.
South China • Logistics assets in Shenzhen are very scarce, because the local government has added no land supply. Demand is very firm, but there are very few transactions.
• Export e-commerce platforms are now a key demand driver in South China (especially Guangzhou).
• Due to growth in cold chain, developers can retrofit portions of logistics warehouses into cold storage.
• We recommend logistics landlords in the emerging submarkets near the transport hubs target the export e-commerce companies.
Hong Kong SAR
• Investment demand improved over Q4 2020, and this should continue in 2021.
• Institutional investors are becoming more active.
• The market is focusing on rising cold storage demand from supermarket retailers and logistics facilities for e-commerce operators.
Japan(Greater Tokyo,
Greater Osaka)
• Japan is underserved by quality logistics stock: modern assets make up under 10% of the total. However, the small Grade A clusters (e.g. Nagareyama/Kashiwa near Tokyo and Ibaraki City near Osaka) house advanced facilities.
• Despite high new supply in 2020, Greater Tokyo vacancy has fallen to a record low of 0.2%. Greater Osaka vacancy is now below 3.0% and rents are rising at 7.5% YOY.
• Last mile facilities are in short supply, with some e-commerce majors in Tokyo adopting makeshift solutions such as parking lots.
• The supply-demand balance should remain favourable in 2021/22, though with some pick-up in supply as large multi-tenant facilities are completed.
• Tenants in Tokyo should seek space outside the central five wards for last mile facilities, notably in mixed-use developments.
• Given low availability of logistics warehouses, investors may apply value-add strategies to older stock. It is common to demolish and rebuild.
• For investors, sites closer to central areas of Tokyo command higher rents and are to be preferred.
Singapore • Economic rebound points to growth prospects in 2021.
• Logistics warehouse rents should rise 1.3%, while factory rents should stay flat.
• Landlords should adopt Industry 4.0 guidelines and remodel to higher specifications while being flexible in lease negotiations.
South Korea(Greater Seoul)
• New supply is concentrated in Incheon and Gyeonggi-do, due to proximity to Seoul.
• Both domestic and foreign investors are showing rising interest in logistics.
• Singapore and Hong Kong-based investors alone currently own 26 logistics properties in Korea.
• These markets offer occupiers options for manufacturing, logistics and cold chain.
• Prices of prime logistics assets should rise over 2021, with yields falling.
• Foreign investors may pursue value-add or opportunistic strategies in logistics to avoid competing with Korean institutions and for higher returns.
Appendix: Trends and opportunities across APAC markets
Status Prospects and options
19

Taiwan• Taiwan is an attractive location for
advanced manufacturing, while technology and online shopping will transform the logistics market.
• Northern Taiwan (Keelung, New Taipei City, Taipei, Taoyuan and Hsinchu) is the biggest logistics hub at present.
• New clusters are emerging in the centre (Taichung) and south (Tainan).
• Retail and distribution groups should cooperate with 3PLs to strength their cold-chain networks.
• Asset owners should adopt cloud data and AI to differentiate their services.
• The demand for express delivery should drive city-level demand for micro fulfilment centres.
New Zealand • Demand for logistics facilities is driven by
online retailing and requirements for supermarket groups.
• Industrial investment assets have attracted high levels of investor interest resulting in yield compression.
• New hubs are being developed, where occupiers have design-build options.
• Tight market conditions provide value-add or redevelopment opportunities.
• We expect an increase in overseas investment activity as border restrictions are relaxed.
India (West)
• Mumbai and Pune are key industrial hubs. Pune is seeing expansion by automotive groups, engineering, FMCG, 3PL and e-commerce.
• Anticipating high growth, developers are acquiring land parcels to develop industrial parks in Pune.
• Relocation and new demand in Pune is taking a “flight to quality” approach due to limited good stock. Investors should focus on Grade A space in this market.
• In Mumbai, we expect new logistics clusters along the Mumbai-Nasik highway, and Thane-Belapur Road.
India (South)
• Chennai is a key hub due to its port and the presence of global auto majors, while Bengaluru is the commercial centre of the south.
• Big industrial and logistics developers like Indospace, Ascendas-Singbridge and Logos are boosting their presence in Chennai. Meanwhile Bengaluru is seeing new warehousing demand.
• Growth sectors in Chennai include renewables and electronics manufacturing. In Bengaluru, e-commerce majors and 3PLs drive demand.
• We recommend investors to focus one-commerce, 3PL, and FMCG occupiers due to growing domestic consumption in addition to export-driven industrials.
India (North)
• Delhi National Capital Region is the north’s industrial and logistics gateway.
• Large developers like Allcargo Logistics, Capitaland, ESR and Indospace already have a presence and continue to expand due to resilient demand.
• Infrastructure initiatives like the new international airport at Jewar, Greater Noida and the proposed 700-acre transport hub in the vicinity, plus the Delhi-Mumbai Industrial Corridor, are set to transform supply chains in the region over the next five to six years.
Vietnam• Tangible demand is evident from
international logistics service providers, which are creating greenfield development in collaboration with government authorities.
• As newer Grade A facilities become available, we expect overall rents to increase.
Indonesia• Led by automotive and logistics service
providers, demand fell 46% in 2020.• Occupiers typically acquire land and build
facilities to suit their operations. • Prices for industrial land fell 4.1% in 2020.
With demand from the electrical vehicles and food sectors rising, we expect prices to rebound in 2021.
• Bekasi and Karawang should see increased demand.
• Asset owners should focus on large occupiers by offering flexibility in price and deal terms.
• E-commerce, logistics and consumer goods should also help drive demand.
Status Prospects and options
20

About Colliers
Colliers (NASDAQ, TSX: CIGI) is a leading diversified professional services and investment
management company. With operations in 67 countries, our more than 15,000 enterprising
professionals work collaboratively to provide expert advice to real estate occupiers, owners and
investors. For more than 25 years, our experienced leadership with significant insider ownership
has delivered compound annual investment returns of almost 20% for shareholders. With
annualized revenues of $3.0 billion ($3.3 billion including affiliates) and $40 billion of assets
under management, we maximize the potential of property and accelerate the success of our
clients and our people. Learn more at corporate.colliers.com, Twitter @Colliers or LinkedIn
Legal Disclaimer
This document has been prepared by Colliers for advertising and general information only.
Colliers makes no guarantees, representations or warranties of any kind, expressed or implied,
regarding the information including, but not limited to, warranties of content, accuracy and
reliability. Any interested party should undertake their own inquiries as to the accuracy of the
information. Colliers excludes unequivocally all inferred or implied terms, conditions and
warranties arising out of this document and excludes all liability for loss and damages arising
there from. This publication is the copyrighted property of Colliers and /or its licensor(s). ©
2021. All rights reserved. This communication is not intended to cause or induce breach of an
existing listing agreement.
Sam Harvey-Jones
Managing Director |
Occupier Services | Asia
+852 2822 0509
Lynus Pook
Senior Director | Regional Industrial
Advisory | Asia
+65 6531 8654
Doug Henry
Managing Director | Occupier
Services | Australia
+61 2 9257 0386
CK Lau
Managing Director |
Valuation & Advisory Services | Asia
+852 2822 0665
Terence Tang
Managing Director | Capital Markets
& Investment Services | Asia
+65 6531 8565
John Marasco
Managing Director |
Capital Markets &
Investment Services | Australia
& New Zealand
+61 3 9612 8830
Gavin Bishop
Head of Industrial Capital Markets |
Australia
+61 401 146 051
Tammy Tang
Managing Director | China
+86 21 6141 3625
For further information, contact our service experts:
Andrew Haskins
Executive Director | Research | Asia
+852 2822 0511
Rakesh Kunhiraman
Head of Occupier Research | Research | Asia
+65 6531 8569
Joanne Henderson
National Director | Research |
Australia
+61 2 9257 0286
Luke Crawford
Director | Research | Australia
+61 2 9257 0296
Our research experts: