Asia Pacific Equity Research - Capitalsynthesis · Asia Pacific Equity Research 10 January 2014 ......
14
www.jpmorganmarkets.com Asia Pacific Equity Research 10 January 2014 Clients should contact representatives and execute transactions through a J.P. Morgan subsidiary or affiliate in their home jurisdiction unless governing law permits otherwise. Sony Neutral 6758.T, 6758 JT Not much excitement at CES and decoupling with F/X movement; what's next? Price: ¥1,835 Price Target: ¥1,600 Japan Technology - Semiconductors JJ Park AC (822) 758-5717 [email protected] Bloomberg JPMA PARK <GO> J.P. Morgan Securities (Far East) Ltd, Seoul Branch Jay Kwon (82-2) 758-5725 [email protected] J.P. Morgan Securities (Far East) Ltd, Seoul Branch Jesper J Koll (81-3) 6736-8600 [email protected] JPMorgan Securities Japan Co., Ltd. YTD 1m 3m 12m Abs 1.8% 0.5% -3.4% 89.6% Rel 1.3% -2.9% -13.6% 43.5% Bloomberg 6758 JT, Reuters 6758.T (YE Mar, ¥ bn) 2013/3 2014/3E 2015/3E 2016/3E 2013/3 2014/3E 2015/3E 2016/3E Date of Price 10 Jan 14 Sales 6,801 7,695 7,859 7,908 Sales growth 4.7% 13.2% 2.1% 0.6% 52-Week range ¥$2,413-943 Operating Profit 230 167 248 292 OP growth NM NM 48.6% 18.1% Market Cap ¥1,920BN EBITDA 561 501 605 668 NP growth NM NM 130.4% 23.3% Market Cap US$18.31MN Net profit 43 28 65 80 Share Out. (Com) 1,046MN EPS 43 27 63 78 Price Target 1,600 Free float 29.0% BPS (¥) 2,672 2,773 2,895 2,954 Consensus PT 2,153 Avg daily val ¥24.9B P/E (x) 42.8 66.9 29.0 23.5 Price Target End Date 31-Dec-14 Avg daily val (US$) 237.8MM P/BV (x) 0.7 0.7 0.6 0.6 Difference (%) -25.7 Avg daily vol. 13.7MM shares ROE (%) 1.7 1.0 2.2 2.7 Dividend yield (%) 0.0 Net Debt -341 -369 -354 -559 Exchange Rate 104.82 Source: Company data, Bloomberg, J.P. Morgan estimates. See page 11 for analyst certification and important disclosures, including non-US analyst disclosures. J.P. Morgan does and seeks to do business with companies covered in its research reports. As a result, investors should be aware that the firm may have a conflict of interest that could affect the objectivity of this report. Investors should consider this report as only a single factor in making their investment decision. 800 1,200 1,600 2,000 2,400 ¥ Jan-13 Apr-13 Jul-13 Oct-13 Jan-14 Price Performance 6758.T share price (¥) TOPIX (rebased) Since Sony’s 2QFY13 earnings shock, the stock has gradually recovered and moved sideways. Despite recent positive data points related to PS4 and the company's aggressive smartphone shipment target, we remain cautious given signs of pause in its smartphone growth in Japan post iPhone 5S launch, ongoing weak CE products such as DSC and TV, and finally lack of earnings visibility. Lackluster reaction at CES: We think the innovation arc in CE appears to be peaking and with smartphones lacking big, incremental breakthroughs in technology, the mobile device market is becoming crowded and stale. Hence, Sony's strategy to focus on emerging technology may face challenges which could lead to downside risk to Sony’s aggressive shipment target for smartphone, TV, and DSC, in our view. Decoupling with F/X movement: Sony used to be highly correlated with F/X movement, and yen depreciation against US$ and EUR was a major driver for the share price. In the last one month+, however, yen weakness didn't help fuel the share price. We believe saturating CE market has overwhelmed the positive F/X impact. The decoupling with F/X movement will probably continue, in our view. Potential risks to our cautious view: Sony appears to be taking steps to reshuffle its business portfolio and downsize employees in electronic segment. Although the progress is still premature, we think any major restructuring would be a catalyst for the share price. Also, recent sell- through of PS4 shows encouraging signs and could reach 6M units vis-à-vis a target of 5M units, while the impact on earnings is marginal. Share price expectation: The stock is currently trading at 29x FY14E P/E and 24x FY15E P/E. Although we expect earnings to improve throughout our forecast periods, there is a risk to our earnings estimates given shrinking CE market and potential charges associated with restructuring. We maintain our low-end of consensus earnings and PT.
-
Upload
doannguyet -
Category
Documents
-
view
220 -
download
3
Transcript of Asia Pacific Equity Research - Capitalsynthesis · Asia Pacific Equity Research 10 January 2014 ......

www.jpmorganmarkets.com
Asia Pacific Equity Research10 January 2014
Clients should contact representatives and execute transactions through a J.P. Morgan subsidiary or affiliate in their home jurisdiction unless governing law permits otherwise.
SonyNeutral6758.T, 6758 JT
Not much excitement at CES and decoupling with F/X movement; what's next?
Price: ¥1,835
Price Target: ¥1,600
Japan
Technology - Semiconductors
JJ Park AC
(822) 758-5717
Bloomberg JPMA PARK <GO>
J.P. Morgan Securities (Far East) Ltd, Seoul Branch
Jay Kwon
(82-2) 758-5725
J.P. Morgan Securities (Far East) Ltd, Seoul Branch
Jesper J Koll
(81-3) 6736-8600
JPMorgan Securities Japan Co., Ltd.
YTD 1m 3m 12mAbs 1.8% 0.5% -3.4% 89.6%Rel 1.3% -2.9% -13.6% 43.5%
Bloomberg 6758 JT, Reuters 6758.T
(YE Mar, ¥ bn) 2013/3 2014/3E 2015/3E 2016/3E 2013/3 2014/3E 2015/3E 2016/3E Date of Price 10 Jan 14
Sales 6,801 7,695 7,859 7,908 Sales growth 4.7% 13.2% 2.1% 0.6% 52-Week range ¥$2,413-943Operating Profit 230 167 248 292 OP growth NM NM 48.6% 18.1% Market Cap ¥1,920BNEBITDA 561 501 605 668 NP growth NM NM 130.4% 23.3% Market Cap US$18.31MN
Net profit 43 28 65 80 Share Out. (Com) 1,046MN
EPS 43 27 63 78 Price Target 1,600 Free float 29.0%BPS (¥) 2,672 2,773 2,895 2,954 Consensus PT 2,153 Avg daily val ¥24.9BP/E (x) 42.8 66.9 29.0 23.5 Price Target End Date 31-Dec-14 Avg daily val (US$) 237.8MMP/BV (x) 0.7 0.7 0.6 0.6 Difference (%) -25.7 Avg daily vol. 13.7MM shares
ROE (%) 1.7 1.0 2.2 2.7 Dividend yield (%) 0.0Net Debt -341 -369 -354 -559 Exchange Rate 104.82
Source: Company data, Bloomberg, J.P. Morgan estimates.
See page 11 for analyst certification and important disclosures, including non-US analyst disclosures.J.P. Morgan does and seeks to do business with companies covered in its research reports. As a result, investors should be aware that the firm may have a conflict of interest that could affect the objectivity of this report. Investors should consider this report as only a single factor in making their investment decision.
800
1,200
1,600
2,000
2,400
¥
Jan-13 Apr-13 Jul-13 Oct-13 Jan-14
Price Performance
6758.T share price (¥)
TOPIX (rebased)
Since Sony’s 2QFY13 earnings shock, the stock has gradually recovered and moved sideways. Despite recent positive data points related to PS4 and the company's aggressive smartphone shipment target, we remain cautious given signs of pause in its smartphone growth in Japan post iPhone 5S launch, ongoing weak CE products such as DSC and TV, and finally lack of earnings visibility.
Lackluster reaction at CES: We think the innovation arc in CE appears to be peaking and with smartphones lacking big, incremental breakthroughs in technology, the mobile device market is becoming crowded and stale. Hence, Sony's strategy to focus on emerging technology may face challenges which could lead to downside risk to Sony’s aggressive shipment target for smartphone, TV, and DSC, in our view.
Decoupling with F/X movement: Sony used to be highly correlated with F/X movement, and yen depreciation against US$ and EUR was a major driver for the share price. In the last one month+, however, yen weakness didn't help fuel the share price. We believe saturating CE market hasoverwhelmed the positive F/X impact. The decoupling with F/X movementwill probably continue, in our view.
Potential risks to our cautious view: Sony appears to be taking steps to reshuffle its business portfolio and downsize employees in electronic segment. Although the progress is still premature, we think any major restructuring would be a catalyst for the share price. Also, recent sell-through of PS4 shows encouraging signs and could reach 6M units vis-à-vis a target of 5M units, while the impact on earnings is marginal.
Share price expectation: The stock is currently trading at 29x FY14E P/E and 24x FY15E P/E. Although we expect earnings to improve throughout our forecast periods, there is a risk to our earnings estimates given shrinking CE market and potential charges associated with restructuring. We maintain our low-end of consensus earnings and PT.
2
Asia Pacific Equity Research10 January 2014
JJ Park(822) [email protected]
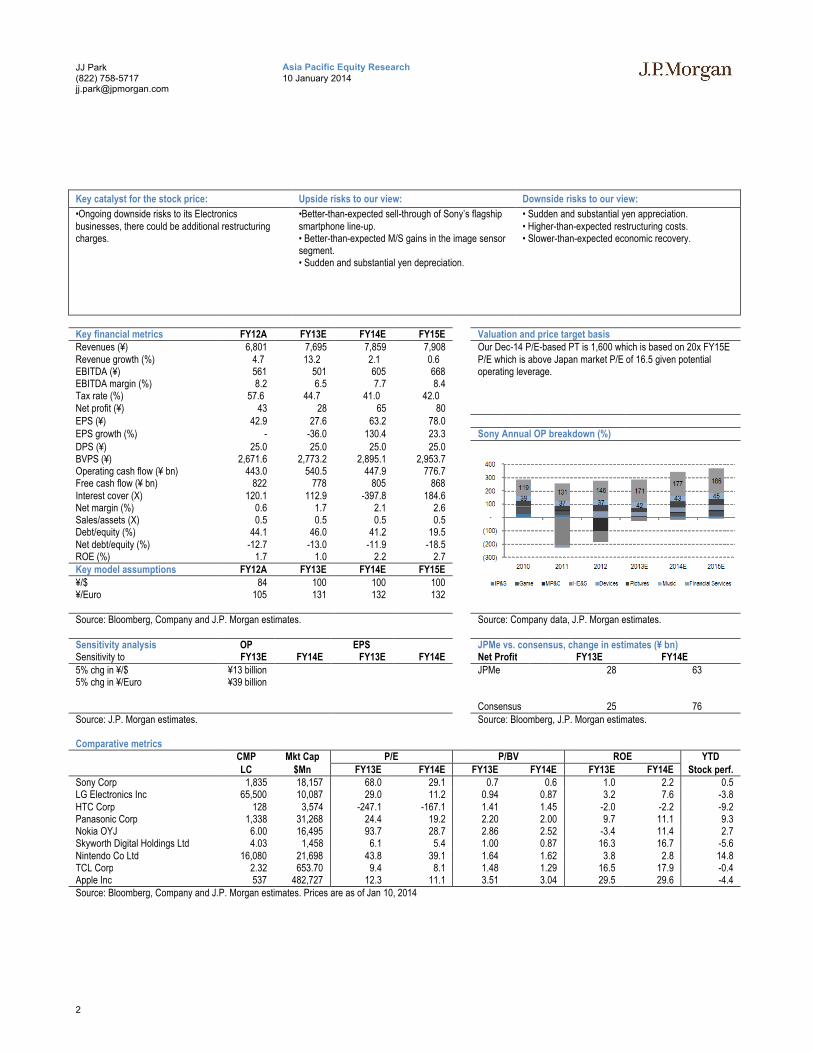
Key catalyst for the stock price: Upside risks to our view: Downside risks to our view:
•Ongoing downside risks to its Electronics businesses, there could be additional restructuring charges.
•Better-than-expected sell-through of Sony’s flagship smartphone line-up.• Better-than-expected M/S gains in the image sensor segment.• Sudden and substantial yen depreciation.
• Sudden and substantial yen appreciation.• Higher-than-expected restructuring costs. • Slower-than-expected economic recovery.
Key financial metrics FY12A FY13E FY14E FY15E Valuation and price target basisRevenues (¥) 6,801 7,695 7,859 7,908 Our Dec-14 P/E-based PT is 1,600 which is based on 20x FY15E
P/E which is above Japan market P/E of 16.5 given potential operating leverage.
Revenue growth (%) 4.7 13.2 2.1 0.6 EBITDA (¥) 561 501 605 668EBITDA margin (%) 8.2 6.5 7.7 8.4 Tax rate (%) 57.6 44.7 41.0 42.0 Net profit (¥) 43 28 65 80EPS (¥) 42.9 27.6 63.2 78.0EPS growth (%) - -36.0 130.4 23.3 Sony Annual OP breakdown (%)DPS (¥) 25.0 25.0 25.0 25.0BVPS (¥) 2,671.6 2,773.2 2,895.1 2,953.7Operating cash flow (¥ bn) 443.0 540.5 447.9 776.7Free cash flow (¥ bn) 822 778 805 868Interest cover (X) 120.1 112.9 -397.8 184.6Net margin (%) 0.6 1.7 2.1 2.6 Sales/assets (X) 0.5 0.5 0.5 0.5Debt/equity (%) 44.1 46.0 41.2 19.5Net debt/equity (%) -12.7 -13.0 -11.9 -18.5ROE (%) 1.7 1.0 2.2 2.7Key model assumptions FY12A FY13E FY14E FY15E¥/$ 84 100 100 100¥/Euro 105 131 132 132
Source: Bloomberg, Company and J.P. Morgan estimates. Source: Company data, J.P. Morgan estimates.
Sensitivity analysis OP EPS JPMe vs. consensus, change in estimates (¥ bn)Sensitivity to FY13E FY14E FY13E FY14E Net Profit FY13E FY14E5% chg in ¥/$ ¥13 billion JPMe 28 635% chg in ¥/Euro ¥39 billion
Consensus 25 76 Source: J.P. Morgan estimates. Source: Bloomberg, J.P. Morgan estimates.
Comparative metricsCMP Mkt Cap P/E P/BV ROE YTDLC $Mn FY13E FY14E FY13E FY14E FY13E FY14E Stock perf.
Sony Corp 1,835 18,157 68.0 29.1 0.7 0.6 1.0 2.2 0.5 LG Electronics Inc 65,500 10,087 29.0 11.2 0.94 0.87 3.2 7.6 -3.8 HTC Corp 128 3,574 -247.1 -167.1 1.41 1.45 -2.0 -2.2 -9.2 Panasonic Corp 1,338 31,268 24.4 19.2 2.20 2.00 9.7 11.1 9.3 Nokia OYJ 6.00 16,495 93.7 28.7 2.86 2.52 -3.4 11.4 2.7 Skyworth Digital Holdings Ltd 4.03 1,458 6.1 5.4 1.00 0.87 16.3 16.7 -5.6 Nintendo Co Ltd 16,080 21,698 43.8 39.1 1.64 1.62 3.8 2.8 14.8 TCL Corp 2.32 653.70 9.4 8.1 1.48 1.29 16.5 17.9 -0.4 Apple Inc 537 482,727 12.3 11.1 3.51 3.04 29.5 29.6 -4.4 Source: Bloomberg, Company and J.P. Morgan estimates. Prices are as of Jan 10, 2014

3
Asia Pacific Equity Research10 January 2014
JJ Park(822) [email protected]
Keynote speech at CES 2014
Sony introduces Xperia Z1 Compact and enhanced 4K TV related products
Sony introduces Xperia Z1 Compact which is already sold as Xperia Z1f by NTT Docomo in Japan, to be launched globally starting in Feb. Also Xperia Z1s will be launched as US regional model of Xperia Z1 from T-mobile in Jan. The company unveiled 4K product line ups (BRAVIA TV, Handycam) with 4K contents line ups partnering with Netflix and Youtube.
On Jan 7, Sony CEO Mr. Hirai delivered keynote address at the 2014 international CES where the company unveiled new plans including new streaming game andmovie services that will give customers greater access to games for PlayStation 2 and PlayStation 3 consoles by cloud service. A planned TV content streaming service will also pull together TV shows and movies for consumers, who will also be able to watch the content on multiple screens within their homes.
Mr. Hirai stated the firm will be focusing on emerging tech in the coming year, tapping its advanced optical technologies for medical, agricultural and photographic applications. Sony skin monitors will be able to get a read on medical factors such as blood sugar levels. In addition to the service announcements, Sony announced that it had sold 4.2 million units of its PlayStation 4 console.
4K market is still at early stage
Sony released a series of new products (Handycam, projector and VAIO) to enhance collaboration with UHD (4K) TV in Nov and Dec 2013. The company’s strategy is to boost UHD TV market by expanding other hardware devices which can record or view 4K content. However, there has not been much adoption of 4K content yet. It will take some time until we see both hardware and software of 4K to be mainstreamin TV market.
Figure 1: UHD TV (sell-through) shipment trendUnit 000s
Source: Display research, J.P. Morgan estimates

4
Asia Pacific Equity Research10 January 2014
JJ Park(822) [email protected]
Updates on PS4 and smartphone
PS4 likely exceeds the current target of 5 million units
Sony recently announced that the new PlayStation 4 launched overseas last Nov-Decsold 4.2 million units through end-CY2013. The PS4 launches in Japan in February, with FY2013 shipments well on course to top the current target of 5 million units.
We expect the target could be raised up to 6 million units given the fact that Japan sales accounts for 15% of total PS3 shipment. While additional 1 million shipment may contribute to its sales of JPY 40 billion, we estimate hardware BOM cost is breakeven level at the initial stage. Thus the impact on earnings is marginal, in our view.
Doubling up smartphone shipments looks challenging
He also unveiled the company aims to ship more than 80 million phones in FY2015which is roughly double the level of current shipment target of 42 million in FY2013. The company expects growth to continue at this pace over the next two years on demand from the massive US and Chinese markets as well as from emerging economies.
However, its market share expansion from non-Japan/Europe region appears limitedgiven growing speed of smartphone market has peaked out. We have increasing concerns on saturated high-end segment and commoditization risk from Chinese whitebox smartphone makers. We think the company target is challenging given the backdrop of saturated market trend.
Business snapshot
Reshuffling business portfolio
Sony has been reshuffling business portfolios by stating core and non-core businesses under restructuring plan. Last month, the company has released selling non-core assets in entertainment business and termination of OLED TV co-development with Panasonic as it will focus on UHD TV.
CMOS sensors, a key component for DSC and smartphone
Sony has positioned CMOS (complementary metal-oxide semiconductor) sensors as one of the pillars of the firm's growth and seeks to purchase Renesas Electronics' main chip fabrication facility to make image sensors for smartphone and other devices. If negotiations proceed smoothly, Sony will acquire shares in the Renesas unit that operates the Tsuruoka plant in Yamagata Prefecture by March 31.
Sony hopes to use the plant to fabricate CMOS sensors, a key component that determines the quality of images shot on smartphones and digital cameras. As shown in below charts, Sony has dominant positions in higher pixel segment for smartphones.
Sony aims to commercialize new sensor technologies that deliver differentiating features to both professional- and consumer-use products, thus it needs an additional investment in order to capitalize on demand for these components

5
Asia Pacific Equity Research10 January 2014
JJ Park(822) [email protected]
Figure 2: Market share of CMOS sensors (2012, shipment base)
Source: Techno System Research
Figure 3: Market share of CMOS sensors for mobile devices (2012, shipment base)
Source: Techno System Research
Potential downsizing in electronic segment
Sony will take further steps to restructure its electronic business. Sony will begin offering early retirement to staff in foundering electronic segment starting from January-2014. We expect the company may record additional restructuring cost toward fiscal year end.
Table 1: Sony business portfolio reshuffleSell/acquire Announcement
/report dateBusiness Asset value/additional capex Related business
Asset sold 5-Dec Sold shares of Sky Perfect JSAT Holding 15bn Entertainment businessAsset acquire (*1) 18-Dec Acquire Tsuruoka plant from Renesas Electronics 30bn (Estimated additional capex) Devices businessAsset sold 24-Dec Sold shares of Gracenote to Tribune company 17bn Entertainment businessRestate as non-core 25-Dec Termination on co-development of OLED TV with
Panasonic - Electronic business
Redefined as core (*2) 29-Dec Cancel sales of its battery business Estimated annual sales of150bn Devices businessStaff cut (*3) 31-Dec Offering early retirement to staffs in foundering
electronic segment starting from January.- Electronic business
Source: Company and Nikkei reports. Note: 1-3 are reported by Nikkei
Domestic smartphone market
Sign of pause in smartphone sales growth in Japan market
Although Sony’s smartphone sales in Japan market are estimated to account for 15% of total sales, steady market share expansion of its flagship model of Xperia Z series in Japan market was the major positive factor for the robust sales growth in MP&C segment in 1H13.
As we indicated in our note “Will PS4 and smartphone be a game changer?” on November 9, 2013, robust sales of iPhone 5s and 5c in Oct-Dec quarter in Japan market indicates growth momentum for Sony’s smartphone shipment will be weaker in Japan and concern about overall margin recovery owing to saturated high-end segment will remain, in our view.

6
Asia Pacific Equity Research10 January 2014
JJ Park(822) [email protected]
Table 1: BCN monthly smartphone ranking by electronic retail store sales in Japan
Oct 2013 Nov 2013Rank Carrier Vendor Model Carrier Vendor Model
1 NTT Docomo Apple iPhone 5s SoftBank Apple iPhone 5s2 SoftBank Apple iPhone 5s NTT Docomo Apple iPhone 5s3 au Apple iPhone 5s Au Apple iPhone 5s4 au Apple iPhone 5 SoftBank Apple iPhone 5c5 SoftBank Apple iPhone 5c Au Apple iPhone 5c6 SoftBank Apple iPhone 5 NTT Docomo Sony Mobile Communication Xperia Z1 SO-01F7 au Kyocera GRATINA KYY06 Au Apple iPhone 58 au Apple iPhone 5c Au Sony Mobile Communication Xperia Z1 SOL239 NTT Docomo Sony Mobile Communication Xperia Z1 SO-01F SoftBank ZTE 202Z10 NTT Docomo Apple iPhone 5c NTT Docomo Apple iPhone 5c
Source: BCN Note: BCN data covers 40% of total electronic retail store sales. Sales of NTT Docomo dealer and outlets are not included in the ranking.
Shrinking DSC market
Sony has been focusing digital camera resources on value-added mirrorless single-lens models and scaling down loss making entry level compact digital camera with fewer releases. In November, Sony unveiled two models to its full-frame Alpha 7series with full sized image sensors. Although Sony has a leading position in mirrorless camera segment, it only accounts for 10% in total DSC market where demand growth is lower than market expectation.
Olympus, Panasonic and Fujifilm Holding are also focusing on mirrorless cameraproducts to strive DSC business to be profitable. Given increased competition in the mirrorless market, we find 10% OPM target in FY14 challenging.
Figure 4: Breakdown of Digital Still Camera by type JPY billion
Source: CIPA Note: Shipment value base
Figure 5: M/S of Mirrorless camera in 2013/3
Source: Techno System Research
Share price expectation
After Sony Entertainment Investor Day on Nov 21, the stock price has been muted due to some disappointment in company’s guidance on entertainment business with no major new announcement relating integration on software and hardware which the market had hoped to hear.
In our view, as this event was the major catalyst for Sony’s share price since third points questioned the value of ONE SONY, it did not convince investors that having both software content and electronic hardware businesses would generate synergies

7
Asia Pacific Equity Research10 January 2014
JJ Park(822) [email protected]
for Sony’s total value. Meanwhile, we believe the market will start to realize there is further downside risks to Sony’s consumer electronics businesses given shrinking industry and potential charges associated with restructuring.
Figure 6: Sony – 12 months forward P/E band chartJPY
Source: Bloomberg, J.P. Morgan
Figure 7: Japan market – 12 months forward P/E trendP/E (X)
Source: Bloomberg, J.P. Morgan
Figure 8: Sony – More downside risk in stock price
Source: Bloomberg, J.P. Morgan
Figure 9: Sony: Price performance vs Panasonic and TOPIX(Jan2013=100)
Source: Bloomberg, J.P. Morgan
Decoupling with F/X movement
Even a weaker yen trend did not help fuel share prices over the last 1 month, both USD/JPY and Euro/JPY upward momentum had been major positive factor for Sony share price as shown in the below charts. However, accelerating favorable F/X trend will not be enough to offset deeper downside risk in consumer electronic business, in our view.

8
Asia Pacific Equity Research10 January 2014
JJ Park(822) [email protected]
Figure 10: Share price vs. USD/JPY FX trend (2004 - Present)JPY
Source: Bloomberg, J.P. Morgan
Figure 11: Share price vs. USD/JPY FX trend (2011 - Present)JPY
Source: Bloomberg, J.P. Morgan
Figure 12: Share price vs. EURO/JPY FX trend (2004 - Present)JPY
Source: Bloomberg, J.P. Morgan
Figure 13: Share price vs. EURO/JPY FX trend (2011 - Present)JPY
Source: Bloomberg, J.P. Morgan

9
Asia Pacific Equity Research10 January 2014
JJ Park(822) [email protected]
Sony: Summary of FinancialsIncome Statement Cash flow statement¥ in billions, year end Mar 2013/3 2014/3E 2015/3E 2016/3E ¥ in billions, year end Mar 2013/3 2014/3E 2015/3E 2016/3E
Revenues 6,801 7,695 7,859 7,908 Net income 43 28 65 80COGS -4,155 -4,766 -4,778 -6,828 Depr. & amortization 331 334 357 375Depreciation -331 -334 -357 -375 Other non-cash items - - - -Gross Profit 2,315 2,595 2,724 705 Change in working capital 8 121 -18 277
EBIT 230 167 248 292 Cash flow from operations 443 540 448 777EBITDA 561 501 605 668 Purchase of PP&E -261 -278 -200 -200Net Interest Income -5 -4 2 -4 Disposal/(purchase) -1,089 -430 -256 -285Pre-tax Profit 246 154 184 213 Cash flow from investing -1,350 -708 -456 -485Tax Credit /(Expense) -142 -69 -76 -90 Free cash flow 184 265 247 579Net income 43 28 65 80 Equity raised/(repaid) -27 46 0 0
Shares outstanding 1,004 1,024 1,024 1,024 Debt raised/(repaid) 10 125 -85 -632EPS ¥ 42.88 27.45 63.24 77.96 Other charges 890 149 -7 -86Sequential Growth Cash dividends 0 0 0 0Revenues 4.7% 13.2% 2.1% 0.6% Cash flow from financing 872 320 -92 -718Gross Profit 9.9% 12.1% 5.0% -74.1% Net change in cash -35 153 -100 -426EBIT NM NM 48.6% 18.1% Beginning cash 1,575 1,524 1,677 1,577
Pre-tax Profit NM NM 19.7% 15.8% Ending cash 1,524 1,677 1,577 1,150EPS -109.4% -36.0% 130.4% 23.3%
Balance sheet Ratio Analysis¥ in billions, year end Mar 2013/3 2014/3E 2015/3E 2016/3E ¥ in billions, year end Mar 2013/3 2014/3E 2015/3E 2016/3E
Cash and cash equivalents 1,524 1,677 1,577 1,150 Gross margin 34.0% 33.7% 34.7% 8.9%Accounts receivable 844 1,100 1,209 1,127 EBIT margin 3.4% 2.2% 3.1% 3.7%Inventories 710 1,214 1,076 1,102 EBITDA margin 8.2% 6.5% 7.7% 8.4%
Others current assets 568 1,005 1,105 1,044 Net profit margin 0.6% 0.4% 0.8% 1.0%Current assets 3,647 4,995 4,968 4,424 COGS/sales 61.1% 61.9% 60.8% 86.3%LT investments 7,317 7,552 7,556 7,556 Sales per share growth 4.7% 10.9% 2.1% 0.6%Net fixed assets 862 805 648 472 Sales growth 4.7% 13.2% 2.1% 0.6%Other long term assets 1,210 1,301 1,384 1,476 EBIT growth NM NM 48.6% 18.1%Total Assets 14,206 15,929 15,999 15,566 Net profit growth NM NM 130.4% 23.3%
EPS growth -109.4% -36.0% 130.4% 23.3%ST Debt and CPLTD 244 392 307 291Account Payables 1,669 2,354 2,106 1,933 Interest coverage (x) 120.1 112.9 NM 184.6Other current liabilities 2,402 3,034 3,337 3,669 Inventory Turnover (x) 5.9 5.0 4.2 6.3Total current liabilities 4,315 5,780 5,749 5,893 Net debt to total capital -14.6% -14.9% -13.5% -22.7%Long-term debt 938 916 916 301 Net debt to equity -12.7% -13.0% -11.9% -18.5%
Other Long term liabilities 2,729 2,700 2,677 2,655 Sales/assets 0.5 0.5 0.5 0.5Total Liabilities 11,522 13,086 13,032 12,538 Assets/equity 5.3 5.5 5.5 5.3
ROE 1.7% 1.0% 2.2% 2.7%Shareholders' equity 2,684 2,842 2,967 3,027Total Liabilities and Equity 14,206 15,929 15,999 15,566BVPS ¥ 2,671.62 2,773.22 2,895.06 2,953.65
Source: Company reports and J.P. Morgan estimates.

10
Asia Pacific Equity Research10 January 2014
JJ Park(822) [email protected]
JPM Q-ProfileSony Corporation (JAPAN / Consumer Discretionary)As Of: 03-Jan-2014 [email protected]
Local Share Price Current: 1868.00 12 Mth Forward EPS Current: 61.80
Earnings Yield (& local bond Yield) Current: 3% Implied Value Of Growth* Current: 44.90%
PE (1Yr Forward) Current: 30.2x Price/Book Value Current: 0.9x
ROE (Trailing) Current: 3.25 Dividend Yield (Trailing) Current: 1.33
Summary
Sony Corporation 19529.67 As Of:
JAPAN 240.78 SEDOL 6821506 Local Price: 1,868.00
Consumer Discretionary Household Durables EPS: 61.80
Latest Min Max Median Average 2 S.D.+ 2 S.D. - % to Min % to Max % to Med % to Avg12mth Forward PE 30.23x -20.00 75.00 28.98 34.17 77.59 -9.24 -166% 148% -4% 13%P/BV (Trailing) 0.86x 0.43 7.45 1.48 1.75 4.20 -0.71 -50% 770% 72% 104%
Dividend Yield (Trailing) 1.33 0.15 3.12 0.63 0.82 1.98 -0.34 -88% 134% -53% -39%
ROE (Trailing) 3.25 -15.02 13.56 3.89 1.95 16.30 -12.39 -562% 317% 20% -40%
Implied Value of Growth 44.9% -0.68 1.09 0.46 0.46 1.03 -0.11 -251% 144% 4% 3%
Source: Bloomberg, Reuters Global Fundamentals, IBES CONSENSUS, J.P. Morgan Calcs * Implied Value Of Growth = (1 - EY/Cost of equity) where cost of equity =Bond Yield + 5.0% (ERP)
3-Jan-14
-200.00
-100.00
0.00
100.00
200.00
300.00
400.00
Oct
/98
May
/99
Dec
/99
Jul/0
0
Feb
/01
Sep
/01
Apr
/02
Nov
/02
Jun/
03
Jan/
04
Aug
/04
Mar
/05
Oct
/05
May
/06
Dec
/06
Jul/0
7
Feb
/08
Sep
/08
Apr
/09
Nov
/09
Jun/
10
Jan/
11
Aug
/11
Mar
/12
Oct
/12
May
/13
Dec
/13
-2%
0%
2%
4%
6%
8%
10%
12%
Oct
/98
May
/99
Dec
/99
Jul/0
0
Feb
/01
Sep
/01
Apr
/02
Nov
/02
Jun/
03
Jan/
04
Aug
/04
Mar
/05
Oct
/05
May
/06
Dec
/06
Jul/0
7
Feb
/08
Sep
/08
Apr
/09
Nov
/09
Jun/
10
Jan/
11
Aug
/11
Mar
/12
Oct
/12
May
/13
Dec
/13
12Mth fwd EY Japan BY Proxy
0.00
2,000.00
4,000.00
6,000.00
8,000.00
10,000.00
12,000.00
14,000.00
16,000.00
18,000.00
Oct
/98
May
/99
Dec
/99
Jul/0
0
Feb
/01
Sep
/01
Apr
/02
Nov
/02
Jun/
03
Jan/
04
Aug
/04
Mar
/05
Oct
/05
May
/06
Dec
/06
Jul/0
7
Feb
/08
Sep
/08
Apr
/09
Nov
/09
Jun/
10
Jan/
11
Aug
/11
Mar
/12
Oct
/12
May
/13
Dec
/13
-0.80
-0.60
-0.40
-0.20
0.00
0.20
0.40
0.60
0.80
1.00
1.20
Oct
/98
May
/99
Dec
/99
Jul/0
0
Feb
/01
Sep
/01
Apr
/02
Nov
/02
Jun/
03
Jan/
04
Aug
/04
Mar
/05
Oct
/05
May
/06
Dec
/06
Jul/0
7
Feb
/08
Sep
/08
Apr
/09
Nov
/09
Jun/
10
Jan/
11
Aug
/11
Mar
/12
Oct
/12
May
/13
Dec
/13
-40.0x
-20.0x
0.0x
20.0x
40.0x
60.0x
80.0x
100.0x
Oct
/98
May
/99
Dec
/99
Jul/0
0
Feb
/01
Sep
/01
Apr
/02
Nov
/02
Jun/
03
Jan/
04
Aug
/04
Mar
/05
Oct
/05
May
/06
Dec
/06
Jul/0
7
Feb
/08
Sep
/08
Apr
/09
Nov
/09
Jun/
10
Jan/
11
Aug
/11
Mar
/12
Oct
/12
May
/13
Dec
/13
-2.0x
-1.0x
0.0x
1.0x
2.0x
3.0x
4.0x
5.0x
6.0x
7.0x
8.0x
Oct
/98
May
/99
Dec
/99
Jul/0
0
Feb
/01
Sep
/01
Apr
/02
Nov
/02
Jun/
03
Jan/
04
Aug
/04
Mar
/05
Oct
/05
May
/06
Dec
/06
Jul/0
7
Feb
/08
Sep
/08
Apr
/09
Nov
/09
Jun/
10
Jan/
11
Aug
/11
Mar
/12
Oct
/12
May
/13
Dec
/13
PBV hist PBV Forward
-20.00
-15.00
-10.00
-5.00
0.00
5.00
10.00
15.00
Oct
/98
May
/99
Dec
/99
Jul/0
0
Feb
/01
Sep
/01
Apr
/02
Nov
/02
Jun/
03
Jan/
04
Aug
/04
Mar
/05
Oct
/05
May
/06
Dec
/06
Jul/0
7
Feb
/08
Sep
/08
Apr
/09
Nov
/09
Jun/
10
Jan/
11
Aug
/11
Mar
/12
Oct
/12
May
/13
Dec
/13
0.0
0.5
1.0
1.5
2.0
2.5
3.0
3.5
Oct
/98
May
/99
Dec
/99
Jul/0
0
Feb
/01
Sep
/01
Apr
/02
Nov
/02
Jun/
03
Jan/
04
Aug
/04
Mar
/05
Oct
/05
May
/06
Dec
/06
Jul/0
7
Feb
/08
Sep
/08
Apr
/09
Nov
/09
Jun/
10
Jan/
11
Aug
/11
Mar
/12
Oct
/12
May
/13
Dec
/13

11
Asia Pacific Equity Research10 January 2014
JJ Park(822) [email protected]
Analyst Certification: The research analyst(s) denoted by an “AC” on the cover of this report certifies (or, where multiple research analysts are primarily responsible for this report, the research analyst denoted by an “AC” on the cover or within the document individually certifies, with respect to each security or issuer that the research analyst covers in this research) that: (1) all of the views expressed in this report accurately reflect his or her personal views about any and all of the subject securities or issuers; and (2) no part of any of the research analyst's compensation was, is, or will be directly or indirectly related to the specific recommendations or views expressed by the research analyst(s) in this report. For all Korea-based research analysts listed on the front cover, they also certify, as per KOFIA requirements, that their analysis was made in good faith and that the views reflect their own opinion, without undue influence or intervention.
Important Disclosures
Client: J.P. Morgan currently has, or had within the past 12 months, the following company(ies) as clients: Sony.
Client/Investment Banking: J.P. Morgan currently has, or had within the past 12 months, the following company(ies) as investment banking clients: Sony.
Client/Non-Investment Banking, Securities-Related: J.P. Morgan currently has, or had within the past 12 months, the following company(ies) as clients, and the services provided were non-investment-banking, securities-related: Sony.
Client/Non-Securities-Related: J.P. Morgan currently has, or had within the past 12 months, the following company(ies) as clients, and the services provided were non-securities-related: Sony.
Investment Banking (past 12 months): J.P. Morgan received in the past 12 months compensation from investment banking Sony.
Investment Banking (next 3 months): J.P. Morgan expects to receive, or intends to seek, compensation for investment banking services in the next three months from Sony.
Non-Investment Banking Compensation: J.P. Morgan has received compensation in the past 12 months for products or services other than investment banking from Sony.
Company-Specific Disclosures: Important disclosures, including price charts, are available for compendium reports and all J.P. Morgan–covered companies by visiting https://jpmm.com/research/disclosures, calling 1-800-477-0406, or e-mailing [email protected] with your request. J.P. Morgan’s Strategy, Technical, and Quantitative Research teams may screen companies not covered by J.P. Morgan. For important disclosures for these companies, please call 1-800-477-0406 or e-mail [email protected].
Date Rating Share Price (Y)
Price Target (Y)
20-Oct-06 N 4750 4900
25-Jan-07 N 5630 5600
28-Feb-07 N 6170 7600
01-Mar-07 OW 6170 7600
24-Jan-08 OW 4990 7000
21-Mar-08 OW 4170 6400
03-Apr-08 OW 4350 6200
22-Jul-08 OW 4380 5450
16-Sep-08 N 3720 4000
20-Oct-08 N 2625 3300
24-Oct-08 N 2295 2900
12-Nov-08 N 2190 2600
16-Dec-08 N 1825 2100
02-Mar-09 N 1668 1830
23-Mar-09 N 2010 1770
09-Apr-09 N 2480 2100
15-May-09 N 2570 2300
02-Nov-09 N 2785 2650
09-Feb-10 N 2985 3000
14-Apr-10 N 3415 3500
22-May-10 N 2884 3000
27-Jul-10 OW 2512 3150
15-Dec-10 OW 2988 3866
0
1,991
3,982
5,973
7,964
9,955
11,946
Price(Y)
Sep06
Mar08
Sep09
Mar11
Sep12
Sony (6758.T, 6758 JT) Price Chart
N Y7,600 OW Y6,200N Y3,300N Y2,100N Y2,100 N Y3,500 OW Y2,600 N Y920
N Y5,600 OW Y6,400N Y4,000N Y2,600N Y1,770 N Y3,000OW Y3,150OW Y3,000 NR N Y840N Y1,800
N Y4,900OW Y7,600 OW Y7,000OW Y5,450N Y2,900N Y1,830N Y2,300N Y2,650N Y3,000OW Y3,866OW Y3,400N Y1,500N Y1,250NR N Y1,600N Y1,600
Source: Bloomberg and J.P. Morgan; price data adjusted for stock splits and dividends.
Break in coverage Aug 09, 2012 - Oct 09, 2012.

12
Asia Pacific Equity Research10 January 2014
JJ Park(822) [email protected]
27-Apr-11 OW 2366 3400
27-May-11 OW 2167 3000
12-Aug-11 OW 1664 2600
03-Nov-11 N 1520 1500
29-May-12 N 1048 1250
09-Aug-12 NR 922 --
09-Oct-12 N 948 920
14-Nov-12 NR 861 --
04-Dec-12 N 793 840
10-Apr-13 N 1643 1600
11-Jul-13 N 2188 1800
09-Nov-13 N 1694 1600
The chart(s) show J.P. Morgan's continuing coverage of the stocks; the current analysts may or may not have covered it over the entire period. J.P. Morgan ratings or designations: OW = Overweight, N= Neutral, UW = Underweight, NR = Not Rated
Explanation of Equity Research Ratings, Designations and Analyst(s) Coverage Universe: J.P. Morgan uses the following rating system: Overweight [Over the next six to twelve months, we expect this stock will outperform the average total return of the stocks in the analyst’s (or the analyst’s team’s) coverage universe.] Neutral [Over the next six to twelve months, we expect this stock will perform in line with the average total return of the stocks in the analyst’s (or the analyst’s team’s) coverage universe.] Underweight [Over the next six to twelve months, we expect this stock will underperform the average total return of the stocks in the analyst’s (or the analyst’s team’s) coverage universe.] Not Rated (NR): J.P. Morgan has removed the rating and, if applicable, the price target, for this stock because of either a lack of a sufficient fundamental basis or for legal, regulatory or policy reasons. The previous rating and, if applicable, the price target, no longer should be relied upon. An NR designation is not a recommendation or a rating. In our Asia (ex-Australia) and U.K. small- and mid-cap equity research, each stock’s expected total return is compared to the expected total return of a benchmark country market index, not to those analysts’ coverage universe. If it does not appear in the Important Disclosures section of this report, the certifying analyst’s coverage universe can be found on J.P. Morgan’s research website, www.jpmorganmarkets.com.
Coverage Universe: Park, JJ: LG Display (034220.KS), LG Electronics (066570.KS), Panasonic (6752.T), SK Hynix (000660.KS), Samsung Electronics (005930.KS), Samsung SDI (006400.KS), Sony (6758.T), TSMC (2330.TW)
J.P. Morgan Equity Research Ratings Distribution, as of January 1, 2014
Overweight(buy)
Neutral(hold)
Underweight(sell)
J.P. Morgan Global Equity Research Coverage 43% 45% 12%IB clients* 57% 49% 36%
JPMS Equity Research Coverage 43% 50% 7%IB clients* 75% 66% 59%
*Percentage of investment banking clients in each rating category.For purposes only of FINRA/NYSE ratings distribution rules, our Overweight rating falls into a buy rating category; our Neutral rating falls into a hold rating category; and our Underweight rating falls into a sell rating category. Please note that stocks with an NR designation are not included in the table above.
Equity Valuation and Risks: For valuation methodology and risks associated with covered companies or price targets for covered companies, please see the most recent company-specific research report at http://www.jpmorganmarkets.com, contact the primary analyst or your J.P. Morgan representative, or email [email protected].
Equity Analysts' Compensation: The equity research analysts responsible for the preparation of this report receive compensation based upon various factors, including the quality and accuracy of research, client feedback, competitive factors, and overall firm revenues.
Registration of non-US Analysts: Unless otherwise noted, the non-US analysts listed on the front of this report are employees of non-US affiliates of JPMS, are not registered/qualified as research analysts under NASD/NYSE rules, may not be associated persons of JPMS, and may not be subject to FINRA Rule 2711 and NYSE Rule 472 restrictions on communications with covered companies, public appearances, and trading securities held by a research analyst account.
Other Disclosures
J.P. Morgan ("JPM") is the global brand name for J.P. Morgan Securities LLC ("JPMS") and its affiliates worldwide. J.P. Morgan Cazenove is a marketing name for the U.K. investment banking businesses and EMEA cash equities and equity research businesses of JPMorgan Chase & Co. and its subsidiaries.

13
Asia Pacific Equity Research10 January 2014
JJ Park(822) [email protected]
All research reports made available to clients are simultaneously available on our client website, J.P. Morgan Markets. Not all research content is redistributed, e-mailed or made available to third-party aggregators. For all research reports available on a particular stock, please contact your sales representative.
Options related research: If the information contained herein regards options related research, such information is available only to persons who have received the proper option risk disclosure documents. For a copy of the Option Clearing Corporation's Characteristics and Risks of Standardized Options, please contact your J.P. Morgan Representative or visit the OCC's website at http://www.optionsclearing.com/publications/risks/riskstoc.pdf
Legal Entities Disclosures U.S.: JPMS is a member of NYSE, FINRA, SIPC and the NFA. JPMorgan Chase Bank, N.A. is a member of FDIC. U.K.: JPMorgan Chase N.A., London Branch, is authorised by the Prudential Regulation Authority and is subject to regulation by the Financial Conduct Authority and to limited regulation by the Prudential Regulation Authority. Details about the extent of our regulation by the Prudential Regulation Authority are available from J.P. Morgan on request. J.P. Morgan Securities plc (JPMS plc) is a member of the London Stock Exchange and is authorised by the Prudential Regulation Authority and regulated by the Financial Conduct Authority and the Prudential Regulation Authority. Registered in England & Wales No. 2711006. Registered Office 25 Bank Street, London, E14 5JP. South Africa: J.P. Morgan Equities South Africa Proprietary Limited is a member of the Johannesburg Securities Exchange and is regulated by the Financial Services Board. Hong Kong: J.P. Morgan Securities (Asia Pacific) Limited (CE number AAJ321) is regulated by the Hong Kong Monetary Authority and the Securities and Futures Commission in Hong Kong. Korea: J.P. Morgan Securities (Far East) Ltd, Seoul Branch, is regulated by the Korea Financial Supervisory Service. Australia: J.P. Morgan Australia Limited (JPMAL) (ABN 52 002 888 011/AFS Licence No: 238188) is regulated by ASIC and J.P. Morgan Securities Australia Limited (JPMSAL) (ABN 61 003 245 234/AFS Licence No: 238066) is regulated by ASIC and is a Market, Clearing and Settlement Participant of ASX Limited and CHI-X. Taiwan: J.P.Morgan Securities (Taiwan) Limited is a participant of the Taiwan Stock Exchange (company-type) and regulated by the Taiwan Securities and Futures Bureau. India: J.P. Morgan India Private Limited, having its registered office at J.P. Morgan Tower, Off. C.S.T. Road, Kalina, Santacruz East, Mumbai - 400098, is a member of the National Stock Exchange of India Limited (SEBI Registration Number - INB 230675231/INF 230675231/INE 230675231) and Bombay Stock Exchange Limited (SEBI Registration Number - INB 010675237/INF 010675237) and is regulated by Securities and Exchange Board of India. Thailand: JPMorgan Securities (Thailand) Limited is a member of the Stock Exchange of Thailand and is regulated by the Ministry of Finance and the Securities and Exchange Commission. Indonesia: PT J.P. Morgan Securities Indonesia is a member of the Indonesia Stock Exchange and is regulated by the BAPEPAM LK. Philippines: J.P. Morgan Securities Philippines Inc. is a Trading Participant of the Philippine Stock Exchange and a member of the Securities Clearing Corporation of the Philippines and the Securities Investor Protection Fund. It is regulated by the Securities and Exchange Commission. Brazil: Banco J.P. Morgan S.A. is regulated by the Comissao de Valores Mobiliarios (CVM) and by the Central Bank of Brazil. Mexico: J.P. Morgan Casa de Bolsa, S.A. de C.V., J.P. Morgan Grupo Financiero is a member of the Mexican Stock Exchange and authorized to act as a broker dealer by the National Banking and Securities Exchange Commission. Singapore: This material is issued and distributed in Singapore by J.P. Morgan Securities Singapore Private Limited (JPMSS) [MIC (P) 049/04/2013 and Co. Reg. No.: 199405335R] which is a member of the Singapore Exchange Securities Trading Limited and is regulated by the Monetary Authority of Singapore (MAS) and/or JPMorgan Chase Bank, N.A., Singapore branch (JPMCB Singapore) which is regulated by the MAS. Japan: JPMorgan Securities Japan Co., Ltd. is regulated by the Financial Services Agency in Japan. Malaysia: This material is issued and distributed in Malaysia by JPMorgan Securities (Malaysia) Sdn Bhd (18146-X) which is a Participating Organization of Bursa Malaysia Berhad and a holder of Capital Markets Services License issued by the Securities Commission in Malaysia. Pakistan: J. P. Morgan Pakistan Broking (Pvt.) Ltd is a member of the Karachi Stock Exchange and regulated by the Securities and Exchange Commission of Pakistan. Saudi Arabia: J.P. Morgan Saudi Arabia Ltd. is authorized by the Capital Market Authority of the Kingdom of Saudi Arabia (CMA) to carry out dealing as an agent, arranging, advising and custody, with respect to securities business under licence number 35-07079 and its registered address is at 8th Floor, Al-Faisaliyah Tower, King Fahad Road, P.O. Box 51907, Riyadh 11553, Kingdom of Saudi Arabia. Dubai: JPMorgan Chase Bank, N.A., Dubai Branch is regulated by the Dubai Financial Services Authority (DFSA) and its registered address is Dubai International Financial Centre - Building 3, Level 7, PO Box 506551, Dubai, UAE.
Country and Region Specific Disclosures U.K. and European Economic Area (EEA): Unless specified to the contrary, issued and approved for distribution in the U.K. and the EEA by JPMS plc. Investment research issued by JPMS plc has been prepared in accordance with JPMS plc's policies for managing conflicts of interest arising as a result of publication and distribution of investment research. Many European regulators require a firm to establish, implement and maintain such a policy. This report has been issued in the U.K. only to persons of a kind described in Article 19 (5), 38, 47 and 49 of the Financial Services and Markets Act 2000 (Financial Promotion) Order 2005 (all such persons being referred to as "relevant persons"). This document must not be acted on or relied on by persons who are not relevant persons. Any investment or investment activity to which this document relates is only available to relevant persons and will be engaged in only with relevant persons. In other EEA countries, the report has been issued to persons regarded as professional investors (or equivalent) in their home jurisdiction. Australia: This material is issued and distributed by JPMSAL in Australia to "wholesale clients" only. This material does not take into account the specific investment objectives, financial situation or particular needs of the recipient. The recipient of this material must not distribute it to any third party or outside Australia without the prior written consent of JPMSAL. For the purposes of this paragraph the term "wholesale client" has the meaning given in section 761G of the Corporations Act 2001. Germany: This material is distributed in Germany by J.P. Morgan Securities plc, Frankfurt Branch and J.P.Morgan Chase Bank, N.A., Frankfurt Branch which are regulated by the Bundesanstalt für Finanzdienstleistungsaufsicht. Hong Kong: The 1% ownership disclosure as of the previous month end satisfies the requirements under Paragraph 16.5(a) of the Hong Kong Code of Conduct for Persons Licensed by or Registered with the Securities and Futures Commission. (For research published within the first ten days of the month, the disclosure may be based on the month end data from two months prior.) J.P. Morgan Broking (Hong Kong) Limited is the liquidity provider/market maker for derivative warrants, callable bull bear contracts and stock options listed on the Stock Exchange of Hong Kong Limited. An updated list can be found on HKEx website: http://www.hkex.com.hk. Japan: There is a risk that a loss may occur due to a change in the price of the shares in the case of share trading, and that a loss may occur due to the exchange rate in the case of foreign share trading. In the case of share trading, JPMorgan Securities Japan Co., Ltd., will be receiving a brokerage fee and consumption tax (shouhizei) calculated by multiplying the executed price by the commission rate which was individually agreed between JPMorgan Securities Japan Co., Ltd., and the customer in advance. Financial Instruments Firms: JPMorgan Securities Japan Co., Ltd., Kanto Local Finance Bureau (kinsho) No. 82 Participating Association / Japan Securities Dealers Association, The Financial Futures Association of Japan, Type II Financial Instruments Firms Association and Japan Investment Advisers Association. Korea: This report may have been edited or contributed to from time to time by affiliates of J.P. Morgan Securities (Far East) Ltd, Seoul Branch. Singapore: JPMSS and/or its affiliates may have a holding in any of the securities discussed in this report; for securities where the holding is 1% or greater, the specific holding is disclosed in the Important Disclosures

14
Asia Pacific Equity Research10 January 2014
JJ Park(822) [email protected]
section above. India: For private circulation only, not for sale. Pakistan: For private circulation only, not for sale. New Zealand: This material is issued and distributed by JPMSAL in New Zealand only to persons whose principal business is the investment of money or who, in the course of and for the purposes of their business, habitually invest money. JPMSAL does not issue or distribute this material to members of "the public" as determined in accordance with section 3 of the Securities Act 1978. The recipient of this material must not distribute it to any third party or outside New Zealand without the prior written consent of JPMSAL. Canada: The information contained herein is not, and under no circumstances is to be construed as, a prospectus, an advertisement, a public offering, an offer to sell securities described herein, or solicitation of an offer to buy securities described herein, in Canada or any province or territory thereof. Any offer or sale of the securities described herein in Canada will be made only under an exemption from the requirements to file a prospectus with the relevant Canadian securities regulators and only by a dealer properly registered under applicable securities laws or, alternatively, pursuant to an exemption from the dealer registration requirement in the relevant province or territory of Canada in which such offer or sale is made. The information contained herein is under no circumstances to be construed as investment advice in any province or territory of Canada and is not tailored to the needs of the recipient. To the extent that the information contained herein references securities of an issuer incorporated, formed or created under the laws of Canada or a province or territory of Canada, any trades in such securities must be conducted through a dealer registered in Canada. No securities commission or similar regulatory authority in Canada has reviewed or in any way passed judgment upon these materials, the information contained herein or the merits of the securities described herein, and any representation to the contrary is an offence. Dubai: This report has been issued to persons regarded as professional clients as defined under the DFSA rules. Brazil: Ombudsman J.P. Morgan: 0800-7700847 / [email protected].
General: Additional information is available upon request. Information has been obtained from sources believed to be reliable but JPMorgan Chase & Co. or its affiliates and/or subsidiaries (collectively J.P. Morgan) do not warrant its completeness or accuracy except with respect to any disclosures relative to JPMS and/or its affiliates and the analyst's involvement with the issuer that is the subject of the research. All pricing is as of the close of market for the securities discussed, unless otherwise stated. Opinions and estimates constitute our judgment as of the date of this material and are subject to change without notice. Past performance is not indicative of future results. This material is not intended as an offer or solicitation for the purchase or sale of any financial instrument. The opinions and recommendations herein do not take into account individual client circumstances, objectives, or needs and are not intended as recommendations of particular securities, financial instruments or strategies to particular clients. The recipient of this report must make its own independent decisions regarding any securities or financial instruments mentioned herein. JPMS distributes in the U.S. research published by non-U.S. affiliates and accepts responsibility for its contents. Periodic updates may be provided on companies/industries based on company specific developments or announcements, market conditions or any other publicly available information. Clients should contact analysts and execute transactions through a J.P. Morgan subsidiary or affiliate in their home jurisdiction unless governing law permits otherwise.
"Other Disclosures" last revised December 7, 2013.
Copyright 2014 JPMorgan Chase & Co. All rights reserved. This report or any portion hereof may not be reprinted, sold or redistributed without the written consent of J.P. Morgan. #$J&098$#*P