Luxury Accommodation New Zealand - Otahuna in Business Traveller March 2010
1
BUSINESS TRAVELLER RESEARCH 2011
ASIA PACIFIC
2
Asia Pacific Business Traveller Research 2011
FOREWORD
In keeping with its position as one of the key
thought leaders in the global hospitality
industry, we at Accor are pleased to present
the results of the Accor Asia Pacific Business
Travel Research 2011. This comprehensive study
seeks to better understand the travel and
behavioural preferences of business travellers
in the region. The research interviewed over
10,000 respondents who made business
trips in the first half of 2011. Amongst the
aspects that the research covers includes the
number of trips made by business travellers
in Asia Pacific in the first half of 2011,
destinations which are most frequented by
Asia Pacific’s business travellers, spend in
terms of accommodation, factors influencing
accommodation choice and hotel facilities
and services usage as well as interesting and
anecdotal insights into the business travel
experience. This research is now in its second
edition and has been updated to reflect market
conditions unique to the Asia Pacific region.
The Executive Summary and Findings in the
following pages will provide prevailing trends
influencing this key travel segment.
Evan Lewis
Vice President Communications - Asia Pacific Accor Asia Pacific
3
Booking The Hotel For Business Travel
Spend On Hotel Accommodation For Business Travel
Choosing The Hotel
The Hotel Of The Future
Planned Travel For The Last 6 Months Of 2011
1
2
3
4
5
66.1
5.1
3.1
1.1
6.2
5.2
3.2
1.2
5.3
3.3
1.3
5.4
3.4
Asia Pacific Business Traveller Research 2011
CONTENTS
Executive SummaryBusiness Travel In The First 6 Months Of 2011, And Planned For The Last 6 Months
Planning Business Trips
Usage Of Hotel Facilities
Respondent Profiles
Business Travel In The First 6 Months Of 2011Types Of Business Trip: Domestic Vs. International
Number Of International Business Trips
Purpose Of Business Trips
Destinations Travelled To For Business In The First Half Of 2011
Usage Of Hotel FacilitiesWorking While Staying At The Hotel
Usage Of Recreational Facilities
4.1
Planning Of Business TravelDestinations Planned To Travel To For Business In The Second Half Of 2011
4
Asia Pacific Business Traveller Research 2011
Executive Summary
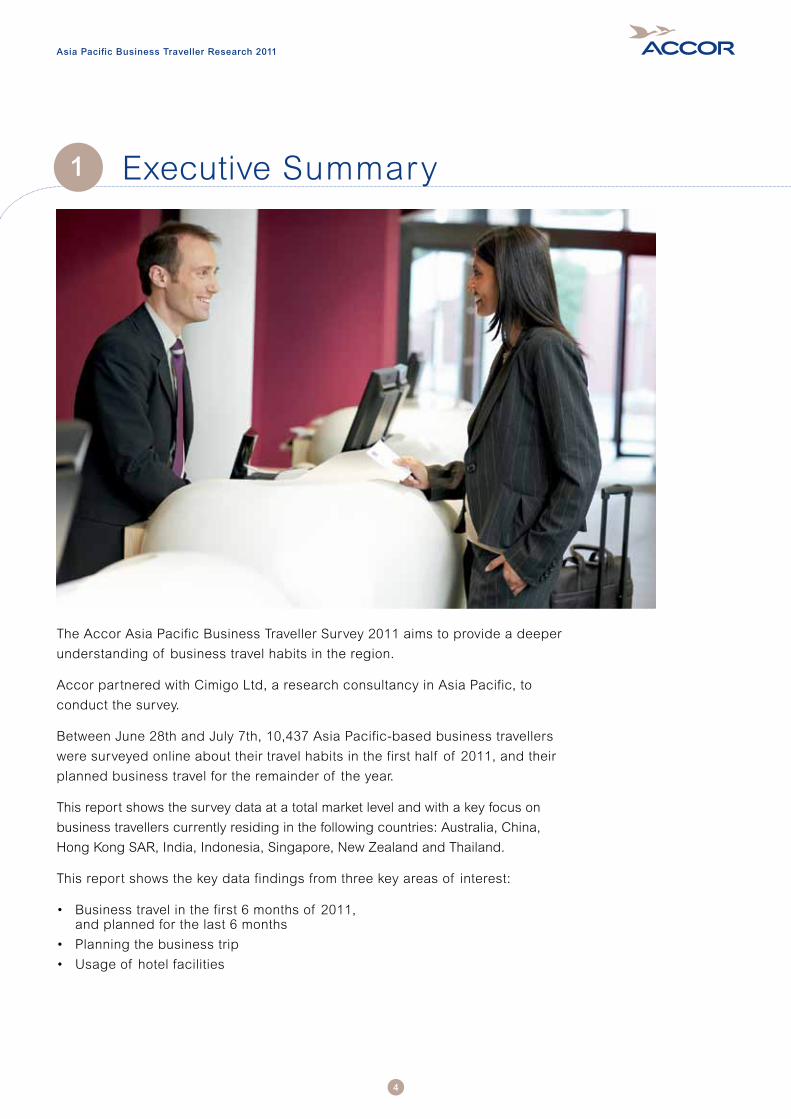
The Accor Asia Pacific Business Traveller Survey 2011 aims to provide a deeper
understanding of business travel habits in the region.
Accor partnered with Cimigo Ltd, a research consultancy in Asia Pacific, to
conduct the survey.
Between June 28th and July 7th, 10,437 Asia Pacific-based business travellers
were surveyed online about their travel habits in the first half of 2011, and their
planned business travel for the remainder of the year.
This report shows the survey data at a total market level and with a key focus on
business travellers currently residing in the following countries: Australia, China,
Hong Kong SAR, India, Indonesia, Singapore, New Zealand and Thailand.
This report shows the key data findings from three key areas of interest:
• Businesstravelinthefirst6monthsof 2011, and planned for the last 6 months
• Planningthebusinesstrip
• Usageof hotelfacilities
1
5
Executive Summary
Across the region, business travellers took an average of 6.3 business trips in
the first 6 months of 2011. Male business travellers (7.0 trips) were on the road
more frequently than females (4.5 trips) and differences were also observed by
job title/grade, with Directors and C-Level (i.e. CEO, COO, CFO etc.) travelling
most frequently (8.0 and 7.3 trips respectively).
The average number of trips also differed by country of residence, with Chinese
(8.7), Indian (7.3) and Singaporean (7.1) respondents taking the highest number
of trips on average, and Thais (5.0), Australians (5.2) and New Zealanders (5.2)
taking the fewest number. The average number of trips for Chinese respondents
was boosted by a significant segment of ‘road warriors’ – 15% took 20+
business trips in the first 6 months of the year.
The majority of business travel was international, though domestic travel was
also included in the survey. The larger the geographical size of the country, the
higher the incidence of ‘domestic only’ business travel: Australia (34%), New
Zealand (26%) and China (25%) topping this list.
The purpose of the business trips was a mix of external company business
(e.g. sales calls), internal company business (e.g. visiting regional offices),
attending industry meetings/trade shows, training, and attending conferences.
Sales meetings were more likely to be attended by C-Level respondents, Owner/
Partners and Directors.
Singapore and Hong Kong (both 38%) were the destinations most frequently
travelled to for business and appeared in the “Top 3” destinations for travellers
from all the key markets in our survey. The other country in the Top 3 tended to
be the closest geographical neighbor (e.g. Australia for New Zealand business
travellers and vice versa).
Looking to the remainder of the year, the average number of trips planned was
similar to the average number taken, with male and more senior job titles again
expecting to travel most frequently.
Business Travel In The First 6 Months Of 2011, And Planned For The Last 6 Months
1.1
6
Executive Summary
The majority of business travellers in our sample prefer to book their business
travel accommodation directly online with the hotel brand (57%), followed by
the secretary in the company (40%), while usage of offline travel agents is in
the minority (16%). Having the client book the hotel is least likely to happen in
Australia (6%) and New Zealand (6%), compared with the total market (14%).
Convenience is the key driver for booking directly online (67%), closely followed
by the expectation/possibility of special offers (63%) and the peace of mind of
instant confirmation (62%) of the room booking.
Business travellers also expect that the hotel branded website will offer the most
competitive rates (49%), slightly ahead of independent online travel websites
(43%). This is especially true for business travellers from India (62%) and
Indonesia (56%).
The main reason for choosing the actual hotel stayed at was the convenience
of its location (56%), the number one driver across all of the key markets in the
survey. Previous experience with the actual hotel or the brand behind it (as well
as competitive pricing) also factored strongly.
The survey also found that business travellers in the region are ‘environmentally
aware’ when choosing a hotel: 61% would choose a hotel simply because it is
more environmentally conscious, and 59% would pay extra to stay in a hotel with
a superior environmental commitment to a similar standard hotel in the same
location. For those willing to pay more, the average they would be prepared to
increase was 10% (across all markets). Business travellers from China were
most likely to be described as driven by environmental concerns, with 91%
willing to pay extra, followed by travellers from Indonesia and Thailand (77% and
70% respectively). Respondents from Australia (38%) and New Zealand (37%)
were least likely, though in both of these markets, female business travellers
were more environmentally driven then the men.
Allocated budget for business travel hotel accommodation averages at US$121
per night, with some variances across the region. Business travellers from New
Zealand (39%) and Australia (36%) are most likely to have ‘no defined budget’
for their accommodation, compared to the total base (26%) and their average
spend on hotel accommodation is also higher than average (US$131 and
US$158 respectively). The lowest budgets for business travel accommodation
are in Indonesia (US$92) and China (US$99).
However, across the region, hotel accommodation budget can be increased
in special circumstances, such as travelling with someone more senior (22%),
travelling with clients (23%) or travelling long-haul (28%). The incidence of
an increase in budget for travelling with seniors and/or clients is highest for
business travellers from China (38% and 30% respectively).
1.2 Planning Business Trips
7
Executive Summary
For those travelling for business in the first 6 months of 2011, business travel could be described as ‘mainly work and some play’: 75% working in the hotel at some point during their trip. This increased to 82% for respondents travelling from China and Singapore.
Travellers from Hong Kong are most likely to ‘burn the midnight oil’ with 14% working between midnight and 6AM, compared to 7% on average. The most likely times for business travellers to work in the hotel are after office hours: 35% working between 6PM and 9PM and 52% working between 9PM and Midnight. Respondents from Australia (53%) and New Zealand (55%) were most likely to work between 9PM and Midnight, and were also most likely to be early risers (35% and 38% respectively working between 6AM and 9AM).
Taking a break from work is more likely to involve a visit to the hotel fitness centre (53%) than the hotel Spa (36%). Indian business travellers are the ‘power users’ of the fitness centre (64%). While in the fitness centre, business travellers are swapping one treadmill for another, with 93% using cardiovascular equipment rather than weights (39%). Australian business travellers are most likely to use weights, at 48%.
When availing of the Spa facilities in the hotel, business travellers from Singapore (83%), Hong Kong (74%), China (71%), India (70%) and Thailand (70%) are more likely to avail of body and foot massage services, while travellers from New Zealand (74%) and Australia (69%) are more likely to use the sauna/steam room.
1.3 Usage Of Hotel Facilities
8
Asia Pacific Business Traveller Research 2011
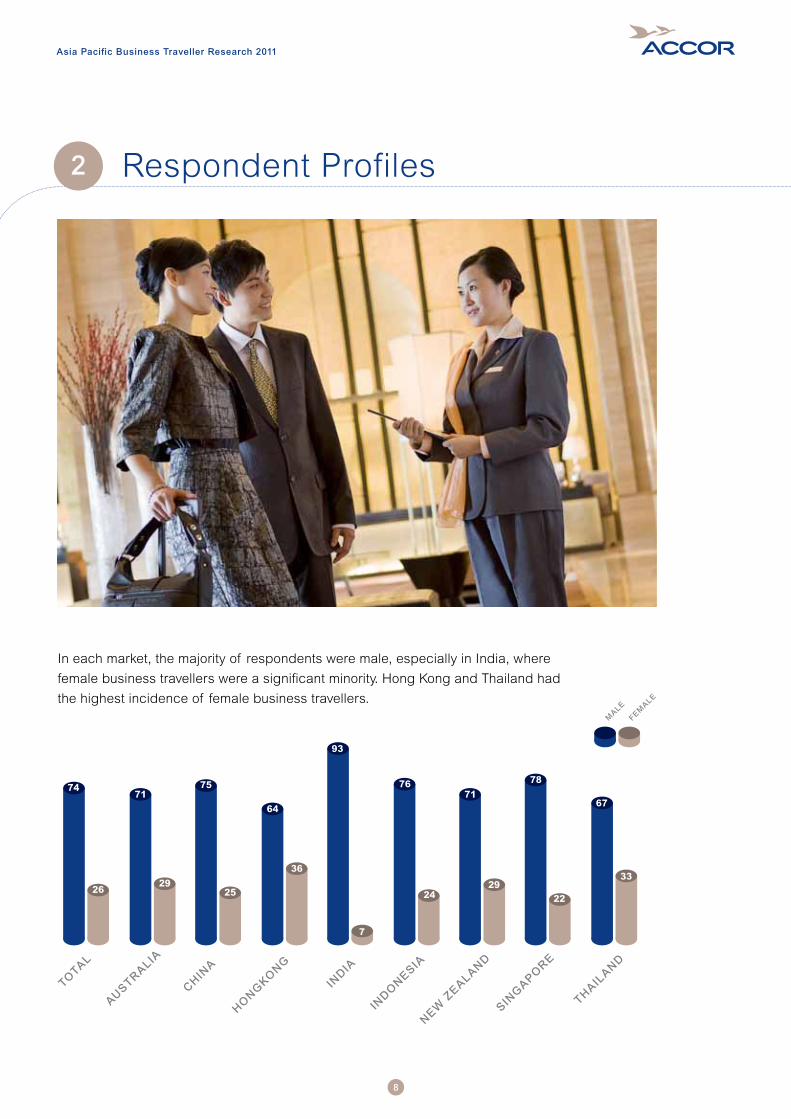
In each market, the majority of respondents were male, especially in India, where
female business travellers were a significant minority. Hong Kong and Thailand had
the highest incidence of female business travellers.
Respondent Profiles2
9
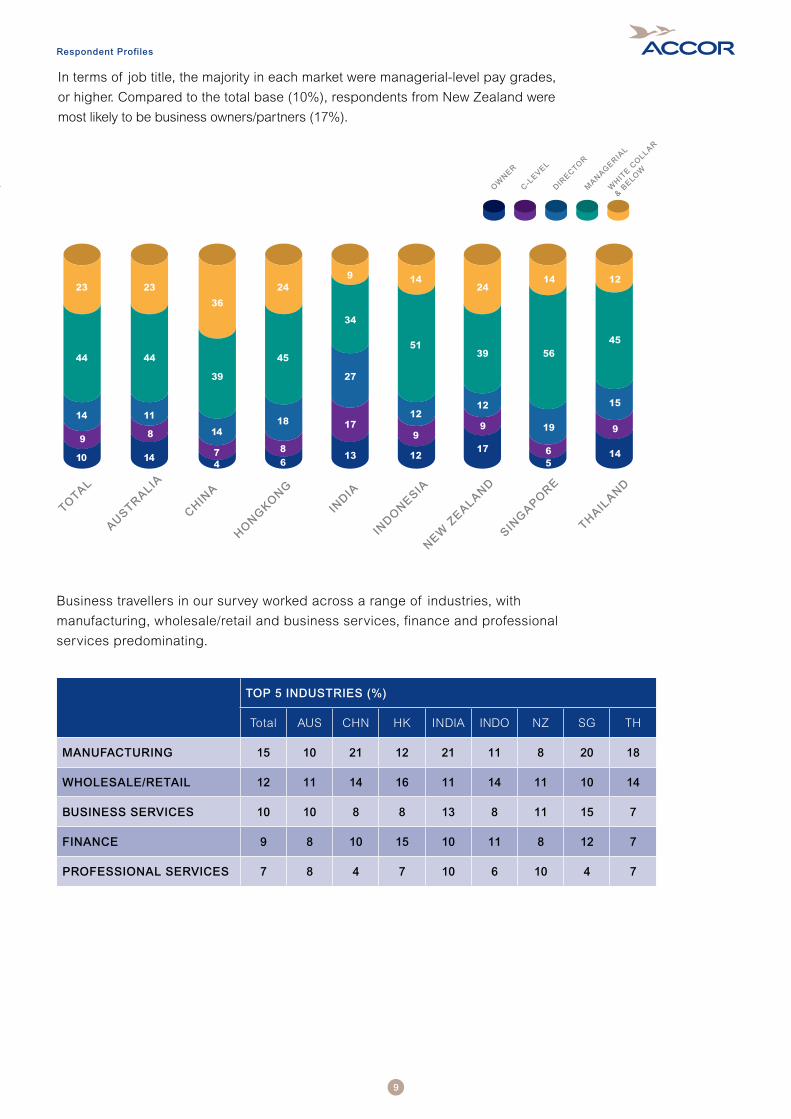
In terms of job title, the majority in each market were managerial-level pay grades,
or higher. Compared to the total base (10%), respondents from New Zealand were
most likely to be business owners/partners (17%).
Respondent Profiles
Business travellers in our survey worked across a range of industries, with
manufacturing, wholesale/retail and business services, finance and professional
services predominating.
TOP 5 INDUSTRIES (%)
Total AUS CHN HK INDIA INDO NZ SG TH
MANUFACTURING 15 10 21 12 21 11 8 20 18
WHOLESALE/RETAIL 12 11 14 16 11 14 11 10 14
BUSINESS SERVICES 10 10 8 8 13 8 11 15 7
FINANCE 9 8 10 15 10 11 8 12 7
PROFESSIONAL SERVICES 7 8 4 7 10 6 10 4 7
10
Asia Pacific Business Traveller Research 2011
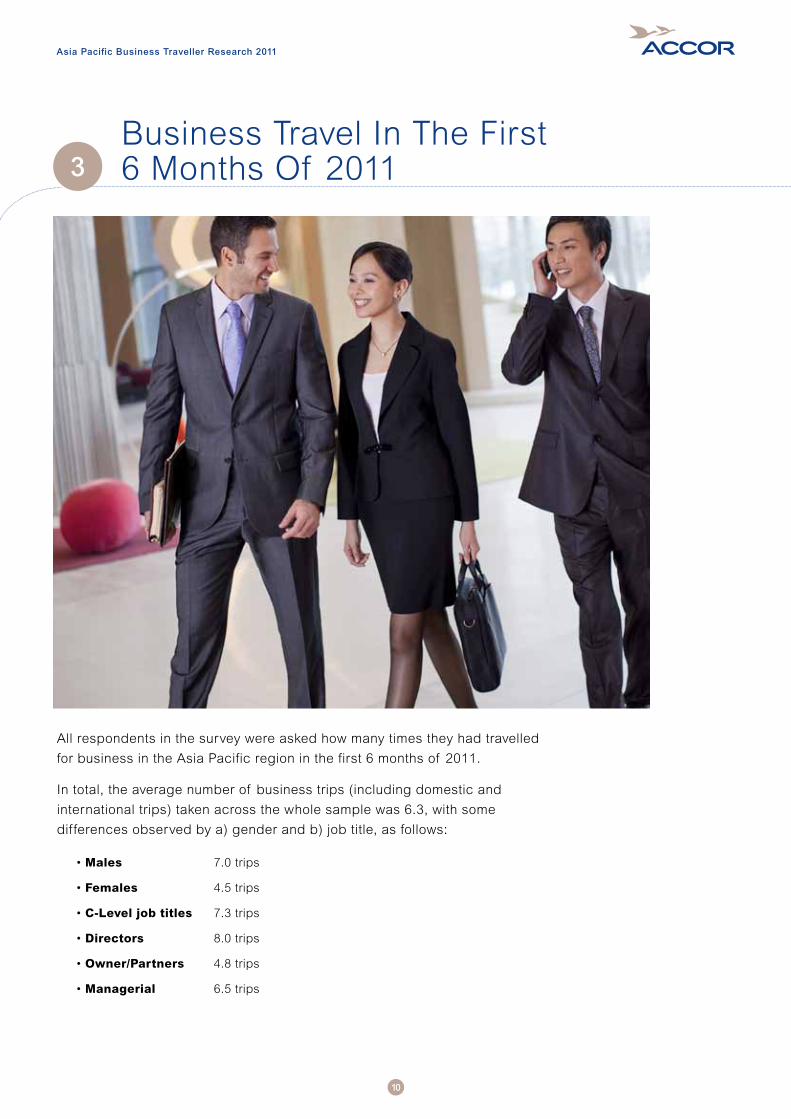
All respondents in the survey were asked how many times they had travelled
for business in the Asia Pacific region in the first 6 months of 2011.
In total, the average number of business trips (including domestic and
international trips) taken across the whole sample was 6.3, with some
differences observed by a) gender and b) job title, as follows:
•Males 7.0 trips
•Females 4.5 trips
•C-Level job titles 7.3 trips
•Directors 8.0 trips
•Owner/Partners 4.8 trips
•Managerial 6.5 trips
Business Travel In The First 6 Months Of 20113
11
Business Travel In The First 6 Months Of 2011
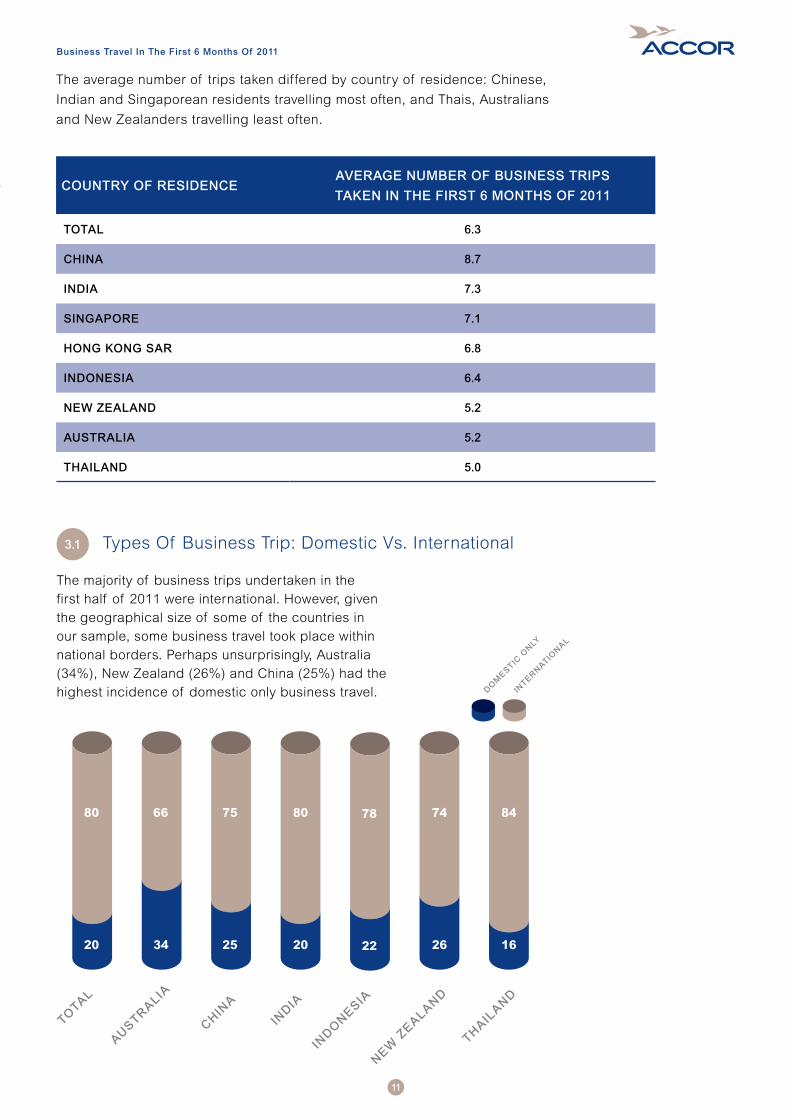
The average number of trips taken differed by country of residence: Chinese,
Indian and Singaporean residents travelling most often, and Thais, Australians
and New Zealanders travelling least often.
COUNTRY OF RESIDENCEAVERAGE NUMBER OF BUSINESS TRIPS
TAKEN IN THE FIRST 6 MONTHS OF 2011
TOTAL 6.3
CHINA 8.7
INDIA 7.3
SINGAPORE 7.1
HONG KONG SAR 6.8
INDONESIA 6.4
NEW ZEALAND 5.2
AUSTRALIA 5.2
THAILAND 5.0
The majority of business trips undertaken in the first half of 2011 were international. However, given the geographical size of some of the countries in our sample, some business travel took place within national borders. Perhaps unsurprisingly, Australia (34%), New Zealand (26%) and China (25%) had the highest incidence of domestic only business travel.
3.1 Types Of Business Trip: Domestic Vs. International
12
The number of international business trips taken also varied, with some business travellers more active than others in the first 6 months of 2011.
Chinese business travellers were on the road most frequently: 17% taking between 10-19 business trips, and 15% taking more than 20. New Zealand respondents were amongst the most infrequent travellers: 26% taking just one trip between January and June 2011.
3.2 Number Of International Business Trips
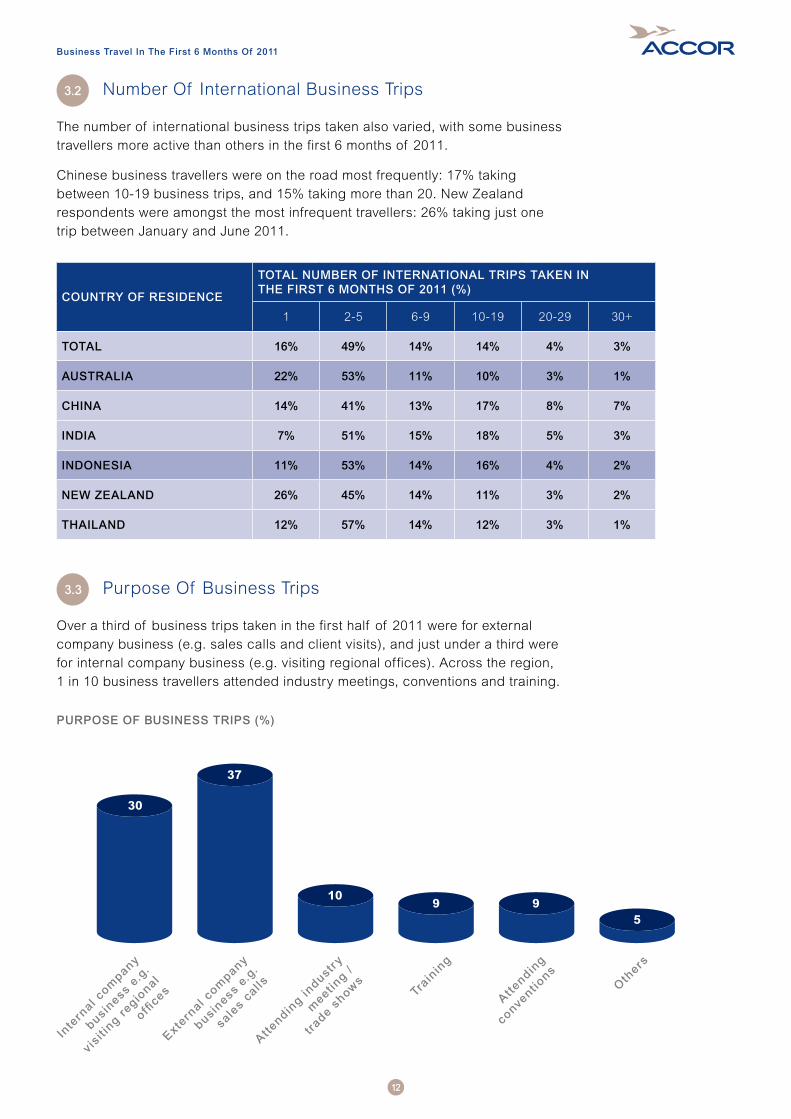
Over a third of business trips taken in the first half of 2011 were for external company business (e.g. sales calls and client visits), and just under a third were for internal company business (e.g. visiting regional offices). Across the region, 1 in 10 business travellers attended industry meetings, conventions and training.
3.3 Purpose Of Business Trips
PURPOSE OF BUSINESS TRIPS (%)
Business Travel In The First 6 Months Of 2011
COUNTRY OF RESIDENCE
TOTAL NUMBER OF INTERNATIONAL TRIPS TAKEN INTHE FIRST 6 MONTHS OF 2011 (%)
1 2-5 6-9 10-19 20-29 30+
TOTAL 16% 49% 14% 14% 4% 3%
AUSTRALIA 22% 53% 11% 10% 3% 1%
CHINA 14% 41% 13% 17% 8% 7%
INDIA 7% 51% 15% 18% 5% 3%
INDONESIA 11% 53% 14% 16% 4% 2%
NEW ZEALAND 26% 45% 14% 11% 3% 2%
THAILAND 12% 57% 14% 12% 3% 1%
13
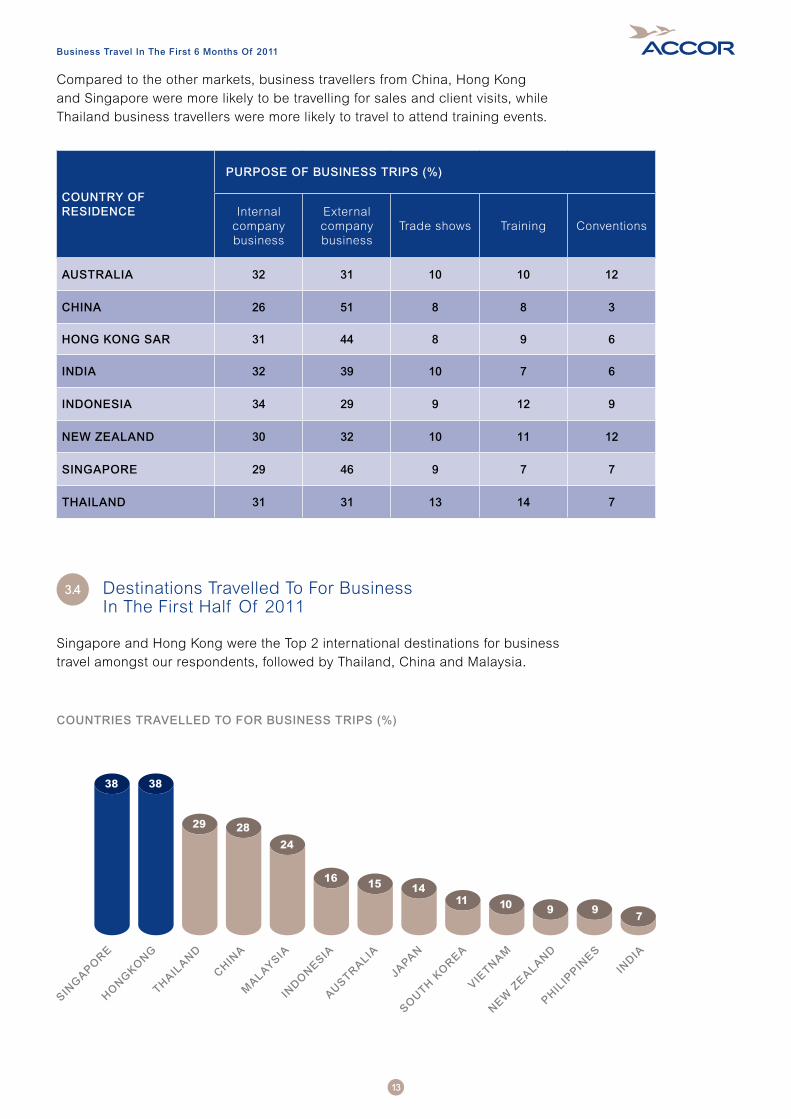
Compared to the other markets, business travellers from China, Hong Kong and Singapore were more likely to be travelling for sales and client visits, while Thailand business travellers were more likely to travel to attend training events.
Singapore and Hong Kong were the Top 2 international destinations for business travel amongst our respondents, followed by Thailand, China and Malaysia.
3.4 Destinations Travelled To For Business In The First Half Of 2011
Business Travel In The First 6 Months Of 2011
COUNTRIES TRAVELLED TO FOR BUSINESS TRIPS (%)
COUNTRY OF RESIDENCE
PURPOSE OF BUSINESS TRIPS (%)
Internal company business
External company business
Trade shows Training Conventions
AUSTRALIA 32 31 10 10 12
CHINA 26 51 8 8 3
HONG KONG SAR 31 44 8 9 6
INDIA 32 39 10 7 6
INDONESIA 34 29 9 12 9
NEW ZEALAND 30 32 10 11 12
SINGAPORE 29 46 9 7 7
THAILAND 31 31 13 14 7
14
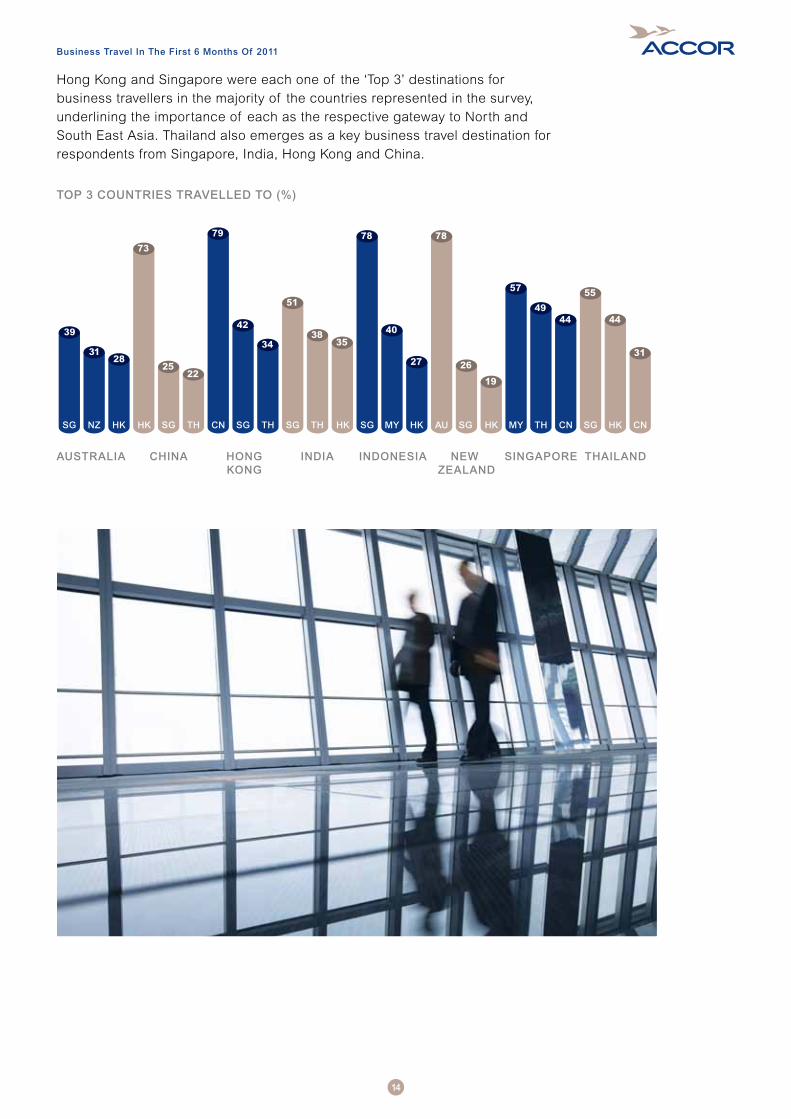
Hong Kong and Singapore were each one of the ‘Top 3’ destinations for business travellers in the majority of the countries represented in the survey, underlining the importance of each as the respective gateway to North and South East Asia. Thailand also emerges as a key business travel destination for respondents from Singapore, India, Hong Kong and China.
Business Travel In The First 6 Months Of 2011
TOP 3 COUNTRIES TRAVELLED TO (%)
15
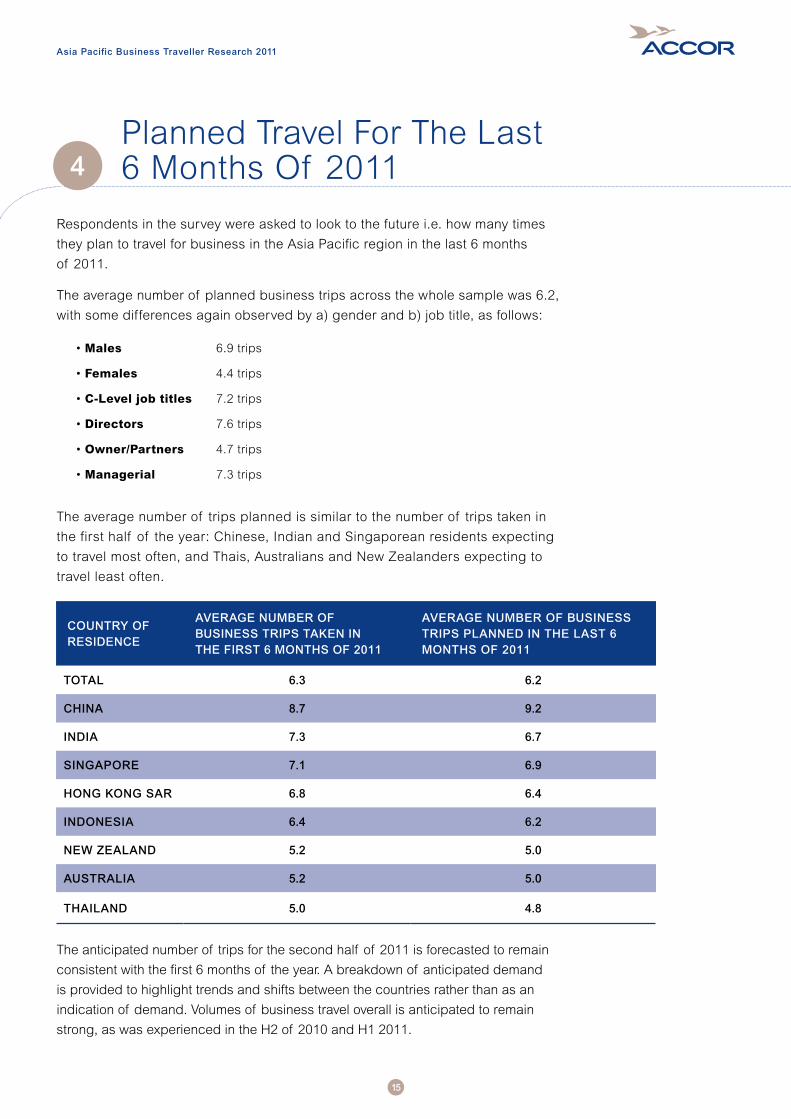
Respondents in the survey were asked to look to the future i.e. how many times
they plan to travel for business in the Asia Pacific region in the last 6 months
of 2011.
The average number of planned business trips across the whole sample was 6.2,
with some differences again observed by a) gender and b) job title, as follows:
•Males 6.9 trips
•Females 4.4 trips
•C-Level job titles 7.2 trips
•Directors 7.6 trips
•Owner/Partners 4.7 trips
•Managerial 7.3 trips
The average number of trips planned is similar to the number of trips taken in
the first half of the year: Chinese, Indian and Singaporean residents expecting
to travel most often, and Thais, Australians and New Zealanders expecting to
travel least often.
The anticipated number of trips for the second half of 2011 is forecasted to remain
consistent with the first 6 months of the year. A breakdown of anticipated demand
is provided to highlight trends and shifts between the countries rather than as an
indication of demand. Volumes of business travel overall is anticipated to remain
strong, as was experienced in the H2 of 2010 and H1 2011.
Asia Pacific Business Traveller Research 2011
Planned Travel For The Last 6 Months Of 20114
COUNTRY OF RESIDENCE
AVERAGE NUMBER OF BUSINESS TRIPS TAKEN IN THE FIRST 6 MONTHS OF 2011
AVERAGE NUMBER OF BUSINESS TRIPS PLANNED IN THE LAST 6 MONTHS OF 2011
TOTAL 6.3 6.2
CHINA 8.7 9.2
INDIA 7.3 6.7
SINGAPORE 7.1 6.9
HONG KONG SAR 6.8 6.4
INDONESIA 6.4 6.2
NEW ZEALAND 5.2 5.0
AUSTRALIA 5.2 5.0
THAILAND 5.0 4.8

16
Planned Travel For The Last 6 Months Of 2011
The majority of planned business trips for the remainder of 2011 are expected to involve international travel.
Singapore and Hong Kong are the most likely destinations for business travel planned for the second half of 2011.
4.1 Destinations planned to travel to for business in the second half of 2011
COUNTRIES PLANNED TO TRAVELLED TO FOR BUSINESS TRIPS (%)
17
Asia Pacific Business Traveller Research 2011
Planning Of Business Travel5
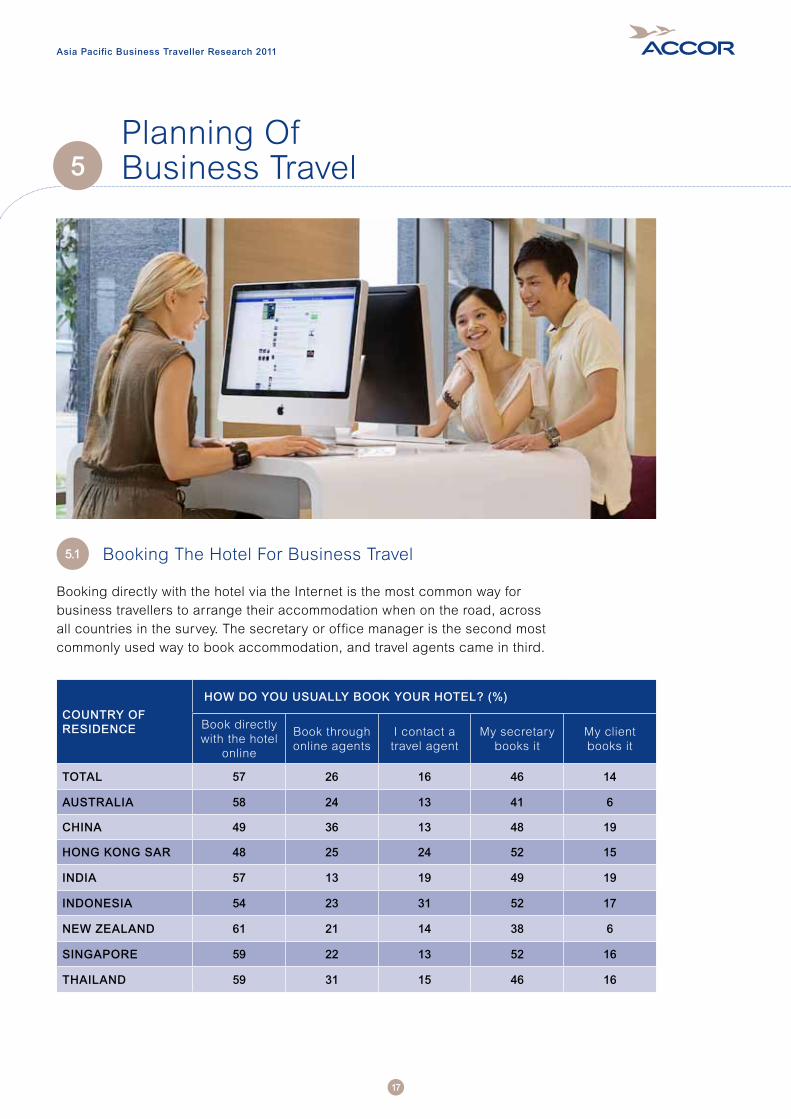
Booking directly with the hotel via the Internet is the most common way for business travellers to arrange their accommodation when on the road, across all countries in the survey. The secretary or office manager is the second most commonly used way to book accommodation, and travel agents came in third.
5.1 Booking The Hotel For Business Travel
COUNTRY OF RESIDENCE
HOW DO YOU USUALLY BOOK YOUR HOTEL? (%)
Book directly with the hotel
online
Book through online agents
I contact a travel agent
My secretary books it
My client books it
TOTAL 57 26 16 46 14
AUSTRALIA 58 24 13 41 6
CHINA 49 36 13 48 19
HONG KONG SAR 48 25 24 52 15
INDIA 57 13 19 49 19
INDONESIA 54 23 31 52 17
NEW ZEALAND 61 21 14 38 6
SINGAPORE 59 22 13 52 16
THAILAND 59 31 15 46 16
18
Planning Of Business Travel
WHICH WEBSITE HAS THE MOST COMPETITIVE RATES? (%)
COUNTRY OF RESIDENCE
HOTEL BRANDED WEBSITE
INDEPENDENT TRAVEL WEBSITE
MY TRAVEL AGENT’S WEBSITE
TOTAL 49 43 9
AUSTRALIA 45 50 6
CHINA 47 40 14
HONG KONG SAR 48 41 11
INDIA 62 33 4
INDONESIA 56 25 19
NEW ZEALAND 46 52 2
SINGAPORE 53 43 4
THAILAND 46 45 9
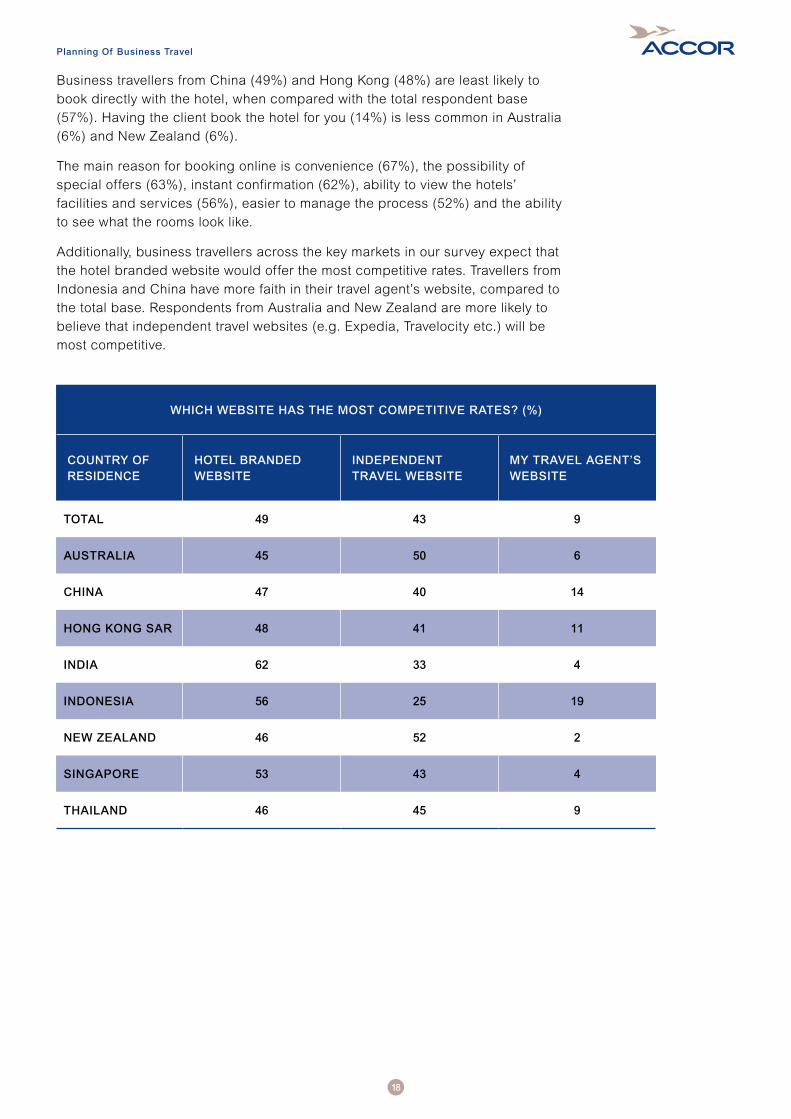
Business travellers from China (49%) and Hong Kong (48%) are least likely to book directly with the hotel, when compared with the total respondent base (57%). Having the client book the hotel for you (14%) is less common in Australia (6%) and New Zealand (6%).
The main reason for booking online is convenience (67%), the possibility of special offers (63%), instant confirmation (62%), ability to view the hotels’ facilities and services (56%), easier to manage the process (52%) and the ability to see what the rooms look like.
Additionally, business travellers across the key markets in our survey expect that the hotel branded website would offer the most competitive rates. Travellers from Indonesia and China have more faith in their travel agent’s website, compared to the total base. Respondents from Australia and New Zealand are more likely to believe that independent travel websites (e.g. Expedia, Travelocity etc.) will be most competitive.

19
Planning Of Business Travel
Allocated budget for business travel varies from country to country, with China and Indonesia amongst the lowest spenders. Travellers from Australia and New Zealand are more likely to have ‘no defined allowance’ for business travel accommodation.
The hotel allowance can be changed according to different circumstances, such as when travelling with someone more senior (22%), flying with clients (23%) or flying long-haul (28%), but in the majority of cases, companies will not make adjustments to budget under any circumstances (47%).
Compared to the total base, Chinese business travellers are most likely to receive an increase in budget allocation when they travel with a boss.
5.2 Spend On Hotel Accommodation For Business Travel
AVERAGE HOTEL ALLOWANCE PER NIGHT (US$)
20
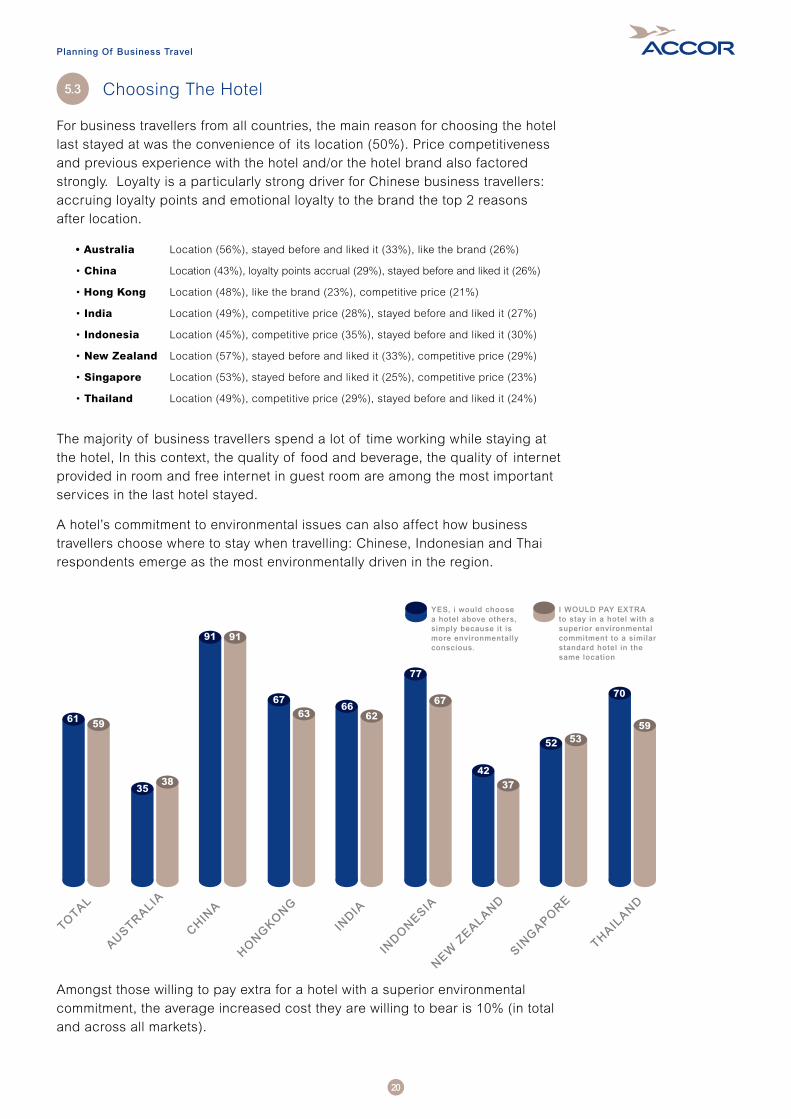
For business travellers from all countries, the main reason for choosing the hotel last stayed at was the convenience of its location (50%). Price competitiveness and previous experience with the hotel and/or the hotel brand also factored strongly. Loyalty is a particularly strong driver for Chinese business travellers: accruing loyalty points and emotional loyalty to the brand the top 2 reasons after location.
• Australia Location (56%), stayed before and liked it (33%), like the brand (26%)
•China Location (43%), loyalty points accrual (29%), stayed before and liked it (26%)
•Hong Kong Location (48%), like the brand (23%), competitive price (21%)
•India Location (49%), competitive price (28%), stayed before and liked it (27%)
•Indonesia Location (45%), competitive price (35%), stayed before and liked it (30%)
•New Zealand Location (57%), stayed before and liked it (33%), competitive price (29%)
•Singapore Location (53%), stayed before and liked it (25%), competitive price (23%)
•Thailand Location (49%), competitive price (29%), stayed before and liked it (24%)
The majority of business travellers spend a lot of time working while staying at the hotel, In this context, the quality of food and beverage, the quality of internet provided in room and free internet in guest room are among the most important services in the last hotel stayed.
A hotel’s commitment to environmental issues can also affect how business travellers choose where to stay when travelling: Chinese, Indonesian and Thai respondents emerge as the most environmentally driven in the region.
Planning Of Business Travel
Amongst those willing to pay extra for a hotel with a superior environmental commitment, the average increased cost they are willing to bear is 10% (in total and across all markets).
5.3 Choosing The Hotel
21
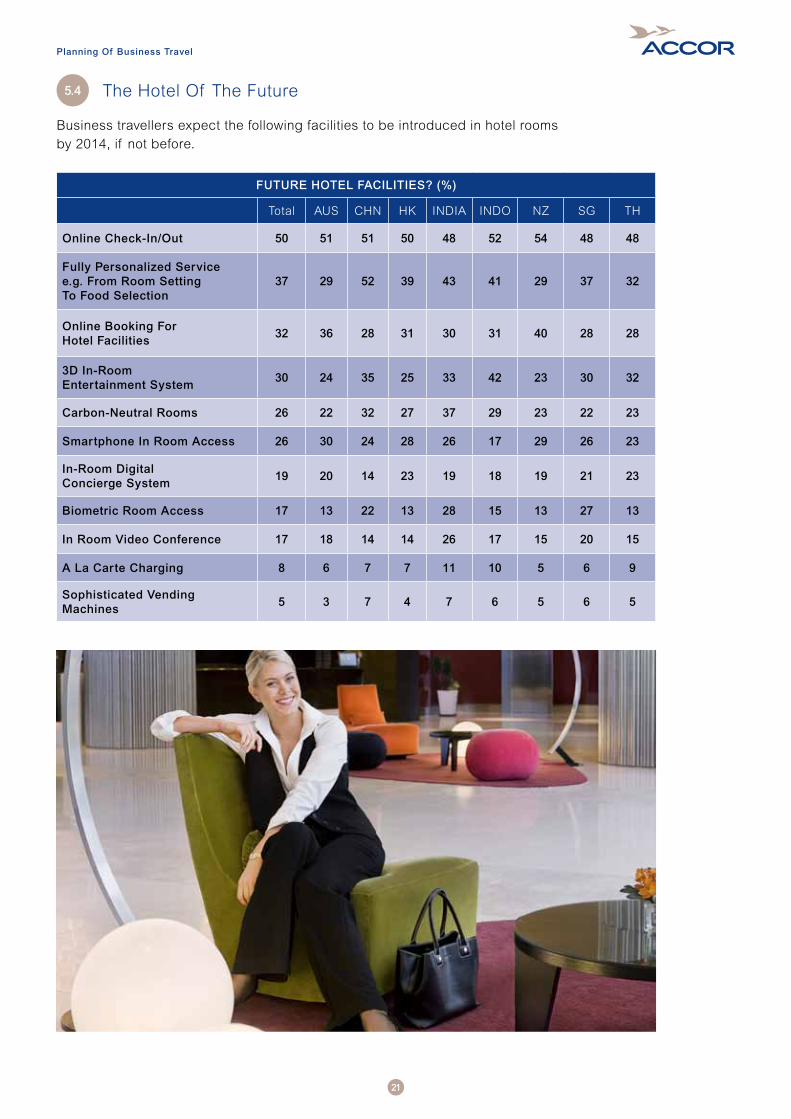
Business travellers expect the following facilities to be introduced in hotel rooms by 2014, if not before.
Planning Of Business Travel
5.4 The Hotel Of The Future
FUTURE HOTEL FACILITIES? (%)
Total AUS CHN HK INDIA INDO NZ SG TH
Online Check-In/Out 50 51 51 50 48 52 54 48 48
Fully Personalized Service e.g. From Room Setting To Food Selection
37 29 52 39 43 41 29 37 32
Online Booking For Hotel Facilities
32 36 28 31 30 31 40 28 28
3D In-Room Entertainment System
30 24 35 25 33 42 23 30 32
Carbon-Neutral Rooms 26 22 32 27 37 29 23 22 23
Smartphone In Room Access 26 30 24 28 26 17 29 26 23
In-Room Digital Concierge System
19 20 14 23 19 18 19 21 23
Biometric Room Access 17 13 22 13 28 15 13 27 13
In Room Video Conference 17 18 14 14 26 17 15 20 15
A La Carte Charging 8 6 7 7 11 10 5 6 9
Sophisticated Vending Machines
5 3 7 4 7 6 5 6 5
22
Asia Pacific Business Traveller Research 2011
Usage Of Hotel Facilities6
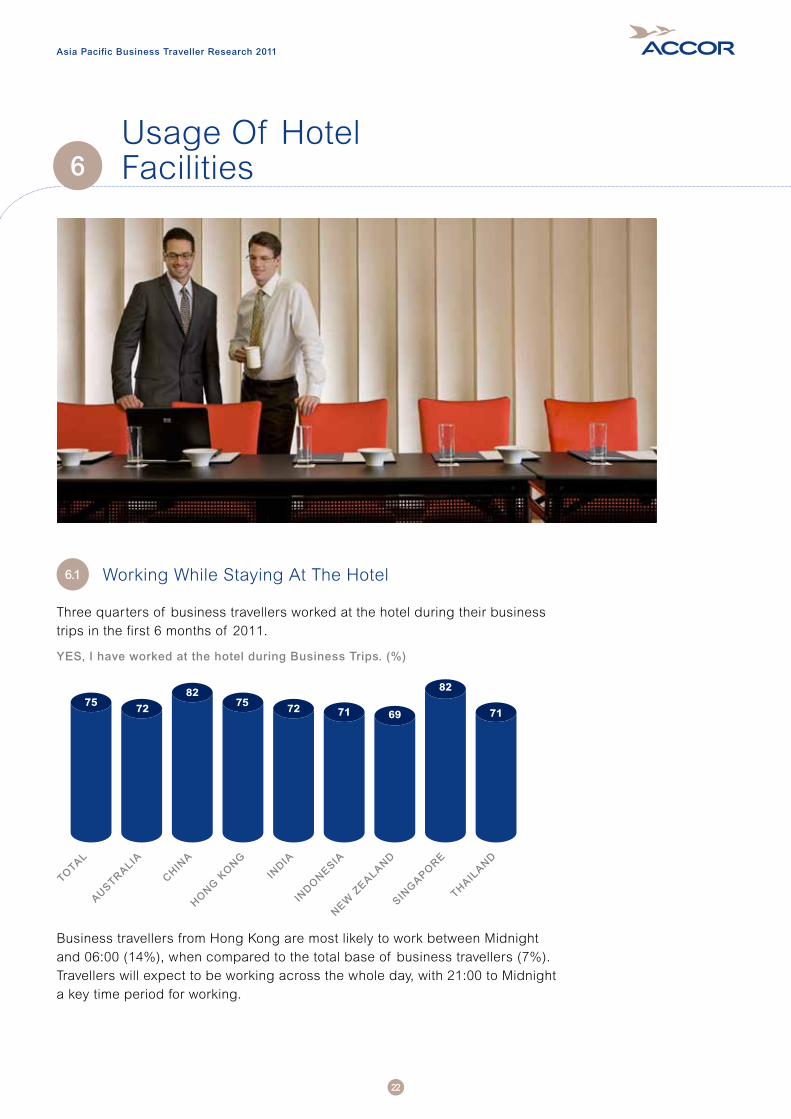
Three quarters of business travellers worked at the hotel during their business trips in the first 6 months of 2011.
Business travellers from Hong Kong are most likely to work between Midnight and 06:00 (14%), when compared to the total base of business travellers (7%). Travellers will expect to be working across the whole day, with 21:00 to Midnight a key time period for working.
6.1 Working While Staying At The Hotel
YES, I have worked at the hotel during Business Trips. (%)

23
The majority of business travellers prefer to work in their hotel room (97%), rather than working in the hotel Café (17%), Executive Lounge (15%) or Business Centre (14%).
DURING WHAT TIME PERIODS DO YOU WORK? (%)
COUNTRY OF RESIDENCE
Midnight - 06:00
06:00 - 09:00
09:00 - 18:00
18:00 - 21:00
21:00 - Midnight
TOTAL 7 23 21 35 52
AUSTRALIA 7 35 23 53 41
CHINA 6 9 21 27 63
HONG KONG SAR 14 22 21 24 66
INDIA 7 25 18 31 46
INDONESIA 5 15 18 31 48
NEW ZEALAND 5 38 23 55 38
SINGAPORE 7 19 16 27 60
THAILAND 8 19 24 32 58
Usage Of Hotel Facilities
Business travellers are more likely to use the hotel Fitness Centre (53%) than the Spa (36%). Compared to the total base, Indian business travellers are more likely to use both of these facilities and business travellers from China and Thailand are least likely to use the Spa.
6.2 Usage Of Recreational Facilities
24
Usage Of Hotel Facilities
When in the Fitness Centre, the majority are using cardio equipment (93%) rather than weights (39%). Compared to the total base, business travellers from Australia (48%) are more likely to use weights.
When in the Spa, business travellers from Singapore (83%), Hong Kong (74%), China (71%), India (70%) and Thailand (70%) are more likely to avail of body and foot massage services, while travellers from New Zealand (74%) and Australia (69%) are more likely to use the sauna/steam room.
FITNESS CENTRE AND SPA SERVICES USED (%)
COUNTRY OF RESIDENCE Weights
Cardio-vascular
Equipment
Beauty Treatments
Body/Foot Massage
Sauna/Steam room
TOTAL 39 93 12 66 62
AUSTRALIA 48 94 16 49 69
CHINA 30 93 10 71 58
HONG KONG SAR 35 93 15 74 63
INDIA 32 95 8 70 63
INDONESIA 33 93 6 81 59
NEW ZEALAND 41 98 17 42 74
SINGAPORE 43 94 11 83 51
THAILAND 43 90 13 70 58

25
Asia Pacific Business Traveller Research 2011

26