Asia Pacific Aviation · Asia Pacific Aviation Opportunities and Challenges Andrew Herdman,...
18
1 Asia Pacific Aviation Opportunities and Challenges Andrew Herdman, Director General 3 rd Annual Asia Pacific & Middle East Aviation Outlook Summit Singapore, 9-10 November 2006 Contents Asia Pacific airline industry AAPA carriers Chinese carriers Low-cost carriers Regulatory Framework US, EU perspectives Asia Pacific perspectives Market outlook Economic and tourism trends Traffic outlook
Transcript of Asia Pacific Aviation · Asia Pacific Aviation Opportunities and Challenges Andrew Herdman,...
1
Asia Pacific Aviation Opportunities and Challenges
Andrew Herdman, Director General3rd Annual Asia Pacific & Middle East Aviation Outlook Summit
Singapore, 9-10 November 2006
Contents Asia Pacific airline industry
AAPA carriers
Chinese carriers
Low-cost carriers
Regulatory Framework
US, EU perspectives
Asia Pacific perspectives
Market outlook
Economic and tourism trends
Traffic outlook
2
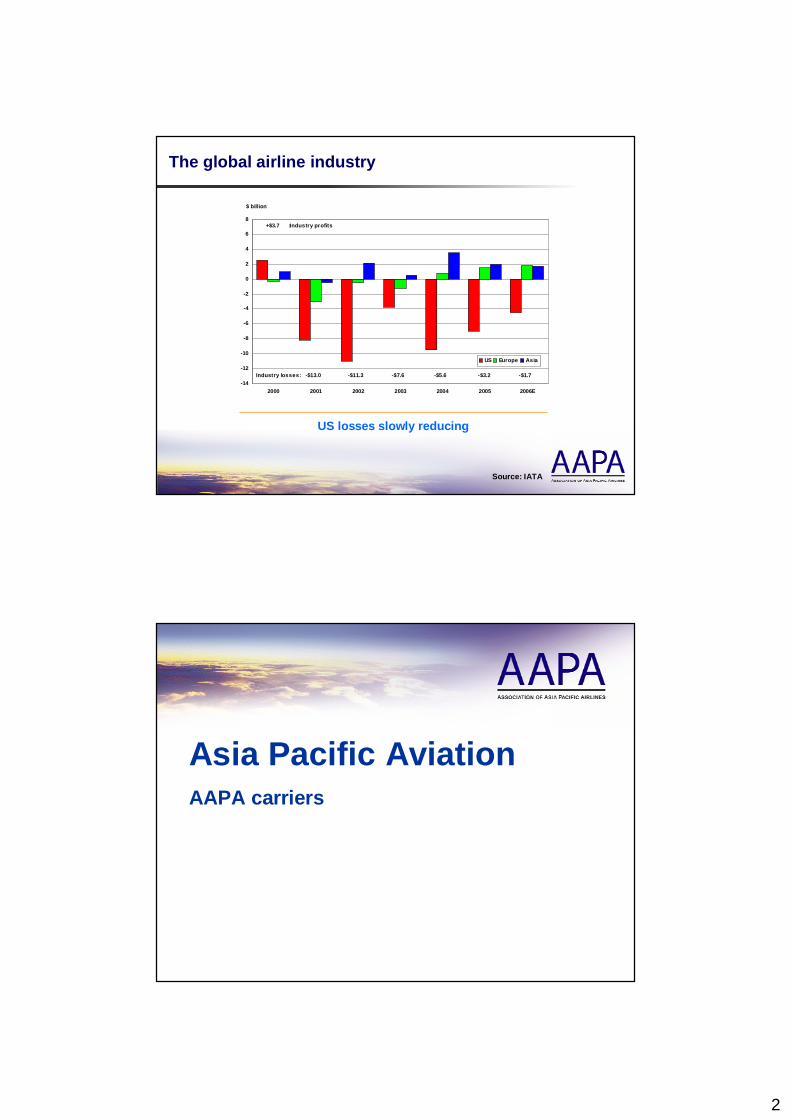
The global airline industry
Source: IATA
US losses slowly reducing
-14
-12
-10
-8
-6
-4
-2
0
2
4
6
8
2000 2001 2002 2003 2004 2005 2006E
US Europe Asia
$ billion
+$3.7 :Industry profits
Industry losses: -$13.0 -$11.3 -$7.6 -$5.6 -$3.2 -$1.7
Asia Pacific AviationAAPA carriers
3
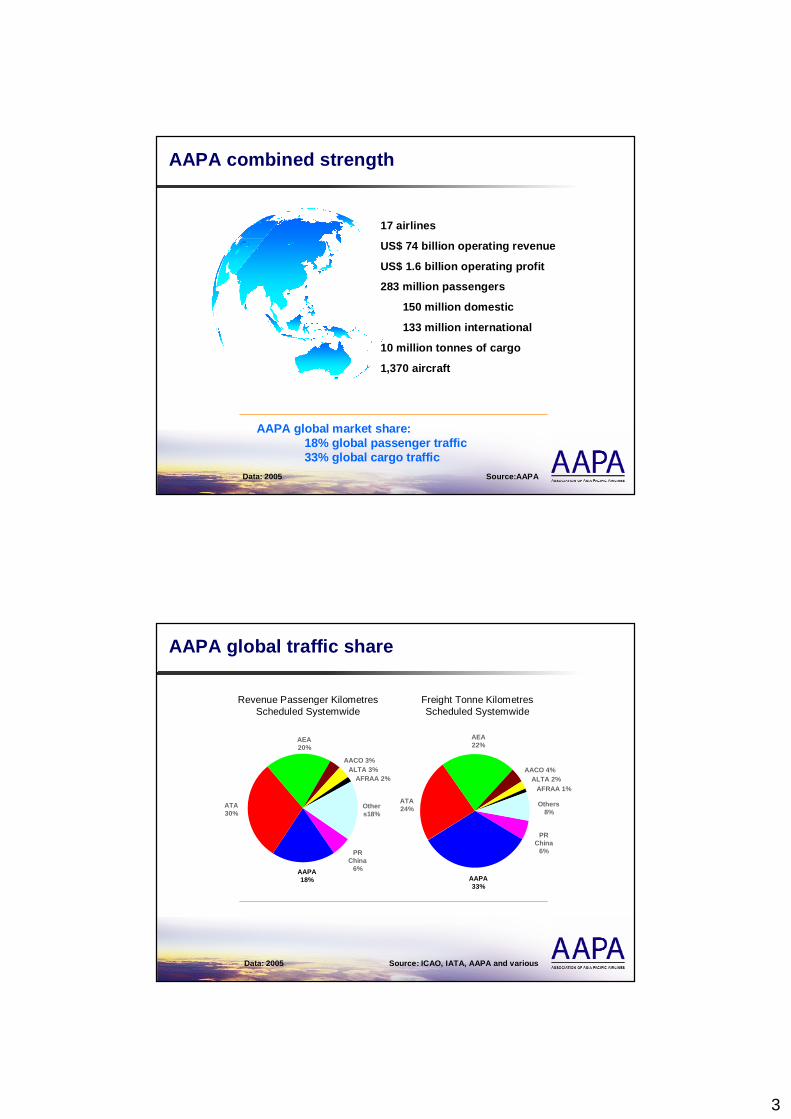
AAPA combined strength
17 airlines
US$ 74 billion operating revenue
US$ 1.6 billion operating profit
283 million passengers
150 million domestic
133 million international
10 million tonnes of cargo
1,370 aircraft
Data: 2005 Source:AAPA
AAPA global market share: 18% global passenger traffic 33% global cargo traffic
AAPA global traffic share
Data: 2005 Source: ICAO, IATA, AAPA and various
AFRAA 2%
AAPA 18%
ATA 30%
AEA 20%
AACO 3%ALTA 3%
Others18%
PR China
6%
Freight Tonne Kilometres Scheduled Systemwide
ATA 24%
AEA 22%
AACO 4%ALTA 2%
AFRAA 1%
Others 8%
PR China
6%
AAPA 33%
Revenue Passenger Kilometres Scheduled Systemwide
4
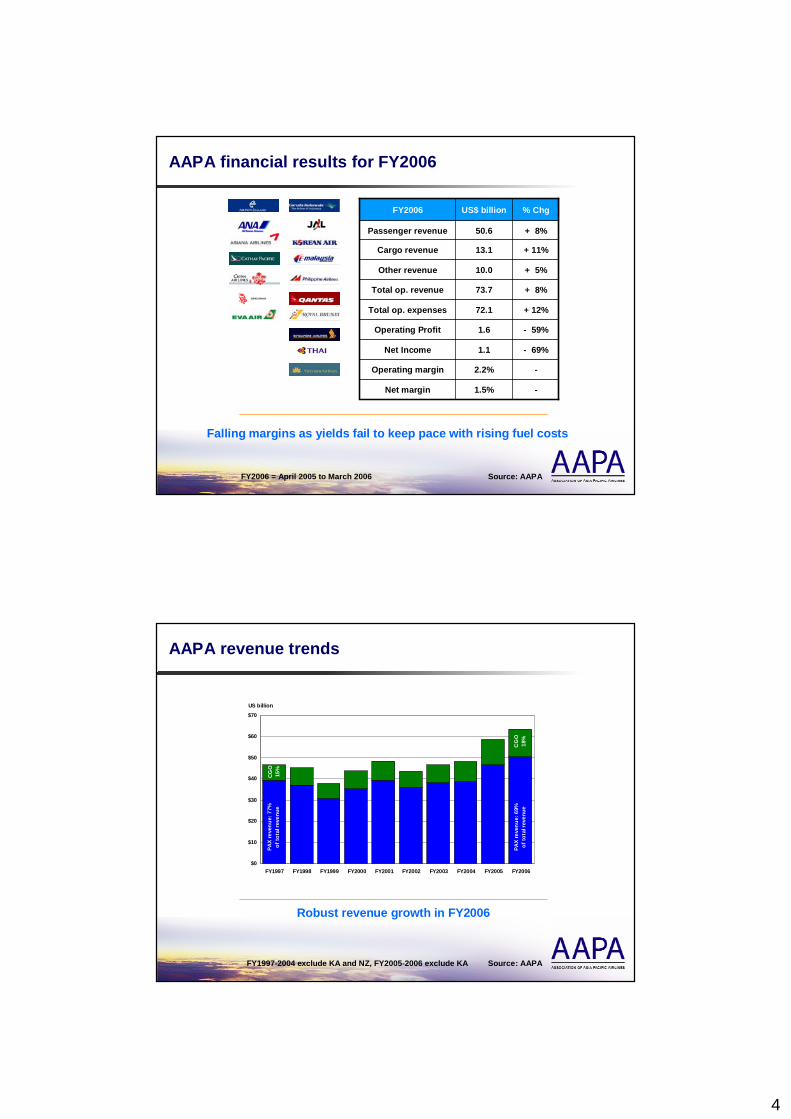
AAPA financial results for FY2006
FY2006 = April 2005 to March 2006 Source: AAPA
- 69%1.1Net Income
-2.2%Operating margin
+ 12%72.1Total op. expenses
-1.5%Net margin
- 59%1.6Operating Profit
+ 8%73.7Total op. revenue
+ 5%10.0Other revenue
+ 11%13.1Cargo revenue
+ 8%50.6Passenger revenue
% ChgUS$ billionFY2006
Falling margins as yields fail to keep pace with rising fuel costs
AAPA revenue trends
FY1997-2004 exclude KA and NZ, FY2005-2006 exclude KA Source: AAPA
Robust revenue growth in FY2006
$0
$10
$20
$30
$40
$50
$60
$70
FY1997 FY1998 FY1999 FY2000 FY2001 FY2002 FY2003 FY2004 FY2005 FY2006
US billion
CG
O
18%
PAX
reve
nue:
69%
of to
tal r
even
ue
PAX
reve
nue:
77%
of to
tal r
even
ue
CG
O
15%
5
AAPA revenue composition: international operations
FY1997-2004 exclude KA and NZ, FY2005-2006 exclude KA Source: AAPA
Diverse revenue mix
Premium20%
Economy51%
Cargo24%
Others5%
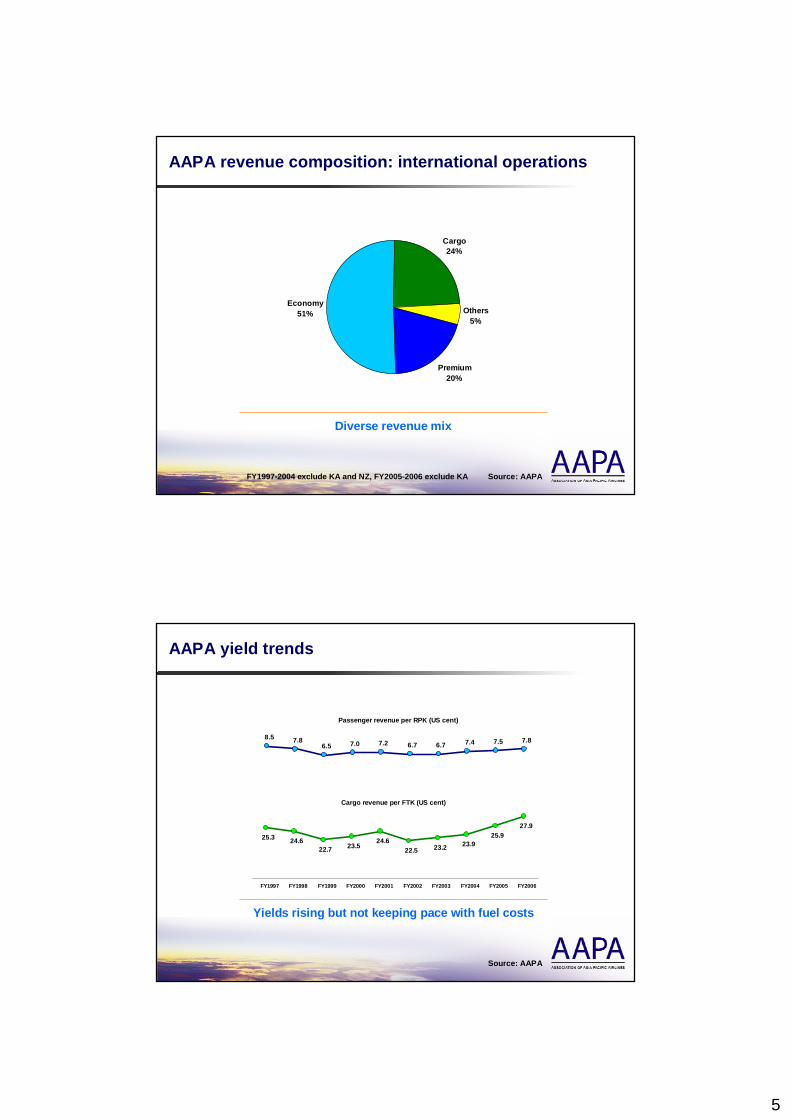
AAPA yield trends
Source: AAPA
Yields rising but not keeping pace with fuel costs
FY1997 FY1998 FY1999 FY2000 FY2001 FY2002 FY2003 FY2004 FY2005 FY2006
8.5 7.86.5 7.0 7.2 6.7 6.7 7.4 7.5 7.8
Passenger revenue per RPK (US cent)
25.3 24.622.7 23.5
24.622.5 23.2 23.9
25.927.9
Cargo revenue per FTK (US cent)
6
AAPA cost trends
FY1997-2004 exclude KA and NZ, FY2005-2006 exclude KA Source: AAPA
Fuel now accounts for 26% of total costs
0
10
20
30
40
50
60
70
80
FY1997 FY1998 FY1999 FY2000 FY2001 FY2002 FY2003 FY2004 FY2005 FY2006
US billion
Non
-fue
l cos
ts a
ccou
nted
for
74%
of t
otal
ope
ratin
g co
sts
Fuel
26
%
Fuel
15
%N
on-f
uel 8
5%
AAPA unit cost trends
Non-fuel costs well contained
FY1997-2004 exclude KA and NZ, FY2005-2006 exclude KA Source: AAPA
0
10
20
30
40
50
60
FY1997 FY1998 FY1999 FY2000 FY2001 FY2002 FY2003 FY2004 FY2005 FY2006
US censt per ATK
Non
-Fue
lFu
el
7
AAPA staff cost trends
Rising staff costs offset by productivity gains
FY1997-2004 exclude KA and NZ, FY2005-2006 exclude KA Source: AAPA
6.4 6.5 6.56.1
6.56.9 6.8 6.9
7.7
8.5
$0
$2
$4
$6
$8
$10
$12
$14
$16
$18
FY1997 FY1998 FY1999 FY2000 FY2001 FY2002 FY2003 FY2004 FY2005 FY20060
1
2
3
4
5
6
7
8
9
US billion Unit staff cost (US cents per ATK)
Staf
f cos
ts: 1
5% o
f to
tal o
pera
ting
cost
s
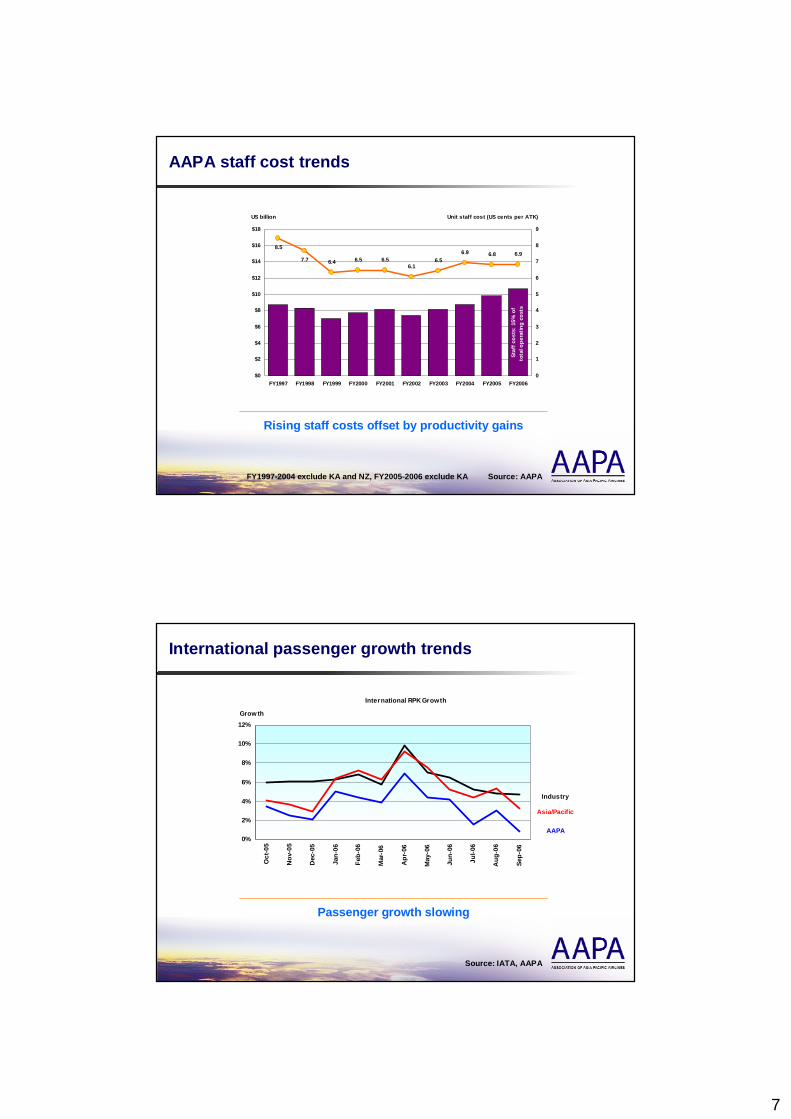
International passenger growth trends
Source: IATA, AAPA
Passenger growth slowing
International RPK Growth
0%
2%
4%
6%
8%
10%
12%
Oct
-05
Nov
-05
Dec
-05
Jan-
06
Feb-
06
Mar
-06
Apr
-06
May
-06
Jun-
06
Jul-0
6
Aug
-06
Sep-
06
Grow th
Industry
Asia/Pacific
AAPA
8
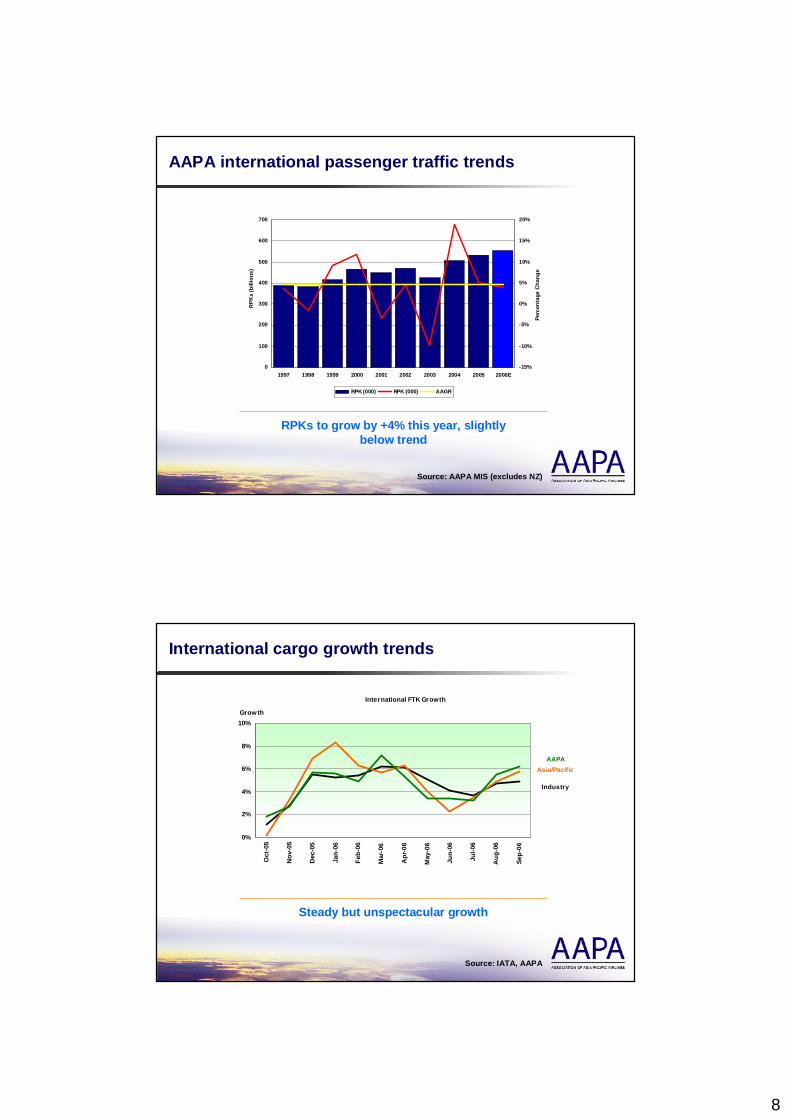
AAPA international passenger traffic trends
Source: AAPA MIS (excludes NZ)
RPKs to grow by +4% this year, slightly below trend
0
100
200
300
400
500
600
700
1997 1998 1999 2000 2001 2002 2003 2004 2005 2006E
RPK
s (b
illio
ns)
-15%
-10%
-5%
0%
5%
10%
15%
20%
Perc
enta
ge C
hang
e
RPK (000) RPK (000) AAGR
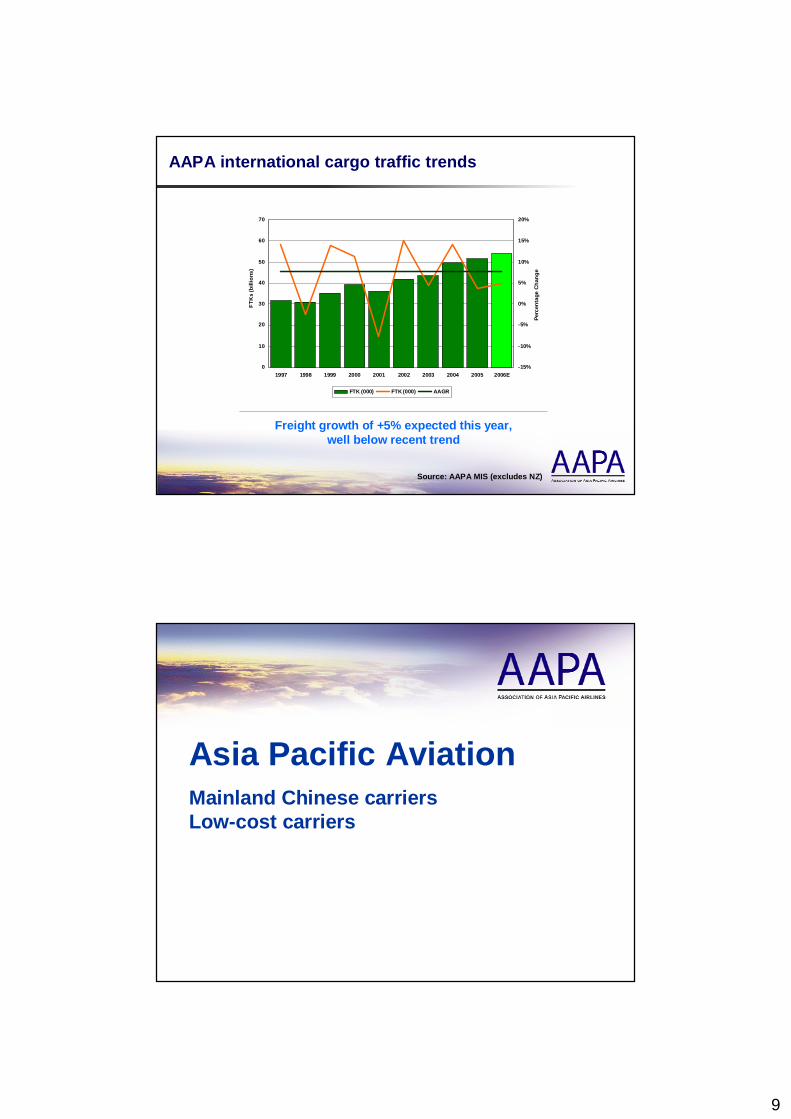
International cargo growth trends
Source: IATA, AAPA
Steady but unspectacular growth
International FTK Growth
0%
2%
4%
6%
8%
10%
Oct
-05
Nov
-05
Dec
-05
Jan-
06
Feb-
06
Mar
-06
Apr
-06
May
-06
Jun-
06
Jul-0
6
Aug
-06
Sep-
06
Grow th
Industry
Asia/PacificAAPA
9
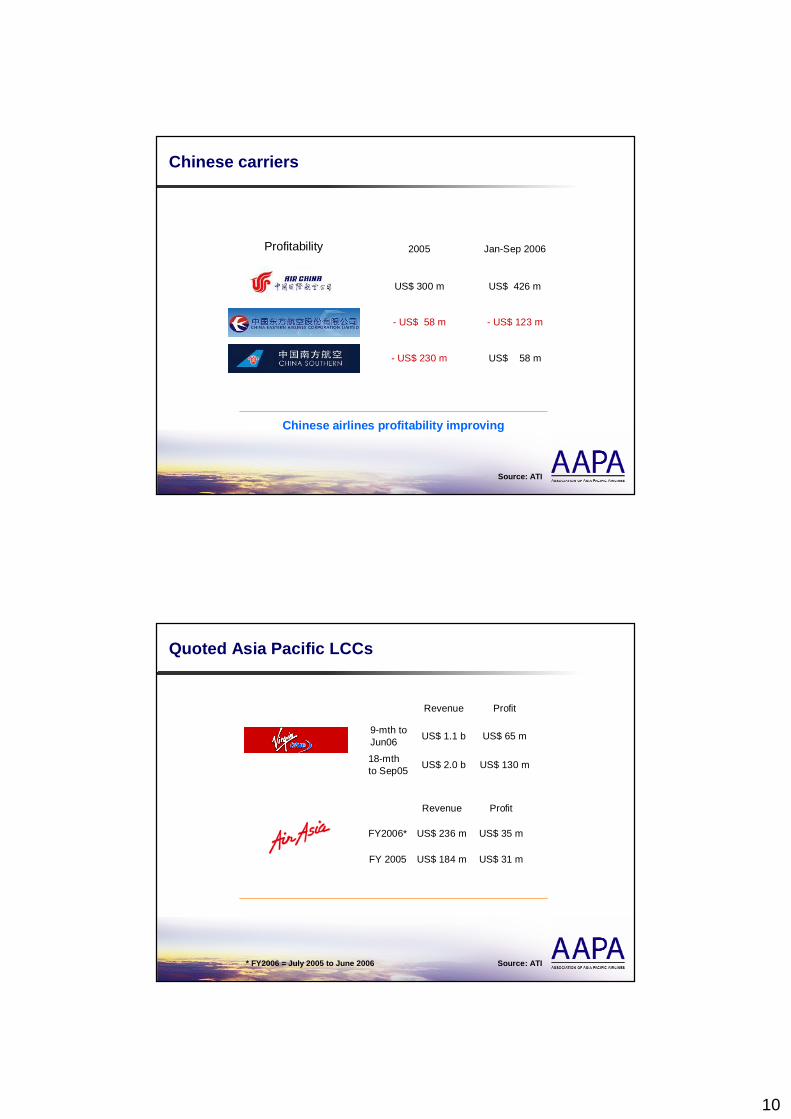
AAPA international cargo traffic trends
Freight growth of +5% expected this year, well below recent trend
Source: AAPA MIS (excludes NZ)
0
10
20
30
40
50
60
70
1997 1998 1999 2000 2001 2002 2003 2004 2005 2006E
FTK
s (b
illio
ns)
-15%
-10%
-5%
0%
5%
10%
15%
20%
Perc
enta
ge C
hang
e
FTK (000) FTK (000) AAGR
Asia Pacific AviationMainland Chinese carriers Low-cost carriers
10
Chinese carriers
Source: ATI
Chinese airlines profitability improving
US$ 58 m- US$ 230 m
- US$ 123 m- US$ 58 m
US$ 426 mUS$ 300 m
Jan-Sep 20062005Profitability
Quoted Asia Pacific LCCs
* FY2006 = July 2005 to June 2006 Source: ATI
18-mth to Sep05
9-mth to Jun06
US$ 130 mUS$ 2.0 b
US$ 65 mUS$ 1.1 b
ProfitRevenue
FY 2005
FY2006*
US$ 31 mUS$ 184 m
US$ 35 mUS$ 236 m
ProfitRevenue
11
Asia Pacific aviation – combined overview
AAPA + non-member airlines
US$ 110 billion operating revenue
US$ 2 billion operating profit
510 million passengers
340 million domestic
170 million international
13 million tonnes of cargo
3,270 aircraft
Global market share: 28% global passenger traffic 41% global cargo traffic
Data: 2005 estimates for combined AAPA + non-AAPA airlines GMT+5 to GMT+12
Impact of low-cost carriers by region
Source: OAG
Asia Pacific LCC penetration still only 9% but growing
Regional seats
010
20
30
4050
60
70
80
90
2001
2002
2003
2004
2005
2006
2001
2002
2003
2004
2005
2006
2001
2002
2003
2004
2005
2006
Domestic US Within Europe Within Asia Pacific
Seat
s/m
onth
(mill
ions
)
LCCs Network carriers Source: OAG
Domestic US Within Asia PacificWithin Europe
12
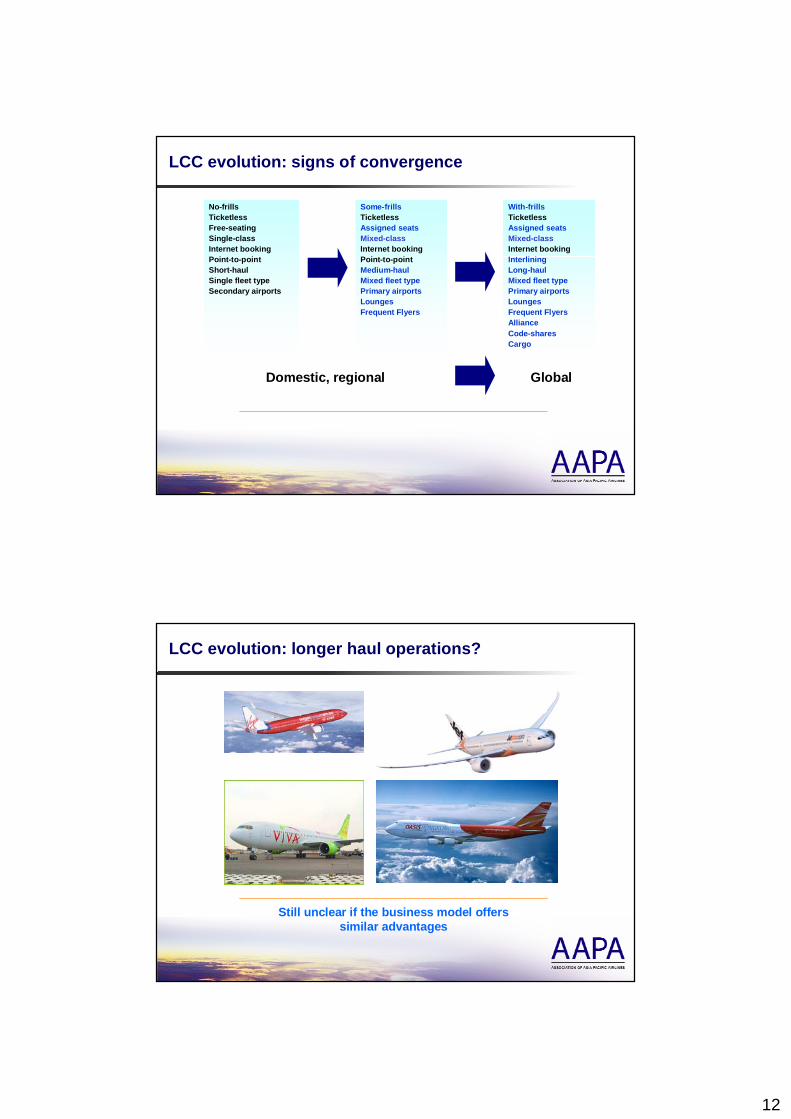
LCC evolution: signs of convergence
No-frillsTicketlessFree-seatingSingle-class Internet bookingPoint-to-pointShort-haulSingle fleet typeSecondary airports
With-frillsTicketlessAssigned seatsMixed-classInternet bookingInterliningLong-haulMixed fleet typePrimary airportsLoungesFrequent FlyersAlliance Code-sharesCargo
Some-frillsTicketlessAssigned seatsMixed-classInternet bookingPoint-to-pointMedium-haulMixed fleet typePrimary airportsLoungesFrequent Flyers
GlobalDomestic, regional
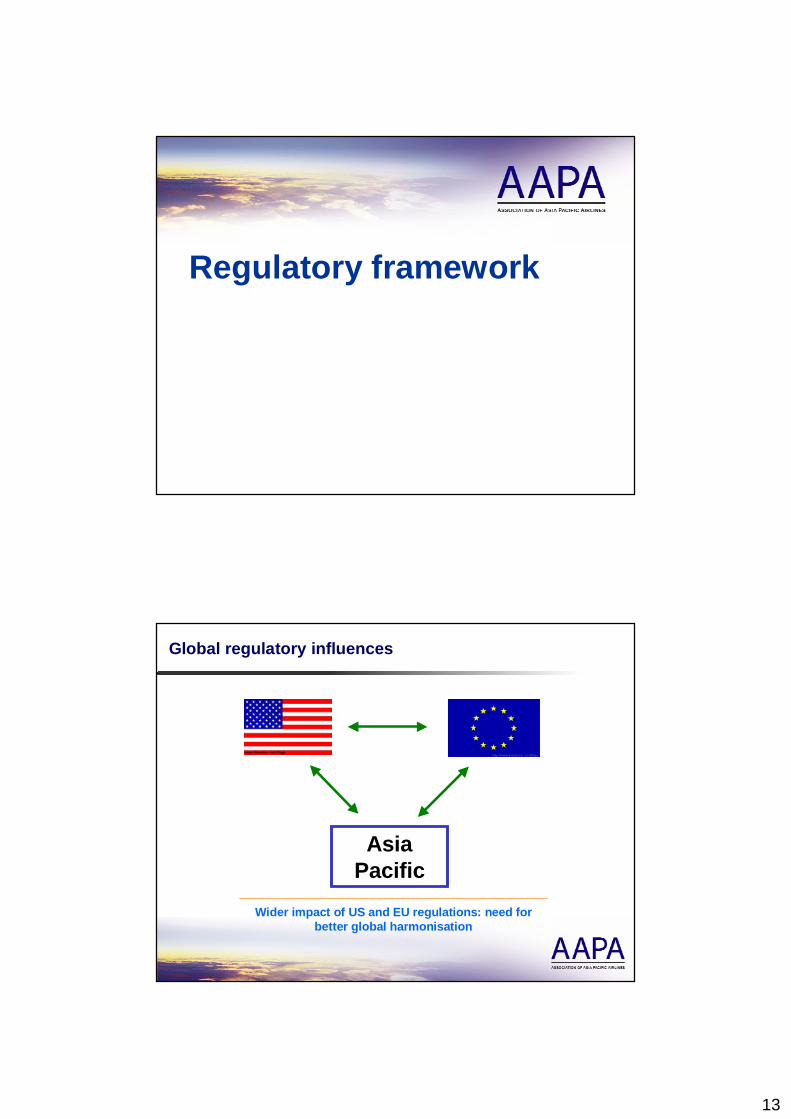
Still unclear if the business model offers similar advantages
LCC evolution: longer haul operations?
13
Regulatory framework
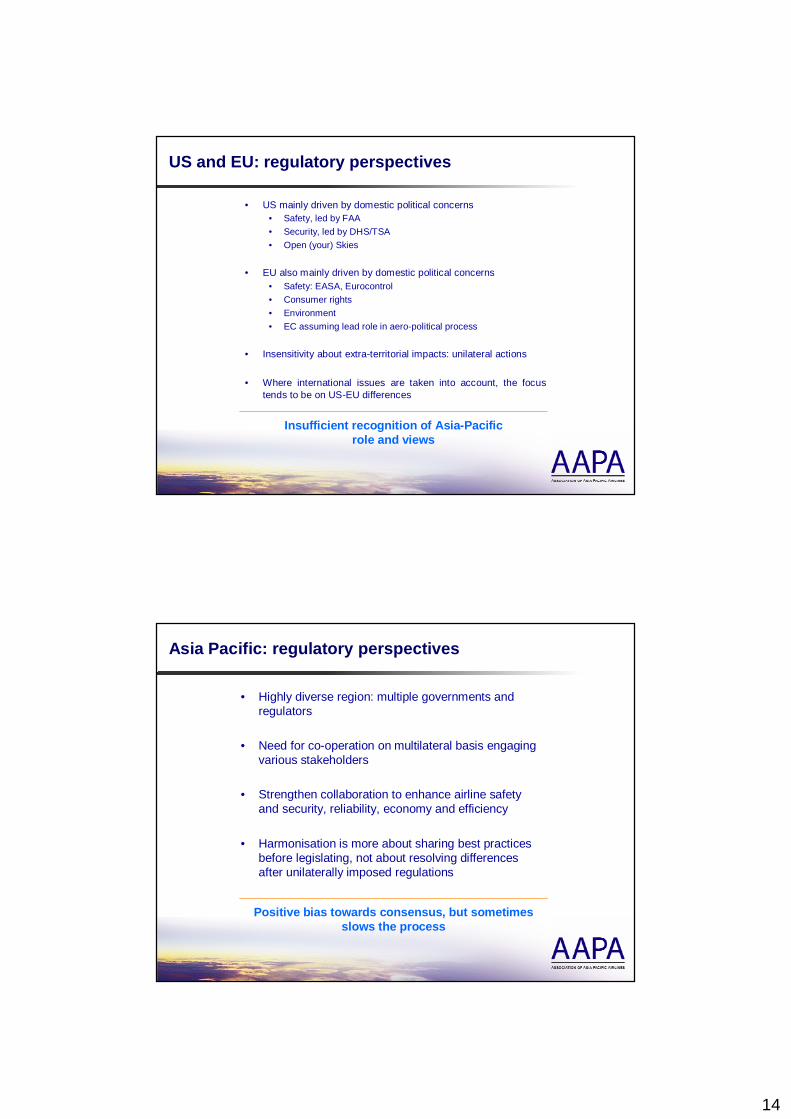
Wider impact of US and EU regulations: need for better global harmonisation
Global regulatory influences
Asia Pacific
14
Insufficient recognition of Asia-Pacific role and views
US and EU: regulatory perspectives
• US mainly driven by domestic political concerns• Safety, led by FAA• Security, led by DHS/TSA • Open (your) Skies
• EU also mainly driven by domestic political concerns• Safety: EASA, Eurocontrol • Consumer rights• Environment• EC assuming lead role in aero-political process
• Insensitivity about extra-territorial impacts: unilateral actions
• Where international issues are taken into account, the focus tends to be on US-EU differences
Positive bias towards consensus, but sometimes slows the process
Asia Pacific: regulatory perspectives
• Highly diverse region: multiple governments and regulators
• Need for co-operation on multilateral basis engaging various stakeholders
• Strengthen collaboration to enhance airline safety and security, reliability, economy and efficiency
• Harmonisation is more about sharing best practices before legislating, not about resolving differences after unilaterally imposed regulations
15
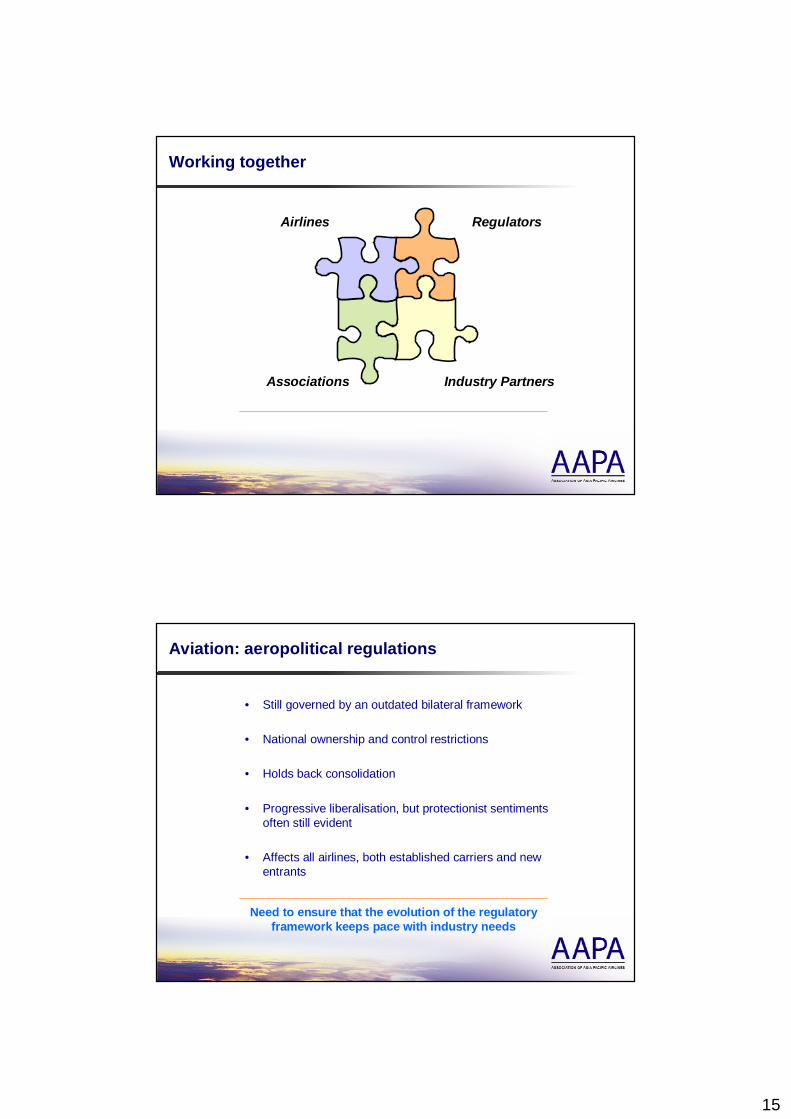
Working together
Industry Partners
Regulators Airlines
Associations
Need to ensure that the evolution of the regulatory framework keeps pace with industry needs
Aviation: aeropolitical regulations
• Still governed by an outdated bilateral framework
• National ownership and control restrictions
• Holds back consolidation
• Progressive liberalisation, but protectionist sentiments often still evident
• Affects all airlines, both established carriers and new entrants
16
Market outlook
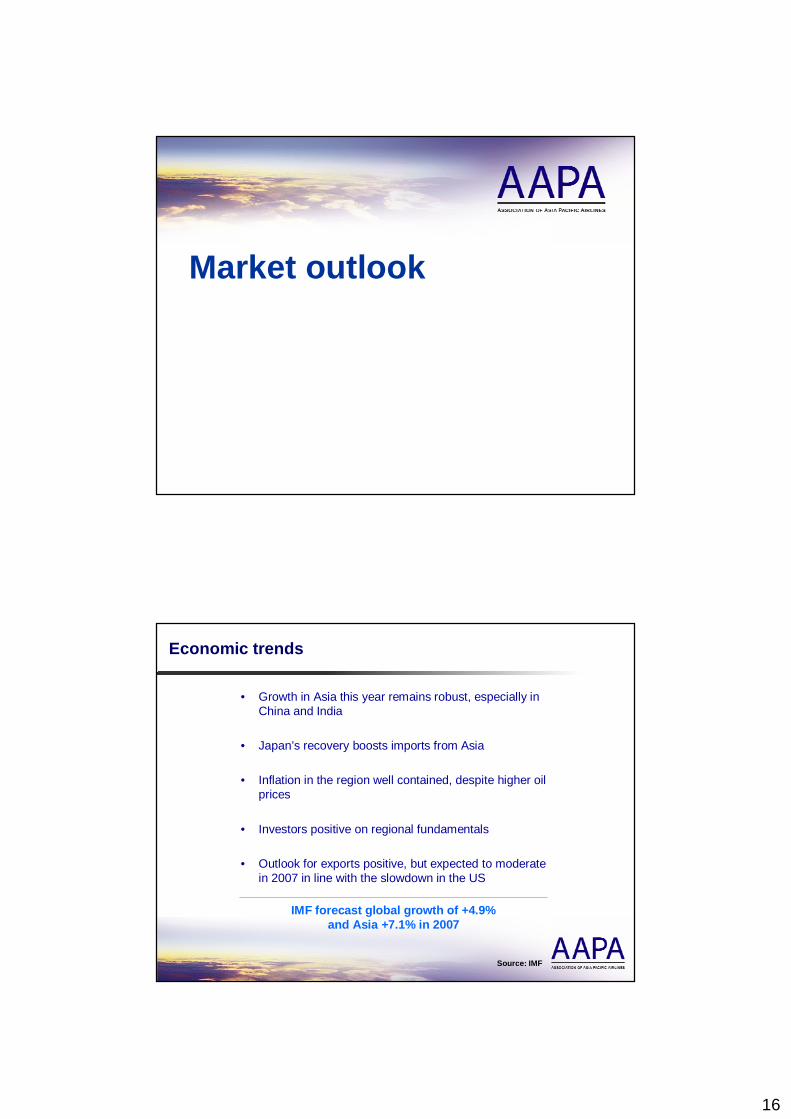
Economic trends
Source: IMF
IMF forecast global growth of +4.9% and Asia +7.1% in 2007
• Growth in Asia this year remains robust, especially in China and India
• Japan’s recovery boosts imports from Asia
• Inflation in the region well contained, despite higher oil prices
• Investors positive on regional fundamentals
• Outlook for exports positive, but expected to moderate in 2007 in line with the slowdown in the US
17
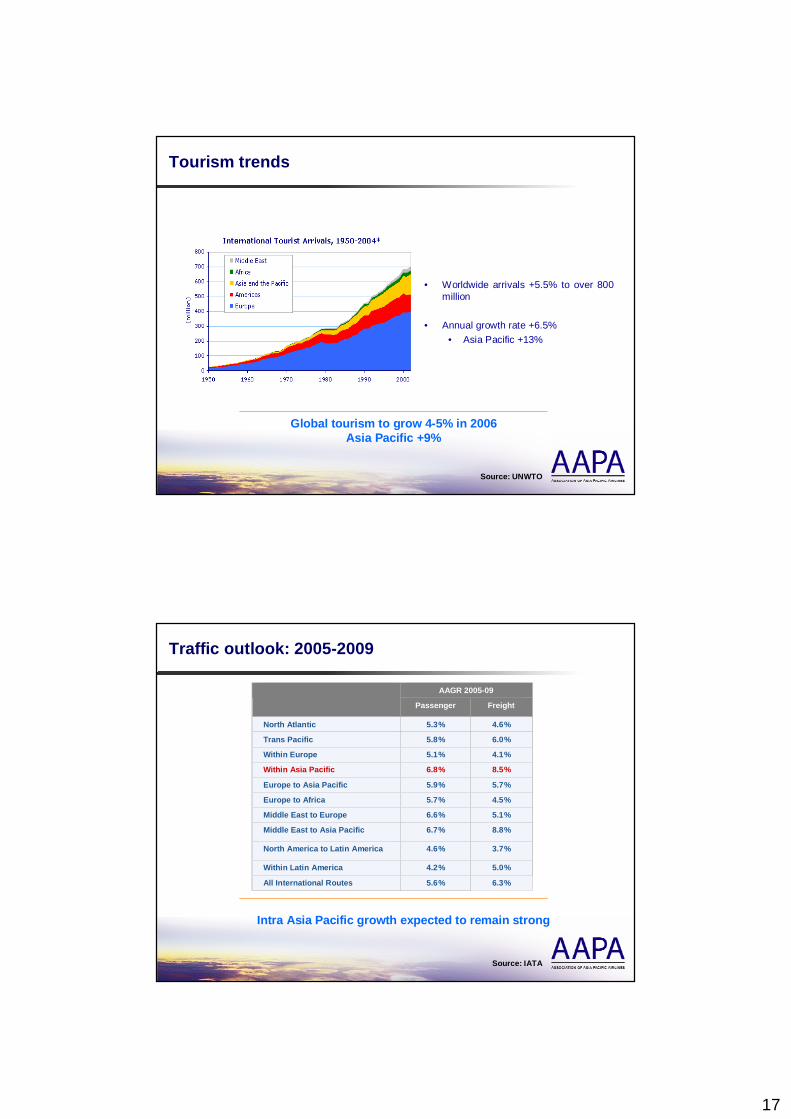
Tourism trends
Source: UNWTO
• Worldwide arrivals +5.5% to over 800 million
• Annual growth rate +6.5%• Asia Pacific +13%
Global tourism to grow 4-5% in 2006 Asia Pacific +9%
Traffic outlook: 2005-2009
Source: IATA
Intra Asia Pacific growth expected to remain strong
AAGR 2005-09
Passenger Freight
North Atlantic 5.3% 4.6%
Trans Pacific 5.8% 6.0%
Within Europe 5.1% 4.1%
Within Asia Pacific 6.8% 8.5%
Europe to Asia Pacific 5.9% 5.7%
Europe to Africa 5.7% 4.5%
Middle East to Europe 6.6% 5.1%
Middle East to Asia Pacific 6.7% 8.8%
North America to Latin America 4.6% 3.7%
Within Latin America 4.2% 5.0%
All International Routes 5.6% 6.3%
18
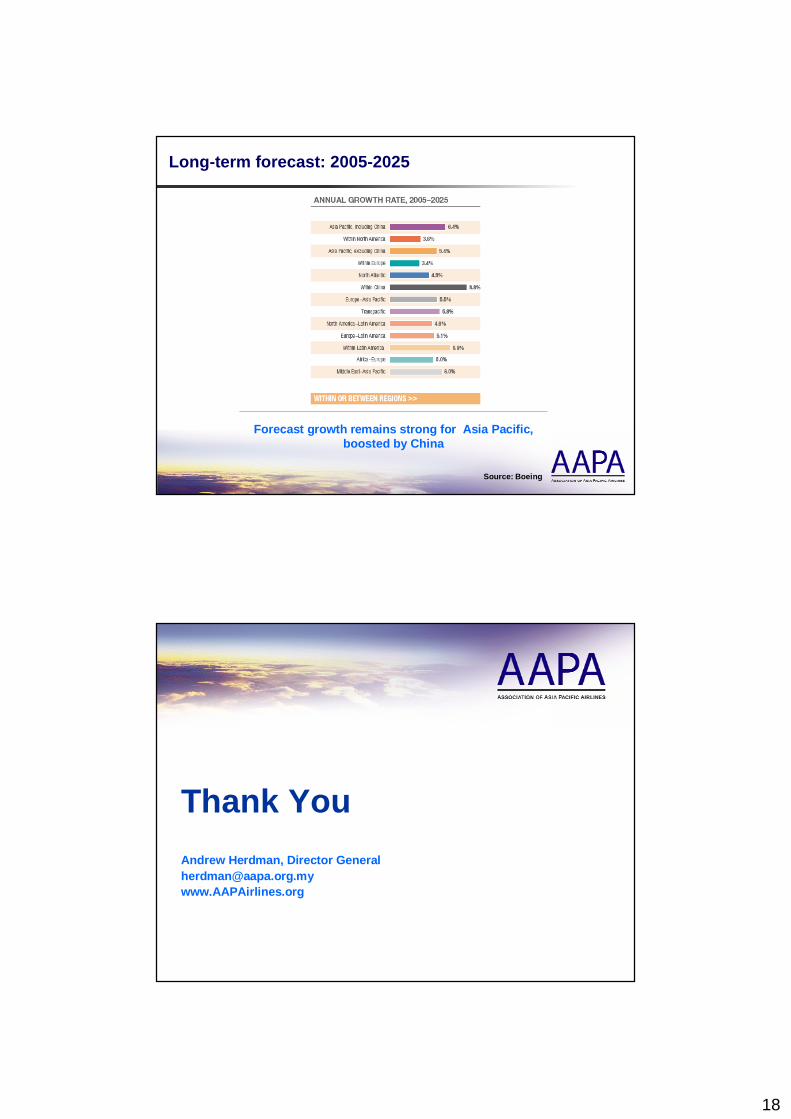
Long-term forecast: 2005-2025
Source: Boeing
Forecast growth remains strong for Asia Pacific, boosted by China
Thank YouAndrew Herdman, Director General [email protected] www.AAPAirlines.org