Asia Illicit Tobacco Indicator 2016:...
13
Asia Illicit Tobacco Indicator 2016: Vietnam Prepared by Oxford Economics October 2017
Transcript of Asia Illicit Tobacco Indicator 2016:...

Asia Illicit Tobacco Indicator 2016: VietnamPrepared by Oxford EconomicsOctober 2017

22
DisclaimerThe Asia Illicit Tobacco Indicator 2016 Report (the “Report”) on the illicit tobacco trade in selected Asian markets (including Australia and New Zealand) has been prepared by Oxford Economics (OE). OE enjoyed academic freedom and full editorial control of the Report. We are grateful for the inputs and data received from public sector and industry stakeholders.
OE prepared the Report in accordance with specific terms of reference agreed between Philip Morris International Management SA, an affiliate of Philip Morris International (PM), and OE. Financial support for the Report was provided by PM. OE assume all responsibility for the Report analysis, findings, and conclusion. The terms of reference under which OE were engaged by Philip Morris International Management SA are detailed in the Asia Illicit Tobacco Indicator 2016 Methodological Overview Report, available to download via the following link illicittobacco.oxfordeconomics.com

33 | Vietnam Market Summary
Vietnam Legal Domestic Sales are estimated at 78.7 billion cigarettes in 2016, up from 74.8 billion a year earlier. This is equivalent to a rise of 5.2%, and the first year-on-year increase on record in the five years for which the Asia Illicit Tobacco Indicator has been collecting data.1
The government-owned Vietnam National Tobacco Corporation (Vinataba) accounted for 44% of cigarettes sold in Vietnam in 2016, with BAT having 32% of the market, and Imperial Tobacco 7%.
The price of cigarettes (based on the Most Sold Brand) in Vietnam rose in 2016, underpinned by an increase in the Excise Tax.
Nevertheless, at USD 0.84, the nominal price of a pack of the Most Sold Brand of cigarettes remains relatively low. Compared with other markets included in the Asia Illicit Tobacco Indicator Report, only in Myanmar and Cambodia are cigarette prices lower than in Vietnam (USD 0.47 and 0.37 respectively).2
Vietnam: Legal Domestic Sales
Legal Domestic Sales:
78.7 bn cigarettes
Vietnam
Price:
VND 19,000 USD 0.84
1 An increase in Excise Taxes implemented in January 2016 led to substantial “trade loading” in 2015. This Report addresses these factors by providing adjusted estimates for Legal Domestic Sales in 2015 and 2016 to account for this loading behaviour. 2015 data have been refined in comparison with the figures presented in the Asia Illicit Tobacco Indicator 2015 Report.
2 Price per pack of 20 of the Most Sold Brand in December 2016, based on PM data. Vietnam data are based on the price of Craven A, the Most Sold Brand in 2015 for urban areas.

44
0
50
100
150
200
250
300
350
2016201520142013201220112010
25.5%
12.3%
198.2
248.8
321.6319.3284.4278.0
248.8
VND
per c
igar
ette
0
20
40
60
80
100
201620152014201320122011201020092008
Ciga
rette
s bn
VND per pack of 20 cigarettes
Cigarette sales bnVND per pack of 20 cigarettes 25,000
20,000
15,000
10,000
5,000
0
VND
tn
103.4 102.998.1
Ciga
rette
s bn
0
20
40
60
80
100
120
20162015201420132012
82.7 80.8
20.1 21.3
102.1
78.5
22.722.8
74.5
97.5
21.4
75.3
Non-Domestic Legal (NDL)
Illicit Consumption
Legal Domestic Consumption
0.6NDL
0.8NDL
0.9NDL0.8
NDL0.7NDL
Actual ExciseTax revenues
Estimated Excise Tax Loss
6
3
0
3
6
9
12
15
20162015201420132012
11.5 12.4 13.3
4.0
12.3
3.6
12.3
3.52.8 3.3
% o
f Tot
al C
onsu
mpt
ion
0
20
40
60
80
100
20162015201420132012
80.0 78.6
19.4 20.7 23.2 22.2
76.976.0
22.0
77.2
Non-Domestic Legal (NDL)
Illicit Consumption
Legal Domestic Consumption
0.6NDL
0.8NDL
0.8NDL
0.8NDL
0.8NDL
0
50
100
150
200
250
300
350
2016201520142013201220112010
25.5%
12.3%
198.2
248.8
321.6319.3284.4278.0
248.8
VND
per c
igar
ette
0
20
40
60
80
100
201620152014201320122011201020092008
Ciga
rette
s bn
VND per pack of 20 cigarettes
Cigarette sales bnVND per pack of 20 cigarettes 25,000
20,000
15,000
10,000
5,000
0
VND
tn
103.4 102.998.1
Ciga
rette
s bn
0
20
40
60
80
100
120
20162015201420132012
82.7 80.8
20.1 21.3
102.1
78.5
22.722.8
74.5
97.5
21.4
75.3
Non-Domestic Legal (NDL)
Illicit Consumption
Legal Domestic Consumption
0.6NDL
0.8NDL
0.9NDL0.8
NDL0.7NDL
Actual ExciseTax revenues
Estimated Excise Tax Loss
6
3
0
3
6
9
12
15
20162015201420132012
11.5 12.4 13.3
4.0
12.3
3.6
12.3
3.52.8 3.3
% o
f Tot
al C
onsu
mpt
ion
0
20
40
60
80
100
20162015201420132012
80.0 78.6
19.4 20.7 23.2 22.2
76.976.0
22.0
77.2
Non-Domestic Legal (NDL)
Illicit Consumption
Legal Domestic Consumption
0.6NDL
0.8NDL
0.8NDL
0.8NDL
0.8NDL
Source: Oxford Economics based on PM data 3 Rate applied in December of each year to Craven A (the Most Sold Brand in 2015 for urban areas), including Earmarked Tax. The increases in the Excise Tax in 2011 and 2013 were both driven by an increase in retail prices implemented (due to the ad valorem Excise Tax structure, which did not change).
Source: Oxford Economics based on PM data 4Price of Craven A in December of each year (the Most Sold Brand in 2015 for urban areas).
Vietnam: Tobacco tax applied to cigarettes3
Vietnam: Legal Domestic Sales and prices4
Vietnam Market Summary |

55
Vietnam: Cigarette Consumption
Source: Oxford Economics1 The Empty Pack Surveys were undertaken in 2016 Q1 and 2016 Q4. 2014 results based on the average of the 2013 Q4 and 2015 Q4 Empty Pack Surveys (see Report methodology for more details).
2 Note that estimated Outflows of duty-paid cigarettes are based only on identified Inflows in the other markets covered in this Report and may therefore be an underestimate.
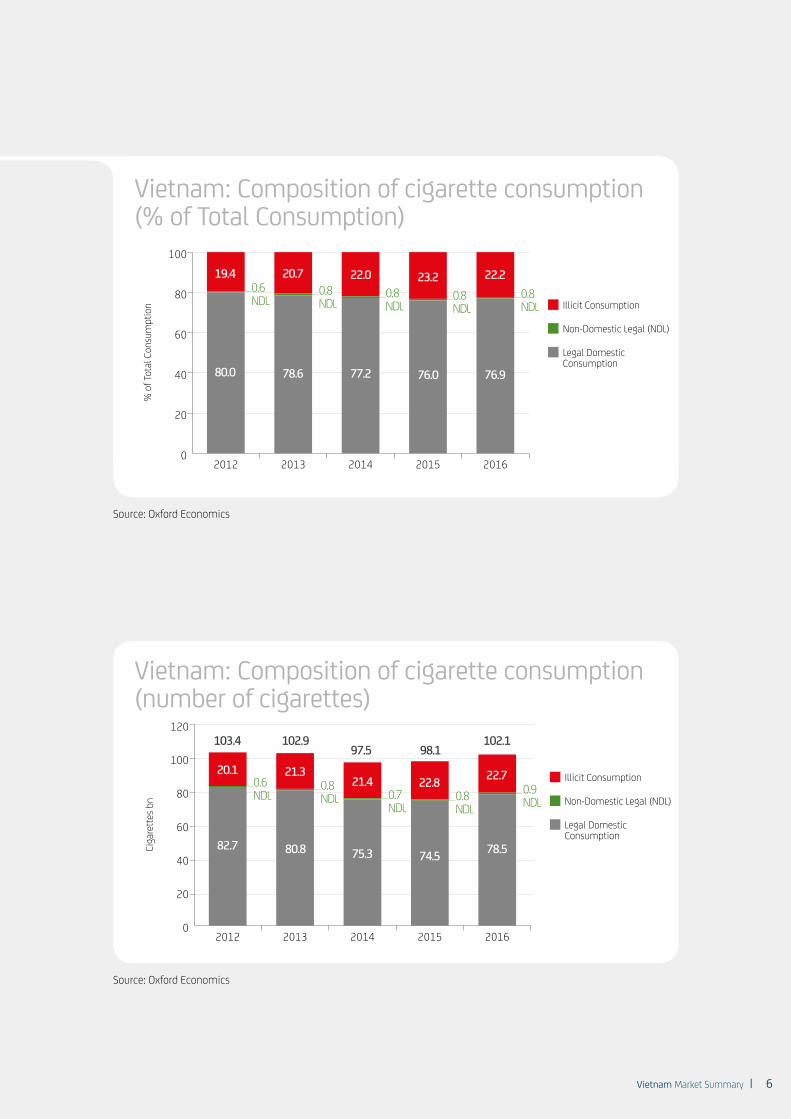
Vietnam: Composition of cigarette consumption
The results from two Empty Pack Surveys1 were combined with IMS data on Legal Domestic Sales to estimate Total Consumption of cigarettes in Vietnam.
Total Consumption (legal and illicit) is estimated at 102.1 billion cigarettes in 2016, 4.1% higher than in 2015. This represents the first increase in Total Consumption in the five years for which the Asia Illicit Tobacco Indicator has been recording consumption in Vietnam.
This increase was underpinned by Legal Domestic Consumption, which rose by 4.0 billion cigarettes in 2016 (5.4%).
These developments mark a change in the pattern of cigarette consumption in Vietnam relative to the earlier years in the Asia Illicit Tobacco Indicator. From 2012-2015, Legal Domestic Sales, and hence Legal Domestic Consumption (given the very modest volume of Outflows),2 fell by just over 8 billion cigarettes. However, in 2016 the trend has reversed, with a 3.9 billion increase in Legal Domestic Sales.
Non-Domestic Illicit Consumption remained relatively high and stable in comparison, falling by a modest 0.1 billion cigarettes, equivalent to a -0.5% growth rate from 2015. Non-Domestic Legal consumption registered a 0.1 billion increase in volumes.
Legal Domestic Consumption now accounts for just short of 77% of Total Consumption, up 1pp in comparison with 2015, with total Non-Domestic incidence declining from 24% to 23% over the same period.
Illicit Incidence fell to 22.2%, down 1pp from 2015, but remains higher than was estimated in the first three years of the Asia Illicit Tobacco Indicator in 2012-2014.
With nearly one in every four cigarettes consumed in Vietnam of illicit origin, the government has implemented various pieces of legislation in recent years in an attempt to combat the issue. These include Directive 124/ND-CP, implemented in May 2016, which reduced the threshold of punishment and doubled penalties for smuggling activities. Furthermore, in September 2014, the government approved Directive 30/CT-TTg on strengthening measures to combat smuggling, including the destruction of confiscated smuggled cigarettes (which were previously exported). However, this directive is set to be rescinded in favour of a pilot program of auctioning “high quality” seizures for sale in Vietnam or re-export.
2012 2013 2014 2015 2016 % change
2015-16 Cigarettes bn % Cigarettes
bn % Cigarettes bn % Cigarettes
bn % Cigarettes bn %
Legal Domestic Consumption (LDC) 82.7 80.0 80.8 78.6 75.3 77.2 74.5 76.0 78.5 76.9 5.4
Legal Domestic Sales (LDS) 82.8 – 81.0 – 75.5 – 74.8 – 78.7 – 5.2
Outflows of domestic duty-paid cigarettes -0.1 – -0.2 – -0.2 – -0.3 – -0.1 – -45.6
Total Non-Domestic Inflows (ND) 20.7 20.0 22.0 21.4 22.2 22.8 23.6 24.0 23.5 23.1 -0.1
Non-Domestic Legal (NDL) 0.6 0.6 0.8 0.8 0.7 0.8 0.8 0.8 0.9 0.8 10.9
Non-Domestic Illicit 20.1 19.4 21.3 20.7 21.4 22.0 22.8 23.2 22.7 22.2 -0.5
Domestic Illicit 0.0 0.0 0.0 0.0 0.0 0.0 0.0 0.0 0.0 0.0 n/a
Total Consumption 103.4 100.0 102.9 100.0 97.5 100.0 98.1 100.0 102.1 100.0 4.1
Total Illicit Consumption 20.1 19.4 21.3 20.7 21.4 22.0 22.8 23.2 22.7 22.2 -0.5
| Vietnam Market Summary
66
Source: Oxford Economics
Source: Oxford Economics
Vietnam: Composition of cigarette consumption(% of Total Consumption)
Vietnam: Composition of cigarette consumption(number of cigarettes)
0
50
100
150
200
250
300
350
2016201520142013201220112010
25.5%
12.3%
198.2
248.8
321.6319.3284.4278.0
248.8
VND
per c
igar
ette
0
20
40
60
80
100
201620152014201320122011201020092008Ci
gare
ttes b
nVND per pack of 20 cigarettes
Cigarette sales bnVND per pack of 20 cigarettes 25,000
20,000
15,000
10,000
5,000
0
VND
tn
103.4 102.998.1
Ciga
rette
s bn
0
20
40
60
80
100
120
20162015201420132012
82.7 80.8
20.1 21.3
102.1
78.5
22.722.8
74.5
97.5
21.4
75.3
Non-Domestic Legal (NDL)
Illicit Consumption
Legal Domestic Consumption
0.6NDL
0.8NDL
0.9NDL0.8
NDL0.7NDL
Actual ExciseTax revenues
Estimated Excise Tax Loss
6
3
0
3
6
9
12
15
20162015201420132012
11.5 12.4 13.3
4.0
12.3
3.6
12.3
3.52.8 3.3
% o
f Tot
al C
onsu
mpt
ion
0
20
40
60
80
100
20162015201420132012
80.0 78.6
19.4 20.7 23.2 22.2
76.976.0
22.0
77.2
Non-Domestic Legal (NDL)
Illicit Consumption
Legal Domestic Consumption
0.6NDL
0.8NDL
0.8NDL
0.8NDL
0.8NDL
0
50
100
150
200
250
300
350
2016201520142013201220112010
25.5%
12.3%
198.2
248.8
321.6319.3284.4278.0
248.8
VND
per c
igar
ette
0
20
40
60
80
100
201620152014201320122011201020092008
Ciga
rette
s bn
VND per pack of 20 cigarettes
Cigarette sales bnVND per pack of 20 cigarettes 25,000
20,000
15,000
10,000
5,000
0
VND
tn
103.4 102.998.1
Ciga
rette
s bn
0
20
40
60
80
100
120
20162015201420132012
82.7 80.8
20.1 21.3
102.1
78.5
22.722.8
74.5
97.5
21.4
75.3
Non-Domestic Legal (NDL)
Illicit Consumption
Legal Domestic Consumption
0.6NDL
0.8NDL
0.9NDL0.8
NDL0.7NDL
Actual ExciseTax revenues
Estimated Excise Tax Loss
6
3
0
3
6
9
12
15
20162015201420132012
11.5 12.4 13.3
4.0
12.3
3.6
12.3
3.52.8 3.3
% o
f Tot
al C
onsu
mpt
ion
0
20
40
60
80
100
20162015201420132012
80.0 78.6
19.4 20.7 23.2 22.2
76.976.0
22.0
77.2
Non-Domestic Legal (NDL)
Illicit Consumption
Legal Domestic Consumption
0.6NDL
0.8NDL
0.8NDL
0.8NDL
0.8NDL
Vietnam Market Summary |

77
Vietnam: Government Finances
Vietnam’s Excise Tax on cigarettes takes the form of an ad valorem tax, which was raised from 65% to 70% on 1 January 2016, and will be increased further to 75% on 1 January 2019. This relates to the factory price in the case of domestic cigarettes and the import value when applied to imported cigarettes.
Furthermore, a health surcharge of 1.5% of the net ex-factory price is applied, earmarked for the Fund for the Prevention and Fight against Harmful Effects of Tobacco. The health surcharge was increased from 1% in May 2016.
Imported cigarettes are subject to a Most Favoured Nation tariff rate of 135% of the import cost.
VAT is also imposed at a rate of 10%.
Effective from January 2016, cigarette prices were subject to Minimum Retail Price regulation (i.e. based on the net ex-factory price, including Excise Tax and health surcharge, but excluding VAT) of VND 4,390 per pack (hard packs) and VND 3,860 per pack (soft packs). The Minimum Retail Price regulation, which we last raised in March 2012, saw minimum prices increase from VND 4,050 per pack and VND 3,450 per pack, respectively.
The increase in the Excise Tax rate underpinned a 7.8% increase in estimated government revenues from Excise Taxes on cigarettes in 2016 (in local currency terms).
However, the higher Excise Tax rate also led to an increase in our estimate for the Tax Loss from Illicit Consumption of cigarettes, which rose by 10.6% in 2016, even though the volume of Illicit Consumption fell by 0.5%.
We estimate the Tax Loss rose from VND 4.5 trillion (USD 206 million) in 2015 to VND 4.9 trillion (USD 225 million) in 2016. The estimated Excise Tax Loss relative to total potential government revenues rose for the fourth consecutive period, from 22.4% to 23.1%.
Source: Oxford Economics based on Vietnam Tobacco Association estimates and PM dataIncludes Earmarked TaxesActual revenue from excise duties on tobacco estimated based on unadjusted Legal Domestic Sales data2014 estimates of Illicit Consumption based on the average of the 2013 Q4 and 2015 Q4 Empty Pack Surveys (see Report methodology for more details). The estimated Tax Loss presented in this Report probably underestimates the true level of Tax Loss in Vietnam, as the large majority of illicit cigarettes consumed fall into the high price market segment.
Vietnam: Actual government revenues and estimated Tax Loss
2012 2013 2014 2015 2016 % change in local
currency2015-2016
VND tn
USD mn
VND tn
USD mn
VND tn
USD mn
VND tn
USD mn
VND tn
USD mn
Actual revenue from excise duties on tobacco 11.5 551 12.4 594 12.3 580 12.3 567 13.3 602 7.8%
Estimated number of illicit cigarettes purchased (cigarettes bn)
20.1 21.3 21.4 22.8 22.7 -0.5%
Estimated Tax Loss from Illicit Consumption 3.5 169 4.1 196 4.4 207 4.5 206 4.9 225 10.6%
Lost excise revenue 2.8 134 3.3 156 3.5 165 3.6 164 4.0 181 11.7%
Lost VAT revenue 0.7 35 0.8 40 0.9 42 0.9 42 1.0 44 6.4%
Excise Tax Loss as % of potential total Excise Tax revenues
19.6% 20.8% 22.1% 22.4% 23.1%
| Vietnam Market Summary

88
Source: Oxford Economics based on Vietnam Tobacco Association estimates and PM data
0
50
100
150
200
250
300
350
2016201520142013201220112010
25.5%
12.3%
198.2
248.8
321.6319.3284.4278.0
248.8
VND
per c
igar
ette
0
20
40
60
80
100
201620152014201320122011201020092008
Ciga
rette
s bn
VND per pack of 20 cigarettes
Cigarette sales bnVND per pack of 20 cigarettes 25,000
20,000
15,000
10,000
5,000
0VN
D tn
103.4 102.998.1
Ciga
rette
s bn
0
20
40
60
80
100
120
20162015201420132012
82.7 80.8
20.1 21.3
102.1
78.5
22.722.8
74.5
97.5
21.4
75.3
Non-Domestic Legal (NDL)
Illicit Consumption
Legal Domestic Consumption
0.6NDL
0.8NDL
0.9NDL0.8
NDL0.7NDL
Actual ExciseTax revenues
Estimated Excise Tax Loss
6
3
0
3
6
9
12
15
20162015201420132012
11.5 12.4 13.3
4.0
12.3
3.6
12.3
3.52.8 3.3
% o
f Tot
al C
onsu
mpt
ion
0
20
40
60
80
100
20162015201420132012
80.0 78.6
19.4 20.7 23.2 22.2
76.976.0
22.0
77.2
Non-Domestic Legal (NDL)
Illicit Consumption
Legal Domestic Consumption
0.6NDL
0.8NDL
0.8NDL
0.8NDL
0.8NDL
Vietnam: Actual government revenues and estimated Excise Tax Loss
Vietnam Market Summary |

99
Non-Domestic Illicit Inflows in Vietnam are primarily designated as Unspecified Market Variant.1 In total, around 20.2 billion cigarettes were unidentifiable by market of intended final retail sale. Among them, “Jet” and “Hero” were the primary Unspecified Market Variant brands identified, accounting for 95.7% of total volumes in 2016. This represents approximately 85% of total illicit Inflows. The Inflow of Duty-Free cigarettes is estimated to have fallen back sharply in 2016, to 2.0 billion from 2.3 billion. However, around half of this decline was offset by an increase of 174 million in the number of cigarettes intended for final retail sale in Cambodia. The Empty Pack Surveys identified no Counterfeit cigarettes in the sample for 2016. Outflows of domestic duty-paid cigarettes to the other markets covered in this Report are estimated at 149 million in 2016, representing a decline of almost half versus 2015.2 Around one-third of all Duty-Free labelled products were estimated to arrive through legal channels. In total, the share of Non-Domestic Legal in Total Consumption was 0.8% in 2016.3 The long border with Cambodia and Laos, combined with difficult terrain make enforcement difficult in Vietnam, with anecdotal evidence suggesting smuggling is prevalent in border provinces in the North, Southwest, and Central regions.
Vietnam: Trade Flows
Cambodia475 mn(+57.7%)
Other42 mn(-28.6%)
Total22,684 mn
(-0.5%)
Source: IT Flows Model and Oxford Economics2014 estimates of Illicit Consumption based on the average of the 2013 Q4 and 2015 Q4 Empty Pack Surveys (see Report methodology for more details). 1 Unspecified Market Variant refers to cigarette packs that do not bear specific market labelling or Duty-Free labelling. As such the intended market is not known.
2 Note that estimated Outflows of duty-paid cigarettes are based only on identified Inflows in the other markets covered in this Report and may therefore be an underestimate.
3 Estimated using passenger data, Smoking Prevalence in tourists’ country/market of origin, and the passenger duty-free personal import allowance limit.
Vietnam: Origin of total Non-Domestic Illicit Inflows4
Unspecified 20,162 mn
(+0.1%)
Duty-Free labelled products
2,004 mn(-13.2%)
Cigarettes mn 2012 2013 2014 2015 2016Cambodia 193 299 292 301 475Duty-Free labelled products 570 601 1,407 2,309 2,004Other 62 112 81 59 42Unspecified 19,278 20,241 19,644 20,133 20,162Counterfeit – 17 8 0 –Total 20,103 21,270 21,432 22,802 22,684
| Vietnam Market Summary

1010
Vietnam: Consumption breakdown 2015
Source: IT Flows Model and Oxford Economics
Cigarettes bn
Cigarettes bn
Legal Domestic
Sales78.7
Legal Domestic
Consumption78.5
Total 102.1
20.2Unspecified
Outflows of duty-paid 0.1
Duty-Free labelled
products0.9
0
2.0
0
0
20
20
40
40
60
60
80
80
100
100
120
120
Illicit Inflows
Non-Domestic Legal Inflows
Cambodia 0.50
0.04Other 0
Vietnam Market Summary |

1111
Vietnam: Other Estimates
Source Comment
Comparing consumption estimates with LDC ("bottom up" approach)
Using data on average annual cigarette consumption per adult (age 15 and above), plus UN population data, a “bottom up” estimate of cigarette consumption can be made which can then be compared with LDC. This approach yields an estimate for the Illicit Incidence of 18.6%, or around 15.8 billion cigarettes (based on 2014 LDC). The source for annual cigarette consumption per adult is Euromonitor, 2014 (available viawww.tobaccoatlas.org).
Vietnam Tobacco Association The Vietnam Tobacco Association estimates an Illicit Incidence of 18.2% in 2014 (15.5 billion cigarettes based on 2014 Legal Domestic Sales).
Vietnam Tobacco Association The Vietnam Tobacco Association estimates losses to the state budget of USD 450 million in 2016, around twice as high as Asia Illicit Tobacco Indicator.
Euromonitor Passport, 2017 Euromonitor estimated an Illicit Incidence of 17.1% in 2016. The methodology, sampling, and coverage are unknown, so it is difficult to assess the robustness of this estimate.
Nielsen Retail Audit PM analysis of retail audit data suggests an Illicit Incidence of 20.9% in 2015.
Vietnam: Alternative estimates of Illicit Consumption
0
5
10
15
20
25
30
35
40%
“Bottom up” consumption(2009)
Oxford Economics(2015)
0.6
35.7
0
5
10
15
20
25%
Vietnam Tobacco
Association(2014)
“Bottom up” consumption
(2014)
Nielsen Retail Audit (2015)
Euromonitor (2016)
OxfordEconomics
(2016)
22.220.9
17.1 18.6 18.2
0
3
6
9
12
15%
“Bottom up”consumption
(2014)
Euromonitor(2016)
OxfordEconomics
(2016)
12.0
5.63.7
0
1
2
3
4
5%
“Bottom up”consumption (2014)
Euromonitor(2015)
Oxford Economics(2015)
1.9
3.4
4.7
0
3
6
9
12
15%
“Bottom up”consumption (2014)
Euromonitor (2016)
Oxford Economics (2016)
13.111.0
5.1
0
5
10
15
20
25
30
35
40%
“Bottom up”consumption (2013)
Nielsen(2014)
Euromonitor(2015)
Oxford Economics2015
31.3
20.6
38.8
23.7
2.2
0
2
4
6
8
10
12%
Ahsan et al.(2013)
Gadjah MadaUniversity
(2014)
Euromonitor(2015)
OxfordEconomics
(2015)
11.8
8.2 8.0
11.7
2.2
0.0
0.5
1.0
1.5
2.0
2.5%
Euromonitor (2016)Oxford Economics (2016)
2.3
0.9
| Vietnam Market Summary
1212
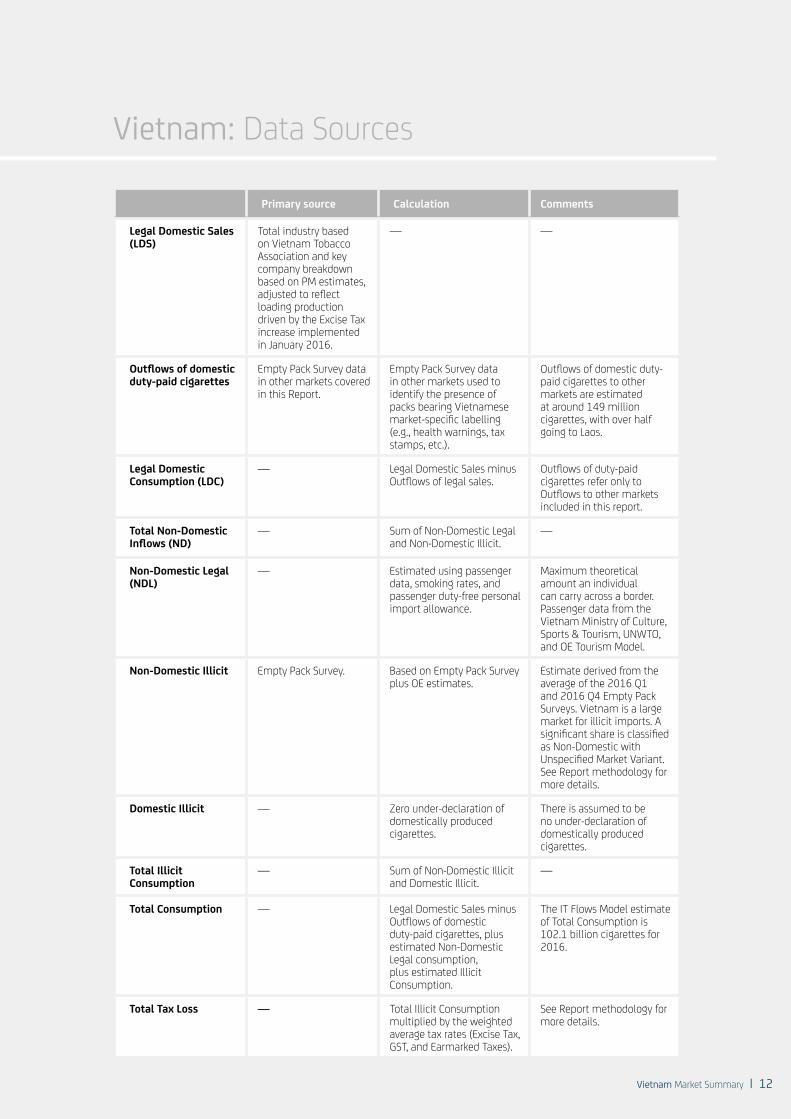
Vietnam: Data Sources
Primary source Calculation Comments
Legal Domestic Sales (LDS)
Total industry based on Vietnam Tobacco Association and key company breakdown based on PM estimates, adjusted to reflect loading production driven by the Excise Tax increase implemented in January 2016.
— —
Outflows of domestic duty-paid cigarettes
Empty Pack Survey data in other markets covered in this Report.
Empty Pack Survey data in other markets used to identify the presence of packs bearing Vietnamese market-specific labelling (e.g., health warnings, tax stamps, etc.).
Outflows of domestic duty-paid cigarettes to other markets are estimated at around 149 million cigarettes, with over half going to Laos.
Legal Domestic Consumption (LDC)
— Legal Domestic Sales minus Outflows of legal sales.
Outflows of duty-paid cigarettes refer only to Outflows to other markets included in this report.
Total Non-Domestic Inflows (ND)
— Sum of Non-Domestic Legal and Non-Domestic Illicit.
—
Non-Domestic Legal (NDL)
— Estimated using passenger data, smoking rates, and passenger duty-free personal import allowance.
Maximum theoretical amount an individual can carry across a border. Passenger data from the Vietnam Ministry of Culture, Sports & Tourism, UNWTO, and OE Tourism Model.
Non-Domestic Illicit Empty Pack Survey. Based on Empty Pack Survey plus OE estimates.
Estimate derived from the average of the 2016 Q1 and 2016 Q4 Empty Pack Surveys. Vietnam is a large market for illicit imports. A significant share is classified as Non-Domestic with Unspecified Market Variant. See Report methodology for more details.
Domestic Illicit — Zero under-declaration of domestically produced cigarettes.
There is assumed to be no under-declaration of domestically produced cigarettes.
Total Illicit Consumption
— Sum of Non-Domestic Illicit and Domestic Illicit.
—
Total Consumption — Legal Domestic Sales minus Outflows of domestic duty-paid cigarettes, plus estimated Non-Domestic Legal consumption, plus estimated Illicit Consumption.
The IT Flows Model estimate of Total Consumption is 102.1 billion cigarettes for 2016.
Total Tax Loss — Total Illicit Consumption multiplied by the weighted average tax rates (Excise Tax, GST, and Earmarked Taxes).
See Report methodology for more details.
Vietnam Market Summary |

1313
OXFORD ECONOMICS(HEADQUARTERS)Abbey House, 121 St Aldates Oxford, OX1 1HB, UK Email: [email protected]: +44 1865 268900
LONDON Broadwall House, 21 Broadwall London, SE1 9PL, UK
NEW YORK 5 Hanover Square, 19th FloorNew York, NY 10004, USA
SINGAPORE6 Battery Road#38-05Singapore 049909
illicittobacco.oxfordeconomics.com
www.oxfordeconomics.com