Ashley Zachariah · improve liquid yields. As an extension of the coke suppression studies, the...
130
Low Temperature Pyrolysis and its Application in Bitumen Processing by Ashley Zachariah A thesis submitted in partial fulfillment of the requirements for the degree of Master of Science In Chemical Engineering Department of Chemical and Materials Engineering University of Alberta © Ashley Zachariah, 2014
-
Upload
duongxuyen -
Category
Documents
-
view
217 -
download
0
Transcript of Ashley Zachariah · improve liquid yields. As an extension of the coke suppression studies, the...

Low Temperature Pyrolysis and its Application in Bitumen
Processing
by
Ashley Zachariah
A thesis submitted in partial fulfillment of the requirements for the degree of
Master of Science
In
Chemical Engineering
Department of Chemical and Materials Engineering University of Alberta
© Ashley Zachariah, 2014
ii
Abstract
Observations in literature date back to 1926 to suggest that bitumen should not be
treated like a residuum but more like a young crude oil. This is because of its high
reactivity at low temperatures. Taking these observations into consideration,
lower temperatures (400 °C and lower) were used to improve pyrolysis product
quality (particularly liquid viscosity). A major problem in visbreaking is the
formation of coke. The effect of specific solvent properties on coke suppression
during mild pyrolysis was investigated. It was noticed that coke suppression was
based on the overall availability of transferable hydrogen and methyl-groups
present in the system, not just donor hydrogen by solvents. In light of these results
it was suggested to co-feed light hydrocarbons to help in coke suppression and
improve liquid yields. As an extension of the coke suppression studies, the
influence of reaction time was investigated. Various regimes were seen when neat
bitumen was pyrolysed that affected product quality. A complex relationship was
observed between bitumen viscosity and the asphaltene fraction with at least one
local maxima and one local minimum being observed. Two orders of magnitude
decrease in viscosity was seen when bitumen was heated for 30 minutes at 400
°C. This was not accompanied by a change in the asphaltenes content. Based on
this, it was argued that asphaltenes fraction could donate its hydrogen and methyl
groups, and, in a solvent deasphalting-visbreaking sequence, the most meaningful
difference in the product quality is observed when the reaction time given was
equal to the induction period of coke formation of the feed.
Keywords: Thermal cracking, H-donor, coke suppression, viscosity.
iii
Preface
(Mandatory due to collaborative work)
Chapter-3 in this thesis has been published as “Zachariah, A.; Wang, L.; Yang,
S.; Prasad, V.; De Klerk, A. Suppression of coke formation during bitumen
pyrolysis. Energy Fuels 2013, 27, 3061-3070.” A colleague of our research
group Lin Wang was responsible for collecting semi-batch reactor data Figure
3-5 and Table 3-5 specifically. I was responsible for all other data collection
and manuscript composition. Dr. Arno de Klerk was the supervisory author and
was involved with concept formulation and manuscript composition.
iv
Acknowledgements
I would like to thank Dr. Arno de Klerk for his support, patience, and for
providing me with many opportunities throughout my graduate studies.
Allowing me to apply my own ideas while consulting with him has made me a
better engineer than what I was two years ago. I also want to thank Dr. Vinay
Prasad for his constant advice throughout my graduate studies.
I would also like to thank Andree Koenig and Dr. Shaofeng Yang for all the
experimental help. Andree’s zucchini bread definitely made the long and bitterly
cold Edmonton winters a little sweeter. I am grateful to Dr. Sean Sanders and
Dr. Suzanne Kresta for their comments, ideas and suggestions.
Special thanks to all my research group members and friends especially Blake
Olson and Orest Shardt for their suggestions. It turns out a lot of my engineering
problems were solved over lots of Tim Horton’s coffee. I would like to
acknowledge the funding provided by the Canadian Government through the
Helmholtz-Alberta Initiative (HAI).
Finally, I want to thank my mother and father for preventing me from bailing on
my MSc when things got tough and I got whiney!

v
Table of Contents
Chapter - 1 Introduction ...................................................................................... 1
1.1 Background ................................................................................................... 1
1.2 Objective ....................................................................................................... 3
1.3 Scope of work ............................................................................................... 3
Chapter - 2 Literature Review ............................................................................. 7
2.1 Introduction ................................................................................................... 7
2.2 Bitumen Characterization ............................................................................. 7
2.2.1 Asphaltenes ............................................................................................ 9
2.2.2 Viscosity............................................................................................... 10
2.2.3 Hydrogen/ Carbon (H/C) Ratio............................................................ 12
2.3 Thermal Cracking ....................................................................................... 14
2.3.1 Mechanism of Coke formation ............................................................ 16
2.3.2 Effect of Solvents on coking ................................................................ 18
2.4 Technologies employed in bitumen processing .......................................... 20
2.4.1 Visbreaking .......................................................................................... 20
2.4.2 Coking .................................................................................................. 22
2.4.3 Residue Hydroconversion .................................................................... 23
2.5 Low temperature Pyrolysis ......................................................................... 24
Chapter - 3 Suppression of coke formation during bitumen pyrolysis .......... 30
3.1 Introduction ................................................................................................. 31
3.2 Experimental ............................................................................................... 33
3.2.1 Materials............................................................................................... 33
3.2.2 Equipment and Procedure .................................................................... 34
3.2.3 Analyses ............................................................................................... 36
3.3 Results and Discussion ............................................................................... 36
3.3.1 Pyrolysis of diluted bitumen ................................................................ 36
3.3.2 Effect of solvent dilution on coke yield ............................................... 40
3.3.3 Effect of solvent dilution on pyrolysis ................................................. 42
3.3.4 Role of light gases in bitumen pyrolysis .............................................. 45

vi
3.3.5 Relationship of viscosity to coke yield ................................................ 50
3.3.6 Explaining coke suppression in terms of the Wiehe-model................. 51
3.3.7 Phase behaviour ................................................................................... 54
3.3.8 Hydrogen availability and implications for industrial operation ......... 55
3.4. Conclusions ................................................................................................ 58
Chapter - 4 Solvent Deasphalting and Visbreaking Sequence........................ 64
4.1 Introduction ................................................................................................. 65
4.2 Experimental ............................................................................................... 67
4.2.1 Materials............................................................................................... 67
4.2.2 Equipment and procedure .................................................................... 68
4.2.3 Analyses ............................................................................................... 68
4.3 Results and Discussion ............................................................................... 70
4.3.1 Material balance. .................................................................................. 70
4.3.2 Liquid product characterization ........................................................... 71
4.3.3 Hydrogen disproportionation ............................................................... 73
4.4 Conclusions ................................................................................................. 74
Chapter - 5 Coke, Viscosity and Asphaltene Regimes during bitumen
pyrolysis ............................................................................................................... 76
5.1 Introduction ................................................................................................. 77
5.2Experimental ................................................................................................ 79
5.2.1 Materials............................................................................................... 79
5.2.2 Equipment and Procedure .................................................................... 79
5.2.3 Analysis................................................................................................ 81
5.3 Results and Discussion ............................................................................... 83
5.3.1The Induction Period of Coke Formation ............................................. 83
5.3.2 Viscosity and Ashphaltene content of pyrolysis products ................... 88
5.3.3 Refractive Index and H/C Ratio........................................................... 92
5.3.4 1H-NMR product analysis .................................................................... 95
5.4 Role of Butane in Induction period extension – reduction ......................... 97
5.4.1 Effect of butane dilution on product quality ........................................ 99
5.5 Conclusions ............................................................................................... 102

vii
Chapter - 6 Conclusions ................................................................................... 107
6.1 Introduction ............................................................................................... 107
6.2 Major Conclusions .................................................................................... 107
6.3 Future Work .............................................................................................. 109
6.4 Presentations and Publications.................................................................. 110
Bibliography ...................................................................................................... 111
viii
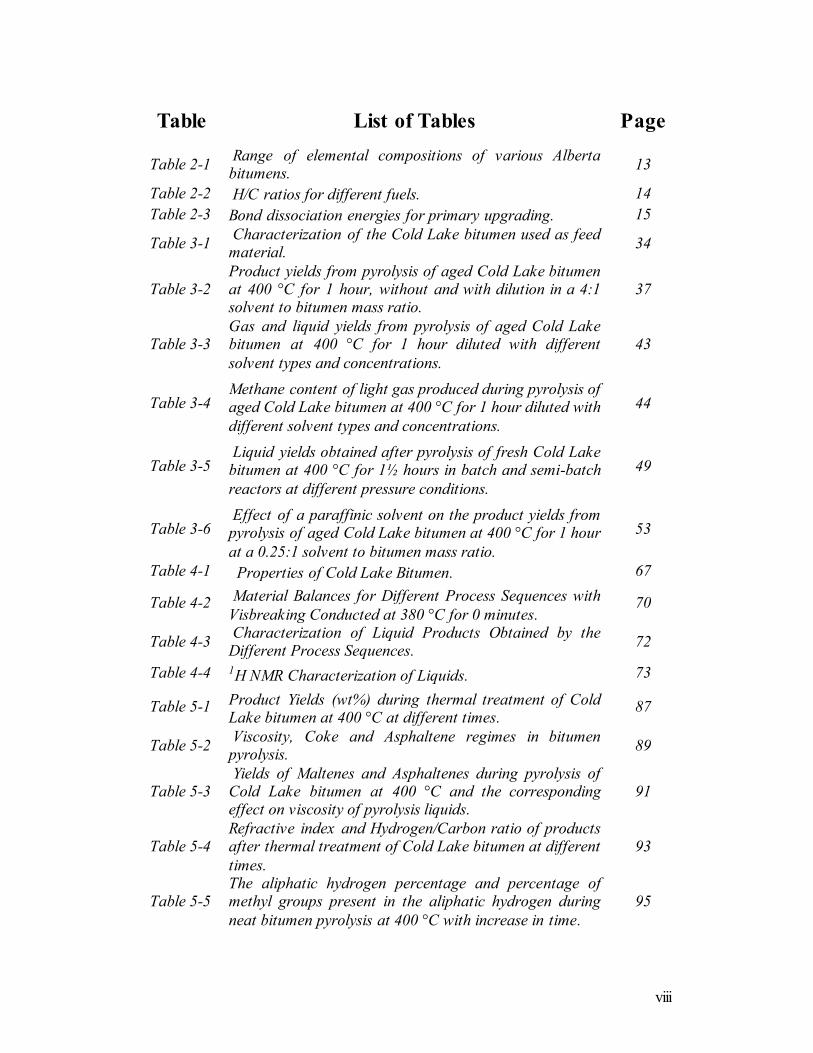
Table List of Tables Page
Table 2-1 Range of elemental compositions of various Alberta bitumens.
13
Table 2-2 H/C ratios for different fuels. 14
Table 2-3 Bond dissociation energies for primary upgrading. 15
Table 3-1 Characterization of the Cold Lake bitumen used as feed material.
34
Table 3-2 Product yields from pyrolysis of aged Cold Lake bitumen at 400 °C for 1 hour, without and with dilution in a 4:1 solvent to bitumen mass ratio.
37
Table 3-3 Gas and liquid yields from pyrolysis of aged Cold Lake bitumen at 400 °C for 1 hour diluted with different
solvent types and concentrations.
43
Table 3-4 Methane content of light gas produced during pyrolysis of aged Cold Lake bitumen at 400 °C for 1 hour diluted with
different solvent types and concentrations.
44
Table 3-5 Liquid yields obtained after pyrolysis of fresh Cold Lake bitumen at 400 °C for 1½ hours in batch and semi-batch
reactors at different pressure conditions.
49
Table 3-6 Effect of a paraffinic solvent on the product yields from pyrolysis of aged Cold Lake bitumen at 400 °C for 1 hour
at a 0.25:1 solvent to bitumen mass ratio.
53
Table 4-1 Properties of Cold Lake Bitumen. 67
Table 4-2 Material Balances for Different Process Sequences with
Visbreaking Conducted at 380 °C for 0 minutes. 70
Table 4-3 Characterization of Liquid Products Obtained by the Different Process Sequences.
72
Table 4-4 1H NMR Characterization of Liquids. 73
Table 5-1 Product Yields (wt%) during thermal treatment of Cold Lake bitumen at 400 °C at different times.
87
Table 5-2 Viscosity, Coke and Asphaltene regimes in bitumen pyrolysis.
89
Table 5-3 Yields of Maltenes and Asphaltenes during pyrolysis of Cold Lake bitumen at 400 °C and the corresponding effect on viscosity of pyrolysis liquids.
91
Table 5-4 Refractive index and Hydrogen/Carbon ratio of products after thermal treatment of Cold Lake bitumen at different
times.
93
Table 5-5 The aliphatic hydrogen percentage and percentage of methyl groups present in the aliphatic hydrogen during
neat bitumen pyrolysis at 400 °C with increase in time.
95

ix
Table 5-6 Product Yields when bitumen was diluted with butane and
pyrolyses at different times. 98
Table 5-7 Asphaltene and Viscosity data for bitumen diluted with
butane at different concentrations and pyrolysed. 99
Table 5-8 Refractive Index (R.I) and Micro Carbon Residue (MCR) data for bitumen diluted with butane at different
concentrations and pyrolysed.
99

x
Figure List of Figures Page
Figure 2- 1 Schematics of SARA analysis of bitumen. 8
Figure 2-2 Archipelago structure representative of Asphaltenes. 10
Figure 2-3 Viscosity – Temperature data for Alberta bitumens. 11
Figure 2-4 Steps involved in thermal cracking a) initiation b) propagation and c) termination reactions.
15
Figure 2-5 Phase separation mechanism of the formation of coke from thermolysis of resids.
18
Figure 2-6 Hydrogen donor action of tetralin (1,2,3,4
tetrahydronaphthalene). 19
Figure 2-7 Process scheme of a coil visbreaker. 21
Figure 2-8 Process scheme of a soaker visbreaker. 22
Figure 3-1 Semi-batch reactor employed for pyrolysis of bitumen. 35
Figure 3-2
Hydrogen transfer action of solvents: (a) tetralin as
hydrogen donor, (b) mesitylene as hydrogen shuttler, (c) naphthalene that is not normally active for
hydrogen transfer.
38
Figure 3-3 Effect of solvent concentration on the coke yield from pyrolysis of aged Cold Lake bitumen at 400 °C for 1 hour.
41
Figure 3-4
Free radical propagation leading to repeated β-
scission to produce material that have hydrogen transfer capability and that is able to moderate the
reaction.
45
Figure 3-5
Coke yields (batch □, semi-batch ■) and gas yields
(batch ○, semi-batch ●) obtained after pyrolysis of fresh Cold Lake bitumen at 400 °C for 1½ hours in
batch and semi-batch reactors at different pressure conditions.
47
Figure 3-6 Viscosity of neat bitumen (■), and mixtures with 0.1:1 (▲) and 0.25:1 (●) ratios of naphthalene to bitumen.
50

xi
Figure 3-7
Reaction network to illustrate the potential contribution of light gas to suppress coke formation
during pyrolysis. The light gases are represented by methane and ethane. Pyrolysed aromatic products are represented by the phenyl radical. Homolytic bond
dissociation energies (kJ∙mol-1) at 25 °C are provided to give an indication of bond strength. Although
reactions are represented as mono-directional, all reactions are reversible.
57
Figure 4-1 Industrially practised processing sequence for
upgrading. 66
Figure 4-2
Refractive index variation from 20-40°C for a)--◊--
bitumen feed b) --■--thermal treatment+ SDA and c) …▲… SDA + Thermal Treatment.
72
Figure 5-1 Coke yield (-▲-) and Micro Carbon residue (..■..) of thermally treated bitumen at different times.
84
Figure 5-2A Structural variation of coke based on pyrolysis time. All images were taken with a stereomicroscope at 20X
magnification. Except for 3a – d (25X).
86
Figure 5-2b Coke at 60 minutes (solids) versus fine coke (240 minutes).
87
Figure 5-3 The effect of pyrolysis time on resulting asphaltene
content (■) and viscosity (▲) of pyrolysis liquids. 88
Figure 5-4 Refractive Index and Solubility Index variation with pyrolysis time.
94
Figure 5-5
Mesophase formation at 200 minutes during pyrolysis
when pyrolysis liquids were observed under cross polarized light (200X magnification).
94
Figure 5-6 Variation of the total Aliphatic Hydrogen in the liquid product and the methyl group contribution to the
aliphatic hydrogen with pyrolysis time.
96
Figure 5-7 Comparison of coke yields when bitumen is diluted with 12.11 ± 1.19 wt% of butane and pyrolysed at 400
°C.
98
Figure 5-8 Total aliphatic hydrogen percent as a function of time in the liquid product for neat bitumen and bitumen
diluted with butane before pyrolysis.
101
Figure 5-9
Methyl group contribution in the aliphatic hydrogen for neat bitumen and bitumen diluted with butane and
pyrolysed. 102

1
Chapter - 1 Introduction
1.1 Background
Oil sands are a natural mixture of sand, clay, water and heavy oil known as
bitumen. The term bitumen is used because of its similar appearance and odor to
tar. Natural deposits of bitumen have been reported in several countries but
Canada in particular has significant reserves of oil sands bitumen. Alberta
specifically has an estimated resource of 2.5 trillion barrels of bitumen.(1) Because
of the large quantity it is a major energy resource and long term research has been
initiated to extract this heavy oil.
There are several challenges when one deals with bitumen because of its high
viscosity, molecular weight and its tendency to coke. A major issue is low fluidity
causing difficulty in transportation. By primary upgrading, bitumen fluidity is
improved. But be it mining, extraction, upgrading or transportation, the challenge
in bitumen chemistry is in understanding the properties of bitumen (both chemical
and physical) and its reactivity.(2) Thermal conversion, probably the oldest of all
refining processes, plays an important role in the oil sands industry. Whatever the
upgrading strategy, it is impossible to make significant advances without thermal
conversion.
Industry today operates on the basis of increasing rate to reduce cost of
production. This of course is under the assumption that the value of carbon is low
and rejection of carbon would be the best economic option. When carbon
rejection takes place by delayed coking for example, the heteroatoms and heaviest
molecules are rejected as coke thereby resulting in a much lighter sweeter
product. There are options of hydrogen addition that reduces carbon rejection but
this is expensive. As carbon becomes more valuable and as environmental
awareness increases, retention of carbon is desired. Having said this one needs to
keep in mind the economics involved as well. This work discusses how low

2
temperature pyrolysis can be used to suppress carbon formation while improving
the fluidity of bitumen.
There have been observations where short duration of subjection to low
temperatures made bitumen a much lighter and more fluid crude with A.P.I
gravities of about 16 to 22 (958 to 920 kg∙m-3) without significant carbon (coke)
formation. Additionally there was no reported degradation of the asphaltenes.(3)
Asphaltenes are the “highest molecular weight, most aromatic fraction”(4) present
in the bitumen matrix and are believed to be coke precursors. If there was a
significant viscosity reduction without much carbon formation and without
degradation to the heaviest molecules in the matrix, mild temperatures might have
played a role in controlling selectivity during pyrolysis. Literature attributes this
to differences in apparent activation energy for the production of lighter and
heavier molecules.(5) An observation reported by Ball(3) included no co-gas
production. Light gases have high hydrogen: carbon (H: C) ratios and
consequently the need to produce coke to balance the H: C ratio for the feed and
products will be more if more gases are produced.
Because of 1) the possibility of increased liquid selectivity thus higher liquid
yields, 2) reduced coke make, 3) reduced co-gas production and 4) the fact that
there is still a knowledge gap about oil sands bitumen pyrolysis in this
temperature regime, we decided to choose low temperatures (400 °C and lower)
as the temperature regime in our pyrolysis studies.
One of the key anticipated advantages of low temperature pyrolysis is the
suppression of coking. The typical minimum industrial operating temperatures are
around 430-460 °C. Having said this, even at low temperatures prolonged
pyrolysis leads to coking.(6) This is because of hydrogen disproportionation and
radical addition reactions. Explained by an atom balance the lighter material gets
more hydrogen rich during pyrolysis and the heavier molecules get more and
more hydrogen deficient and ultimately form coke. In order to compensate for the
lack of hydrogen, hydrogen must be added to the system in some form. This was
not overlooked by researchers and in both petroleum upgrading and direct coal

3
liquefaction solvents were used as reaction moderators. (6) Visbreaking was
combined with donor solvents as a method of hydrogen generation to enable
increased suppression of coke.(7)(8)
This work kept in mind that carbon is valuable and that liquid yields with good
quality is desirable. The goal of this work was not just to increase the production
of lighter liquids but also to increase the value of products.
1.2 Objective
The primary objective was to understand the pyrolysis behavior of Cold Lake
bitumen at 400 °C. This work specifically looked at coke and liquid yields and the
quality of pyrolysis liquids were examined. Additionally the effect of specific
solvent properties on coke yield, liquid yield and gas make was investigated.
1.3 Scope of work
Before any experimental investigations a literature review was conducted
(Chapter-2). The literature review helped in understanding the characteristics of
the feed and the mechanism by which thermal cracking takes place. A review on
current process technologies used in industry (specifically visbreaking) was done.
The temperature regime investigated in our studies (400 °C) was lower than the
typical visbreaking temperatures (430 °C to 460 °C) but has direct application to
visbreaking.
As part of the experimental investigations, three major questions were addressed:
A) The first study (Chapter-3) of this thesis investigated the effect of solvents on
coke make at 60 mins and 400 °C using a batch reactor system. Coke was defined
as the fraction of solids that remained on a 0.22 µm filter paper when extracted
with methylene chloride. This was done to compare liquid and coke yields at this
temperature versus yields obtained from literature. Also, since literature(6)(7)(8)
described solvents act as reaction moderators, the:

4
a) Solvent concentration on coke suppression was investigated. b) Individual
contribution of different solvent properties on coke suppression was investigated.
As part of the study, comparison of yields from batch and semi batch reactors was
performed. Results obtained showed that the notion of over cracking of lighter
liquids to gas usually held were more complicated. The semi batch reactor studies
were performed by a colleague of our research group. Based on these results a
new hypothesis was formulated, namely that hydrogen rich gases like methane to
butane can potentially act as methyl radical donors, participate in the reaction
mechanism and cause coke suppression.
B) In Chapter-4 the sequence of solvent deasphalting (SDA) and visbreaking was
investigated. This was investigated because of the following reasons. a) Wang et
al.(9) found that the inverse relationship between temperature and time for
viscosity reduction by visbreaking did not hold true at lower temperature
pyrolysis of bitumen and b) Not only did the presence of a solvent, suppress
coking but also, the overall availability of transferable hydrogen and methyl-
groups, suppressed coking also. It was hence argued that if the asphaltenes
fraction from bitumen possesses hydrogen and methyl groups that can be donated;
there might be benefit in harvesting this hydrogen-rich material before rejecting
the asphaltenes by solvent deasphalting (SDA).
We did not see a significant difference in product quality when the sequence was
varied. It was argued that this was due to insufficient time to cause a meaningful
change by hydrogen transfer. This led to questioning the role of reaction time in
bitumen pyrolysis both in Chapter-3 and Chapter-4. Wiehe(4) described an
induction period to coke formation. Was the observed coke suppression just an
extension of the induction period? Were we just delaying the inevitable or was
there actual coke suppression?
C) In Chapter-5, a detailed study of batch reactor bitumen pyrolysis with time was
done to understand the effect of reaction time on bitumen properties. Different

5
regimes were observed in bitumen pyrolysis that changed properties like
viscosity, asphaltene content and the micro carbon residue (MCR). The viscosity
trend with the asphaltene content was complex. Surprisingly, after a constant
decrease in the viscosity with pyrolysis time there was an increase. This was also
observed by Wang et al.(9) during analysis of viscosity after thermal treatment at
different temperatures. Conversion was defined in terms of the viscosity change
when Cold Lake bitumen was subjected to a specific time and temperature. After
this study it was clear that in the SDA-Visbreaking study (Chapter-4) sufficient
time was indeed the reason as to why there was no difference in liquid quality.
The effect of n-butane addition on the induction period and product quality was
also investigated.
References
1) Ancheyta, J.; Speight, J. G., Hydroprocessing of Heavy Oils and Residua.
CRC Press: Boca Raton, 2007.
2) Strausz, O. P.; Lown, E. M. The chemistry of Alberta oil sands, bitumens
and heavy oils; Alberta Energy Research Institute: Calgary, AB, 2003.
3) Ball, M. W. Development of the Athabaska oil sands. Can. Inst. Min.
Metall. 1941, 44, 58-91.
4) Wiehe, I. A. Process chemistry of petroleum macromolecules; CRC Press:
Boca Raton, FL, 2008.
5) Leprince, P. Visbreaking of residues. In Petroleum refining. Vol. 3.
Conversion processes; Leprince, P. Ed.; Editions Technip: Paris, 2001, pp
365-379.
6) Cooper, T. A.; Ballard, W. P. Cracking, visbreaking, and reforming. In
Advances in petroleum chemistry and refining. Vol. VI. McKetta, J. J. Jr
Ed.; Interscience: New York, 1962, pp 170-238.
7) Whitehurst, D. D., Mitchell, T. O., Farcasiu, M. Coal liquefaction. The
chemistry and technology of thermal processes; Academic Press: New
York, 1980.

6
8) Sachanan, A. N. Conversion of petroleum. Production of motor fuels by
thermal and catalytic processes, 2ed; Reinhold: New York, 1948.
9) Wang, L.; Yang, S.; Prasad, V.; De Klerk, A. Visbreaking oil sands
bitumen at 400 °C. Prepr. Pap.-Am. Chem. Soc., Div. Energy Fuels 2013,
58 (2), 635-637.

7
Chapter - 2 Literature Review
2.1 Introduction
As the world moves towards increasing dependence on heavier crude,
nonconventional feedstocks such as heavy oil and bitumen are being used meet
current demands. The world heavy oil and bitumen resources which are about 7
trillion barrels of oil exceeds the resources of conventional oils and is expected to
become the principal source of crude oils in the early decades of the 21st century.
Alberta, occupies a prominent position in the world bitumen resources and
because of this, there are lots of current studies on how to upgrade bitumen.(1)
Heavy crudes are often based on their API gravity which are in the range of less
than 10 while those of conventional oils have API gravities higher than 20
(933 kg∙m-3).(2) Heavy crudes also contain significant quantities of sulphur,
nitrogen and metals that makes processing difficult. Oil sands derived bitumen
comprises of tens of thousands of different molecules with broad ranges of molar
masses.(3) It would therefore be useful in the design and operation of process
equipment if one knows the chemical composition of the feedstock.
Characterization is not possible on a molecular basis so bitumen has been
characterized by fractions to make the understanding a little easier.
2.2 Bitumen Characterization
Most methods of bitumen characterization have been developed based on
solubility and adsorption. The most common method employed for separation of
heavy oil into different fractions is saturates, aromatics, resins and asphaltenes
(SARA) type of classification.
In this method of characterization bitumen is first separated into asphaltenes and
maltenes using n–pentane or n-heptane. Maltenes are by definition the class of
compounds that are soluble in n-pentane, n-heptane and toluene. Asphaltenes are
by definition a class that are insoluble in n-pentane or n-heptane. Asphaltenes are
precipitated following the ASTM D6560-12 standard method.(4) According to this

8
method, for a fixed volume of oil, 40 times the volume of n–pentane is added to it
and stirred for 24 hours. The precipitated asphaltenes are filtered and dried. The
maltenes can further be separated using chromatography based on the adsorption
interactions with high surface area chromatographic materials. The fraction of
maltenes adsorbed from a solution in n-pentane by an Attapulgus clay or silica gel
is called resins and the fraction not adsorbed is called oils. Oils may be
fractionated into aromatics and saturates. The fraction of oil that is adsorbed by a
silica/alumina column from the n-pentane: oil solution is called aromatics and the
non-adsorbed fraction is called saturates.
This method of separation of component classes is called SARA analysis and the
standard method is the ASTM D4124-09.(5) Solids are defined as the fraction of
material that are insoluble in any paraffinic solvents (n-pentane or n-hexane) nor
toluene or methylene chloride. These fractions do not give any details about the
chemistry, but combine solubility and adsorption to make classifying the
feedstock easier to some degree. Having said this, it is but obvious that each
fraction does not have definite distinctions between the physical and chemical
properties and thus one needs to keep this in mind while comparing data. Figure
2-1 shows the schematics of SARA analysis of bitumen.
Figure 2- 1: Schematics of SARA analysis of bitumen

9
2.2.1 Asphaltenes
Asphaltenes are a solubility class and precipitate from heavy oil on addition of a
paraffinic solvent to bitumen. They are the most polar and most aromatic fraction
separated from unprocessed crude oils.(3) Because of the natural aggregation
tendency of these molecules measuring the molar mass is difficult and there
always will be strong arguments from various researchers about the exact
molecular structure. It is however possible to find representitve structures for
asphaltene molecues using analytical data.
Qian et al. (6) suggested a mean molecular weight of 1238 amu for a typical
asphaltene molecule using field desorption mass spectrometry. As pointed out
before, the aggregation tendency causes variation in the molecular weights and
researchers have indicated the mean value be in the range of 1000 to 2000 amu.
(7)(8) In literature there are two different types of molecular structures that are
mentioned: 1) Pericondensed and 2) Archipelago type of structure.
The pericondensed structure was suggested by Mullings and Groenzin(9) and this
consisted of a larger multinuclear core with several alkyl chains attached to the
core. In contrast to this structure the archipelago type of representation contain
smaller groups of aromatic cores that are associated together by aliphatic bridges.
Studies (10)(11) have shown that the archipelago structures seem to be more
abundant than the pericondensed ones. Figure 2-2 shows an imaginary average
molecular structure of asphaltenes. Pyrolysis studies(12) of asphaltenes have
shown the existence of bridges that link the aromatic clusters to each other.

10
Figure 2-2: Archipelago structure representative of Asphaltenes(11)
Asphaltenes are reactive molecules and any aggregates affect the viscosity with
pyrolysis time. The trend however, is complex and this observation has been
reported in Chapter-5.
2.2.2 Viscosity
The resistance offered by a moving fluid to the shearing force applied, because of
the internal friction between the layers, is called the viscosity. It is especially
important in industries where transportation of material is important. Efficient
bitumen transportation is a constant industrial challenge and viscosity reduction is
vital to reduce transportation costs.
Canadian oil sands derived bitumen is characterized by a very high viscosity,
typically of the order 104 mPa∙s (cP) at 40 °C.(1) Such a high viscosity makes it
impractical to extract bitumen from oil wells using conventional oil recovery
technologies and difficult to transport bitumen by pipeline without any
pretreatment. However, the viscosity of Alberta bitumens is strongly dependent

11
on temperature. The viscosity-temperature trend for different types of bitumen is
seen in the Figure 2-3.(13)
Figure 2-3: Viscosity-Temperature data for Alberta bitumens(13)
There are many correlations used to estimate the viscosity of crude oil. The
standard approach for viscosity estimation is to take two measurements at two
different temperatures. Once this data is collected the ASTM method is to fit the
following equation to the given data:
[ ( )] ( ) … 2-1
Where T is the absolute temperature (K) and µ is the viscosity (mPa.s).
Puttagunta et al.(14) recommended a similar equation (Equation 2-2) to calculate
the viscosity of Alberta feeds in Pa.s. This method was said to be satisfactory for

12
the design of upgrading processes since the temperature is high enough that the
residues are free flowing liquids.(15)
[
( (
)
] ( ) …2-2
Where C = -3.0020
S =0.0066940b + 3.53641
B0 = 0.004742b + 0.0081709
d = -0.0015646b + 0.0061814
b = log10 (µ30°C) – C
In this equation, T is the temperature in °C, P is the pressure in MPa, and µ30°C is
the measured viscosity in Pa.s at 30 °C and 101.3 kPa.
The viscosity of bitumen as measured at a specific temperature is lowered by two
ways.
a) Conversion b) Solvent addition
The addition of gaseous and liquid diluents to bitumens decreases their viscosity.
The solubility of light gases in bitumens is depended on the temperature, time,
pressure and the nature of the gas and bitumen.(16)(17) By optimizing the
temperature and/or the volume of diluent (gas or liquid), bitumen viscosity maybe
reduced to meet pipeline specifications 350 cSt and 19 °API (940 kg∙m-3) at
minimum pipeline temperature (7.5 °C).(18) The viscosity reduction when upto 25
% naphthalene was added to bitumen is seen in Figure 3-6. The principle of
visbreaking (thermal treatment) and types of visbreakers are explained in 2.4.1
Visbreaking.
2.2.3 Hydrogen/ Carbon (H/C) Ratio
The hydrogen/ carbon (H/C) ratio is an important property of crude oils. It gives
an indication of the value of the oil. Greater the H/C ratio, the higher the value of
the oil. Elemental analysis of bitumen has shown that bitumen and petroleum are

13
composed primarily (to the extent of about 99.4-99.9 wt%) of three classes.
Hydrocarbon elements (H,C), organic heteroatoms (N, O, S) and metals (Ni, V).
The specific weight percentages in literature(1) are given to be around the
following percentages.
1) Carbon and Hydrogen (over 90%)
2) Nitrogen
3) Oxygen combined wt% of up to about 9.9%
4) Sulphur
5) Metals in the organometallic form such as Vanadium and nickel (up to
0.6%).
The oxygen level in the feed is usually found by difference. There has been a
significant amount of data collected by subjecting various types of bitumen to
elemental analyses. From the data collected, it was observed that the elemental
composition of Alberta bitumens vary between narrow limits.
Table 2-1: Range of elemental compositions of various Alberta bitumens.(1)
Element Wt%
Standard
Deviation
(wt%)
Carbon
83.1
0.5
Hydrogen
10.3
0.3
Nitrogen
0.4
0.1
Oxygen
1.1
0.3
Sulphur
4.6
0.5
In conventional crudes H/C values vary considerably and may go as high as 2-2.3
in very light oils and as low as 1.4 in very heavy oils.(20) One factor for this
difference is the residue fraction present in bitumen which has more aromatics
causing a lower H/C.

14
“In the range of fuel materials, the molar ratio of hydrogen to carbon gives an
indication of heating value and the combustion properties”.(19) For perspective
and comparison, the H/C ratios of fuels are listed in the table below (Table 2-2).
Table 2-2: H/C ratios for different fuels.(19)
Fuel
H/C
Ratio
Methane
4
Gasoline
1.9
Diesel
1.9 Light Crude
1.8
Bitumen
1.4-1.6
Coal 0.5-0.8
Based on the H/C ratio, the processing steps change to meet product
specifications. In order to change the hydrogen to carbon ratio the feed may either
be disproportionated to remove a carbon rich stream, or hydrogenated. Final
process objectives and the economics drive disproportionation or hydrogenation
or both.
2.3 Thermal Cracking
Thermal conversion is one of the oldest conversion processes in the petroleum
industry. The primary objective is conversion of larger molecules to smaller ones
by bond breakage. Thermodynamics governs breakage of bonds and typical bond
dissociation energies required for cleavage are seen in Table 2-3. Cleavage of
carbon-carbon, carbon-sulphur and carbon-hydrogen bonds govern the level of
upgrading.

15
Table 2-3: Bond dissociation energies for primary upgrading(20)
Chemical Bond
Energy, kJ/mol
C-C (aliphatic)
355
C-H (n-alkane)
410
C-H (aromatic)
462
C-S*
322
C-N (in amine)
351 C-O (in
methoxy) 343 *Estimated from methyl sulfide and methyl radical formation from dimethyl sulfide with additivity
data from literature.
Depending upon the targeted products, the feed undergoes different thermal and
catalytic processes. In general, a residue upgrading unit aims to improve the H/C
ratio, reduce the average boiling point and lower the content of heteroatoms.
Thermal cracking increases in rate at higher temperatures. The steps that occur
during thermal cracking are initiation, propagation and termination. The
mechanism for aliphatic hydrocarbons is shown in Figure 2-4.
Figure 2-4: Steps involved in thermal cracking a) initiation b) propagation and c)
termination reactions(21)
Thermal cracking starts with the initiation step (a), where homolytic cleavage of
thermodynamically favorable bonds (more likely the carbon-sulfur or carbon-
carbon) occurs and results in free radical formation. Each dissociation step
produces two free radicals. The propagation step involves reaction of free
(a)
(b)
CH2 CH R'R CH2 + R CH2 CH2 CH R'
(c) R CH2 CH2 R'+ R CH2 CH2 R'
R CH2 CH2 R' R CH2 CH2 R'+
R CH2 CH2 R'
+CH2 CH CH2 R'
CH2 CH CH2 R' CH2 CH CH2 R'
+ CH3 R' R CH3 CH2 R'+R CH2
R CH2 CH2 CH R' CH2 CH R'R CH2 +R CH2 CH2 CH R'

16
radicals. During propagation there is abstraction of a hydrogen atom from a
hydrocarbon (or the bitumen matrix).(21) The probability of β-scission performed
on produced radicals to form alkyl radicals and olefins is high. This mechanism
has been formalized and is used to successful explain products from thermal
cracking.(22) It is important to remember that even though the propagation
reactions continue, the primary initiation reactions continue as well. Ultimately
thermal cracking reactions terminate by addition of radicals seen in Figure 2-4(c).
These addition reactions are undesirable because it results in a boiling point
increase of products which defies the purpose of pyrolysis. In termination, free
radicals may collide and combine releasing energy.
In order to prevent free radical addition a source of hydrogen must be present in
order to cap radicals and prevent them from addition. This can be done in form of
hydrogen gas addition or H-donor solvents. Solvents were used as a hydrogen
addition source in our studies and the mechanism of solvent-radical interactions is
discussed in section 2.3.2 Effect of Solvents on coking.
2.3.1 Mechanism of Coke formation
Coke formation is a problem where it is not the purpose of the process. For
example coke formation is the purpose of a delayed coking process. Coking
causes reduced liquid yield and catalyst deactivation. There are various
mechanisms proposed by which hydrocarbon feed turns to coke. An accepted
understanding is that thermal conversion leads to hydrogen disproportionation
that ultimately over time leads to the formation of a carbon rich hydrogen
deficient material referred to as coke. Hydrogen disproportionation starts
occurring at temperatures even below 200 °C(23)(24) and thus even at low
temperatures coke formation can’t be prevented if sufficient time is given. Having
said this, there is an induction period during thermal conversion during which no
coke is formed. The onset of coke formation is associated with the partitioning of
the liquid phase into two, the new phase being termed as a mesophase.
This new phase is lean in hydrogen and readily forms coke as hydrogen
disproportionation proceeds.(25)(26) Liquid-liquid phase separation was also
17
observed by Shaw et al.(27) in pyrene-tetralin-hydrogen mixtures. They worked in
the temperature regime of 347-427 °C and pressures of up to 19 MPa and also
suggested that coke formation can be the result of such phase separation followed
by hydrogen disproportionation. Abedi et al.(28) modelled a phase diagram for a
mixture of heavy oil (Athabasca vacuum bottoms, dodecane and hydrogen). The
reaction conditions were 152-452 °C with pressures of 2-7 MPa. They reported an
irreversible precipitation of asphaltenes for the heavy liquid phase about 377 °C.
This precipitation behavior was not seen for the light liquid phase even at higher
temperatures (427 °C). The experimental results point to a link between
asphaltene precipitation and multiphase behavior. This links the possible relation
between asphaltene fraction conversion to mesophase and ultimately coke make
which was explained by Wiehe.(26)
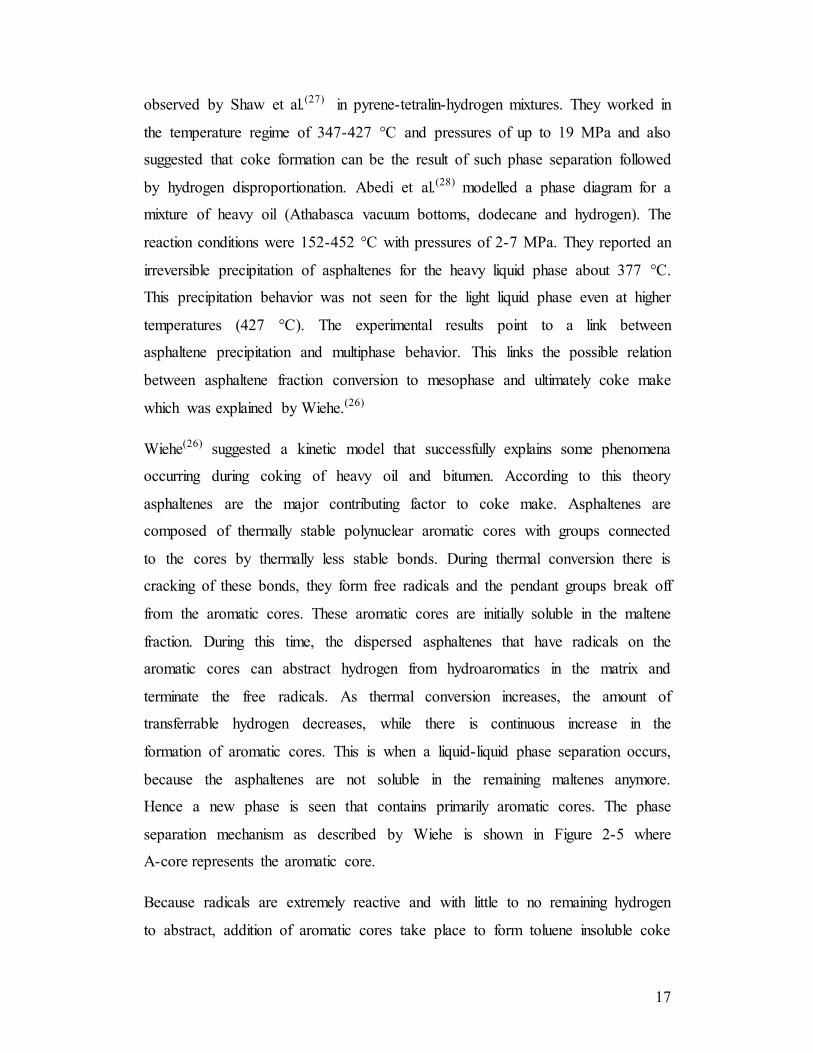
Wiehe(26) suggested a kinetic model that successfully explains some phenomena
occurring during coking of heavy oil and bitumen. According to this theory
asphaltenes are the major contributing factor to coke make. Asphaltenes are
composed of thermally stable polynuclear aromatic cores with groups connected
to the cores by thermally less stable bonds. During thermal conversion there is
cracking of these bonds, they form free radicals and the pendant groups break off
from the aromatic cores. These aromatic cores are initially soluble in the maltene
fraction. During this time, the dispersed asphaltenes that have radicals on the
aromatic cores can abstract hydrogen from hydroaromatics in the matrix and
terminate the free radicals. As thermal conversion increases, the amount of
transferrable hydrogen decreases, while there is continuous increase in the
formation of aromatic cores. This is when a liquid-liquid phase separation occurs,
because the asphaltenes are not soluble in the remaining maltenes anymore.
Hence a new phase is seen that contains primarily aromatic cores. The phase
separation mechanism as described by Wiehe is shown in Figure 2-5 where
A-core represents the aromatic core.
Because radicals are extremely reactive and with little to no remaining hydrogen
to abstract, addition of aromatic cores take place to form toluene insoluble coke

18
that is carbon rich. The induction period of coke formation is the amount of time
required to reach the solubility limit of aromatic cores in the maltenes.
Figure 2-5: Phase separation mechanism of the formation of coke from thermolysis of
resids(26)
Rahmani et al. (29) extended Wiehe’s model (26) and added hydrogen transfer to
asphaltenes using solvents.
2.3.2 Effect of Solvents on coking
The chemistry of thermal cracking shown in Figure 2-4 illustrates the undesirable
reactions (radical addition) that may take place after free radicals are formed. Free
radicals are extremely reactive and when the local concentration is high, the
probability that two free radicals may recombine with each other and form a
stronger bond than that which previously existed is high. There also exists a
probability that a free radical may combine with an unsaturated compound
(olefin). In both cases it leads to the production of heavier products which defies
the purpose of pyrolysis.

19
Most free radical chemistry work was initially performed with model solvents.
The investigation was then extended to coal liquefaction where much work in the
field of free radical chemistry was published in the field of coal. Coal liquefaction
involves thermal conversion at 400 °C to 500 °C and it involves the formation of
free radicals.(30) Literature suggests that sufficient stabilization of radical
fragments, derived thermally from coal would lead to higher conversion. (31)
Since then there have been more studies that helped in understanding the H-donor
mechanism better. The work on coal can also be applied to bitumen.
Figure 2-6: Hydrogen donor action of tetralin (1,2,3,4 tetrahydronaphthalene)(31)
Tetralin (1,2,3,4 tetrahydronaphthalene) which is the prototypical hydrogen donor
solvent was one of the solvents used in our studies. The mechanism by which
tetralin donates hydrogen is shown in Figure 2-6. Tetralin is capable of donating a
hydrogen atom (H•) to the free radical species that is formed during pyrolysis. By
transferring hydrogen to the reactive radical, the radical with the unpaired electron
is terminated and results in a stable molecule with paired electrons. Termination
of the free radical in this way prevents other free radical addition reactions taking
place. During this process, tetralin gets dehydrogenated and finally converts into
naphthalene.
Similar reactions may be performed by different solvents that are inherently
hydrogen rich. Solvents can function as hydrogen donor solvents as they have the
ability to dehydrogenate and donate the resulting hydrogen to hydrogen-deficient
reacting species. Khorasheh, et al.(32) performed reactions with tetralin and
hexadecane where they observed that the yields of olefins were highly suppressed.

20
Their experimental observations also showed reduced coking compared to
thermal pyrolysis of hexadecane without the H-donor solvent (tetralin).
Coal liquefaction studies have shown that solvents can be used as reaction
moderators to improve liquid yield by H-shuttling as well. Mesitylene was used in
our studies as an H-shuttling solvent. Mesitylene has the ability to donate
hydrogen but it does not attain stability like tetralin on H-donation. It hence
shuttles the hydrogen and is termed a hydrogen shuttler. In addition to this the
effect of pure dilution was checked by adding naphthalene as a solvent during
pyrolysis reactions. The reaction chemistry involved is explained in Chapter-3
and the reaction mechanism by which these specific solvents interact with free
radicals is shown in Figure 3-2.
2.4 Technologies employed in bitumen processing
There are three main classes of thermal conversion technologies commercially
used today to process bitumen: a) Viscosity reduction (Visbreaking) b) Coking
and 3) Residue hydroconversion.(33) Residue hydroconversion is a process where
pyrolysis and hydrotreating are combined to hydrogenate cracked products mainly
to increase the quality of cracked products. Visbreaking and Coking have been
discussed briefly since the processes are purely thermal in nature. More attention
will be paid to visbreaking since this is the process that was investigated.
2.4.1 Visbreaking
Gary et al. (34) gives a particularly useful description of visbreaking. “Visbreaking
is a relatively mild thermal cracking operation mainly used to reduce pour points
and viscosities of vacuum tower bottoms to meet No. 6 fuel oil specifications. It
may also be used to reduce the amount of cutting stock required to dilute the resid
to meet these specifications. Long paraffinic side chains attached to the aromatic
cores are said to be the primary cause of high pour points and viscosities of
resids”.(34)
Visbreaking is a technology where optimum time and temperature is given to get
rid of the side chains causing a viscosity decrease. Since its introduction in the

21
1920’s visbreaking has been extensively used to upgrade vacuum bottoms,
produce distillates and visbroken residue.
Residue that needs upgradation is preheated by heat exchangers. This heated
residue is then sent into a visbreaking furnace for a set amount of time at a
specified temperature to reach wanted conversion. After this, the visbroken
material is passed through a soaking zone and the product is quenched. Products
are sent for fractionation by distillation after this. Visbreakers are of two types:
a) Coil Visbreaking: This is high temperature operation (473 °C to 500 °C)
for a usually about 1-3 minutes.(34) The process scheme of coil visbreaking
is seen in Figure 2-7.
b) Soaker Visbreaking: Relatively lower temperature operation (427 °C to
433 °C) and longer reaction times.(34) The process scheme of soaker
visbreaking is seen in Figure 2-8.
Having said this, the temperature and time ranges are tailored to the feed being
processed. The product yields and properties from both coil visbreaking and
soaker visbreaking are similar in nature but the soaker operation has the
advantage of lower energy consumption and longer run times before having to
shut down to remove the coke from the furnace tubes.
Figure 2-7: Process scheme of a coil visbreaker(35)

22
Figure 2-8: Process scheme of a soaker visbreaker(35)
Researchers have investigated different aspects of visbreaking over time.
Development of thermal cracking reaction pathways and kinetics were
investigated under the visbreaking conditions stated. The main variables taken
into consideration were time, temperature and pressure.(36)(37) Most industrial
processing conditions are above 430 °C the primary reason being higher rate. In
our studies we used 400 °C and below to minimize coking and increase liquid
yields. There is not much literature available on thermal conversion below 400 °C
and has been summarized in section 2.5 Low temperature Pyrolysis.
2.4.2 Coking
Coking is a unit process in which there is conversion of heavy oil and vacuum
residues into solid coke of different grades and lighter fractions that are further
processed to be converted into higher values products like transportation fuels.
From a chemical reaction viewpoint coking is a severe cracking process where in
one of the end products is primarily a carbon enriched solid phase product. In
order to eliminate all volatiles from petroleum coke, it must be calcined at

23
approximately 980-1315 °C. Refineries do not calcine coke as part of oil
upgrading.
Initially coking was primarily used to pretreat vacuum residues to prepare coker
gas oil streams that were suitable as feed for a catalytic cracker unit. This caused a
reduction in the coke formation on the cracker catalyst and thereby allowed
increased cracker throughputs.(34) In recent years the coking process has also been
used to prepare hydrocracker feedstocks and also to produce a high quality needle
coke. However, the high sulphur content in bitumen causes production of coke
with high sulphur content since most of the sulphur is retained in the coke.(38)
Because of the high sulphur content in the coke this is difficult to sell.
The main types of coking are delayed coking and fluid coking. In delayed coking
two or more reactors called cokers are charged with the feedstock and they are
used to hold or delay the heated feedstock while cracking takes place. Coke is
deposited in the drums as a solid and is hydraulically cut using water after a cycle
of operation. Fluid coking on the other hand is a process where in once the feed is
continuously fed to the reactor, a part of the formed coke is transferred to a heater
as a fluidized solid. This is where some of it is burned and recirculated to provide
the heat necessary for the cracking process.
2.4.3 Residue Hydroconversion
Residue hydroconversion processes are processes that reduce boiling range of
residue boiling range feedstocks as well as remove substantial amounts of
impurities as metals, sulphur, nitrogen and high carbon forming compounds. The
products however are still very aromatic and may require a severe hydrotreating
operation.
Process selection has tended to favour hydroconversion processes which
maximize distillate yield and minimize byproducts (especially coke). The feed
conversion level that can be achieved is 25-65% in residue hydroconversion
processes.(34)

24
2.5 Low temperature Pyrolysis
“Residues are operationally defined as the fraction of petroleum, heavy oil or
bitumen that does not distill under vacuum. Bitumen’s are defined as any natural
mixture of solid and semisolid hydrocarbons.”(19) Based on the API gravity, the
viscosity and the residue content, the United Nations Institute for Training and
Research (UNITAR) classified bitumen a residuum. Bitumen is processed today
as a residuum because whatever the geological origin of the feed, the residue
fraction is 40% and higher.(19)
A simulated distillation study on the feed used in our experimental studies (Cold
Lake Bitumen) showed an initial boiling point of 242 °C. With such a high initial
boiling point, almost all of the material is in the atmospheric residue range. One
would therefore expect the material to be less reactive based on the conversion
strategies for residues typically used with crude oils. But a more detailed review
of the older literature revealed several interesting observations on the reactivity of
bitumen.
In 1926, Egloff and Morrell(39) investigated the thermal conversion of Athabasca
bitumen at 400 °C and 0.6 MPa. They observed that the Alberta tar does lend
itself particularly to cracking at low temperatures and pressures. The main
purpose of the study, however, was to induce coking and not suppress it.
Henderson and Weber(40) just like Egloff and Morrell investigated low
temperature upgrading of Athabasca bitumen. At 370 °C there was reported
viscosity decrease by two magnitudes as well as density decrease. The amount of
material in the residue boiling fraction was reduced along with insignificant co-
production of gas.
Ball(41) in 1941 essentially reported the same observations. When Athabasca
bitumen was subjected to 360 °C for 32 minutes a product with lower viscosity,
lower density and conversion that had “no fixed carbon and virtually free gases”
was obtained. From these observations bitumen seemed to be more reactive than
predicted from the visbreaking of conventional heavy oil fractions. Mild thermal
25
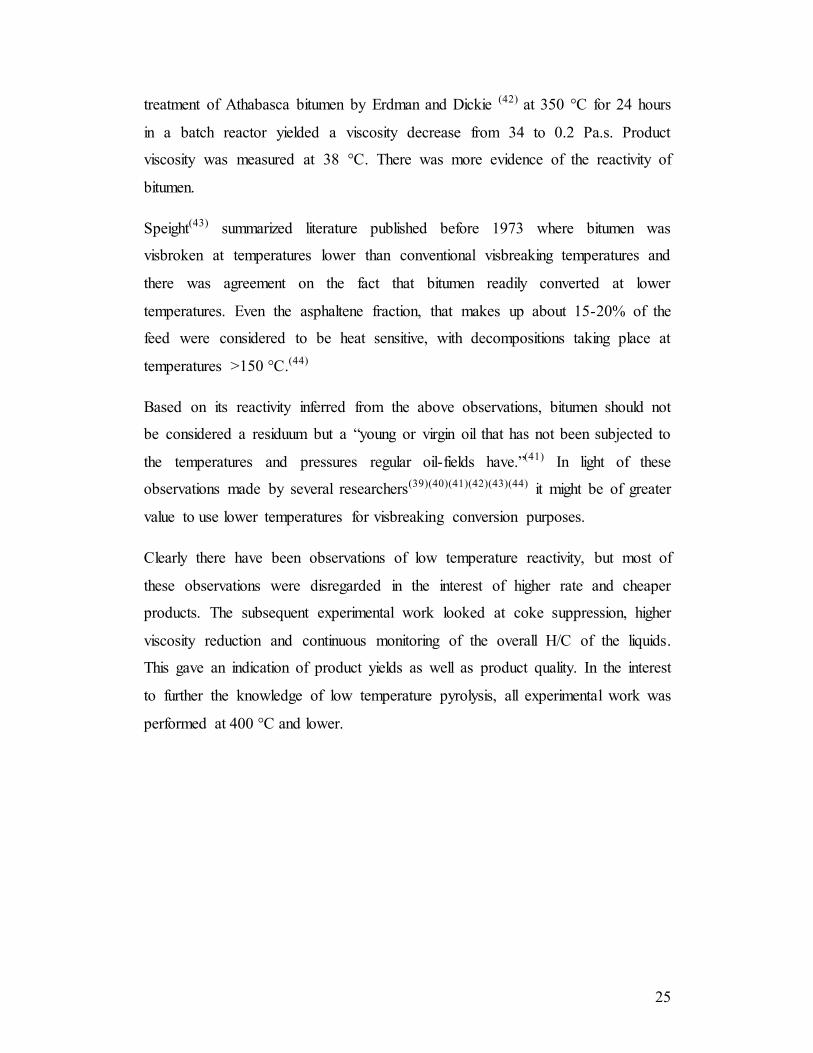
treatment of Athabasca bitumen by Erdman and Dickie (42) at 350 °C for 24 hours
in a batch reactor yielded a viscosity decrease from 34 to 0.2 Pa.s. Product
viscosity was measured at 38 °C. There was more evidence of the reactivity of
bitumen.
Speight(43) summarized literature published before 1973 where bitumen was
visbroken at temperatures lower than conventional visbreaking temperatures and
there was agreement on the fact that bitumen readily converted at lower
temperatures. Even the asphaltene fraction, that makes up about 15-20% of the
feed were considered to be heat sensitive, with decompositions taking place at
temperatures >150 °C.(44)
Based on its reactivity inferred from the above observations, bitumen should not
be considered a residuum but a “young or virgin oil that has not been subjected to
the temperatures and pressures regular oil-fields have.”(41) In light of these
observations made by several researchers(39)(40)(41)(42)(43)(44) it might be of greater
value to use lower temperatures for visbreaking conversion purposes.
Clearly there have been observations of low temperature reactivity, but most of
these observations were disregarded in the interest of higher rate and cheaper
products. The subsequent experimental work looked at coke suppression, higher
viscosity reduction and continuous monitoring of the overall H/C of the liquids.
This gave an indication of product yields as well as product quality. In the interest
to further the knowledge of low temperature pyrolysis, all experimental work was
performed at 400 °C and lower.

26
References
1) Strausz, O. P.; Lown, E. M. The chemistry of Alberta oil sands, bitumens and
heavy oils; Alberta Energy Research Institute: Calgary, AB, 2003.
2) Speight, J. G., The Chemistry and Technology of Petroleum. 4th ed.; CRC
Press, Taylor and Francis Group: Boca Raton, 2006.
3) Wiehe, I. A. Tutorial on Resid Conversion and Coking, Proc. 2nd Intl. Conf.
on refinery processing, AIChE 1999 Spring National Meeting, Houston, TX,
March 14-18, 499-505.
4) ASTM D6560-12: Standard test method for Determination of Asphaltenes in
Crude Petroleum and Petroleum Products; ASTM: West Conshohocken, PA,
2012.
5) ASTM D4124 – 09: Standard test method for Separation of Asphalt into Four
Fractions; ASTM West Conshohocken, PA, 2009.
6) Qian, K. N.; Edwards, K. E.; Siskin, M.; Olmstead, W. N.; Mennito, A. S.;
Dechert, G. J.; Hoosain, N. E. Desorption and ionization of heavy petroleum
molecules and measurement of molecular weight distributions. Energy Fuels
2007, 21(2), 1042-1047.
7) Akbarzadeh, K.; Dhillon, A.; Svrcek, W. Y.; Yarranton, H. W., Methodology
for the characterization and modeling of asphaltene precipitation from heavy
oils diluted with n-alkanes. Energy Fuels 2004, 18(5), 1434-1441.
8) Agrawala, M.; Yarranton, H. W., An asphaltene association model analogous
to linear polymerization. Ind. Eng. Chem. Res. 2001, 40(21), 4664-4672.
9) Groenzin, H.; Mullins, O. C., Molecular Size and Structure of Asphaltenes
from Various Sources. Energy Fuels 2000, 14(3), 677-684.
10) Strausz, O. P.; Mojelsky, T. W.; Lown, E. M., The Molecular-Structure of
Asphaltene - an Unfolding Story. Fuel 1992, 71(12), 1355-1363.
11) Sheremata, J. M.; Gray, M. R.; Dettman, H. D.; McCaffrey, W. C., uantitative
Molecular Representation and Sequential Optimization of Athabasca
Asphaltenes. Energy Fuels 2004, 18(5), 1377-1384.
12) Gray, M. R., Consistency of Asphaltene Chemical Structures with Pyrolysis
and Coking Behavior. Energy Fuels 2003, 17(6), 1566-1569.
27
13) Ancheyta, J. Modeling of visbreaking. Modeling of processes and reactors for
upgrading of heavy petroleum, 2013, pp. 73-102.
14) Puttagunta, V. R.; Singh, B.; Miadonye, A. New Correlating Parameter for
the Viscosity of Heavy Crude Oils. Can J Chem. Eng. 1993, 71, 447.
15) Gray, M. R., Chemical composition of bitumen, Upgrading of Oils Sands
Bitumen and Heavy Oil, University of Alberta Course notes. 2010, pp. 85-39.
16) Mehrotra, A.K.; Svreck,W.Y. Viscosity, Density and Gas Solubility Data Oil
Sand Bitumens. Part 2: Peace River Vitumen Saturated with N2, CO and
C2H6. AOSTRA J. Res. 1985, 1(4), 269-279.
17) Mehrotra, A.K.; Svreck, W.Y. Viscosity of Compressed Cold Lake Bitumen.
Can. J Chem. Eng. 1987, 65(4), 672-675.
18) De Klerk, A.; Gray, M. R.; Zerpa, N. Unconventional oil and gas: Oilsands. In
Future energy. Improved, sustainable and clean options for our planet , 2ed;
Letcher, T.M. Ed.; Elsevier: Amsterdam, 2014, p. 95-116.
19) Gray, M.R Upgrading Petroleum Residues and Heavy oils; Marcel Dekker,
Inc.: New York, 1994.
20) Benson, S. W., Thermochemical Kinetics, 2nd Ed. John Wiley and Sons: New
York, 1976.
21) De Klerk, A.; Fisher Tropsch Refining; Wiley-VCH:Weinhein, 2011.
22) Rice, F.O. The thermal decomposition of organic compounds from the
standpoint of free radicals. I. Saturated hydrocarbons. J. Am. Chem. Soc.
1931, 53, 1959–1972.
23) Moschopedis, S. E.; Parkash, S.; Speight, J. G. Thermal decomposition of
asphaltenes. Fuel 1978, 57, 431-434.
24) Lee, D. G.; Noureldin, N. A.; Mourits, F. M. The effect of low temperature
oxidation on the chemical and physical properties of maltenes and asphaltenes
derived from heavy oil. Prepr. Pap.-Am. Chem. Soc., Div. Petrol. Chem.
1987, 32 (4), 853-856.
25) Rand, B. The pitch-mesophase-coke transformation as studied by thermal
analytical and rheological techniques. ACS Symp. Ser. 1986, 303, 45-61.

28
26) Wiehe, I. A. A phase-separation kinetic model for coke formation. Ind.
EngChem. Res. 1993, 32, 2447-2454.
27) Shaw, J. M.; Gaikwad, R. P.; Stowe, D. A., Phase Splitting of Pyrene-
Tetralin Mixtures under Coal-Liquefaction Conditions. Fuel 1988, 67(11),
1554-1559.
28) Abedi, S. J.; Seyfaie, S.; Shaw, J. M., Unusual Retrograde Condensation
and Asphaltene Precipitation in a Model Heavy Oil System. Pet. Sci. Technol.
1998, 16(3-4), 209-226
29) Rahmani, S.; McCaffrey, W.; Gray, M. R., Kinetics of Solvent
Interactionswith Asphaltenes during Coke Formation. Energy Fuels 2002,
16(1), 148- 154.
30) Sprecher,R.; Retocofsky,H.; Observation of transient free radicals during
coal pyrolysis. Fuel 1983, 62, 473-476.
31) Aiyra,M.; Masunaga, T.; Moriya, K., Chemistry of solvents in coal
liquefaction, Fuel 1984, 63(8), 13-22.
32) Khorasheh,F.; Gray, M.; High Pressure Thermal Cracking of n-Hexadecane in
Tetralin. Energy Fuels 1993, 7(6), 960-967.
33) Sapre, A.; ExxonMobil Resid Conversion Technologies. Paper presented at
the 3rd Bottom of the Barrel Technology Conference & Exhibition (BBTC),
Antwerp, Belgium. October, 2004.
34) Gary, J. H., Handwerk, G. E., Kaiser, M. J. Petroleum refining: Technology
and Economics, 5th Ed. CRC Press: Boca Raton, FL, 2007.
35) Ancheyta, J. Modeling of visbreaking. Modeling of processes and reactors
for upgrading of heavy petroleum, 2013, pp. 73-102.
36) Shen, Z., Cao, Z., Zhu, X., Li, X. Visbreaking of Chinese oil sand bitumen.
Petroleum Science and Technology, 2008, 26(14), 1676-1683.
37) Henderson, J. H., Weber, L. Physical upgrading of heavy crude oil by the
application of heat. Journal of Canadian Petroleum Technology, 1985, 4(4),
206-212.
38) Stormont, D. H. Delayed Coking Techniques Feel Effect of Increased Needle-
Coke Demand, Oil Gas J. 1969, 75–78.

29
39) Egloff, G.; Morrell, J. C. The cracking of bitumen from Canadian Alberta tar
sands. Trans. Am. Inst. Chem. Eng. 1926, 18, 347-363.
40) Henderson, J. H.; Weber, L. Physical upgrading of heavy crude oils by the
application of heat. J. Can. Petrol. Technol. 1965, 4 (4), 206-212.
41) Ball, M. W. Development of the Athabaska oil sands. Can. Inst. Min. Metall.
1941, 44, 58-91.
42) Erdman, J. G.; Dickie, J. P. Mild thermal alteration of asphaltic crude oils.
Prepr. Pap.-Am. Chem. Soc., Div. Petrol. Chem. 1964, 9, B69-B79.
43) Speight, J. G.; Moschopedis, S. E. The influence of crude oil composition on
the nature of the upgrading process: Athabasca bitumen. In The future of
heavy crude and tar sands; Meyer, R. F., Steele, C. T., Olson, J. C. Eds.;
McGraw-Hill: New York,1981, p. 603-611.

30
Chapter - 3 Suppression of coke formation during
bitumen pyrolysis
Abstract
In this chapter mild pyrolysis (400 °C) of bitumen was investigated to establish
ways in which coke formation can be suppressed. Bitumen was diluted to various
degrees with solvents that had different hydrogen transfer properties, namely,
hydrogen donation, hydrogen shuttling and a solvent with poor hydrogen transfer
properties. Additionally the concentration of light products generated during
bitumen pyrolysis was manipulated by pressure and batch/semi-batch operation.
Coke formation was suppressed by light material, whether added as a solvent, or
generated in situ during pyrolysis. As anticipated, hydrogen transfer was
important, but coke formation was reduced by 35 % at 10 % concentration of
even a poor hydrogen transfer solvent. Hydrogen availability and the H:C ratio of
the reaction mixture were found to be particularly influential in determining
whether coke formed. The results showed that light gases produced during
pyrolysis were not irreversible reaction products, but continued to participate in
the reaction network to moderate the pyrolysis process and suppress coke
formation. Applied to industrial operation, evidence was provided to indicate that
liquid yield can be increased and coke formation can be suppressed during
visbreaking by co-feeding light gases, typically C4 and lighter hydrocarbons.
Keywords: Thermal cracking, visbreaking, pyrolysis, bitumen, coke, hydrogen
transfer

31
3.1 Introduction
Thermal conversion is the oldest of all refining processes. To this day thermal
conversion is industrially employed for the upgrading of heavy oils and
bitumens.(1) Conversion takes place through thermal cracking (pyrolysis) of the
molecules and the chemistry follows a free radical mechanism (see 2.3 Thermal
Cracking). Three main classes of thermal conversion technology are found for
bitumen: visbreaking, coking and residue hydroconversion. Visbreaking is a mild
pyrolysis process that was originally developed to reduce the viscosity sufficiently
for fuel oil applications. Coking is a prolonged pyrolysis process that
disproportionates the bitumen into a carbon-rich coke fraction and more
hydrogen-rich lighter fractions. Residue hydroprocessing is a process where
pyrolysis and hydrotreating are combined to hydrogenate the cracked products as
they are produced to increase the quality and yield of liquid products.
The role of thermal upgrading changed over time, as society became more
sensitive about the use of carbon. This is especially evident in the changing role
of mild pyrolysis as is found in visbreaking, since the emphasis shifted from the
production of fuel oil to the increased production of lighter liquid products that
have higher value. It is the latter application, namely, the mild pyrolysis of
bitumen to increase the yield of lighter liquid products, which is considered in this
chapter.
In order to increase the yield of lighter liquid products, mild pyrolysis has to be
operated at higher conversion. Practically, the maximum conversion is limited by
coke formation in the furnace and stability of the atmospheric residue fraction,
although there are other constraints too.(5)(3) There is a stoichiometric limit on
how much pyrolysis conversion can be performed before carbon rejection by coke
has to take place in order to balance the H:C ratio of the feed and products. Coke
formation can be suppressed by hydrogen addition, which increases the H:C ratio
of the product and decreases the need for carbon rejection. This strategy is
employed in residue hydroconversion to obtain an overall increase in H:C ratio of
the products, either through direct catalytic hydrogenation with H2, or indirect

32
hydrogenation by hydrogen-transfer from an appropriate hydrogen-donor solvent.
The latter approach has extensively been used in direct coal liquefaction.(4)
Petroleum refiners did not overlook the analogy and visbreaking combined with
hydrogen-donor solvents was investigated,(5)(6) as well as hydrothermal
conversion,(7) and ways to generate hydrogen during visbreaking, such as
Aquaconversion.(8) Another source of coke formation is free radical addition
reactions. Industrially steam is employed to reduce coke formation by increasing
turbulence in the flow where feed vaporization is insufficient to do so,(5) and to
reduce free radical addition in the vapor phase by dilution. Hydrogen donor
solvents can perform a similar function, but with the added ability to terminate
free radical reactions through intermolecular hydrogen-transfer.
Bitumen pyrolysis is a well-established, mature and industrially practised
conversion process, yet, there are still some opportunities for improvement.
Model solvents were chosen to differentiate different possible mechanisms of
coke suppression and although real bitumen was used, this should not be
considered an applied study with direct industrial application. The outcome was
unexpected and it generated some new insights into the parameters that are
important for suppressing coke formation during visbreaking. Our working
hypotheses were:
(a) Lowering the operating temperature will decrease coke formation. There is an
inverse relationship between temperature and time required for the same level of
cracking conversion in visbreaking.(5) Better liquid selectivity is obtained by
operating at lower temperature due to the difference in apparent activation energy
for the production of lighter and heavier molecules.(5) This hypothesis was not
verified by the present study, but it informed the choice of pyrolysis temperature;
all experiments were conducted at 400 °C.
(b) Co-feeding a liquid solvent with bitumen will suppress coke formation. The
solvent can reduce free radical addition reactions by dilution and by free radical
termination in the case of hydrogen donor solvents. Hydrogen donor solvents are

33
preferred and literature indicates that the hydrogen donor ability of a solvent is
crucial to increase liquid yield,(4) and decrease coke formation.(9) This hypothesis
was investigated.
(c) Decreasing the production of light gases during bitumen pyrolysis will
suppress coke formation. Light gases have higher H:C ratios than liquid products.
Consequently, the need to produce coke through hydrogen disproportionation in
order to balance the H:C ratio of feed and products will diminish if less light
gases are produced. For example, producing pentane (C5H12) as opposed to
producing methane (CH4), reduces the stoichiometric coke requirement by 40 %.
Over-cracking of lighter liquids at longer residence time was cited as one of the
main reasons for increased light gas production.(10) This hypothesis was
investigated.
3.2 Experimental
3.2.1 Materials
The experimental investigation was performed with Canadian Cold Lake bitumen,
which was supplied through the sample bank of the Center for Oil Sands
Innovation (COSI) at the University of Alberta. Two different samples of Cold
Lake bitumen were used, one that was aged and one that was fresh (Table 3-1).
These two samples had different coking propensities, as can be seen from the
difference in micro carbon residue (MCR) values.
The solvents employed were selected based on their different hydrogen-transfer
abilities. The hydrogen donor solvent, tetralin (1,2,3,4-tetrahydronaphthalene) 99
%, was supplied by Sigma Aldrich. Mesitylene (1,3,5-trimethylbenzene) 98 %,
also supplied by Sigma Aldrich, was employed as solvent with hydrogen shuttling
ability. Naphthalene +99 % supplied by Fischer Scientific, was employed as
solvent with poor hydrogen-transfer ability. Praxair supplied nitrogen 99.999 %
as compressed cylinder gas.

34
Table 3-1: Characterization of the Cold Lake bitumen used as feed material
Description Aged Cold Lake
bitumen
Fresh Cold Lake
bitumen
Micro carbon residue (wt %) a 17.8 ± 0.5 15.0 ± 0.7
Asphaltene content (wt %) 17.6 13.4 ± 1.0
Viscosity at 60 °C (mPa∙s) 16200 9600 ± 300
Elemental analysis (wt %)
carbon 82.6 82.6
hydrogen 9.5 10.3
nitrogen 0.7 0.6
sulfur 4.8 4.7
oxygen (by difference) 2.4 2.6
3.2.2 Equipment and Procedure
All pyrolysis experiments were performed in a semi-batch reactor (Figure 3-1)
that was operated either in batch, or semi-batch mode. The setup was constructed
using Swagelok 316 stainless steel tubing and fittings. The reactor was heated by
placing it in a heated fluidized sand bath. The temperature inside the reactor was
monitored and indirectly controlled by adjusting the temperature of the heated
fluidized sand bath. During batch mode operation the reactor was purged and
pressurized with nitrogen and then the ball valves V01 and V02 were closed
before the reactor was placed in the heated fluidized sand bath. During semi-
batch mode operating the same procedure was followed, but ball valve V02 was
left open and the pressure inside the reactor was controlled by adjusting the back
pressure regulator PCV02.

35
For a typical experiment the reactor was filled with 5-8 g material (bitumen and
solvent), purged and leak tested with nitrogen. If required, the reactor was then
pressurized to the desired pressure, before being placed into the preheated
fluidized sand bath heater. The heat-up time from room temperature to 400 °C
was 5 minutes. The duration of each run was 1 hour, measured from the time
heating started. Cooling down at the end of the experiment also took 5 minutes.
The reactor was then depressurized.
N2
PI
TI
TIC
back pressure
regulator
V01 V02 PCV02PCV01
FI FI
Vent
fluidized
sand bath
heater
Figure 3-1: Semi-batch reactor employed for pyrolysis of bitumen.(11)
The light gases produced during the reaction and on depressurization were
collected in a gas bag and afterwards analyzed. After removing and cleaning the
reactor, the reactor and product were weighed to determine the weight of product.
The reaction product was removed from the reactor with methylene chloride in a
ratio of 1:40. The mixture was stirred for an hour and then the coke was extracted
from the diluted pyrolysis product by filtration. The coke fraction was dried and
weighed. Material balances for the experiments were typically in the range 97-
103 %. All experiments were performed at least in triplicate.

36
3.2.3 Analyses
The gaseous products were analyzed using an Agilent 7890A gas chromatograph
equipped with both flame ionization and thermal conductivity detectors. A Hay
Sep R column, 2.44 × 0.003 m (8 ft × ⅛ inch) was employed. The carrier gas
used for analysis was helium with a constant flow of 25 ml∙min-1. The injector
temperature was set at 200 °C. The temperature program used started at 70 °C for
7 minutes, then ramping at 10 °C∙min-1 to 250 °C and holding for 2 minutes,
followed by ramping at 30 °C∙min-1 to 300 °C and holding for 8 minutes.
Viscosity analyses were performed using an Anton Paar RheolabQC viscometer.
The RheolabQC was calibrated with a Newtonian viscosity standard specimen
whose kinematic viscosity was measured using a capillary viscosimeter of the
Ubbelohde type, which was traceable to the national standard of the viscosity.
The sample measuring cup used was C-CC17/QC-LTC and on average 4 g of the
samples was required for analysis.
A Mettler Toledo ML 3002 balance (3200 g capacity with 0.01 g readability) was
used for weighing of reactors, samples and products. Pressurized reactors were
weighed before and after reaction, as well as after depressurization. In this way it
was possible to also determine the gas yield gravimetrically.
3.3 Results and Discussion
3.3.1 Pyrolysis of diluted bitumen
Three different model solvents were evaluated for their ability to increase the
liquid yield from bitumen pyrolysis, namely, tetralin, mesitylene and naphthalene.
The solvents were selected based on the difference in their hydrogen-transfer
capabilities. It was found that at 4:1 dilution (20 wt% bitumen in solvent), all of
the solvents were capable of increasing liquid yield and decreasing coke yield
(Table 3-2). Qualitatively the results were similar to that of a previous asphaltene
pyrolysis study at 430 °C, where tetralin, methyl naphthalene and naphthalene
were employed as solvents at 3:1 solvent to asphaltene ratio.(12)

37
As expected, the best results were obtained with tetralin, which is the prototypical
hydrogen donor solvent. The liquid yield after 1 hour pyrolysis of neat bitumen at
400 °C was 79.0 ± 2.5 wt%, but for bitumen in tetralin, the liquid yield increased
to 87.0 ± 1.0 wt%. The improvement in liquid yield was mainly due to the
suppression of coke formation. The coke yield decreased from 7.5 ± 0.2 % for
neat bitumen pyrolysis to 2.0 ± 0.8 % for bitumen diluted in tetralin. Although a
slight decrease in gas yield was also observed, it was within the experimental
error. Tetralin is capable of donating hydrogen (H•) to the free radical species
(B•) formed during bitumen pyrolysis (Figure 3-2a). By transferring a hydrogen
atom, which also has an unpaired electron, the free radical is terminated to
produce a molecule with paired electrons (H:B). During this process the tetralin
is dehydrogenated to 1,2-dihydronaphthalene, which is also a hydrogen donor
solvent. The 1,2-dihydronaphthalene can likewise donate hydrogen to free radical
species, ultimately being converted into naphthalene. By terminating free radical
species, without the solvent being converted into a free radical product (except as
intermediate), coking is suppressed.
Table 3-2: Product yields from pyrolysis of aged Cold Lake bitumen at 400 °C for 1 hour, without and with dilution in a 4:1 solvent to bitumen mass ratio.
a
Feed material Product yield (wt %)
liquid coke gas
x s x s x s
bitumen 79.0 2.5 7.5 0.2 13.5 3.5
tetralin + bitumen 87.0 1.0 2.0 0.8 11.0 2.5
mesitylene + bitumen 85.0 1.5 3.0 0.3 12.0 3.0
naphthalene +
bitumen
82.7 1.3 3.8 0.5 13.5 3.0
a Average (x) and sample standard deviation (s) of three experiments are reported.
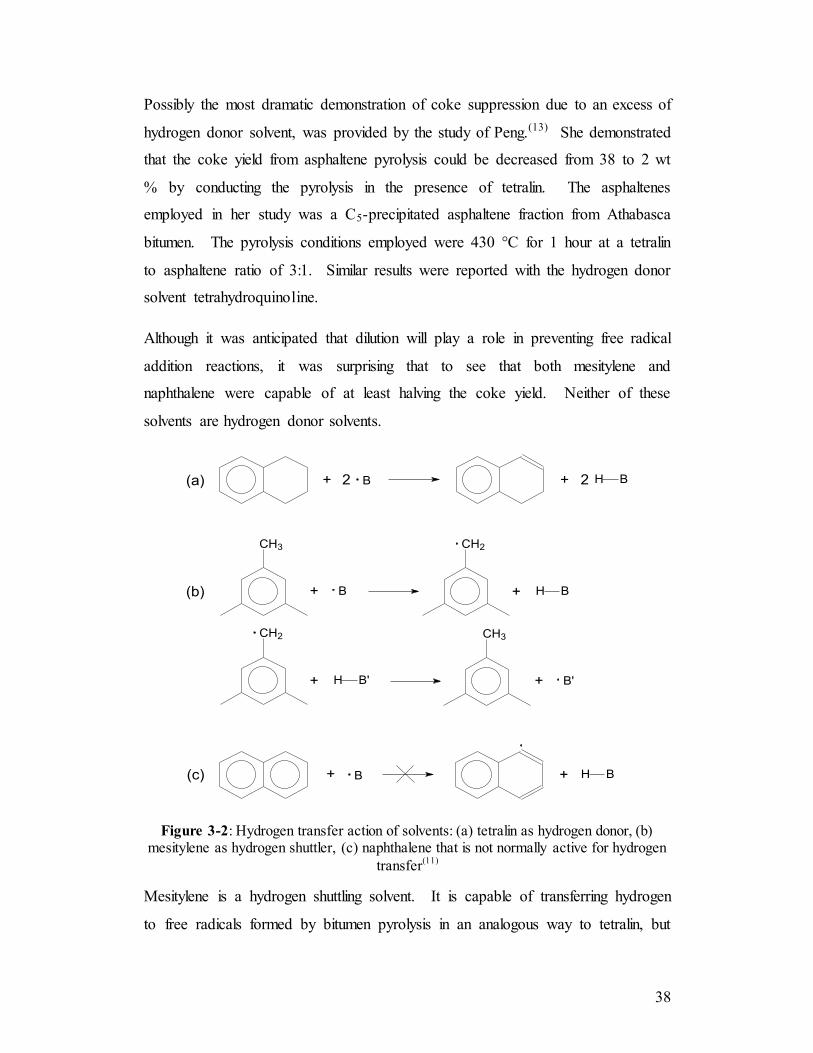
38
Possibly the most dramatic demonstration of coke suppression due to an excess of
hydrogen donor solvent, was provided by the study of Peng.(13) She demonstrated
that the coke yield from asphaltene pyrolysis could be decreased from 38 to 2 wt
% by conducting the pyrolysis in the presence of tetralin. The asphaltenes
employed in her study was a C5-precipitated asphaltene fraction from Athabasca
bitumen. The pyrolysis conditions employed were 430 °C for 1 hour at a tetralin
to asphaltene ratio of 3:1. Similar results were reported with the hydrogen donor
solvent tetrahydroquinoline.
Although it was anticipated that dilution will play a role in preventing free radical
addition reactions, it was surprising that to see that both mesitylene and
naphthalene were capable of at least halving the coke yield. Neither of these
solvents are hydrogen donor solvents.
2+ 2+ BHB
CH3
+ B + BH
(a)
(b)
CH2
CH2
+ B'H
CH3
+ B'
(c) + B + BH
Figure 3-2: Hydrogen transfer action of solvents: (a) tetralin as hydrogen donor, (b) mesitylene as hydrogen shuttler, (c) naphthalene that is not normally active for hydrogen
transfer(11)
Mesitylene is a hydrogen shuttling solvent. It is capable of transferring hydrogen
to free radicals formed by bitumen pyrolysis in an analogous way to tetralin, but

39
by doing so, the mesitylene becomes a free radical (Figure 3-2b). This may help
to terminate free radical species capable of forming coke, but the mesitylene must
ultimately get the hydrogen back from the bitumen, or itself run the risk of free
radical addition. Mesitylene is sterically crowded and self-termination to form
mesitylene dimers is difficult and no clear evidence was found that mesitylene
dimerization is a meaningful termination pathway. Nevertheless, dimerization
was reported for another hydrogen shuttling solvent, methyl naphthalene, during
pyrolysis of diluted bitumen at 400 °C and 13.8 MPa H2 pressure.(14) Under such
a high hydrogen pressure it is possible to hydrogenate some the naphthalene to
tetralin, which is a hydrogen donor solvent. It is also possible to form dimers,
because ring-addition is not sterically hindered as in the case of mesitylene.
Mesitylene is only a hydrogen shuttling solvent and not a hydrogen donor solvent.
Naphthalene is a poor hydrogen transfer solvent (Figure 3-2c). The aromatic C–H
bonds have high bond dissociation energies, typically of the order of 472 ± 3
kJ∙mol-1, compared to 375 ± 3 kJ∙mol-1 for the C–H of a methyl group attached to
an aromatic ring as is found in mesitylene.(15) However, aromatic solvents that
contain no alkyl groups are not completely inert.(16)(17) The potential participation
of naphthalene in free radical propagation by hydrogen abstraction from an
aromatic C–H bond depends both on the temperature and the naphthalene
concentration. For example, it was reported that the thermal conversion of
benzene relative to n-hexadecane was 5 times lower when the molar concentration
of n-hexadecane in benzene was increased from 0.01 to 0.05.(17) Another
mechanism that was suggested for naphthalene participation in free radical
propagation involves the transfer of hydrogen to one of the carbon atoms in the
naphthalene ring to create monohydronaphthalene. This is also called the ipso-
mechanism. Some hydrogen exchange was reported for phenanthrene as solvent
with coal, but almost no exchange took place with anthracene.(18) In addition,
little support was found that the ipso-mechanism was a significant contributor in
coal dissolution by 1-methylnaphthalene.(19) Yet, naphthalene was capable of
reducing the coke from 7.5 ± 0.2 % for neat bitumen pyrolysis to 3.8 ± 0.5 % for
bitumen diluted in naphthalene. Dilution seemed to play a more significant role

40
than hydrogen transfer ability, because naphthalene was effective at reducing the
coke yield without being as active for hydrogen transfer as tetralin or mesitylene.
In the pyrolysis experiments (Table 3-2), the bitumen concentration was 20 %.
With so much solvent, it is conceivable that the solvent interfered with free
radical addition reactions and in-cage reactions were more easily disrupted. The
physical separation (dilution) of free radical species by the solvent was apparently
the dominant force for suppressing coke formation, so that even naphthalene,
which is not an efficient hydrogen transfer solvent, was effective in reducing the
coke yield during pyrolysis compared to neat bitumen.
On a solvent free basis, it was found that disproportionation of hydrogen from
liquid phase to gas phase products increased with in increasing hydrogen transfer
ability of the solvent.(20) The H:C ratio of gas phase products was the highest with
tetralin as solvent (H:C = 3.07) and the lowest with undiluted bitumen (H:C =
2.95). Conversely, the H:C of the liquid phase products was the lowest with
tetralin as solvent (H:C = 1.14) and the highest with undiluted bitumen (H:C =
1.37). The lower H:C ratio of the liquid phase product after pyrolysis of 20%
bitumen in tetralin is mainly due to the retention of material in the liquid phase
that was rejected as coke during bitumen pyrolysis (Table 3-2).
3.3.2 Effect of solvent dilution on coke yield
If dilution played an important role in suppressing coke, then the coke yield
should be sensitive to the solvent concentration. The participation of poor
hydrogen transfer solvents, such as naphthalene, in free radical transfer also
decreases in relation to concentration.(16)(17) It was therefore anticipated that a
decrease in solvent concentration will lead to a gradual increase in coke yield, but
this was not what was observed (Figure 3-3).
Even with the least amount of solvent evaluated, 10 % naphthalene, the presence
of a solvent caused the coke yield during pyrolysis to be decreased from 7.5 % for
neat bitumen to around 5 %. This decrease in coke yield was not due the hydrogen

41
transfer ability of the solvent, since naphthalene is a poor hydrogen transfer
solvent. A benefit of better hydrogen transfer and hydrogen donation was seen
mainly at higher solvent concentrations. At lower solvent concentration, the coke
yield was within experimental error similar for all of the solvents.
0
1
2
3
4
5
6
7
8
0 10 20 30 40 50 60 70 80 90
Solvent concentration (wt%)
Co
ke
yie
ld (
wt%
)
tetralin + bitumen
mesitylene + bitumen
naphthalene + bitumen
Figure 3-3: Effect of solvent concentration on the coke yield from pyrolysis of aged Cold
Lake bitumen at 400 °C for 1 hour.(11)
The effect of solvent concentration of the different solvents on coke yield (Figure
3-3) indicated that at least four mechanisms were at work to suppress coke
formation:
(a) Hydrogen donation was important. Tetralin is a good hydrogen donor solvent
and the contribution of hydrogen donation can be seen from the difference in coke
yield between tetralin and mesitylene, which is not a hydrogen donor solvent. At
a solvent concentration of 50 % and higher there was a meaningful difference at
95 % confidence level based on a two-tailed Student t-test comparison of the
means.
(b) Hydrogen shuttling was important. Mesitylene is a good hydrogen shuttling
solvent and the contribution of hydrogen shuttling can be seen from the difference
in coke yield between mesitylene and naphthalene, which is a poor hydrogen

42
shuttler. The difference was meaningful for a solvent concentration of 20 % and
higher at 90 % confidence. Even so, the difference was not meaningful with
respect to tetralin.
(c) Dilution was important. The effect of dilution can be seen from the impact of
solvent concentration on the coke yield. The coke yield monotonically decreased
with an increase in solvent concentration for all solvents over the whole
concentration range studied. However, the contribution of dilution is surprisingly
small. Even though the average values for coke yield decreased with increasing
solvent concentration, the incremental differences between a 1:1 and 4:1 solvent
to bitumen were not statistically significant.
(d) Despite its poor hydrogen transfer capability, naphthalene reduced coke yield
significantly compared to neat bitumen. Furthermore, naphthalene was able to
suppress coke formation significantly even when the solvent to bitumen ratio was
1:10. In addition to those mechanisms already mentioned, there was at least one
important mechanism (or more) that was actively suppressing coke formation.
3.3.3 Effect of solvent dilution on pyrolysis
The effect of solvent dilution on pyrolysis extended beyond the impact on coke
yield. The liquid yield was also affected by formation of light gases (Table 3-3).
As the solvent to liquid ratio was decreased, the contribution of free radical
stabilisation through hydrogen donor and hydrogen transfer activity diminished.
The decrease in liquid yield was expected from the increase in coke yield (Figure
3-3). The accompanying increase in gas yield with decrease in solvent
concentration (Tables 3-2 and 3-3) was observed only for bitumen pyrolysis
diluted with tetralin and mesitylene; the gas yield for bitumen pyrolysis diluted
with naphthalene remained constant.

43
Table 3-3: Gas and liquid yields from pyrolysis of aged Cold Lake bitumen at 400 °C for
1 hour diluted with different solvent types and concentrations.a
Feed material Solvent:bitumen Product yield (wt %)
gas liquid
x s x s
bitumen b 0 13.5 3.5 79.0 2.5
tetralin + bitumen 0.25:1 12.2 2.7 83.8 1.5
1:1 11.5 3.0 86.5 2.0
mesitylene +
bitumen
0.25:1 13.0 2.8 83.3 2.0
1:1 12.5 2.6 84.4 2.2
naphthalene +
bitumen
0.25:1 13.5 2.5 82.0 1.7
1:1 13.4 2.5 82.5 1.9
a Average (x) and sample standard deviation (s) of three experiments are reported.
b Repeated from Table 2 for ease of reference.
Although the increased gas yield found with tetralin and mesitylene were within
the range of experimental error, the increase was monotonic with the decrease in
solvent concentration. Conversely, the light gas yield of neat bitumen pyrolysis is
the same as that of bitumen pyrolysis in naphthalene, irrespective of the
naphthalene concentration. The change seems to be inversely related to change in
production of methane (Table 3-4). The methane exhibited the same trend as the
total light gas yield; the methane concentration decreased as the solvent
concentration was decreased. The increase in light gas yield at lower solvent
concentration was mainly due to an increase in the formation of C2 and heavier
hydrocarbons.

44
Table 3-4: Methane content of light gas produced during pyrolysis of aged Cold Lake bitumen at 400 °C for 1 hour diluted with different solvent types and concentrations.
a
Feed material Solvent:bitumen Methane content (mol %)
x s
bitumen 0 30 4
tetralin + bitumen 0.25:1 31 6
1:1 34 1
4:1 41 5
mesitylene + bitumen 0.25:1 34 2
1:1 42 2
4:1 48 8
naphthalene + bitumen 0.25:1 29 1
1:1 32 2
4:1 30 1
a Average (x) and sample standard deviation (s) of three experiments are reported.
It appeared as if at least a portion of the light gases was produced specifically to
compensate for the lack of a hydrogen transfer medium. If the reaction mixture
has too little material with hydrogen transfer capability, free radical propagation
during pyrolysis is not sufficiently moderated. It is not suggested that the
pyrolysis mechanism is altered, but rather that the propagation pathway is affected
in such a way that more molecules with hydrogen transfer capability are produced
until some form of pseudo-equilibrium is reached. Differently put, if the medium
has insufficient hydrogen transfer capability, free radical propagation by repeated
β-scission will continue uninterrupted, thereby creating more and more lighter
products that will ultimately moderate the reaction (Figure 3-4). This

45
interpretation is supported by the change in the methane concentration of the light
gas (Table 3-4). Both the light gas yield and the C2 and heavier hydrocarbon
concentration of the light gas increased as the hydrogen transfer ability of the
medium decreased.
R CH2 CH2 CH R'
R CH2 CH2 CH R' CH2 CH R'R CH2 +
BH+ BR CH2 CH2 CH R'
H
(potentially )BH
Figure 3-4: Free radical propagation leading to repeated β-scission to produce material
that have hydrogen transfer capability and that is able to moderate the reaction.(11)
This observation led to the formulation of a different hypothesis about the role
and need for light gases during pyrolysis that was different from that outlined in
the introduction.
3.3.4 Role of light gases in bitumen pyrolysis
The working hypothesis outlined in the introduction was that any lighter products
formed in a closed system will run the risk of over-cracking to produce light
gas.(10) It is therefore beneficial to remove the lighter products as soon as they are
formed. Based on the reported observations (Table 3-3), a new hypothesis was
formulated. It was postulated that lighter products are beneficial and that
removing such products from the reaction system will promote over-cracking to
increase the production of light gas and through hydrogen disproportionation
increase coke formation.
46
These two hypotheses differ with respect to what the dominant mechanism is:
over-cracking of products due to longer residence time, or over-cracking of
products and increased coke formation due to a lack of moderation by hydrogen
transfer. The hypotheses are not mutually exclusive, but highlight different
aspects of the overall pyrolysis process as being important.
The effect of increasing pressure as means to exploit vapor liquid equilibrium
(VLE) to maintain a higher liquid phase concentration of lighter products was
studied using a semi-batch reactor. Semi-batch reactor operation resembles a
delayed coking process, apart from the fact that all the liquid feed is introduced to
the reactor at the same time. The pressure in the reactor was kept constant by a
back pressure regulator, which released vapor phase material in excess of what
was required to maintain the pressure (Figure 3-1). For a given pressure the
concentration of the lighter products in the liquid phase will remain constant,
under the assumptions that the lightest products govern the vapor pressure of the
mixture and that the concentration of the lighter products in the vapor phase does
not vary much over time. The concentration of naphtha-range products in the gas
phase product was minor.
It was found that as the pressure was increased, the coke yield decreased (Figure
3-5). It supported the previous observations (Figure 3-3), which indicated that a
solvent suppressed coke formation. The light products produced by pyrolysis
became the hydrogen transfer solvent. The increase in pressure from 1 to 2 MPa
decreased coke yield, the difference being statistically significant at 99%
confidence. A further increase in pressure had less of an effect on coke yield,
even though coke yield decreased monotonically with an increase in pressure and
the change was statistically significant at 90% confidence. This behaviour
mimicked that of hydrogen transfer solvents; a little solvent made a big
difference, but further suppression of coke formation was only weakly dependent
on solvent concentration.

47
0
1
2
3
4
5
6
0 1 2 3 4 5 6 7 8 9
Pressure (MPa)
Co
ke y
ield
(w
t%)
0
2
4
6
8
10
12
Gas
yie
ld (
wt%
)
Batch reactor - coke
Semi-batch reactor - coke
Batch reactor - gas
Semi-batch reactor - gas
Figure 3-5: Coke yields (batch □, semi-batch ■) and gas yields (batch ○, semi-batch ●) obtained after pyrolysis of fresh Cold Lake bitumen at 400 °C for 1½ hours in batch and
semi-batch reactors at different pressure conditions.(11)
Sachanen pointed out that the influence of pressure depends on the composition of
the matrix, which is determined to some extent by pressure through VLE.(5) The
main implication is that observed effect of pressure will be sensitive to the matrix,
the nature of the VLE and how vapor material is removed from the system. This
will be illustrated by examples from literature, which initially seem to be in
contradiction to the present results, but are not contradictory when the
experimental details are considered.
When bitumen was pyrolyzed in the range 500-530 °C and 100-650 kPa as a thin
film, the effect of pressure on coke yield was inconclusive.(21) There was
evidence that as the film thickness increased that pressure increased coke yield at
~500 °C, but the same effect was not observed at 530 °C. The vapor phase was
diluted by N2 sweep gas flow and light product evolution was not restricted by
VLE; the main effect of pressure was on the nature and size of bubble evolution.
The effect of pressure on delayed coking of Athasbasca bitumen was investigated
in a pilot plant and it was found that coke yield increased monotonically with an
increase in pressure from 0.25 to 1.1 MPa.(22) During this investigation steam was

48
continuously fed to the coker and the hot and cold separator vessels were kept at
the same pressure as the coker. The removal of light material was dominated by
steam stripping. As the pressure was increased, the removal of lighter products
was not decreased, because the rate of removal was determined by the rate of
steam stripping. The temperature and duration of the operation were not reported
and at high temperature and long residence time, the effect of pressure on coke
yield may merely be a reflection of changes in stoichiometry. The increase in
coke yield may be due to a different aspect of the operation, namely the increase
in water content of the oil phase with increasing pressure. It was reported that
coke yield from bitumen pyrolysis at 430 °C for 30 minutes increased in the
order: toluene-bitumen mixture < neat bitumen < toluene-water-bitumen
mixture.(23) On the other hand, very different behaviour was seen when bitumen
was hydrothermally upgraded in such a way that the asphaltenes were extracted
into the water-rich phase.(7)
Coke yield is only one aspect of the impact of pressure on selectivity. Another
aspect to consider is the yield of light gases. The yield of light gases increased
with an increase in pressure (Figure 3-5). It was not a monotonic increase and it
was not clear why the highest gas yield was obtained at 4 MPa, or why the sample
standard deviation for the experiments at 4 MPa was much higher than usual. The
experiment at 4 MPa was repeated four times. The directional increase in gas
yield with increase in pressure supports the hypothesis that an increase in vapor
phase residence time leads to over-cracking. In order to confirm the specific
contribution of residence time, one can vary the volumetric ratio of the liquid and
gas phase, but this avenue of investigation was not pursued.
If Sachanen’s(5) view on the impact of pressure on pyrolysis is correct, then it is
likely that the outcome of experiments in a closed system (batch) at the same
pressure as an open system (semi-batch), would be different.
One set of experiments was performed in batch mode (Figure 3-5), where the
pressure was allowed to develop autogenously. The autogenous pressure reached
2.2 MPa. In a closed system all the light products formed during pyrolysis remain

49
in the reactor and the liquid phase concentration of light products is governed by
VLE. As anticipated, the lighter products produced during pyrolysis performed
the role of hydrogen transfer solvents and coke formation was lower in the batch
reaction than in any of the semi-batch reactions (Figure 3-5). Surprisingly, the
gas yield was not much different from that found during pyrolysis in semi-batch
mode at 1 and 2 MPa, even though batch mode represented the longest residence
time. The results indicated that the light gas yield was not primarily determined
by over-cracking of light products due to a longer residence time at pyrolysis
conditions.
The results indicated that even though operating pressure and VLE may play a
role, that there is another aspect that influences the yield distribution. The liquid
yield obtained from pyrolysis in a closed system was meaningfully higher than the
highest liquid yield obtained by semi-batch pyrolysis, which was obtained at 8
MPa (Table 3-5). The difference was statistically significant at 95 % confidence.
Table 3-5: Liquid yields obtained after pyrolysis of fresh Cold Lake bitumen at 400 °C
for 1½ hours in batch and semi-batch reactors at different pressure conditions.a
Description of experiment Liquid yield (wt %)
x s n
Semi-batch, 1 MPa 91.29 0.82 3
Semi-batch, 2 MPa 91.94 0.50 3
Semi-batch, 4 MPa 88.39 3.17 4
Semi-batch, 8 MPa 92.15 1.05 3
Batch, autogenous 94.34 0.78 4

50
3.3.5 Relationship of viscosity to coke yield
Viscosity is a measure of the resistance of flow. Viscosity may therefore be an
indicator of material to be restricted to the local environment, making it more
susceptible for in-cage reactions and coke formation. Since the viscosity of
bitumen is sensitive to solvent dilution,(24) and coke formation was suppressed
even at low solvent dilution (Figure 3-3), it was speculated that this might be
related to the decrease in viscosity.
1000
10000
100000
45 50 55 60 65 70 75 80 85
Temperature (°C)
Vis
co
sity
(m
Pa.s
)
Bitumen
Naphthalene:Bitumen = 0.1:1
Naphthalene:Bitumen = 0.25:1
Figure 3-6: Viscosity of neat bitumen (■), and mixtures with 0.1:1 (▲) and 0.25:1 (●)
ratios of naphthalene to bitumen.(11)
The viscosity of neat bitumen and bitumen mixed with naphthalene was measured
(Figure 3-6). Although there was a significant difference in the viscosity at low
temperature, the difference did not correlate with the change in coke yield. Even
when the data was expressed as function of temperature to estimate the viscosity
at reaction temperature (not that we suggest such an extrapolation is prudent or
accurate), no correlation was found. If the change in viscosity was partly
responsible for the change in coke yield, it was not apparent from the viscosity
data collected at temperatures below the pyrolysis conditions.

51
3.3.6 Explaining coke suppression in terms of the Wiehe-model
Wiehe(25) proposed a model that describes coke formation during pyrolysis. It so
happened that the model was developed based on the pyrolysis of the vacuum
residue fraction of Cold Lake bitumen at 400 °C, which is the heavy fraction of
the feed employed in this study. Key elements of the model are:
(a) There is an induction period in pyrolysis during which no coke is formed. The
length of the induction period before coke begins to form is related to the
solubility of the asphaltenes in the matrix. As long as the asphaltene fraction is
solubilized and does not form a separate liquid domain, coke formation is
suppressed.
(b) The asphaltene concentration reaches a maximum value at the end of the
induction period. The asphaltene concentration starts to decrease once coke starts
to form, suggesting a causal relationship between the decrease in the asphaltene
content and increase in coke content of the reacting mixture.
(c) Asphaltenes are more reactive than the maltenes and as pyrolysis progresses,
the asphaltenes are converted into more carbon rich compounds, also referred to
as asphaltene cores. Once these compounds reach the “solubility” limit, separate
ordered liquid phase domains (mesophase) are formed, which are dispersed in the
continuous liquid phase. The mesophase is deficient in hydrogen. Without
sufficient hydrogen to stabilize free radicals conversion continues to produce
toluene insoluble material until coke is finally formed.
(d) Not all asphaltenes are equally aggregated in the liquid phase. The asphaltene
molecules that are more aggregated tend to form a mesophase more easily.
Ultimately all aggregated asphaltenes end up in a mesophase and with prolonged
pyrolysis the aggregation number of the asphaltenes remaining in the liquid phase
approaches unity. That is, the asphaltenes in the pyrolyzed liquid that did not
form coke are unassociated. The asphaltenes also approach a constant H:C ratio
and the liquid phase reaches a constant ratio of asphaltenes to non-volatile
maltenes.

52
The size of the mesophase can be manipulated to inhibit coke formation. The
asphaltenes can be partly extracted into the water-rich phase during hydrothermal
conversion, which effectively prevents an oil-based mesophase from forming.(7)
Fine solids can be added to act as adsorption and nucleation sites for asphaltenes
to form smaller mesophase domains.(26)(27) Even though fine solids reduced the
rate of coke formation, with prolonged pyrolysis the coke yield was not altered,(26)
except in the case of native clay that already contained 6 % carbonaceous
material.(28) The size of the mesophase domains can also be manipulated by
solvent dilution. Smaller mesophase domains (and coke particles) are produced
by pyrolysis of more diluted bitumen in solvent mixtures,(27) as well as dilution
with solvents having a lower molecular mass.(26) As the concentration of the
bitumen in the solvent increases or the molecular mass of the solvent increases,
coalescence of mesophase domains increase to produce larger domains (and coke
particles). The rate of coke formation is accelerated by the formation of larger
mesophase domains, because the area to volume ratio decreases. The smaller
transfer area per unit volume effectively restricts the availability of hydrogen that
is supplied from the continuous phase to prevent free radical addition reactions.
Differently put, the probability of in-cage reactions is increased and thereby the
probability of coke formation in the more hydrogen deficient mesophase is
increased.
The Wiehe-model for open systems,(25) and the modification of the Wiehe-model
for closed systems,(12) employ a maximum solubility limit to describe when
asphaltene molecules will form a mesophase.
In order to apply the Wiehe-model to the present results, it should be recognized
that there are two opposing forces at work. On the one hand there is the solubility
limit of the asphaltenes that can be increased or decreased to suppress or promote
coke formation. On the other hand coke formation can be suppressed or promoted
by the presence or absence of transferable hydrogen to stabilize the pyrolysis
products.

53
Let us first consider the impact of the solubility limit. Light material and
asphaltenes compete for solvency in the bitumen.(29) It was found that coke
formation was suppressed with an increase in pressure (Figure 3-5) and even more
so in a closed system, despite the increase in light material. This was contrary to
the expectation that the solubility limit would be decreased to promote coke
formation. Further verification was obtained by performing the pyrolysis of
bitumen in a paraffinic solvent, n-decane (Table 3-6). The coke yield was 3.3 ±
0.9 %, which is not significantly different from 3.7 ± 0.3 % that obtained with
mesitylene (Figure 3-3). The paraffinic nature of the solvent, which should have
decreased asphaltene solubility, did not cause an increase in coke yield. The
higher light gas yield that was observed was as a result of thermal cracking of the
n-decane.
Table 3-6: Effect of a paraffinic solvent on the product yields from pyrolysis of aged Cold Lake bitumen at 400 °C for 1 hour at a 0.25:1 solvent to bitumen mass ratio.
a
Feed material Product yield (wt %)
liquid coke gas
x s x s x s
n-decane + bitumen 82.4 1.0 3.3 0.9 14.3 0.3
a Average (x) and sample standard deviation (s) of three experiments are reported.
One experiment was also performed at conditions that could potentially increase
the solubility limit. When aged bitumen was pyrolyzed for 1 h at 400 °C in a
mixture with a 90 % mesitylene concentration, the coke yield was 3.3 %. There
was no indication of increased suppression of coke formation. It should be noted
that a higher mesitylene concentration could potentially also result in an increase
in asphaltene aggregation size (increased correlation length),(30) but this does not
change the conclusion. Coke yield was not meaningfully affected.
At 20 % solvent concentration, there was little difference in the coke yield
obtained with tetralin, mesitylene, naphthalene and n-decane as solvents (Figure

54
3-3 and Table 3-6). Coke yield was also a weak function of solvent
concentration. It is therefore unlikely that the induction period, which is related
to the asphaltene solubility limit, can be used to explain observed the coke yields.
The results in this study pointed to hydrogen availability as the dominating factor
in controlling coke yield. In the context of the Wiehe-model, it indicated that
both physical and chemical factors played a role in coke suppression. Both the
size of the mesophase domains (physical factor), as well as the availability of
transferable hydrogen (chemical factor) mattered.
3.3.7 Phase behaviour
Phase behaviour is an important aspect to consider in the description of coke
suppression. Phase behaviour was not experimentally investigated and the
relative contribution of phase behaviour compared to chemical suppression of
coke formation was not determined. Some indication of the phase behaviour at
the experimental conditions can nevertheless be obtained from other studies.
The phase behaviour of an Athabasca vacuum residue and n-decane mixture up to
350 °C and 3 MPa was reported by Saber and Shaw.(31) At 350 °C there was a
concentration region from around 5-45 % bitumen where two liquid phases
(L1L2) co-existed at pressures above 1.8-2.2 MPa. The pressure above which an
L1L2 region was found increased with temperature. A three liquid phase
(L1L2L3) region was found in mixtures of Athabasca vacuum residue and n-
pentane at around 45 % bitumen at less severe conditions.(32) The additional
liquid phases were not identified as mesophases.
Based on the aforementioned literature,(31)(32) it seems likely that the experiments
that were conducted at high solvent concentration and high pressure were in a
region where more than one liquid phase was present. Based on the results
(Figure 3-3) coking was not promoted by conditions where the probability of
multiple liquid phases was highest. It seems that multiple liquid phases affect
coking only if one of the phases is a mesophase. The prediction of mesophase
formation is more challenging and was not attempted. Mesophase formation

55
depends not only on the composition and operating conditions, but also on the
mechanical and thermal history of the bitumen.(33)
3.3.8 Hydrogen availability and implications for industrial operation
Coke formation is the result of hydrogen disproportionation. Hydrogen
disproportionation is in turn regulated by local hydrogen availability. The
importance of hydrogen donation during pyrolysis to suppress coke formation is
undisputed. Hydrogen shuttling and dilution also contributed in their own ways.
Yet, the observed coke suppression could not be fully explained just in terms of
these three solvent-based effects even in the context of the Wiehe-model. Light
material, whether added as a solvent, or generated in situ during pyrolysis,
affected coke formation in other ways too. Observations from this study and
literature are:
(a) The coke yield after prolonged pyrolysis is affected only by the H:C ratio of
the feed mixture, since stoichiometry determines the hydrogen disproportionation
between different phases. Coke cannot be avoided if there is too little hydrogen.
The rate also has an effect. For example, during pyrolysis in the temperature
range 430-550 °C the gas phase products are more olefinic (lower H:C ratio) at
higher temperature and when the gas phase products are removed, the remaining
H:C ratio of the remaining product is indirectly increased, which resulted in coke
suppression.(34) For semi-batch systems it indicates that for prolonged operation it
is best to operate at higher temperatures and lower pressures, so that the pyrolysis
gases can be as olefinic as possible. Increased pressure during coking is
detrimental.(22) The beneficial effect of pressure that was observed (Figure 3-5) is
due to the change in the H:C ratio for incomplete pyrolysis. More generally put,
an increase in pressure to keep the H:C ratio of the liquid phase as high as
possible is beneficial for visbreaking-type of operation, because hydrogen
disproportionation is not complete. Pressure is not beneficial for delayed coking-
type of operation, because hydrogen disproportionation is driven to completion.
(b) Co-feeding a solvent, or retaining light pyrolysis materials that act as solvents,
suppresses coke formation. The solvent modifies the physical properties of the

56
mixture and is effective at concentrations as low as 10 % (Figure 3-3), the lowest
concentration tested in the work. The solvent suppresses coke formation, even
when the solvent itself does not have good hydrogen transfer properties. The
solvent does not have to be hydrogen-rich to do so. For example, in this study the
main solvents employed had lower H:C ratios than bitumen: bitumen (1.4) >
mesitylene (1.3) > tetralin (1.2) > naphthalene (0.8).
(c) At high solvent to bitumen ratio, the nature of the solvent determines whether
hydrogen donation becomes the dominant mechanism for coke suppression or not.
Hydrogen donor solvents can reduce coke formation significantly, by increasing
the H:C ratio of the bitumen and decreasing the H:C ratio of the solvent. In order
to re-use the solvent in a continuous process, the solvent must be regenerated by
hydrogen addition. This is typical of the design of direct liquefaction processes.(4)
The beneficial effect of hydrogen donor solvents is well-known.
(d) The most significant finding of the present study was to highlight the role of
dissolved light pyrolysis gases as coke suppressants. At the standard pyrolysis
conditions evaluated, 400 °C and 1 h, the lowest coke yield and highest liquid
yield was obtained by pyrolysis in a closed system (Table 3-5 and Figure 3-5).
Dissolved light gases contribute to the stabilization of free radicals. This led us to
question the commonly held assumption that the production of light gases during
pyrolysis is irreversible.
A reaction network that illustrates the action of light materials in coke suppression
is shown in Figure 3-7, which includes the bond dissociation energy (BDE) of the
reactions involved.(15) In the reaction network the light material is represented by
methane (CH4) and ethane (C2H6), and a phenyl radical (•C5H6) represents the
aromatic free radicals that are produced by pyrolysis of the bitumen. The
reasoning can be explained in the following way. The pyrolysis study by
Khorasheh and Gray(17) demonstrated that hydrogen can be transferred from
benzene to hexadecane cracking products, despite the higher BDE of aromatic C–
H bonds than that of aliphatic C–H bonds. The benzene in their study was present
at 95-99 % concentration. It highlighted the importance of reaction probability

57
(concentration), not just probability of reaction (rate constant). Thus, as the
concentration of light material is increased, the probability is increased that the
light material can be involved in reactions to stabilize free radicals that were
formed by pyrolysis. Even though the probability of abstracting hydrogen (•H) or
methyl (•CH3) radicals from neutral compounds decreases with increasing BDE,
the probability of such an event increases with increasing concentration of the
species. Of particular interest is that it is energetically equally demanding to
perform hydrogen transfer from toluene as methyl transfer from ethane (Figure 3-
7).
Figure 3-7: Reaction network to illustrate the potential contribution of light gas to suppress coke formation during pyrolysis. The light gases are represented by methane
and ethane. Pyrolysed aromatic products are represented by the phenyl radical. Homolytic bond dissociation energies (kJ∙mol
-1) at 25 °C are provided to give an
indication of bond strength. Although reactions are represented as mono-directional, all
reactions are reversible.(11)
The present work has some practical implications for industrial operation of
visbreaking processes. First, it has shown that it is possible to suppress coking
during visbreaking by co-feeding light hydrocarbons. The light hydrocarbons can
be in the C4 and lighter range. Second, it indicated that there is benefit to conduct
visbreaking at higher pressure, because it will increase the concentration of lighter

58
pyrolysis products in the liquid phase to serve the same purpose as an added
solvent. Third, it can be inferred from the present work that it is best to operate
with the least vapor volume fraction practical. Only light material dissolved in
the liquid phase will help to suppress coke formation. The concentrations of light
material in the vapor and liquid phases are determined by VLE, which is not
directly affected by the volumetric ratio of the phases, but the amount of material
in the vapor phase determines how much material is subject to potential over-
cracking, with no benefit to the process.
3.4. Conclusions
Coke suppression during mild pyrolysis of oil sands bitumen was studied
experimentally. Two approaches were followed. The first was to dilute the
bitumen to various degrees with solvents that had different hydrogen transfer
properties, namely, hydrogen donation (tetralin), hydrogen shuttling (mesitylene)
and a solvent with poor hydrogen transfer properties (naphthalene). The second
was to employ pressure and the method of operation (batch versus semi-batch) to
manipulate the light product concentration in the undiluted bitumen. Based on the
results, the following observations were made:
(a) Hydrogen donation was important, but the contribution of hydrogen donation
to suppress coke formation compared to the other solvent effects became
meaningful only at a solvent concentration of 50 % and higher.
(b) Hydrogen shuttling was important and the coke yield from the pyrolysis of
bitumen in a solvent active for hydrogen shuttling was consistently lower than for
a solvent with poor hydrogen transfer ability.
(c) The presence of a solvent was important, with the coke yield being halved at
20 % solvent concentration, irrespective of the hydrogen transfer capabilities of
the solvent. In fact, even at 1:10 solvent to bitumen ratio was coke suppression
significant. This is likely a physical effect, with transport in the mixture being
improved, but the explanation of the effect was not confirmed.
59
(d) The contribution of increasing dilution to coke suppression was minor, even
though coke yield decreased with increase in solvent concentration for all solvents
studied.
(e) Lighter products produced during bitumen pyrolysis also served as a solvent
and the coke yield could be manipulated through pressure in a semi-batch
pyrolysis. Increasing pressure caused more of the lighter products to remain in
the liquid phase, which decreased the formation of coke.
(f) The benefits of operating at increased pressure described in (e) is limited to
mild and incomplete pyrolysis, as is found in visbreaking processes. An increase
in operating pressure is not likely to benefit processes that involve more extensive
pyrolysis, as is applied during delayed coking.
(g) The light gas yield was not primarily determined by over-cracking of the light
products exposed to pyrolysis conditions for longer. In an open system, where
light products could leave the system, the liquid yield remained fairly constant
due to a trade-off between coke suppression and over-cracking to increase the
light gases. In a closed system this was not the case and the liquid yield
increased. It was postulated that this is related to the H:C ratio of the total
reacting mixture.
(h) The production of light gases could partly be explained by the need to produce
material that is capable of hydrogen transfer to moderate free radical propagation.
In the absence of such material, intramolecular free radical propagation by β-
scission can continue uninterrupted, since there are insufficient molecules to
transfer hydrogen to terminate or transfer the propagation process.
(i) The use of a paraffinic solvent and the increased production of light paraffinic
products did not result in increased coke formation. This suggested that the
solubility limit in the Wiehe-model, which determines when a separate liquid
domain is formed and leads to coke formation, was not an important factor in this
study. The results pointed to hydrogen availability as the dominating factor in
controlling coke yield. Interpreted in terms of the Wiehe-model, it indicated that

60
the size of the liquid domains and the availability of transferable hydrogen mainly
determined the coke yield.
(j) The results indicated that light gas formation during pyrolysis should not be
considered as an irreversible reaction product. The light gases continue to
participate in the reaction network, likely as hydrogen and methyl transfer agents,
to moderate the pyrolysis process and suppress coke formation.
(k) Ways to suppress coke and improve liquid yield during visbreaking were
suggested. First, by co-feeding light hydrocarbons (e.g. C4 and lighter) coke
formation can be suppressed. Second, it is beneficial to operate mild pyrolysis at
higher pressure to increase the concentration of light products in the liquid phase.
Third, it is preferable to limit the volume fraction of vapor-space.
References
(1) Rana, M. S.; Sámano, V.; Ancheyta, J.; Diaz, J. A. I. A review of recent
advances on processing technologies for upgrading of heavy oils and residua.
Fuel 2007, 86, 1216-1231.
(2) Leprince, P. Visbreaking of residues. In Petroleum refining. Vol. 3.
Conversion processes; Leprince, P. Ed.; Editions Technip: Paris, 2001, pp
365-379.
(3) Jones, D. S. J. Upgrading the ‘bottom of the barrel’. In Handbook of
petroleum processing; Jones, D. S. J., Pujadó, P. R. Eds.; Springer:
Dordrecht, 2006, pp 447-481.
(4) Whitehurst, D. D.; Mitchell, T. O.; Farcasiu, M. Coal liquefaction. The
chemistry and technology of thermal processes; Academic Press: New York,
1980.
(5) Sachanan, A. N. Conversion of petroleum. Production of motor fuels by
thermal and catalytic processes, 2ed; Reinhold: New York, 1948.
(6) Unzelman, G. H.; Wolf, C. J. Processes. In Petroleum processing handbook;
Bland, W. F., Davidson, R. L. Eds.; McGraw-Hill: New York, 1967, pp 3.20-
3.21.

61
(7) Vilcáeza, J.; Watanabe, M.; Watanabe, N.; Kishita, A.; Adschiri, T.
Hydrothermal extractive upgrading of bitumen without coke formation. Fuel
2012, 102, 379-385.
(8) Pereira, P.; Flores, C.; Zbinden, H.; Guitian, J.; Solari, R. B.; Feintuch, H.;
Gillis, D. Aquaconversion technology offers added value to E. Venezuela
synthetic crude oil production. Oil Gas J. 2001, 99 (20), 79-85.
(9) Gray, M. R.; McCaffrey, W. C. Role of chain reactions and olefin formation
in cracking, hydroconversion, and coking of petroleum and bitumen
fractions. Energy Fuels 2002, 16, 756-766.
(10) Monaghan, G. V.; Brown, W.A.; Pinchuk, R. J. A process for converting a
liquid feed material into a vapor phase product. Patent WO 2005/040310,
May 6, 2005.
(11) Zachariah, A.; Wang, L.; Yang, S.; Prasad, V.; De Klerk, A. Suppression of
coke formation during bitumen pyrolysis. Energy Fuels 2013, 27, 3061-
3070.
(12) Rahmani, S.; McCaffrey, W. C.; Gray, M. R. Kinetics of solvent interactions
with asphaltenes during coke formation. Energy Fuels 2002, 16, 148-154.
(13) Peng, M. Thermal cracking of asphaltene by addition of hydrogen donor
solvent; MSc thesis, University of Alberta, Edmonton, AB, Canada, 2012.
(14) Blanchard, C. M.; Gray, M. R. Free radical chain reactions of bitumen
residue. 213th ACS National Meeting, San Francisco, April 13-17, 1997,
FUEL-054.
(15) Blanksby, S. J.; Ellison, G. B. Bond dissociation energies of organic
molecules. Acc. Chem. Res. 2003, 36, 255-263.
(16) Savage, P. E. Are aromatic diluents used in pyrolysis experiments inert? Ind.
Eng. Chem. Res. 1994, 33, 1086-1089.
(17) Khorasheh F.; Gray, M. R. High-pressure thermal cracking of n-hexadecane
in aromatic solvents. Ind. Eng. Chem. Res. 1993, 32, 1864-1876.
(18) Heredy, L. A.; Fugassi, P. Phenanthrene extraction of bituminous coal. Adv.
Chem. Ser. 1966, 55, 448-459.
62
(19) Chawla, B.; Dabbagh, H. A.; Davis, B. H. Mechanism studies of coal
liquefaction in a nondonor solvent using 14C-labeled 1-methylnaphthalene.
Energy Fuels 1994, 8, 355-359.
(20) Zachariah, A.; De Klerk, A. Impact of solvents on thermal conversion of oil
sands derived bitumen. Prepr. Pap.-Am. Chem. Soc., Div. Energy Fuels
2013, 58 (1), 962-963.
(21) Gray, M. R.; Le, T.; Wu, X. A. Role of pressure in coking of thin films of
bitumen. Can. J. Chem. Eng. 2007, 85, 773-780.
(22) Govindhakannan, J.; Khulbe, C. Effect of pressure on delayed coking of
Athabasca bitumen. Prepr. Pap.-Am. Chem. Soc., Div. Petrol. Chem. 2010,
55 (1), 44-45.
(23) Osato, K.; Kato, S.; Aida, T. M.; Watanabe, M.; Smith, R. L. Jr.; Inomata, H.
The pyrolysis of oil sand bitumen in the presence of water and toluene. J.
Jpn. Inst. Energy 2012, 91, 303-310.
(24) Miadonye, A.; Latour, N.; Puttagunta, V. R. A correlation for viscosity and
solvent mass fraction of bitumen-diluent mixtures. Petrol. Sci. Technol.
2000, 18, 1-14.
(25) Wiehe, I. A. A phase-separation kinetic model for coke formation. Ind. Eng.
Chem. Res. 1993, 32, 2447-2454.
(26) Tanabe, K.; Gray, M. R. Role of fine solids in the coking of vacuum residues.
Energy Fuels 1997, 11, 1040-1043.
(27) Rahmani, S.; McCaffrey, W.C.; Elliott, J. A. W.; Gray, M. R. Liquid-phase
behavior during the cracking of asphaltenes. Ind. Eng. Chem. Res. 2003, 42,
4101-4108.
(28) Sanaie, N.; Watkinson, A. P.; Bowen, B. D.; Smith, K. J. Effect of minerals
on coke precursor formation. Fuel 2001, 80, 1111-1119.
(29) Hammami, A.; Ratulowski, J. Precipitation and deposition of asphaltenes in
production systems: A flow assurance overview. In Asphaltenes, heavy oils,
and petroleomics; Mullins, O. C., Sheu, E. Y., Hammami, A., Marshall, A.
G. Eds.; Springer: New York, 2010, p. 617-660.

63
(30) Sirota, E. B. Swelling of asphaltenes. Petrol. Sci. Technol. 1998, 16, 415-
431.
(31) Saber, N.; Shaw, J. M. On the phase behaviour of Athabasca vacuum residue
+ n-decane. Fluid Phase Equilibria 2011, 302, 254-259.
(32) Shaw, J. M.; Zou, X. Phase behavior of heavy oils. In Asphaltenes, heavy
oils, and petroleomics; Mullins, O. C., Sheu, E. Y., Hammami, A., Marshall,
A. G. Eds.; Springer: New York, 2010, p. 489-510.
(33) Bagheri, S. R.; Masik, B.; Arboleda, P.; Wen, Q.; Michaelian, K. H., Shaw, J.
M. Physical properties of liquid crystals in Athabasca bitumen fractions.
Energy Fuels 2012, 26, 4978-4987.
(34) Zhao, Y.; Wei, F.; Yu, Y. Effects of reaction time and temperature on
carbonization in asphaltene pyrolysis. J. Petrol. Sci. Eng. 2010, 74, 20-25.

64
Chapter - 4 Solvent Deasphalting and Visbreaking
Sequence
Abstract
Solvent deasphalting (SDA) followed by visbreaking enables higher visbreaking
conversion before the onset of coking. This processing sequence is industrially
practiced. It was proposed that at milder visbreaking conditions there might be
benefit to reverse the process steps, so that transferable hydrogen and methyl
groups in the asphaltenes fraction can be incorporated into the liquid product
before SDA. At a visbreaking temperature of 380 °C no meaningful benefit could
be demonstrated for visbreaking followed by SDA compared to SDA followed by
visbreaking. Yet, some observations suggested that the premise of transferring
hydrogen from the asphaltenes to enrich the aliphatic hydrogen content of the
liquid product should not be rejected. The refractive index, micro carbon residue
yield and fraction of aliphatic hydrogen all indicated that a slightly higher
aliphatic content was obtained when low temperature visbreaking was followed
by SDA.
Key Words: Solvent Deasphalting, Visbreaking, asphaltenes.

65
4.1 Introduction
One of biggest challenges in the production of bitumen from the Canadian
oilsands is the lack of bitumen fluidity (See Chapter-2, section 2.2.2 Viscosity).
Depending on the origin of the oilsands derived bitumen, its viscosity is in the
range of 102-104 Pa∙s at 20 °C and its density is in the range 6-12 °API (990-1030
kg∙m-3). Once the bitumen is recovered, the poor fluidity remains a problem. In
order to transport the bitumen by pipeline to market, the viscosity and density
must be reduced to 350 cSt and 940 kg∙m-3 (19 °API) at minimum pipeline
temperature (7.5 °C).(1)
Industrially there are several ways in which bitumen viscosity and density are
decreased. The process of interest in this study is the use of solvent deasphalting
(SDA) in combination with visbreaking, because it also has potential for
application on smaller scale in field upgrader units.
The sequence of process steps that is industrially practiced is SDA followed by
visbreaking (Figure 4-1). This is a logical sequence, because conversion in the
visbreaker is limited by coke formation.(2) The induction period before the onset
of coke formation depends on the asphaltene content.(3) Removal of the
asphaltenes by SDA before visbreaking enables higher conversion of the
deasphalted oil (DAO) during visbreaking and can therefore improve viscosity
reduction.

66
Figure 4-1: Industrially practised processing sequence for upgrading.(4)
So, why is this sequence the topic of investigation? First, it was found that the
inverse relationship between temperature and time for viscosity reduction by
visbreaking did not hold true at lower temperature visbreaking of oilsands derived
bitumen.(5) Second, it was found that coke formation was influenced by both
physical and chemical effects (See Chapter -3, 3.3.2 Effect of solvent dilution on
coke yield). The presence of an aromatic solvent, irrespective of its hydrogen
transfer properties, suppressed coking (physical effect).(6) The overall availability
of transferable hydrogen and methyl-groups, and not just donor-hydrogen, also
suppressed coking (chemical effect) even though coking was suppressed more
when the hydrogen and/or methyl groups could be donated permanently.
It was argued that if the asphaltenes fraction from bitumen possesses hydrogen
and methyl groups that can be donated; there might be benefit in harvesting this
hydrogen-rich material before rejecting the asphaltenes by SDA. Furthermore, if
the visbreaking conditions were less severe, it may well be possible to
significantly decrease the viscosity of the total bitumen before coke formation
limits conversion.
bitumen
solvent
deasphalting
solvent
asphaltenes
visbreaker
furnace
soaker
Upgraded bitumen
pyrolysis gas

67
The most advantageous sequence of SDA and visbreaking was not clear for
visbreaking of oilsands derived bitumen at temperatures below 400 °C. The
objective of this study was to evaluate the impact of this sequence experimentally.
4.2 Experimental
4.2.1 Materials
The experimental investigation was performed with Canadian oilsands derived
bitumen from the Cold Lake region, which was supplied through the sample bank
of the Institute for Oil Sands Innovation (IOSI) at the University of Alberta. The
feed was characterized (Table 4-1).
Table 4-1: Properties of Cold Lake Bitumen
Property Cold Lake Bitumen
Density at 30 °C (kg∙m-3) 1013.2 ± 1.0
Refractive index at 30 °C 1.5788 ± 0.0032
Viscosity at 60 °C (Pa∙s) 9.55 ± 0.15
Asphaltene content (wt %) 18.6 ± 1.2
Micro carbon residue (wt %) 17.8 ± 0.5
Elemental analysis (wt %)
C 82.9 ± 0.1
H 10.1 ± 0.01
N 0.6 ± 0.002
S 4.9 ± 0.03
O (by difference) 1.5
68
4.2.2 Equipment and procedure
There were two steps in the experimental procedure. Comparative analysis of
Cold Lake bitumen was done when it was subjected to solvent deashphalting
followed by visbreaking and vice versa. All experiments were performed in a
batch reactor placed in a fluized sand bath. The entire setup was constructed using
Swagelok SS 316 tubing and fittings. A thermocouple was fitted inside the micro
batch reactor to accurately measure the temperature of the reactants. The detailed
experimental apparatus was the same as described in Chapter-3. A typical
experiment used 8-10 g of bitumen. Reactors were purged three times with
nitrogen before pressurizing it to 4 MPa. This was repeated three times, material
balance calculations made and standard deviations reported. The heat up time was
5 minutes and the cool down period was 4 minutes.
The products after quenching were extracted with methylene chloride and filtered
through a 0.22 μm pre-weighted filter paper. 98% of the methylene chloride was
stripped out by rotary evaporation at 45 °C and 850 mbar for 20 minutes. The
products were dried overnight at 50 °C to constant mass. Material balances
ensured complete removal of methylene chloride. This was followed by a solvent
deasphalting of the thermally treated oil. The asphaltene content was used was
found using the ASTM recommended procedure (ASTM D6560-12).(7) A ratio of
40:1 of n-pentane to feed was used, the mixture subjected to magnetic stirring for
24 hours and vacuum filtered through a pre-weighted 0.22 μm filter paper.
Pentane was rotary evaporated and the now deasphalted oil was dried for 24 hours
to constant mass. Mass balances ensured complete pentane removal from
deasphalted oil. The reverse was done by deasphalting Cold Lake bitumen first
followed by thermal treatment before both sets of products were analysed and
compared.
4.2.3 Analyses
The following analytical instruments were employed to characterize the products:

69
(a) Density: Measurements were made using an Anton Paar DMA 4500M. The
instrument was calibrated with distilled water and could be temperature controlled
to an accuracy of 0.01°C. Density measurements were measured to 0.00001
g/cm3.
(b) Refractive index: Mesurements were made using an Anton Paar Abbemat
200 and determined relative to air using the sodium D-line (589 nm). The
refractometer was factory calibrated with official standards from the national
metrology institute of Germany and the refractive index results are accurate to
±0.0001 nD. The temperature was controlled at to an accuracy of ± 0.05 °C and
all measurements were made at 30°C.
(c) Viscosity: Anton Paar RheolabQC with C-CC17/QC-LTC measuring cup. The
RheolabQC was calibrated with a Newtonian viscosity standard specimen
(blended hydrocarbons) whose kinematic viscosity was measured using a
capillary viscosimeter of the Ubbelohde type, which was traceable to the national
standard of the viscosity.
(d) Micro carbon residue (MCR): The micro carbon residual percentage was
calculated from analysis using a Mettler Toledo thermogravimetric analyzer
(TGA/DSC). This instrument was equipped with the ultra-micro balance cell and
DTA sensor. The instrument was capable of measuring simultaneous heat flow
and weight change of samples. The micro carbon residual percentage analysis was
carried out with nitrogen as carrier gas. All micro carbon residue measurements
were determined in accordance with the standard test method ASTM D4530.(8)
(e) Elemental analysis: CHNOS analysis was performed on a thermo Scientific
Flash 2000 CHNS-O Organic Elemental analyzer.
(f) Proton nuclear magnetic resonance (1H NMR): The 1H Nuclear Magnetic
Resonance (NMR) spectra were obtained using a Nanalysis 60 MHz NMReady-
60 spectrometer. The instrument was pre calibrated with D-chloroform. 0.2g of
oil was dissolved in 1 ml of D-chloroform, placed in 5 mm NMR tubes and
analysed using the following parameters: spectral width 14 ppm; digital
resolution: 0.03 H; number of scans per sample: 16; active scan time: 4.7 seconds.
The average scan time was 14.7 seconds and 4000 points were recorded per scan.

70
4.3 Results and Discussion
4.3.1 Material balance.
Visbreaking and SDA were performed in the same way, but in different
sequence for the two sets of experiments. The material balances are reported
(Table 4-2). The yields are quite similar, with SDA-Visbreaking resulting in a
slightly higher liquid yield than Visbreaking-SDA. The coke found during
Visbreaking-SDA is mineral matter with associated bitumen and not polyaromatic
coke.(5) When SDA is performed first the mineral matter is removed with the
asphaltenes. Based on the material balance, there is no benefit to perform
visbreaking on the total bitumen. In fact, visbreaking of the DAO resulted in a
marginally higher liquid yield, 80.1 ± 0.3 versus 79.2 ± 0.4, compared to
visbreaking of the bitumen.
Table 4-2: Material Balances for Different Process Sequences with Visbreaking
Conducted at 380 °C for 0 minutes
Products Product yield (wt %)
SDA-Visbreaking Visbreaking-SDA
Gases 0.7 ± 0.3 1.1 ± 0.5
Liquids 80.1 ± 0.3 79.2 ± 0.4
Solids
asphaltenes before 18.6 ± 1.2 0
asphaltenes after 0.6 ± 0.03 a 18.3 ± 1.2
coke 0 1.4 ± 0.04
a SDA was repeated on the visbroken product from the SDA-Visbreaking sequence to
determine whether additional asphaltenes were formed during visbreaking.

71
4.3.2 Liquid product characterization
The liquid products from SDA followed by visbreaking and visbreaking followed
by SDA were characterized in terms of density, refractive index, viscosity, micro
carbon residue and elemental composition (Table 4-3). As with the material
balance, the processing sequence did not seem to affect the product properties in a
meaningful way.
In the introduction it was postulated that it might be beneficial to retain the
asphaltenes for visbreaking (VB), because the asphaltenes can also be a source of
transferable hydrogen and methyl-groups. The following observations were
made:
(a) It was found that the refractive index of the liquid product from
visbreaking followed by SDA was slightly lower than that of the liquid from
SDA followed by visbreaking. When the refractive index was measured at
temperatures in the range 20-40 °C (Figure 4-2), this difference was consistently
observed. A lower refractive index is indicative of a product with more aliphatic
character, i.e. both paraffinic and naphthenic character.(9)
(b) The MCR value was consistent with the refractive index, with the liquid
product from SDA followed by visbreaking being more prone to form coke.
Furthermore, when the MCR content of the deasphalted oil before visbreaking
was measured, it was 21.8 ± 4.1 wt%. It suggested that SDA did not reduce the
coking tendency of the liquid, because the MCR of the bitumen was 17.8 ± 0.5
wt %.

72
Table 4-3: Characterization of Liquid Products Obtained by the Different Process
Sequences
Property SDA-Visbreaking Visbreaking-SDA
Density at 30 °C (kg∙m-3) 984.1 ± 1.3 984.0 ± 1.9
Refractive index at 30 °C 1.5439 ± 0.0003 1.5429 ± 0.0006
Viscosity at 60 °C (Pa∙s) 0.75 ± 0.13 0.89 ± 0.10
MCR (wt %) 10 a 6 a
Elemental analysis (wt %)
C 84.3 ± 0.05 84.2 ± 0.08
H 10.7 ± 0.01 10.7 ± 0.01
N 0.4 ± 0.06 0.4 ± 0.08
S 4.0 ± 0.02 4.1 ± 0.008
O (by difference) 0.6 0.6
a Based on a single analysis only.
Figure 4-2: Refractive index variation from 20-40°C for a)--◊-- bitumen feed b) (--■--) Thermal Treatment+ SDA and c) (…▲…) SDA + Thermal Treatment
1.535
1.54
1.545
1.55
1.555
1.56
1.565
1.57
1.575
1.58
1.585
1.59
20 25 30 35 40
Refr
acti
ve I
nd
ex (
nD
)
Temperature (°C )
Feed
TT+SDA
SDA+TT

73
Based just on the results presented here, there was a risk of over-interpreting the
data. It was necessary to look at a more direct measurement of the nature of the
hydrogen in order to verify the inferences.
4.3.3 Hydrogen disproportionation
The bitumen feed and the liquid products obtained by the two different process
sequences of SDA and visbreaking, were analyzed by 1H NMR (Table 4-4). The
cut-off between aliphatic and aromatic hydrogen was taken as δ = 6.3 ppm, with
lower shift-values being aliphatic and higher shift values being aromatic. Olefinic
hydrogen overlaps the cutoff, as does hydrogen attached to some heteroatom
functional groups.(10) It should be pointed out that the aliphatic versus aromatic
hydrogen distribution is a poor predictor of the amount of aliphatic versus
aromatic carbon. However, it is a direct measure of the nature of the hydrogen
distribution, which was of interest to our study.
The observed changes in the aliphatic hydrogen content between the bitumen feed
and upgraded products were minor. In isolation the changes were not statistically
meaningful, but it supported the observation that the liquid product from
visbreaking-SDA contained more potentially transferable (aliphatic) hydrogen
than the liquid product from SDA-visbreaking.
Table 4-4:
1H NMR Characterization of Liquids
Liquid sample Aliphatic H-content (wt %)
Cold Lake bitumen feed 94.5 ± 0.6
SDA-Visbreaking liquid 92.8 ± 0.9
Visbreaking-SDA liquid 93.9 ± 0.6

74
4.4 Conclusions
The present study investigated the potential advantage of retaining asphaltenes in
the liquid feed to low temperature visbreaking, in order make use of the
transferable hydrogen in the asphaltenes. At the selected visbreaking temperature,
380 °C, no meaningful benefit could be demonstrated for visbreaking followed by
SDA over SDA followed by visbreaking.
Although the results cannot be claimed to represent statistically meaningful
differences, some observations suggested that the initial premise of transferring
hydrogen from the asphaltenes to enrich the aliphatic hydrogen content of the
liquid product, should not be rejected:
(a) The refractive index of liquids from visbreaking-SDA indicated that it was
more aliphatic in character.
(b) The MCR of liquids from visbreaking-SDA indicated that it was less prone
to form coke, i.e. more aliphatic.
(c) The liquids from visbreaking-SDA had a higher percentage aliphatic
hydrogen than that of SDA-visbreaking based on 1H NMR.
References
1) De Klerk, A.; Gray, M. R.; Zerpa, N. Unconventional oil and gas: Oilsands.
In Future energy. Improved, sustainable and clean options for our planet ,
2ed; Letcher, T.M. Ed.; Elsevier: Amsterdam, 2014, p. 95-116.
2) Leprince, P. Visbreaking of residues. In Petroleum refining. Vol. 3.
Conversion processes; Leprince, P. Ed.; Editions Technip: Paris, 2001, p.
365-379.

75
3) Wiehe, I. A. Process chemistry of petroleum macromolecules; CRC Press:
Boca Raton, FL, 2008.
4) Zachariah, A.; De Klerk, A. Solvent Deasphalting and Visbreaking
Sequence. Prepr. Pap.-Am. Chem. Soc., Div. Energy Fuels 2014 (Accepted
– In press).
5) Wang, L.; Zachariah, A.; Yang, S.; Prasad, V.; De Klerk, A.
Visbreaking oilsands derived bitumen in the temperature range 340 – 400
°C. Energy Fuels 2014 (DOI: 10.1021/ef501158p).
6) Zachariah, A.; Wang, L.; Yang, S.; Prasad, V.; De Klerk, A. Suppression of
coke formation during bitumen pyrolysis. Energy Fuels 2013, 27, 3061-
3070.
7) ASTM D6560-12: Standard test method for Determination of Asphaltenes
in Crude Petroleum and Petroleum Products; ASTM: West Conshohocken,
PA, 2012.
8) ASTM D4530: Standard test method forDetermination of Carbon Residue
(Micro Method); ASTM: West Conshohocken, PA, 2011.
9) Sachanen, A. N. The chemical constituents of petroleum; Reinhold: New
York, 1945, p. 102-107.
10) Silverstein, R. M.; Bassler, G. C.; Morrill, T. C. Spectrometric
identification of organic compounds, 4ed; Wiley: New York, 1981.

76
Chapter - 5 Coke, Viscosity and Asphaltene Regimes
during bitumen pyrolysis
Abstract
The influence of pyrolysis time on bitumen properties was investigated in this
chapter. Literature describes an induction period before coking. The reason for
this investigation was to answer the question: Was the observed coke suppression
in the previous chapters an extension of the induction period? Were we just
delaying the inevitable or were we causing a meaningful suppression? From our
previous studies involving coke suppression, it seemed like both the size of the
mesophase domains as well as the availability of transferable hydrogen played a
role in coking. The initial intention was to understand if there was an extension in
the induction period. When time was varied a series of regimes were observed
during neat bitumen pyrolysis that made us probe neat bitumen pyrolysis further.
The effect of time on resultant physical properties and asphaltene content of the
pyrolysis liquids was looked at closely. The study can be applied to not just
visbreaking but delayed coking as well.
Keywords: Bitumen pyrolysis, coke, induction period, viscosity, asphatlene
content, mesophase.

77
5.1 Introduction
The Alberta oil sands have always been associated with the terms high viscosity,
low hydrogen/carbon ratio, low fluidity. As part of a study, the volume of
condensate required to dilute bitumen to make it more fluid is expected to more
than double to 750,000 barrels per day by 2020.(1) Opportunity to improve this
current way of processing by reducing the volume of condensate being used
today is evident. Apart from dilution, thermal treatment has been used to reduce
viscosity.
Visbreaking is a process technology that combines time, pressure and
temperature to reduce viscosity. These units, more common in smaller refineries
in Europe than North America have the prime goal of having a short enough
residence time at a specified temperature where there is no significant coke
production. Depending on the type and severity of operation, conversion is
typically the order of 6-12% and temperatures and pressures are around 430 °C
to 460 °C and around 1 MPa. (2)(3)(4)
Thermal conversion at these temperatures point to free radical chemistry running
reaction mechanisms.(5) Once free radicals are formed, the probability of free
radical addition exists, because of the high reactivity of these species. This causes
addition products with higher molecular weight structures to be formed. This
defies the purpose of the operation. In order to operate at maximum efficiency
one needs to minimize coking so that liquid yields are improved.(6)
Literature describes an induction period before coke formation starts taking
place.(7) This has been described in detail in Chapter-2, (2.3.1 Mechanism of
Coke formation). The key elements of the model are as follows:
a) The length of this induction period is related to the solubility of the
asphaltenes in the bitumen matrix. As long as they remain soluble and do not
form a separate liquid domain, coke formation is suppressed.
b) At the end of the induction period, the asphaltene concentration reaches a
maximum value. At this point, the asphaltene concentration starts to decrease
78
once coke starts to form. This suggests some relationship between the
asphaltenes and coke make.
c) Asphaltenes are a reactive and are converted into more carbon rich
compounds also called asphaltene cores. Once these cores reach the solubility
limit, separate ordered liquid phase domains called mesophase is formed.
d) With local hydrogen availability being scarce, free radical conversion
continues to produce higher carbon rich material until coke is formed.
In chapter-3 the investigation probed how solvents can moderate pyrolysis
reactions by hydrogen transfer and cause suppression of coke by capping free
radicals. The previous investigation however employed one specific reaction
time. This did not take into account the induction period of the feed. This
directionally pointed to ask the question: a) Were we operating within the
induction period? b) Was the observed coke suppression just an extension of the
induction period or was it a true suppression because of hydrogen donation,
shuttling and transfer? In order to investigate this, we decided to vary the reaction
time when bitumen was pyrolysed in batch reactors.
During the course of the study it was observed that there were a series of regimes
during neat bitumen pyrolysis that needed to be understood first before analyzing
data with solvent addition. It was desired to understand coke suppression but also
the effect of time on product quality as determined by viscosity, hydrogen/carbon
(H/C) ratio, asphaltene content and Micro carbon residue (MCR).
Interesting observations were made about the effect of conversion time on liquid
viscosity at low temperatures. The influence of time on viscosity was studied by
Wang et al.(8) Reactions were performed in a semi batch reactor at lower
temperatures (340 °C to 400 °C). Whatever the temperature investigated, there
seemed to be an initial drop in viscosity of bitumen followed by an increase. Our
experiments were performed in batch mode to a) repeat the time- viscosity
experiments and b) understand what properties were actually causing this change.

79
5.2Experimental
5.2.1 Materials
The experimental investigation was performed with Canadian Cold Lake bitumen
and the feed was characterized (Table 4-1). Even though this study dwelled more
on neat bitumen pyrolysis as a function of reaction time, liquefied n-butane was
used to further understand the solvent effect on induction time. Liquefied butane
(99.0%) was provided by Praxair for light gas studies and nitrogen (99.999%)
used for purging reactors was also supplied by Praxair.
5.2.2 Equipment and Procedure
All neat bitumen pyrolysis experiments were performed in micro batch reactors.
The reactors were placed in a fluidized sand bath. The experimental setup and
procedure was exactly the same as in Chapter-3 (see 3.2.2 Equipment and
Procedure (Figure 3-1)).
The experimental procedure where bitumen was diluted with n-butane before
pyrolysis was slightly different even though the reactor setup was the same.
Similar stainless steel batch reactors were used. In a typical experiment about 8
grams of bitumen was used. The entire setup was constructed using Swagelok SS
316 tubing and fittings. The reactor threads were coated with vacuum grease (Vac
Goop provided by Swagelok), after the reactor was charged with Cold Lake
bitumen. The reactor was then purged three times with nitrogen to remove any air
present. It was desired to add n-butane in the liquid phase based on results from
Chapter-3 (3.3.8 Hydrogen availability and implications for industrial operation).
Since butane boils at -1 °C the temperature to which the reactor needed to be
cooled was below this. In our case -17 °C to give a sufficient temperature
differential so as to a) have enough time to charge the reactor and b) to allow
butane to continue to remain in the liquid phase. The reactor was connected to the
butane cylinder. The valve of the butane cylinder was opened followed by the
reactor valve (V01). Both valves were shut after a predetermined amount of time.
The amount of butane added to the reactor was gravimetrically measured. This

80
was done using a Mettler Toledo ML 3002 balance which had a 3200 capacity
with 0.01g readability In all experiments the amount of butane added was 12.11 ±
1.19 wt%. The reactor setup was allowed to warm up to room temperature. Once
the setup was at 25 °C, the reactor was connected to the nitrogen cylinder and
pressurized to 4 MPa. The 4 MPa pressure difference between the nitrogen line
and the batch reactor ensured that only the nitrogen gas entered the reactor. This
was checked by measuring the mass of nitrogen by weight and by ideal gas law
calculations for the volume of reactor and the final weight of the total reactor
gravimetrically.
Once the temperature inside the reactor increased to 25 °C, the reactor was placed
in the fluidized sand bath. The heat up time for the reactants to reach 400 °C was
6 minutes and the cool down period was 6 minutes. This was not counted as part
of the duration of reaction time. After reaction, the micro reactor was vented and
gases were collected in a gas bag. The procedure for dealing with the dissolved
butane is described below. Liquids produced were extracted with methylene
chloride and filtered through a 0.22 µm filter paper to obtain methylene chloride
insoluble solids (coke) and maltenes. Pressurized reactors were weighed before
and after reaction as well as after depressurization. This was the standard method
to determine both liquid and gas yield gravimetrically.
Material balances were challenging because it was noticed only later that at least
6 hours were required for dissolved butane to completely bubble out of the
bitumen matrix. Since the coke and asphaltenes would not contain any butane and
were found on a bitumen basis, material balances were reported as coke,
asphaltene content and (maltenes + gas), where the maltenes + gas fraction was
found by difference. One could determine the solubility of butane in bitumen at
room temperature in literature used during the vapor extraction (VAPEX) process
and find the mass of liquids by quantifying butane solubility. But this process
does not take place at elevated temperatures like 400 °C and thus does not account
for butane cracking also taking place during pyrolysis. Hence it was decided to

81
report mass balances in this manner. The asphaltene content in the Cold Lake
bitumen feed that was used was determined in accordance with the standard test
method. Precipitated asphaltenes were dried overnight in a vacuum oven at 75 °C.
The liquids which contained 2-4 % methylene chloride and residual butane were
devolatilized for 12 hours at 50 °C. This allowed for all methylene chloride to be
completely removed just like methylene chloride was removed in every neat
bitumen batch study. Viscosity analysis, refractive index and 1H-NMR analysis
gave true values of undiluted pyrolysis liquids.
5.2.3 Analysis
The pyrolysis gas was analysed by gas chromatography (GC) on an Agilent
7890A equipped with a flame ionization detector (FID) and a thermal
conductivity detector (TCD). Separation was performed on a HapSep R column
2.44 x 0.003m (8 ft x 1/8 inch). Carrier gas used for analysis was helium with a
constant flow of 25ml/min. The injector temperature was set at 200 °C. The
temperature program used was injection of sample at 70 °C and hold for 7
minutes, then ramping at 10 °C/min to 250 °C and holding for 2 minutes,
followed by ramping at 30 °C/min to 300 °C and holding for 8 minutes.
Viscosity analysis of bitumen feed and bitumen diluted with solvent was
performed using an Anton Paar RheolabQC viscometer. The RheolabQC was
initially factory calibrated with a Newtonian viscosity standard specimen (blended
hydrocarbons) whose kinematic viscosity was measured using a capillary
viscosimeter of the Ubbelohde type, which was traceable to the national standard
of the viscosity. The sample measuring cup used was C-CC17/QC-LTC and an
average sample of 4 grams was used during analysis. The shear rate used for all
viscosity measurements was 10 s-1.
Refractive Index (RI) measurements were performed using an Anton Paar
refractometer Abbemat 200. RI measurements were determined relative to air

82
using the sodium D-line (589 nm). The refractometer was factory calibrated with
official standards from the national metrology institute of Germany and the
refractive index results are measured to ±0.0001 nD. In our experiments, all
measurements were made at 30°C. The instrument had been able to control
temperature values to an accuracy of ± 0.05 °C.
CHNOS analysis was performed on a thermo Scientific Flash 2000 CHNS-O
Organic Elemental analyzer.
In order to visually distinguish the coke formed at different reaction times, images
of coke and asphaltenes were taken using a Carl Zeiss Discovery V.20
stereomicroscope. This lens had a zoom range of 20:1, was capable of a
magnification of 345X. The maximum resolution of the camera was 1000 {line
pairs (LP)}/mm. A resolution of 10 lines per millimeter implies 5 dark lines
alternating with 5 light lines or 5 line pairs per millimeter (5LP/mm). Images were
taken using reflected light at 20X and 25X magnifications. Analysis of the
mesophase was done using a Zeiss Axio observer inverted microscope. Cross
polarized light was used to capture images of the mesophase. The lens used was
an EC EPIPLAN 5x/ 0, HD 422030-9960 lens.
The micro carbon residue (MCR) values were determined by thermogravimetric
analysis (TGA), using a Mettler Toledo Model TGA/DSC1 LF FRS2MX5. This
instrument was equipped with the ultra-micro balance cell and DTA sensor. The
resolution of the balance was 0.1/1 µg. The instrument was capable of measuring
simultaneous heat flow and weight change of samples. The micro carbon residual
percentage analysis was carried out with nitrogen as carrier gas. All micro carbon
residue measurements were determined in accordance with the standard test
method ASTM D4530.
The 1H Nuclear Magnetic Resonance (NMR) spectra were obtained using a
Nanalysis 60 MHz NMReady-60 spectrometer. The instrument was pre calibrated

83
with deuterated chloroform (D-chloroform). 0.2g of oil was dissolved in 1 ml of
D-chloroform, placed in 5 mm NMR tubes and analysed using the following
parameters: spectral range 14 ppm; digital resolution: 0.03 H; number of scans per
sample: 16; active scan time: 4.7 seconds. The average scan time was 14.7
seconds and 4000 points were recorded per scan. All spectra obtained were
analysed using Mnova NMR software. Exported data was baseline corrected
using a multipoint baseline correction method. All points were picked using this
method to baseline correct the spectrum obtained. Peak integration was performed
on the baseline corrected spectrum using aliphatic and aromatic hydrogen ranges.
The spectral widths were determined from literature and integration was
performed over that specific range. The ranges are mentioned in section 5.3.4 1H-
NMR product analysis
5.3 Results and Discussion
5.3.1The Induction Period of Coke Formation
Based on the temperature, pressure and time exposed to the atmosphere, the
characteristics (viscosity, refractive index, micro carbon residue and asphaltene
content) of the feed change notably. This was clearly seen in Chapter-3 when we
compared the asphaltene content, MCR and carbon, hydrogen content of the aged
and fresh bitumen (Table 3-1). It was therefore important that the feed be
characterized (Table 4-1) and the induction period of coke formation for this feed
be determined (Figure 5-2). Different bitumen feeds have different induction
periods.
When bitumen is pyrolysed, coke, gas and pyrolysis liquids are products formed
in different proportions as a function of pyrolysis time. When batch reactor
pyrolysis of neat bitumen was done, four regimes were observed during which
bitumen properties changed. The induction period of the Cold Lake bitumen
sample we used was found to be 80 minutes (Figure 5-1). The prevailing view
about the formation of coke was that coke was formed by a series of
polymerization and condensation steps from the lightest to the heaviest

84
fractions.(9)(10) During pyrolysis, there is cracking leads to formation of free
radicals. As explained in section 2.3 Thermal Cracking, this leads to hydrogen
disproportionation and radical addition that causes formation of heavier products.
However, later studies showed that the aromatic fragments initially form lower
molecular weight and more aromatic compounds while remaining soluble in the
matrix.(7) This occurs during the induction period. Only when these higher
aromatics start to combine to form higher molecular weight species, does a phase
separation step (mesophase formation) occur after which coke is formed. The
induction period of the bitumen in our study was 80 minutes.
Figure 5-1: Coke yield (-▲-) and Micro Carbon residue (..■..) of thermally treated
bitumen at different times
Coke, (defined as methylene chloride insoluble solids) was filtered and analyzed
under a stereomicroscope under reflected light. Based on the pyrolysis time, there
seemed to be four major classifications of coke structurally:
1.3
4.3
7.3
10.3
13.3
16.3
19.3
0 50 100 150 200 250 300
Co
ke Y
ield
/Mic
ro C
arbo
n R
esi
due
(wt%
)
Time (Minutes)
Coke Yield
MCR
Coke-2 Coke- 4 Coke-1
E 1
Coke-3

85
1) Neat bitumen had 1.3 ± 0.05 percent by weight solids in the matrix. This
was consistently seen during the induction period (Time regime: 0-80
minutes). These were brownish platelet type of structures when vacuum
filtered. This is seen in figures 5-2A-a and 5-2A-b. The solids (Coke-1)
were easily filterable through a 0.22 µm filter paper.
2) After the induction period of coke formation (Time regime: 80-180
minutes) the platelet type of structure continued to be observed but the
color of the coke (Coke-2) darkened (Figure 5-2A-c). This darkening may
be attributed to the development of carbonaceous residue over the solids.
The difference can be seen in comparing Figure 5-2A-a/b to Figure 5-2A-
c. Coke-2 was easily filterable through a 0.22 µm filter.
3) For coke-3 (Time regime: 180-270 minutes), filtration of coke was
difficult if not impossible because of plugging. If fine coke formed was
around the size range of the filter pore size, it would explain why filtration
was difficult. In order to visually see the structure of the coke, a droplet of
unfiltered pyrolysis liquids was diluted 50 times in methylene chloride to
remove any liquids and it was analyzed under the stereomicroscope
(Figure 5-2-d).
4) When bitumen was pyrolysed for 270-300 minutes, multinuclear fused
aromatic structures were observed. This is described as Coke-4 and is seen
in Figure 5-2A-e. Sufficient pyrolysis time allowed for these structures to
form. This was easily filterable through a 0.22 µm filter.

86
Figure 5-2A: Structural variation of coke based on pyrolysis time. All images were taken
with a stereomicroscope at 20X magnification. Except for 3a-d (25X)
Figure 5-2B: Coke at 60 minutes (solids) versus fine coke (240 minutes)
As bitumen was heated to 400 °C and quenched at different pyrolysis times, an
increase in the Micro Carbon Residue (MCR) was continuously observed. Even
for a zero minute heat up, the MCR increased from 10.23 ± 0.8 to 11.2 ± 1.18
wt%. There seemed to be a local minimum at extended pyrolysis times but this
observation was based on average values and is not statistically significant.
Thermal conversion caused hydrogen disproportionation that ultimately caused
a) Solids (0 mins)
Coke-1
b) 60 minutes
Coke-1 (solids)
c) 120 minutes
Coke-2
d) 240 minutes
Coke-3
e) 300 minutes
Coke-4
Pentane Asphaltenes

87
coking. Experimental studies from literature have shown that hydrogen
disproportionation starts taking place at 200 °C.(11)(12) It was certain that the
higher temperature (400 °C) coupled with increased pyrolysis time caused
hydrogen disproportionation the effect of which is discussed in Section 5.3.3 and
Section 5.3.4 . This caused a reduction in the liquid yield (Table 5-1). This was
observed in our previous work as well (Chapter -3).
Table 5-1: Product Yields (wt%) during thermal treatment of Cold Lake bitumen at 400
°C at different times
Coke
Liquids
Gas
Time
(mins)
x s
x s
x s
Feed
1.3 0.05
98.7 0.4
- -
0a
1.41 0.03
97.56 0.5
1.02 0.48
30
1.84 0.28
97.46 0.36
0.69 0.3
60
1.51 0.28
94.1 0.29
4.13 0.22
80
1.51 0.35
93.2 0.65
5.29 0.35
90
4.97 2.11
88.8 1.7
3.37 2.39
180
8.02 0.27
84.2 1.3
7.7 1.07
240
11.16 1.1
82.2 1.04
6.6 0.2
270
11.67 0.23
81.46 1.87
6.86 1.65
280
14.93 2.419
78 3
7.1 3.44
300
14.43 1.51
74.77 3.7
10.8 4 a
– Refers to a zero minute heat up from room temperature to 400 °C and quenching. X = average value, s = sample standard deviation
Wiehe observed an asphaltene maximum just before the onset of coking.(7) During
the induction period the wt% of asphaltenes start increasing. At the end of the
induction period the asphaltene concentration started decreasing since the
asphaltenes are not soluble in the bitumen matrix anymore and turn to coke.(7) It
was of interest to check the variation of the asphaltene content as a function of
pyrolysis time to probe not just its relationship on coke make but also observe if
there was any effect on the physical properties of the pyrolysis liquids.

88
5.3.2 Viscosity and Ashphaltene content of pyrolysis products
Viscosity determination was one of the analyses performed on the pyrolysis
liquids. The viscosity trend with pyrolysis time was complex. A zero minute
reaction time at 400 °C caused a 47.6% reduction in viscosity. A reaction time of
30 minutes at 400 °C caused a 98.4% reduction compared to bitumen feed
viscosity. The reaction time was within the induction period where no coke make
was observed. The viscosity trend did not stop here when pyrolysis time was
extended. After a constant reduction in viscosity, there were two viscosity
maxima (Figure 5-3). An ashphaltene content determination at different times
showed a complex and superficially correlated trend with the viscosity. There
were two important deviations. First, the marked decrease in the viscosity from
0-30 minutes that was not accompanied by a change in the asphaltenes content.
Second was the lag in viscosity maximum (90 min) that was observed after the
asphaltene maximum (80 min). The latter was repeated at 270 min, where the
increase in asphaltenes content preceded the increase in viscosity.
Figure 5-3: The effect of pyrolysis time on resulting asphaltene content (■) and viscosity
(▲) of pyrolysis liquids.
0
2
4
6
8
10
17
19
21
23
25
27
0 50 100 150 200 250 300
Vis
co
sity
(P
a.s
)
Asp
halt
en
e C
on
ten
t (w
t%)
Time (Minutes)

89
Critically analyzing data collected (coke yield, viscosity and asphaltene content),
there seem to be 7 regimes in bitumen pyrolysis. This has been summarized
qualitatively in Table 5-2.
Table 5-2: Viscosity, Coke and Asphaltene regimes in bitumen pyrolysis
Regime
(minutes) Viscosity Ashphaltenes
Coke
Make MCR
I Neat bitumen - 0
↓
↑
X
↑
II 0 - 30
↓
constant
X
↑
III 30 - 80
↑
↑
X
↑
90 (End of Induction period) ↑ ↓ ↑ ↑
IV 90 - 180
↓
↓
↑
↑
V 180 - 240
constant
constant
↑
↑
VI 240 - 270 constant ↑ ↑ ↑
VII 270 - 300 ↑ ↑ ↑ ↑
Much like what literature indicated there was an ashphaltene increase (Figure 5-3)
during the progression of the induction period (Figure 5-1). The increase in
asphaltene content did not affect the viscosity during the induction period
(Regimes I II and III). This questions the removal of asphaltenes from the
bitumen matrix as part of a pretreatment step especially from a visbreaking
standpoint. A slight increase in the viscosity (1.91 ± 0.4 Pa.s) was observed right
after the induction period (regime IV) but then dropped to 0.5 ± 0.025 Pa.s
(Regime V) before increasing significantly in regime VI to 3.89 ± 1.5 Pa.s.
A viscosity increase after constant reduction was also observed when Cold Lake
bitumen was visbroken at different times by Wang et al.(8) The main focus on the
study was conformation and understanding of the conventional crude oil
visbreaking time-temperature relation and its application to predict low
temperature visbreaking performance. The relation did not hold true for low
temperatures but at all temperatures studied but a) a significant viscosity decrease

90
was seen at low pyrolysis times and b) a viscosity maxima were observed just like
in Figure 5-3 after a marked decrease in the viscosity when bitumen was
pyrolysed at short times (0- 30 mins) for temperatures in the range of 260 °C -
400 °C.
It is important to note that the reaction network of bitumen pyrolysis is complex.
Not only is there conversion of aggregates (which includes asphaltenes) to coke
but since the propagation kinetics is free radical in nature there is simultaneous
maltene to asphaltene conversion taking place. In our case the asphaltene content
is the easiest measure of the aggregate content. Regimes I and II seem to be ideal
from a visbreaking perspective. There is a significant reduction in viscosity
whether or not there is an aggregate increase. As the end of the induction period is
reached, the mean viscosity increases with a corresponding increase in the
asphaltene content. When coking starts, there is carbon rejection and the foremost
conversion taking place is the phase separation step (any aggregate to mesophase
formation followed by coke formation). When coke is formed the highest
molecular weight species are rejected and this results in a corresponding viscosity
decrease since all viscosity values reported are cokeless viscosities, i.e the coke
was removed by filteration before the viscosity was determined.
Ideally this would have continued until all asphaltenes are converted to coke but
this was not the case. In regime V and VI, there is a second monotonic increase
in the ashphaltene content and can be explained by the higher rate of maltene
ashphaltene conversion compared to asphaltene coke conversion. A direct
measure of this can be seen by the decrease (~10% in both cases) in the maltene
weight fraction which occurs when the two asphaltene maxima are observed.
This is not observed during the other time regimes of bitumen pyrolysis where the
maltene weight fraction shows a monotonic decrease (Table 5-3).
Factors that govern bitumen viscosity can be both physical and chemical.
Lesueur’s(13) perspective on asphaltene content influencing viscosity are worth
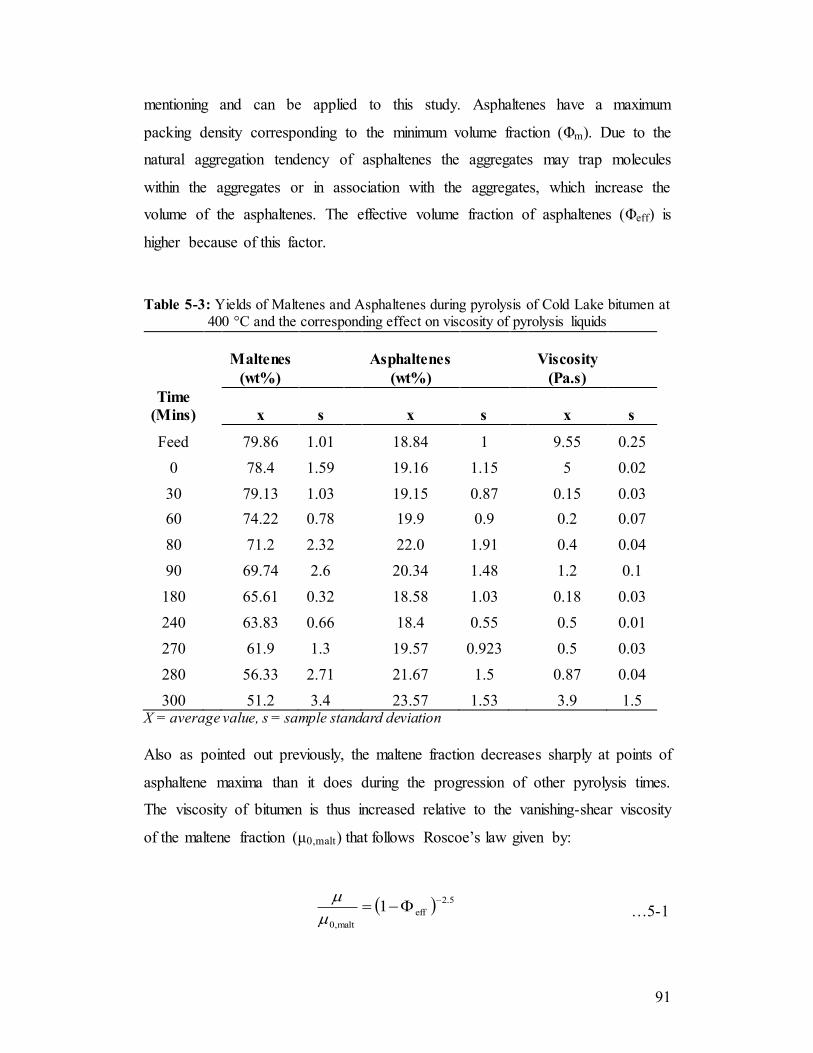
91
mentioning and can be applied to this study. Asphaltenes have a maximum
packing density corresponding to the minimum volume fraction (Φm). Due to the
natural aggregation tendency of asphaltenes the aggregates may trap molecules
within the aggregates or in association with the aggregates, which increase the
volume of the asphaltenes. The effective volume fraction of asphaltenes (Φeff) is
higher because of this factor.
Table 5-3: Yields of Maltenes and Asphaltenes during pyrolysis of Cold Lake bitumen at
400 °C and the corresponding effect on viscosity of pyrolysis liquids
Maltenes
(wt%)
Asphaltenes
(wt%)
Viscosity
(Pa.s)
Time
(Mins)
x s x s x s
Feed
79.86 1.01
18.84 1
9.55 0.25
0
78.4 1.59
19.16 1.15
5 0.02
30
79.13 1.03
19.15 0.87
0.15 0.03
60
74.22 0.78
19.9 0.9
0.2 0.07
80
71.2 2.32
22.0 1.91
0.4 0.04
90
69.74 2.6
20.34 1.48
1.2 0.1
180
65.61 0.32
18.58 1.03
0.18 0.03
240
63.83 0.66
18.4 0.55
0.5 0.01
270
61.9 1.3
19.57 0.923
0.5 0.03
280
56.33 2.71
21.67 1.5
0.87 0.04
300 51.2 3.4 23.57 1.53 3.9 1.5 X = average value, s = sample standard deviation
Also as pointed out previously, the maltene fraction decreases sharply at points of
asphaltene maxima than it does during the progression of other pyrolysis times.
The viscosity of bitumen is thus increased relative to the vanishing-shear viscosity
of the maltene fraction (μ0,malt) that follows Roscoe’s law given by:
…5-1
5.2
eff
malt,0
1

92
No solids were taken out before pyrolysis of bitumen. All viscosity values
reported were after removal of coke and the particulates (solids) present. The
solids content in the feed was 1.5 ± 0.05 wt%. These solids can act as nucleation
sites for mesophase formation, and, by doing so the presence of solids affects the
apparent length of the induction period before the onset of coking, as well as the
size of the coke which ultimately depends on the ability of the mesophase to
coalesce.(14)(15) As seen in figure 5-2A, the nature of the coke changed during
continued thermal conversion. These changes were seen in the rheological
behavior as well as the ease of filtration according to a previous study.(16)
In the interest to quantify to what extent solids affect viscosity, a collegue from
our research group found the viscosity of bitumen with and without the presence
of solids. Cold Lake bitumen was visbroken at 340 °C for one hour. The viscosity
of the unfiltered sample was 55 % higher than that of the filtered bitumen.(8) The
bitumen was from the same barrel and thus the reaction time was well within the
induction period. It is important to note that solids do have an impact on the
absolute viscosity values alongside playing a role in induction period
extension.(14)
5.3.3 Refractive Index and H/C Ratio
The refractive index and H/C ratio of samples was measured to track the nature of
changes in the composition of pyrolysis products during thermal treatment. A
lower refractive index is indicative of a product with more aliphatic character, i.e
both paraffinic and naphthenic.(18) With increased pyrolysis time and with free
radical addition the H/C ratio decreases because of formation of higher fused
aromatic structures. The trend is seen in Table 5-4.
The solubility of coke precursors (Figure 5-4) in the matrix was expressed as
solubility index (SI) which is an expression of coke formation tendency. This took
into account the refractive index of the pyrolysis liquid and the Hydrogen/Carbon
(H/C) ratio of the pyrolysis liquids.

93
Solubility Index (SI) = Refractive Index (RI) x (H/C ratio of pyrolysis
Products)
Table 5-4: Refractive index and Hydrogen/Carbon ratio of products after thermal treatment of Cold Lake bitumen at different times
RI (at 30
°C)
H/C
Ratio
Time
x s x s
Feed
1.5788 0.0032
0.121833 0.0001
0a
1.5801 0.0032
na na
30
1.5852 0.0031
0.11816 0.000212
60
1.5982 0.0067
0.114099 0.001403
180
1.6558 0.0031
0.099832 4.85E-05
240
1.663 0.0031
na na
280
1.6654 0.0034
0.097421 0.000294
300 1.6758 0.0048 0.093977 0.003039 na= not analysed, x = average, s = sample standard deviation a – Refers to a zero minute heat up from room temperature to 400 °C and quenching.
With an increase in pyrolysis time, solubility of coke precursors like any
aggregates, asphaltenes or mesophase decreases thus forming coke. A monotonic
decrease in the solubility index indicates that any coke precursor (asphaltene,
mesophase) become inherently less soluble in the bitumen matrix and thus the
liquid is more likely to coke because of hydrogen deficiency. The MCR provides
support to the observed solubility index trend (Figure 5-1).

94
Figure 5-4: Refractive Index and Solubility Index variation with pyrolysis time
As a single test, the liquid that was pyrolysed for 200 minutes at 4 MPa in batch-
mode was analysed under cross polarized light to probe for mesophase formation.
Figure 5-5 shows mesophase formation in the lower left corner.
Figure 5-5: Mesophase formation at 200 minutes during pyrolysis when pyrolysis liquids
were observed under cross polarized light (200X magnification)
0.155
0.16
0.165
0.17
0.175
0.18
0.185
0.19
0.195
1.56
1.58
1.6
1.62
1.64
1.66
1.68
1.7
0 50 100 150 200 250 300
So
lubil
ity I
ndex
Refr
acti
ve I
ndex
(nd)
Time (Minutes)
RI (nd)
125 µm

95
5.3.4 1H-NMR product analysis
Pyrolysis of bitumen yielded two asphaltene maxima (Figure 5-3). Neat bitumen
and pyrolysis liquids were subjected to a 1H-NMR analyses to track the migration
of hydrogen during bitumen pyrolysis.
Two specific values were quantified:
1) The total aliphatic hydrogen present in the matrix as a function of
pyrolysis time. The ppm range of values integrated was over 0.5-4.5 ppm.
2) The methyl group percent in the aliphatic fraction was also quantified as a
function of pyrolysis time. The ppm range of values integrated was over
0.5 - 1 ppm.(19)
The cut-off between aliphatic and aromatic hydrogen was taken as δ = 6.3 ppm,
with lower shift-values being aliphatic and higher shift values being aromatic.
Olefinic hydrogen overlaps the cutoff, as does hydrogen attached to some
heteroatom functional groups.(20)
Table 5-5: The aliphatic hydrogen percentage and percentage of methyl groups present in the aliphatic hydrogen during neat bitumen pyrolysis at 400 °C with increase in time.
Time (min) Aliphatic Hydrogen % Methyl Group %
x s
x s
0
91 1
15.6 0.5
60
89.1 1.7
3.4 0.4
180
84.2 4.2
5.4 0.75
280
79.6 0.4
10.52 0.62
300
79.6 2.4
11.35 2.7
x= average, s= standard deviation
Neat bitumen has an initial aliphatic hydrogen per cent of 91 ± 1 % and with
pyrolysis time the aliphatic hydrogen percent drops to 79.6 ± 2.4 % over a
reaction time of 5 hours (Figure 5-6). The methyl group concentration in the

96
aliphatic region however showed a different trend. Initially the methylic
concentration was 15.6 ± 0.5 %. After pyrolysis for 60 minutes the methyl
concentration dropped to 3.4 ± 0.4 %. This however increased to 11.35 ± 2.7 %
after 5 hours of pyrolysis.
Figure 5-6: Variation of the total Aliphatic Hydrogen in the liquid product and the
methyl group contribution to the aliphatic hydrogen with pyrolysis time
Hydrogen disproportionation causes the total aliphatic hydrogen decrease. The
sudden initial drop of methyl group hydrogen content is due to the
thermodynamically favorable cleavage of the aliphatic C-H bonds. The methyl
group concentration increases and reaches a statistically constant value. Based on
these results it was postulated that there is an equilibrium that governs the way in
which free radicals (either H• or •CH3) are terminated. At short contact times,
termination by H is favored (where kinetics dominates), but if given a long
enough time, the CH3 content increases and methyl concentration dominates how
radicals are terminated.
Wiehe(17) in his description of closed reactor data versus open reactors points out
a couple of things that can be applied to understand this behavior. In closed
0
2
4
6
8
10
12
14
16
18
76
78
80
82
84
86
88
90
92
0 50 100 150 200 250 300
Met
hylic
G
roup
per
cent
in
Alip
hatc
H
Ydro
gen
Tota
l A
lipha
tic
Hyd
roge
n in
Liq
uid
Pro
duc
t
Time (Minutes)
Aliphatic H%
Methyl Contribution

97
reactors the solubility relationship of light gases is a contributing factor in the
mechanism of coke formation and induction period variation. In closed reactors
the pressure and small gas space forces the volatile products to remain in the
liquid phase. Previous studies have shown that with an increase in pressure the
coke make decreases for open reactors.(6) This may be attributed to light gas
interaction with free radical addition to enable coke suppression. According to
Wiehe(17) the induction period is lowered because holding the volatile liquids in
the liquid phase produces a solvent (light gases) with much lower ability to
dissolve asphaltene cores. But at longer pyrolysis times, the high quantity of light
gases (poor solvent) present in the system dissolves more asphaltene cores
because of higher transferrable hydrogen in the system. This causes suppression
of coke and would explain the methyl concentration increase with time.
There are opposing forces at work since light gases are also asphaltene
precipitants. Does their ability to transfer methyl groups (transferable hydrogen)
cause induction period extension or reduction? We investigated this by adding a
light gas (n-butane) to the batch reactor system before pyrolysis.
5.4 Role of Butane in Induction period extension – reduction
Liquefied n-butane was added to bitumen and pyrolysed at different times to
investigate its effect on coke make specifically. Three pyrolysis times were
chosen. A) Within the induction period (60 minutes) B) After the induction period
(120 minutes) and C) Extended pyrolysis time (300 minutes). The butane
concentration in the reaction mixture of butane: bitumen was kept at 12.11 ± 1.19
wt%. Coke make and asphaltene content was calculated on a bitumen basis.

98
Figure 5-7: Comparison of coke yields when bitumen is diluted with 12.11 ± 1.19 wt%
of butane and pyrolysed at 400 °C
Butane seemed to reduce the induction period (60 minutes) when 12.11 ± 1.19
wt% of butane was added. When an average of 12.11% of butane was added to
bitumen and pyrolysed for 60 minutes, 2.19 ± 1.48 % of coke was produced.
There was no significant change even at 120 minutes of pyrolysis. The surprise
came when bitumen was diluted with butane and pyrolysed for 5 hours.
Table 5-6: Product Yields when bitumen was diluted with butane and pyrolyses at different times
Time (mins)
Coke (wt%)
s Butane Added
(wt%)
S Asphaltenes
(wt%) s
Maltenes +Gas
(wt%)
s
60 2.2 1.5 12.5 1.8 23.7 2.23 74.1 0.8
120 5.03 0.11 10.8 0 21.8 0.7 73.2 0.7
300 8.8 0.17 13.1 0.8 22 0.75 69.2 0.6
There was a 38% suppression compared to neat bitumen coking. Results from
chapter-3, (Figure 3-7) describe the importance of reaction probability
(concentration of solvent) and not just probability (rate constant). n-Butane is
however, an asphaltene precipitant. By diluting bitumen with a high amount of
butane, the probability of aggregation increases and thus a higher coke make may
be explained by increased aggregation of species. One experiment was performed
1.3
3.3
5.3
7.3
9.3
11.3
13.3
15.3
17.3
0 50 100 150 200 250 300
Coke
Yie
ld
(wt%
)
Time (minutes)
Neat Bitumen
Butane diluted

99
where when bitumen was diluted with 67.2 ± 1.1 wt% butane and the coke make
was 24 ± 0.6 % for a pyrolysis time of 280 minutes. Neat bitumen when
pyrolysed for the same reaction time had 14.93 ± 2.4 wt% of coke (Table 5-1).
With higher concentration, butane does more harm than good even at extended
pyrolysis times. The coke make is sensitive to the butane added. The two main
results from this part of the study was 1) butane concentration should be kept low
and 2) the most coke suppression was seen at long pyrolysis times.
5.4.1 Effect of butane dilution on product quality
The addition of butane as a solvent before pyrolysis caused changes in the coke
make (Figure 5-7), but also affected the product quality. It must be noted that
butane solubility in bitumen is high. At conditions of 35°C and 0.318 MPa butane
was allowed to come into contact with Peace River bitumen. The solubility was
reported as a mass fraction. It was observed that a mass fraction of 0.72 was
soluble at these conditions. The saturation pressure was reported to be 0.334
MPa.(21) Multiple experiments were performed with propane that showed a
constant increase in the solubility with increase in pressure.
Table 5-7: Asphaltene and Viscosity data for bitumen diluted with butane at different concentrations and pyrolysed
Time
(minutes)
Butane
Added
(wt%)
s Asphaltenes
(wt%) s
Viscosity
(Pa.s) s
60
12.5 1.82
23.7 2.2
0.7 0.22
120
10.8 0.02
21.8 0.7
0.63 0.2
300 13.1 0.83 22 0.8 1.33 0.15
Table 5-8: Refractive Index (R.I) and Micro Carbon Residue (MCR) data for bitumen
diluted with butane at different concentrations and pyrolysed
Time
(minutes)
Butane
Added
(wt%)
s R.I (nd) s MCR
(wt%) s
60
12.5 1.82
1.5941 0.005
12.49 0.9
120
10.8 0.02
1.604 0.014
12.93 1.3
300 13.1 0.83 1.6599 0.004 17.25 0.85
100
Comparison of product quality is summarized and discussed in the two points
below:
1) For a reaction time of 60 minutes, butane diluted bitumen had a higher
asphaltene content (23.7 ± 2.2 wt%) and a higher viscosity (0.7 ± 0.22
Pa.s) compared to neat bitumen which had an asphaltene content of 19.9 ±
0.9 wt% and a viscosity of 0.2 ± 0.07 Pa.s (Table 5-3 and Table 5-7). This
is probably because butane promoted mesophase formation and
aggregation. Aggregates increase in size when butane is added and any
aggregating species that can be seen under cross polarized light, be it
asphaltenes or not can be responsible for this viscosity change. In this
reaction time, the only significant difference was lower viscosity for the
neat bitumen. There was no statistically significant difference in the
refractive index and micro carbon residue between butane diluted and neat
bitumen.
2) At extended pyrolysis times (300 minutes) there was a 66% reduction in
the viscosity of butane diluted bitumen compared to neat bitumen. The
asphaltene content however was not meaningfully different, again pointing
to the fact that there is a poor correlation between the viscosity and
asphaltene content. There was however a reduction in the MCR content
17.25 ± 0.85 wt% for butane diluted bitumen versus 19.24 ± 1 wt% for
neat bitumen.
1H-NMR analysis yielded interesting results. For all pyrolysis times, the mean
aliphatic hydrogen content of butane diluted bitumen was higher than that of neat
bitumen (Figure 5-8). The data was statistically significant for extended reaction
times (300 minutes).

101
Figure 5-8: Total aliphatic hydrogen percent as a function of time in the liquid product
for neat bitumen and bitumen diluted with butane before pyrolysis
Butane was able to increase the total aliphatic hydrogen of the pyrolysis products
during all times investigated. After pyrolysis for 5 hours neat bitumen had a total
aliphatic content of 79.6 ± 0.4 % compared to butane diluted bitumen that had a
total aliphatic content of 84.8 ± 2 %. The meaningful difference in the total
aliphatic content, the NMR results indicate that butane can act as a hydrogen
transfer solvent. The hypothesis made in chapter -3 was it was through methyl
radical donation. Hence the methyl group percent that made up the total aliphatics
was calculated and compared (Figure 5-9).
78
80
82
84
86
88
90
92
94
0 50 100 150 200 250 300
To
tal
Ali
ph
ati
c H
yd
ro
gen
Time (Minutes)
Neat Bitumen
Butane Diluted Bitumen

102
Figure 5-9: Methyl group contribution in the aliphatic hydrogen for neat bitumen and
bitumen diluted with butane and pyrolysed.
There reduction in methyl group content was 78.2% when neat bitumen was
pyrolysed for 60 minutes. When butane was added to the system and pyrolysed
for 60 minutes the reduction in the methyl content was 7.8 %. After 120 minutes a
60% reduction in the total methyl content was observed. Butane was able to
moderate the extent of methyl group cleavage during pyrolysis at low pyrolysis
times. With extended pyrolysis time, even though there is more transferable
hydrogen in the system, the methyl group content reaches a constant value in both
cases. This is because with neat bitumen more and more light gases are formed
until the reaction is moderated. This was also seen in Chapter-3 (see 3.3.4 Role of
light gases in bitumen pyrolysis ). The constant value reached after 300 minutes
again points to an equilibrium that governs how free radicals may be terminated.
5.5 Conclusions
Batch reactor pyrolysis of bitumen and butane diluted bitumen at varying reaction
times yielded the following observations:
a) Four major regimes observed in coke make during pyrolysis of Cold Lake
bitumen. In the first three regimes, there was no coke make and this is just
0
2
4
6
8
10
12
14
16
18
0 50 100 150 200 250 300
Neat Bitumen
Butane Diluted bitumen

103
mineral matter present in the bitumen. This remained the same both
quantitatively and visually. Filtration problems were encountered when
bitumen was pyrolysed in the time frame of regime three (Coke-3).
Visually, Coke-4 had a defined structure and this was easily filterable
through a 0.22 µm filter paper.
b) The viscosity trend with pyrolysis time was complex. Two orders of
magnitude of viscosity decrease from ∼9.55 Pa.s to ∼0.2 Pa.s was possible
by heating Cold Lake bitumen to 400 °C for 30 minutes. There were two
local viscosity maxima when pyrolysis time was increased.
c) An ashphaltene content determination at different times showed a complex
and superficially correlated trend with the viscosity. There were two
important deviations. First, the marked decrease in the viscosity from 0-30
minutes that was not accompanied by a change in the asphaltenes content.
Second was the lag in viscosity maximum (90 min) that was observed
after the asphaltene maximum (80 min). The latter was repeated at 270
min, where the increase in asphaltenes content preceded the increase in
viscosity.
d) With increased pyrolysis time the coke formation tendency increased. The
solubility index of the total liquid decreased. This in turn affected the
ability of the bulk liquid to keep the coke precursors in solution.
e) With increasing pyrolysis time, the total aliphatic hydrogen content of the
liquids decreased (Figure 5-6). The methylic hydrogen content went
through a sharp decrease initially with increased pyrolysis time and
increased at extended pyrolysis times.
f) Solvents may play a role in induction period extension or reduction. This
depended on the type of solvent and its nature to react with the coke

104
precursors in the matrix. n-Butane was a poor solvent at shorter reaction
times but was able to cause a 38% reduction in the coke make at extended
pyrolysis times.
g) Coke make was sensitive to amount of butane added. Liquid quality
(viscosity, refractive index, total aliphatic hydrogen content) was better
when low butane amounts were added and longer pyrolysis time was
allowed so as to allow transferable hydrogen to cause a meaningful
difference in the product quality.
References
1) Calgary herald home page.
http://www.calgaryherald.com/business/Bitumen+diluent+demand+expect
ed+double+2020/9696681/story.html (Assessed April 20, 2014).
2) Leprince, P. Visbreaking of residues. In Petroleum Refining Vol.3
Conversion Processes; Leprince, P. Ed.; Editions Technip: Paris, 2001,
p.365-379.
3) Gary, J. H.; Handwerk, G. E.; Kaiser, M. J. Petroleum refining.
Technology and economics, 5ed; CRC Press: Boca Raton, FL, 2007, p. 97-
120.
4) Joshi, J. B.; Pandit, A. B.; Kataria, K. L.; Kulkarni, R. P.; Sawarkar, A. N.;
Tandon, D.; Ram, Y.; Kumar, M. M. Petroleum residue upgrading via
visbreaking: A review. Ind. Eng. Chem. Res. 2008, 47, 8960-8988.
5) Gary, J.H.; Handwerk, G.E. Coking and thermal processes, In Petroleum
Refining: Technology and Economics, 5ed; Taylor & Francis Group, LLC,
2007, p. 61-84.
6) Zachariah, A., Wang, L., Yang, S., Prasad, V., de Klerk, A. Suppression of
coke formation during bitumen pyrolysis. Energy Fuels 2013, 27, 3061-
3070.
7) Wiehe, I. A. A phase-separation kinetic model for coke formation. Ind.
Eng. Chem. Res. 1993, 32, 2447 - 2454.

105
8) Wang, L.; Zachariah, A.; Yang, S.; Prasad, V.; De Klerk, A.
Visbreaking oilsands derived bitumen in the temperature range 340 – 400
°C. Energy Fuels 2014, (DOI: 10.1021/ef501158p).
9) Levinter, M.E. Mechanism of coke formation in the cracking of
component groups in petroleum residues. Khim Tekhnol Topl Masel. 1966,
9, 31-35.
10) Levinter, M.E. The mutual effect of group components during Coking.
Khim Tekhnol Topl Masel. 1967, 4, 20-22.
11) Lee, D. G.; Noureldin, N. A.; Mourits, F. M. The effect of low
temperature oxidation on the chemical and physical properties of maltenes
and asphaltenes derived from heavy oil. Prepr. Pap.-Am. Chem. Soc., Div.
Petrol. Chem. 1987, 32 (4), 853-856.
12) Moschopedis, S. E.; Parkash, S.; Speight, J. G. Thermal decomposition of
asphaltenes. Fuel 1978, 57, 431-434.
13) Lesueur, D. The colloidal structure of bitumen: Consequences on the
rheology and on the mechanisms of bitumen modification. Adv. Colloid
Interface Sci. 2009, 145, 42−82.
14) Sanaie, N.; Watkinson, A. P.; Bowen, B. D.; Smith, K. J. Effect of
Minerals on coke precursor formation. Fuel 2001, 80, 1111−1119.
15) Rahmani, S.; McCaffrey, W. C.; Elliott, J. A. W.; Gray, M. R. Liquid-
phase behavior during the cracking of asphaltenes. Ind. Eng. Chem. Res.
2003, 42, 4101−4108.
16) Rand, B. The pitch−mesophase−coke transformation as studied by thermal
analytical and rheological techniques. ACS Symp. Ser. 1986, 303, 45−61.
17) Wiehe, I. A. Process chemistry of petroleum macromolecules; CRC Press:
Boca Raton, FL, 2008
18) Sachanen, A. N. The chemical constituents of petroleum; Reinhold: New
York, 1945, p. 102-107.
19) Gray, M.R Upgrading Petroleum Residues and Heavy oils; Marcel
Dekker, Inc.: New York, 1994.
106
20) Silverstein, R. M.; Bassler, G. C.; Morrill, T. C. Spectrometric
identification of organic compounds, 4ed; Wiley: New York, 1981.
21) Das, K.S.; Butler, M.R. Diffusion coefficients of propane and butane
inpeace river bitumen. Can. J. Chem. Eng. 2009, 74(6), 985-992.

107
Chapter - 6 Conclusions
6.1 Introduction
In the two years of research, observations were made that have helped contribute
to knowledge in this specific area of science. The overall objective was to
investigate pyrolysis behavior of bitumen at low temperatures, because it held the
potential of higher liquid selectivity, and to understand how solvents influence
coking.
6.2 Major Conclusions
The major conclusions from this work are listed as follows:
a) The mere presence of a solvent was important in coke suppression. The coke
yield was halved at 20% solvent concentration, irrespective of the hydrogen
transfer capabilities of the solvent.
b) It was observed that the better the H-transfer properties of the solvent, the more
the coke suppression at high solvent concentrations (50% and greater).
c) Lighter products produced during bitumen pyrolysis may also serve as a
solvent and by manipulation of VLE, the coke yield could be influenced
(suppressed). The production of light gases was not primarily determined by over
cracking of light products exposed to longer pyrolysis conditions.
d) From an industrial standpoint, ways to suppress coke and improve liquid yield
during visbreaking have been suggested. They are: 1) Co-feed light hydrocarbons
to suppress coking by methyl radical interactions. 2) Operate at lower
temperatures and higher pressures to cause a higher concentration of lighter
products in the liquid phase.
108
e) The overall hydrogen availability was as important as was the solubility limit
of coke precursors in the liquid. If there was enough hydrogen that could be
abstracted, the probability that this would keep the coke precursors soluble is
higher. The more time given, the more meaningful the difference in coke make
because of the more transferable hydrogen in the system.
f) Four major types of coke make was observed during pyrolysis of Cold Lake
bitumen. In the first two regimes, there was no separate coke make and the coke
was just mineral matter present in the bitumen. Filtration problems were
encountered when bitumen was pyrolysed in regime three. This was not
encountered in the last stage of coke formation. After 270 minutes of pyrolysis
coke had a defined agglomerated structure.
g) For a zero minute reaction time, in a SDA-Visbreaking sequence even though
there was no statistical difference in the refractive index, micro carbon residue
data and 1H-NMR data, the liquids from visbreaking-SDA had a higher aliphatic
character.
h) The viscosity trend with pyrolysis time was complex. An order of magnitude
viscosity decrease from ∼9.55 Pa.s to ∼0.2 Pa.s was possible by heating the feed
to 400 °C for 30 minutes. There were two local maxima when pyrolysis time was
increased. The viscosity behavior was interpreted based on the literature. The
most plausible explanation for the rapid decrease in the viscosity during low
temperature visbreaking, was a decrease in the effective volume fraction (Φeff)
that was occupied by the colloidal fraction. A decrease in Φeff could result from
disaggregation or the release of colloidally trapped material.
i) An ashphaltene content determination at different times showed a complex and
superficially correlated trend with the viscosity. There were two important
deviations. First, the marked decrease in the viscosity from 0-30 minutes that was
not accompanied by a change in the asphaltenes content. Second was the lag in

109
viscosity maximum (90 min) that was observed after the asphaltene maximum (80
min). The latter was repeated at 270 min, where the increase in asphaltenes
content preceded the increase in viscosity.
j) Based on the asphaltene-viscosity relationship with time, in a SDA-
Visbreaking sequence, the most meaningful difference in the product quality will
be seen when the reaction time is equal to or less than the induction period of
coke formation of the feed. In our sample of Cold Lake bitumen this time is just
before 80 minutes. This gives the best case of hydrogen transfer from asphaltenes
to enrich the aliphatic hydrogen content of the liquid product.
k) The reactivity of the oilsands bitumen to thermal conversion is comparable to
that of a young crude oil, which has not been subjected to high temperature and
pressure over geological time. As seen in literature this is not a new observation,
but the experimental observations noticed were supported by literature that dated
back to 1926. The final implication is that oilsands derived bitumen should not be
treated like a residuum despite its distillation profile suggesting so.
6.3 Future Work
a) In the coke suppression studies, we investigated the individual effects of
different solvents and their ability to suppress coke. There is literature that
explains the reduction in the rate significantly especially when reactive H-donors
are added to the system during pyrolysis. This effect of rate reduction however is
not well known and this can give insight to understanding how the lower rates can
be overcome when mild pyrolysis is coupled with solvent addition.
b) Visbreaking coupled with Solvent deasphalting needs to be investigated in
much greater detail since the initial results look promising.

110
c) Physical effects have indirectly always played a role in coke suppression. If one
can understand and decouple the viscous component of bitumen from the elastic
component, this might help in understanding how to process bitumen better rather
than subjecting it always to high temperatures and pressures.
6.4 Presentations and Publications
The following is the list of publications and conference presentations during the
two years of research:
1) Zachariah, A., Wang, L., Yang, S., Prasad, V., de Klerk, A. Suppression of
coke formation during bitumen pyrolysis, Energy Fuels, 2013, 27 (6),
3061–3070.
2) Wang, L.; Zachariah, A.; Yang, S.; Prasad, V.; De Klerk, A.
Visbreaking oilsands derived bitumen in the temperature range 340 – 400
°C. Energy Fuels 2014, Accepted DOI 10.1021/ef501128p.
3) Zachariah, A.; De Klerk, A. Impact of solvents on thermal conversion
of oil sands derived Bitumen. Prepr. Pap.-Am. Chem. Soc., Div . Energy
Fuels 2013, 58 (1), 962-963.
4) Zachariah, A.; De Klerk, A. Upgrading Oil Sands bitumen: Solvent
Deasphalting and Visbreaking sequence. Prepr. Pap.-Am. Chem. Soc.,
Div . Energy Fuels 2014 (Accepted-in press).

111
Bibliography
ASTM D4124 – 09: Standard test method for Separation of Asphalt into
Four Fractions; ASTM West Conshohocken, PA, 2009.
ASTM D6560-12: Standard test method for Determination of Asphaltenes
in Crude Petroleum and Petroleum Products; ASTM: West
Conshohocken, PA, 2012.
ASTM D4530: Standard test method forDetermination of Carbon Residue
(Micro Method); ASTM: West Conshohocken, PA, 2011.
Ancheyta, J.; Speight, J. G., Hydroprocessing of Heavy Oils and Residua.
CRC Press: Boca Raton, 2007.
Akbarzadeh, K.; Dhillon, A.; Svrcek, W. Y.; Yarranton, H. W.,
Methodology for the characterization and modeling of asphaltene
precipitation from heavy oils diluted with n-alkanes. Energy Fuels 2004,
18(5), 1434-1441.
Agrawala, M.; Yarranton, H. W., An asphaltene association model
analogous to linear polymerization. Ind. Eng. Chem. Res. 2001, 40(21),
4664-4672.
Ancheyta, J. Modeling of visbreaking. Modeling of processes and reactors
for upgrading of heavy petroleum, 2013, pp. 73-102.
Abedi, S. J.; Seyfaie, S.; Shaw, J. M., Unusual Retrograde Condensation
and Asphaltene Precipitation in a Model Heavy Oil System. Pet. Sci.
Technol. 1998, 16(3-4), 209-226.
Ball, M. W. Development of the Athabaska oil sands. Can. Inst. Min.
Metall. 1941, 44, 58-91.
Benson, S. W., Thermochemical Kinetics, 2nd Ed. John Wiley and Sons:
New York, 1976.
Blanksby, S. J.; Ellison, G. B. Bond dissociation energies of organic
molecules. Acc. Chem. Res. 2003, 36, 255-263.

112
Cooper, T. A.; Ballard, W. P. Cracking, visbreaking, and reforming. In
Advances in petroleum chemistry and refining. Vol. VI. McKetta, J. J. Jr
Ed.; Interscience: New York, 1962, pp 170-238.
Calgary herald home page.
http://www.calgaryherald.com/business/Bitumen+diluent+demand+expect
ed+double+2020/9696681/story.html (Assessed April 20, 2014).
Das, K.S.; Butler, M.R. Diffusion coefficients of propane and butane
inpeace river bitumen. Can. J. Chem. Eng. 2009, 74(6), 985-992.
De Klerk, A.; Gray, M. R.; Zerpa, N. Unconventional oil and gas:
Oilsands. In Future energy. Improved, sustainable and clean options for
our planet, 2ed; Letcher, T.M. Ed.; Elsevier: Amsterdam, 2014, p. 95-116.
De Klerk, A.; Fisher Tropsch Refining; Wiley-VCH:Weinhein, 2011.
Egloff, G.; Morrell, J. C. The cracking of bitumen from Canadian Alberta
tar sands. Trans. Am. Inst. Chem. Eng. 1926, 18, 347-363.
Groenzin, H.; Mullins, O. C., Molecular Size and Structure of Asphaltenes
from Various Sources. Energy Fuels 2000, 14(3), 677-684.
Gray, M. R., Chemical composition of bitumen, Upgrading of Oils Sands
Bitumen and Heavy Oil, University of Alberta Course notes. 2010, pp. 85-
39.
Gray, M. R., Consistency of Asphaltene Chemical Structures with
Pyrolysis and Coking Behavior. Energy Fuels 2003, 17(6), 1566-1569.
Leprince, P. Visbreaking of residues. In Petroleum refining. Vol. 3.
Conversion processes; Leprince, P. Ed.; Editions Technip: Paris, 2001, pp
365-379.
Henderson, J. H., Weber, L. Physical upgrading of heavy crude oil by the
application of heat. Journal of Canadian Petroleum Technology, 1985,
4(4), 206-212.
Jones, D. S. J. Upgrading the ‘bottom of the barrel’. In Handbook of
petroleum processing; Jones, D. S. J., Pujadó, P. R. Eds.; Springer:
Dordrecht, 2006, pp 447-481.

113
Joshi, J. B.; Pandit, A. B.; Kataria, K. L.; Kulkarni, R. P.; Sawarkar, A. N.;
Tandon, D.; Ram, Y.; Kumar, M. M. Petroleum residue upgrading via
visbreaking: A review. Ind. Eng. Chem. Res. 2008, 47, 8960-8988.
Khorasheh,F.; Gray, M.; High Pressure Thermal Cracking of n-
Hexadecane in Tetralin. Energy Fuels 1993, 7(6), 960-967.
Leprince, P. Visbreaking of residues. In Petroleum Refining Vol.3
Conversion Processes; Leprince, P. Ed.; Editions Technip: Paris, 2001,
p.365-379.
Levinter, M.E. Mechanism of coke formation in the cracking of
component groups in petroleum residues. Khim Tekhnol Topl Masel. 1966,
9, 31-35.
Levinter, M.E. The mutual effect of group components during Coking.
Khim Tekhnol Topl Masel. 1967, 4, 20-22.
Lee, D. G.; Noureldin, N. A.; Mourits, F. M. The effect of low
temperature oxidation on the chemical and physical properties of maltenes
and asphaltenes derived from heavy oil. Prepr. Pap.-Am. Chem. Soc., Div.
Petrol. Chem. 1987, 32 (4), 853-856.
Lesueur, D. The colloidal structure of bitumen: Consequences on the
rheology and on the mechanisms of bitumen modification. Adv. Colloid
Interface Sci. 2009, 145, 42−82.
Moschopedis, S. E.; Parkash, S.; Speight, J. G. Thermal decomposition of
asphaltenes. Fuel 1978, 57, 431-434.
Puttagunta, V. R.; Singh, B.; Miadonye, A. New Correlating Parameter for
the Viscosity of Heavy Crude Oils. Can J Chem. Eng. 1993, 71, 447.
Qian, K. N.; Edwards, K. E.; Siskin, M.; Olmstead, W. N.; Mennito, A. S.;
Dechert, G. J.; Hoosain, N. E. Desorption and ionization of heavy
petroleum molecules and measurement of molecular weight distributions.
Energy Fuels 2007, 21(2), 1042-1047. Sachanen, A. N. The chemical
constituents of petroleum; Reinhold: New York, 1945, p. 102-107.
Rand, B. The pitch-mesophase-coke transformation as studied by thermal
analytical and rheological techniques. ACS Symp. Ser. 1986, 303, 45-61.

114
Rahmani, S.; McCaffrey, W.C.; Elliott, J. A. W.; Gray, M. R. Liquid-
phase behavior during the cracking of asphaltenes. Ind. Eng. Chem. Res.
2003, 42, 4101-4108.
Sanaie, N.; Watkinson, A. P.; Bowen, B. D.; Smith, K. J. Effect of
minerals on coke precursor formation. Fuel 2001, 80, 1111-1119.
Silverstein, R. M.; Bassler, G. C.; Morrill, T. C. Spectrometric
identification of organic compounds, 4ed; Wiley: New York, 1981.
Sprecher,R.; Retocofsky,H.; Observation of transient free radicals during
coal pyrolysis. Fuel 1983, 62, 473-476.
Sapre, A.; ExxonMobil Resid Conversion Technologies. Paper presented
at the 3rd Bottom of the Barrel Technology Conference & Exhibition
(BBTC), Antwerp, Belgium. October, 2004.
Gary, J. H., Handwerk, G. E., Kaiser, M. J. Petroleum refining:
Technology and Economics, 5th Ed. CRC Press: Boca Raton, FL, 2007.
Ancheyta, J. Modeling of visbreaking. Modeling of processes and reactors
for upgrading of heavy petroleum, 2013, pp. 73-102.
Shen, Z., Cao, Z., Zhu, X., Li, X. Visbreaking of Chinese oil sand
bitumen. Petroleum Science and Technology, 2008, 26(14), 1676-
1683.
Stormont, D. H. Delayed Coking Techniques Feel Effect of Increased
Needle- Coke Demand, Oil Gas J. 1969, 75–78.
Strausz, O. P.; Mojelsky, T. W.; Lown, E. M., The Molecular-Structure of
Asphaltene - an Unfolding Story. Fuel 1992, 71(12), 1355-1363.
Sheremata, J. M.; Gray, M. R.; Dettman, H. D.; McCaffrey, W. C.,
uantitative Molecular Representation and Sequential Optimization of
Athabasca Asphaltenes. Energy Fuels 2004, 18(5), 1377-1384.
Sachanan, A. N. Conversion of petroleum. Production of motor fuels by
thermal and catalytic processes, 2ed; Reinhold: New York, 1948.
Strausz, O. P.; Lown, E. M. The chemistry of Alberta oil sands, bitumens
and heavy oils; Alberta Energy Research Institute: Calgary, AB, 2003.

115
Speight, J. G., The Chemistry and Technology of Petroleum. 4th ed.; CRC
Press, Taylor and Francis Group: Boca Raton, 2006.
Mehrotra, A.K.; Svreck,W.Y. Viscosity, Density and Gas Solubility Data
Oil Sand Bitumens. Part 2: Peace River Vitumen Saturated with N2,
CO and C2H6. AOSTRA J. Res. 1985, 1(4), 269-279.
Rice, F.O. The thermal decomposition of organic compounds from the
standpoint of free radicals. I. Saturated hydrocarbons. J. Am. Chem. Soc.
1931, 53, 1959–1972.
Moschopedis, S. E.; Parkash, S.; Speight, J. G. Thermal decomposition of
asphaltenes. Fuel 1978, 57, 431-434.
Lee, D. G.; Noureldin, N. A.; Mourits, F. M. The effect of low
temperature oxidation on the chemical and physical properties of maltenes
and asphaltenes derived from heavy oil. Prepr. Pap.-Am. Chem. Soc., Div.
Petrol. Chem. 1987, 32 (4), 853-856.
Shaw, J. M.; Gaikwad, R. P.; Stowe, D. A., Phase Splitting of Pyrene-
Tetralin Mixtures under Coal-Liquefaction Conditions. Fuel 1988, 67(11),
1554-1559.
Henderson, J. H.; Weber, L. Physical upgrading of heavy crude oils by the
application of heat. J. Can. Petrol. Technol. 1965, 4 (4), 206-212.
Ball, M. W. Development of the Athabaska oil sands. Can. Inst. Min.
Metall. 1941, 44, 58-91.
Erdman, J. G.; Dickie, J. P. Mild thermal alteration of asphaltic crude oils.
Prepr. Pap.-Am. Chem. Soc., Div. Petrol. Chem. 1964, 9, B69-B79.
Speight, J. G.; Moschopedis, S. E. The influence of crude oil composition
on the nature of the upgrading process: Athabasca bitumen. In The
future of heavy crude and tar sands; Meyer, R. F., Steele, C. T., Olson,
J. C. Eds.; McGraw-Hill: New York,1981, p. 603-611.
Whitehurst, D. D.; Mitchell, T. O.; Farcasiu, M. Coal liquefaction. The
chemistry and technology of thermal processes; Academic Press: New
York, 1980.
116
Sachanan, A. N. Conversion of petroleum. Production of motor fuels by
thermal and catalytic processes, 2ed; Reinhold: New York, 1948.
Pereira, P.; Flores, C.; Zbinden, H.; Guitian, J.; Solari, R. B.; Feintuch, H.;
Gillis, D. Aquaconversion technology offers added value to E. Venezuela
synthetic crude oil production. Oil Gas J. 2001, 99 (20), 79-85.
Gray, M. R.; McCaffrey, W. C. Role of chain reactions and olefin
formation in cracking, hydroconversion, and coking of petroleum and
bitumen fractions. Energy Fuels 2002, 16, 756-766.
Monaghan, G. V.; Brown, W.A.; Pinchuk, R. J. A process for converting a
liquid feed material into a vapor phase product. Patent WO 2005/040310,
May 6, 2005.
Peng, M. Thermal cracking of asphaltene by addition of hydrogen donor
solvent; MSc thesis, University of Alberta, Edmonton, AB, Canada, 2012.
Blanchard, C. M.; Gray, M. R. Free radical chain reactions of bitumen
residue. 213th ACS National Meeting, San Francisco, April 13-17, 1997,
Fuel - 054.
Savage, P. E. Are aromatic diluents used in pyrolysis experiments inert?
Ind. Eng. Chem. Res. 1994, 33, 1086-1089.
Khorasheh F.; Gray, M. R. High-pressure thermal cracking of n-
hexadecane in aromatic solvents. Ind. Eng. Chem. Res. 1993, 32, 1864-
1876.
Heredy, L. A.; Fugassi, P. Phenanthrene extraction of bituminous coal.
Adv. Chem. Ser. 1966, 55, 448-459.
Chawla, B.; Dabbagh, H. A.; Davis, B. H. Mechanism studies of coal
liquefaction in a nondonor solvent using 14C-labeled 1-methylnaphthalene.
Energy Fuels 1994, 8, 355-359.
Gray, M. R.; Le, T.; Wu, X. A. Role of pressure in coking of thin films of
bitumen. Can. J. Chem. Eng. 2007, 85, 773-780.
Govindhakannan, J.; Khulbe, C. Effect of pressure on delayed coking of
Athabasca bitumen. Prepr. Pap.-Am. Chem. Soc., Div. Petrol. Chem.
2010, 55 (1), 44-45.

117
Osato, K.; Kato, S.; Aida, T. M.; Watanabe, M.; Smith, R. L. Jr.; Inomata,
H. The pyrolysis of oil sand bitumen in the presence of water and toluene.
J. Jpn. Inst. Energy 2012, 91, 303-310.
Miadonye, A.; Latour, N.; Puttagunta, V. R. A correlation for viscosity
and solvent mass fraction of bitumen-diluent mixtures. Petrol. Sci.
Technol. 2000, 18, 1-14.
Tanabe, K.; Gray, M. R. Role of fine solids in the coking of vacuum
residues. Energy Fuels 1997, 11, 1040-1043.
Hammami, A.; Ratulowski, J. Precipitation and deposition of asphaltenes
in production systems: A flow assurance overview. In Asphaltenes, heavy
oils, and petroleomics; Mullins, O. C., Sheu, E. Y., Hammami, A.,
Marshall, A. G. Eds.; Springer: New York, 2010, p. 617-660.
Sirota, E. B. Swelling of asphaltenes. Petrol. Sci. Technol. 1998, 16, 415-
431.
Saber, N.; Shaw, J. M. On the phase behaviour of Athabasca vacuum
residue + n-decane. Fluid Phase Equilibria 2011, 302, 254-259.
Shaw, J. M.; Zou, X. Phase behavior of heavy oils. In Asphaltenes, heavy
oils, and petroleomics; Mullins, O. C., Sheu, E. Y., Hammami, A.,
Marshall, A. G. Eds.; Springer: New York, 2010, p. 489-510.
Bagheri, S. R.; Masik, B.; Arboleda, P.; Wen, Q.; Michaelian, K. H.,
Shaw, J. M. Physical properties of liquid crystals in Athabasca bitumen
fractions. Energy Fuels 2012, 26, 4978-4987.
Zhao, Y.; Wei, F.; Yu, Y. Effects of reaction time and temperature on
carbonization in asphaltene pyrolysis. J. Petrol. Sci. Eng. 2010, 74, 20-25.
De Klerk, A.; Gray, M. R.; Zerpa, N. Unconventional oil and gas:
Oilsands. In Future energy. Improved, sustainable and clean options for
our planet, 2ed; Letcher, T.M. Ed.; Elsevier: Amsterdam, 2014, p. 95-116.
Leprince, P. Visbreaking of residues. In Petroleum refining. Vol. 3.
Conversion processes; Leprince, P. Ed.; Editions Technip: Paris, 2001, p.
365-379.

118
Wiehe, I. A. Process chemistry of petroleum macromolecules; CRC Press:
Boca Raton, FL, 2008.
Zachariah, A.; De Klerk, A. Solvent Deasphalting and Visbreaking
Sequence. Prepr. Pap.-Am. Chem. Soc., Div. Energy Fuels 2014
(Accepted – In press).
Sachanen, A. N. The chemical constituents of petroleum; Reinhold: New
York, 1945, p. 102-107.
Silverstein, R. M.; Bassler, G. C.; Morrill, T. C. Spectrometric
identification of organic compounds, 4ed; Wiley: New York, 1981.
Sanaie, N.; Watkinson, A. P.; Bowen, B. D.; Smith, K. J. Effect of
Minerals on coke precursor formation. Fuel 2001, 80, 1111−1119.
Rahmani, S.; McCaffrey, W. C.; Elliott, J. A. W.; Gray, M. R. Liquid-
phase behavior during the cracking of asphaltenes. Ind. Eng. Chem. Res.
2003, 42, 4101−4108.
Rand, B. The pitch−mesophase−coke transformation as studied by thermal
analytical and rheological techniques. ACS Symp. Ser. 1986, 303, 45−61.
Unzelman, G. H.; Wolf, C. J. Processes. In Petroleum processing
handbook; Bland, W. F., Davidson, R. L. Eds.; McGraw-Hill: New York,
1967, pp 3.20-3.21.
Vilcáeza, J.; Watanabe, M.; Watanabe, N.; Kishita, A.; Adschiri, T.
Hydrothermal extractive upgrading of bitumen without coke formation.
Fuel 2012, 102, 379-385.
Whitehurst, D. D., Mitchell, T. O., Farcasiu, M. Coal liquefaction. The
chemistry and technology of thermal processes; Academic Press: New
York, 1980.
Wang, L.; Yang, S.; Prasad, V.; De Klerk, A. Visbreaking oil sands
bitumen at 400 °C. Prepr. Pap.-Am. Chem. Soc., Div. Energy Fuels 2013,
58 (2), 635-637.
Wang, L.; Zachariah, A.; Yang, S.; Prasad, V.; De Klerk, A.
Visbreaking oilsands derived bitumen in the temperature range 340 – 400
°C. Energy Fuels 2014, (DOI: 10.1021/ef501158p).

119
Zachariah, A.; De Klerk, A. Impact of solvents on thermal conversion of
oil sands derived bitumen. Prepr. Pap.-Am. Chem. Soc., Div. Energy Fuels
2013, 58 (1), 962-963.
Zachariah, A.; Wang, L.; Yang, S.; Prasad, V.; De Klerk, A. Suppression
of coke formation during bitumen pyrolysis. Energy Fuels 2013, 27, 3061-
3070.