Aseri Baleilevuka OCEANS & ISLANDS PROGRAM SOPAC-SPC Benthic Habitat Mapping Lifuka Island.
17
Aseri Baleilevuka OCEANS & ISLANDS PROGRAM SOPAC-SPC Benthic Habitat Mapping Lifuka Island
-
Upload
alice-robinson -
Category
Documents
-
view
213 -
download
0
Transcript of Aseri Baleilevuka OCEANS & ISLANDS PROGRAM SOPAC-SPC Benthic Habitat Mapping Lifuka Island.

Aseri BaleilevukaOCEANS & ISLANDS PROGRAM
SOPAC-SPC
Benthic Habitat Mapping Lifuka Island

What is habitat mapping?• A habitat map is basically a map of the different features of the ocean
floor.• Marine habitat mapping is the synthesis of physical and biological data
necessary delineate the distribution and extent of marine biota and their habitats.
• Marine habitat maps helps us recognise the importance of marine habitats as sources of beach sediments.
Purpose for the Lifuka project: 1. To use as base maps to determine the composition of the island
sediment system.2. Adds to the foundation of essential baseline information that can
inform the development and design of appropriate adaptation options for Lifuka.

Habitat Mapping Process
Field Data Collection and Analysis1. Ground truthing - field data collection (Drop camera videos &
subsurface photographs)2. Control point survey3. Videos & Snorkeling Photos analysis 4. Satellite image data processing
Benthic Habitat Mapping Production5. Expert knowledge, Manual delineation6. Unsupervised classification (ArcGIS v9.3)

Ground truthing: Drop camera videos
• SeaViewer under water video camera
camera Video surface console
Still photo

Ground truthing: Snorkel photos
UQ-BRSG
camera
Drybag containing GPS
Position of photos determined by synchronizing GPS & photo time using GPicSync software
Resulting kml file

Reference Image Points survey
• To minimize mis-registration between field data and image, control points are measured using Trimble R8 system.
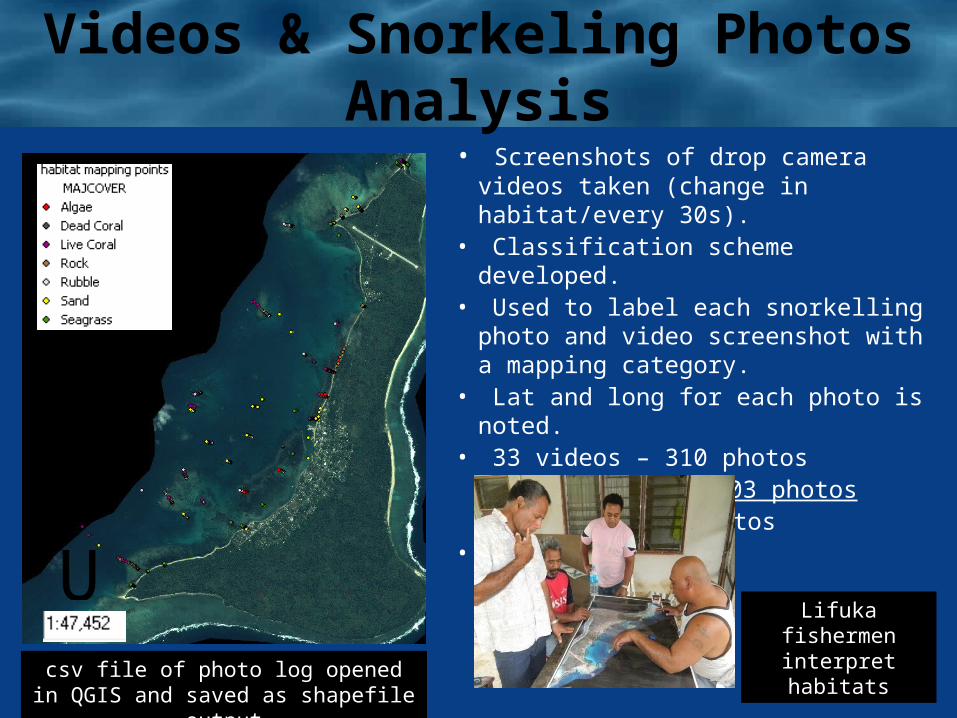
Videos & Snorkeling Photos Analysis• Screenshots of drop camera videos taken
(change in habitat/every 30s).• Classification scheme developed.• Used to label each snorkelling photo and
video screenshot with a mapping category.• Lat and long for each photo is noted.• 33 videos – 310 photos snorkel - 303 photos
607 photos• Local knowledge
Ücsv file of photo log opened in QGIS and
saved as shapefile output
Lifuka fishermen interpret habitats
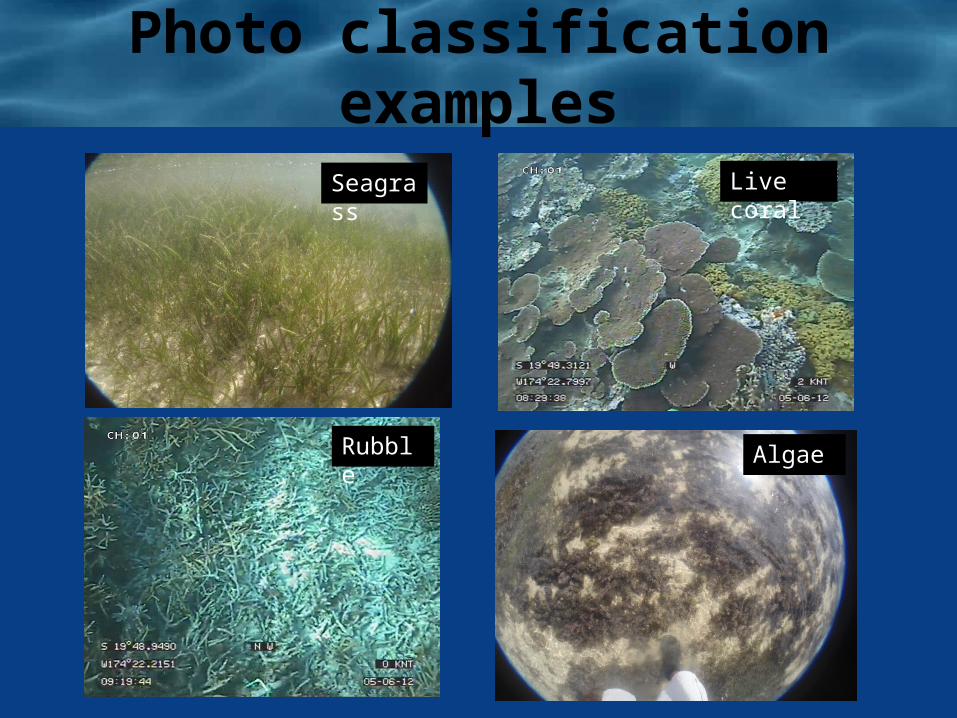
Photo classification examples
Seagrass Live coral
Rubble Algae

Satellite Image processing
• Multi-spectral high resolution World View 2 imagery (50cm x 50cm pixels) acquired on 10 June 2011.
• Reduced from 64 to 24 bit for processing
• Global Mapper software used for adjusting contrast and geometrically correcting raster image.
• Image rectified with reference points from Trimble R8
• Output:TO_Lifuka_WV2_10JUN2011_24bit_adjusted_contrast_rectified.tif

Habitat map production• The National Oceanic and Atmospheric Administration (NOAA) habitat
classification scheme is used – based on 3 attributes: geographic “zones”, geomorphological structure and biological cover.

Habitat Map of Zone Types
• Manually delineated using NOAA‘s description of zones
• Digitized in ArcGIS v9.3 at a scale of 1:2,500

Habitat Map of Structure Types
• Manually delineated using NOAA’s description of structure types
• Digitized in ArcGIS v9.3 at a scale of 1:5,000

Mapping of Biological cover
Unsupervised classification in ArcGIS v9.3
• Island and area of no data masked• Iso Cluster tool used to create 20
spectral classes• Maximum likelihood tool to perform
EQUAL priori classification on image using signature file produced above
Ü0 1 2 30.5
Kilometers

Habitat Map of Biological cover
• classes produced used to inform and direct definitions of biological cover as described by the NOAA classification.
• Videos and snorkelling photographs as guide, categories defined.
• Digitized in ArcGIS v9.3 at a scale of 1:2,500

Other methods and softwares tested
• Training shapefile of 200 polygons (digitized in ArcGIS v9.3)
• Segmentation using Berkeley Image Segmentation software in conjunction with WEKA data mining software (Open source)
• NOAA’s Habitat Digitizer Extension to ArcView
• Supervised classification in ArcGIS v9.3

Acknowledgements
• Habitat mapping project conducted by the whole Marine Survey team (Ocean & Islands Program, SOPAC - SPC)
• NOAA’s Centre for Coastal Monitoring and Assessment (CCMA)
• The University of Queensland (Biophysical Remote Sensing Group)

Poster Map