ASEAN Startup Landscape - Amazon S3Startup+Lands… · ASEAN Startup Landscape Policy Roundtable...
38
Private & confidential. 2017 All rights reserved. ASEAN Startup Landscape Policy Roundtable, GECS 2017 December 13, 2017
-
Upload
vuongthien -
Category
Documents
-
view
218 -
download
0
Transcript of ASEAN Startup Landscape - Amazon S3Startup+Lands… · ASEAN Startup Landscape Policy Roundtable...

Private & confidential. 2017 All rights reserved.
ASEAN Startup Landscape
Policy Roundtable, GECS 2017
December 13, 2017
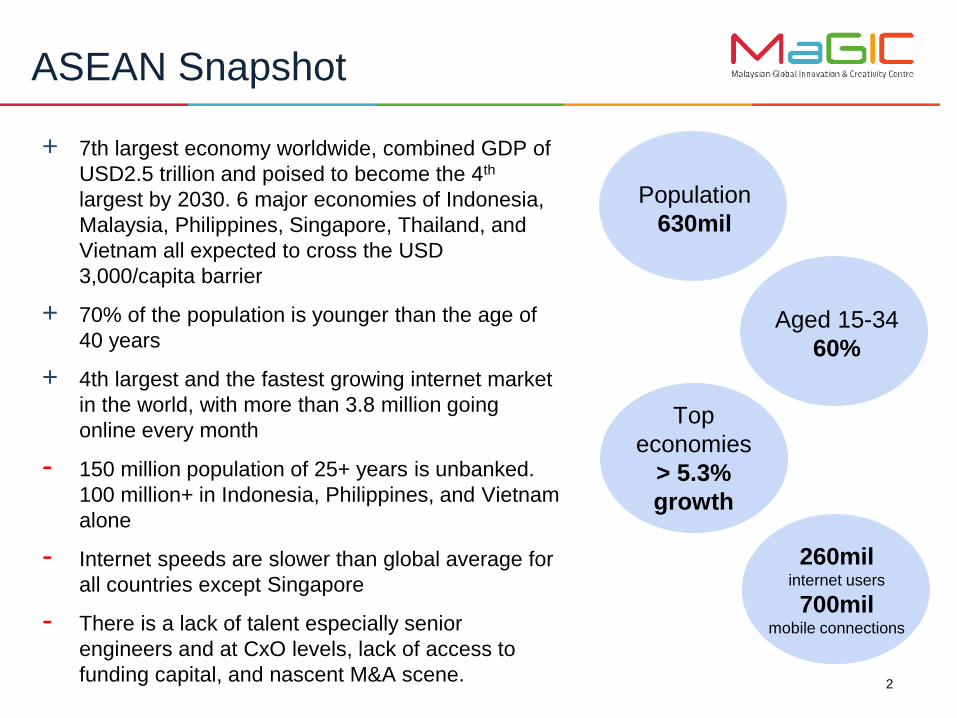
+ 7th largest economy worldwide, combined GDP of
USD2.5 trillion and poised to become the 4th
largest by 2030. 6 major economies of Indonesia,
Malaysia, Philippines, Singapore, Thailand, and
Vietnam all expected to cross the USD
3,000/capita barrier
+ 70% of the population is younger than the age of
40 years
+ 4th largest and the fastest growing internet market
in the world, with more than 3.8 million going
online every month
- 150 million population of 25+ years is unbanked.
100 million+ in Indonesia, Philippines, and Vietnam
alone
- Internet speeds are slower than global average for
all countries except Singapore
- There is a lack of talent especially senior
engineers and at CxO levels, lack of access to
funding capital, and nascent M&A scene.2
ASEAN Snapshot
Population
630mil
Aged 15-34
60%
Top
economies
> 5.3%
growth
260milinternet users
700milmobile connections

3
ASEAN Startup Ecosystem
Source: The Asean Post https://www.theaseanpost.com/article/asean-new-breeding-ground-startups
The Ecosystem is largely dominated by E-commerce, Fintech, and On-Demand services.
There are positive signs for HealthTech too. MaGIC’s Global Accelerator Program (GAP)
has seen a near three folds increase in the number of applications from Fintech and
HealthTech ventures in 2017.

4
Digital Opportunity
There are an estimated 7,000 startups in South East Asia. Some 1,000 have received
funding and only half of these have received funding beyond seed. However, between
2016 and Q3 2017, Southeast Asian internet companies were able to raise more than
$12B of capital, up from just $1B in 2015 indicative of the growing focus on the region.
Source: http://apac.thinkwithgoogle.com/research-studies/e-conomy-sea-unlocking-200b-digital-opportunity.html
https://apac.thinkwithgoogle.com/intl/en/research-studies/e-conomy-sea-spotlight-2017-unprecedented-growth-southeast-asia-50-billion-internet-economy.html

5
Internet Economy is ready to take-off
Source: http://apac.thinkwithgoogle.com/research-studies/e-conomy-sea-unlocking-200b-digital-opportunity.html

Private & confidential. 2017 All rights reserved.
Ecosystem Reports
1. Startup Genome
2. Global Entrepreneurship Monitor (GEM)
3. Global Entrepreneurship Index (GEI)
6

7
Ecosystem Lifecycle Model
As an ecosystem grows,
it goes through the
following four phases,
distinct in their
characteristics such as
size, strengths and
challenges and what
triggers them to the next
phase.
Source: https://startupgenome.com/report2017/

8
Startup Genome 2017: Kuala Lumpur
• Kuala Lumpur ranks in the Activation
phase and is home to some 350 - 650
startups. It’s startup growth index is the
third highest globally.
• The city has an Ecosystem Value of
$1.1 billion dollars. On this measure of
startup valuations and exits, Kuala
Lumpur’s ecosystem is the 7th fastest
growing globally.
• Kuala Lumpur’s Global
Connectedness ranked higher than
other city ecosystems in the same
phase of development, ranking well
higher than the global median on both
inbound and outbound International
relationships.
• Global Connectedness quantifies the
valuable international relationships
that exist between startup leaders.
The factor is highly correlated with the
percentage of foreign customers, and is
also highly correlated with Global
Resource Attraction. Ecosystems that
see a large flow of startups and
entrepreneurs move into it benefit from
this flow, capitalizing on it through global
relationships which enhances the ability
to “go global.”
Whilst not all ASEAN ecosystems participate in
the Startup Genome report, MaGIC’s own research
through it’s ASEAN Centre of Entrepreneurship
(ACE) shows that the region performs well on
factors of Global Connectedness, Women
Entrepreneurship, and Talent Access and Cost.
Source: https://startupgenome.com/report2017/

9
Startup Genome 2017: Singapore
Source: https://startupgenome.com/report2017/

Points to focus on from Startup Genome assessment:
Foundation Issues:
● Entrepreneurial Spirit of the population and how it manifests into
Entrepreneurial Activity
● Mindset of the entrepreneur class
Focal Issues:
● Local Connectedness: Relationships between entrepreneurs, investors and
other ecosystem stakeholders and the resources that are shared
● Seed-Funding gap
● Rhythm of exists over $100mil: access to global know-how about how to
develop a startup and what global customer needs are so startups effectively
tackle globally-relevant problems that are yet to be solved
10
Startup Genome 2017

11
Total Entrepreneurial Activity
GEM reports on Total
Early-stage Entrepreneurial
Activity (TEA)
Most ASEAN ecosystems
have low rates of Innovation
in their entrepreneurial
activity.
TEA (%) Innovation
Rate (%)
2016 TEA
Rank/65
Indonesia 14.1 17.7 20
Malaysia 4.7 3.5 63
Philippines 17.2 31.8 16
Thailand 17.2 17.1 11
Singapore 11 (2014) 20.5 (2014) -
Vietnam 13.7 16.5 20
Burkina Faso 33.5 22.5 1
Ecuador 31.8 16.4 2
Belize 28.8 48.2 3
Source: http://www.gemconsortium.org/report

12
GEM 2016/17: Malaysia (Example)
● Malaysia ranks 62/65 on TEA
● Malaysia ranks 65/65 on Innovation-
driven Entrepreneurship
● Ranks 18/65 on Government
Entrepreneurship Programs and
16/65 on Government Policies that
Support the ecosystem
● GEM covers one of the widest
surveys to prepare it’s ecosystem
report. Every year typically 65-70
economies are covered through a
survey reaching over 200,000 of the
adult population in the various
economies. Other ASEAN ecosystem
pages can be found in the source
below.
Source: http://www.gemconsortium.org/country-profile/86

13
GEM 2016/17: Ecosystems Compared
ASEAN GEM Average
ASEAN CHILE
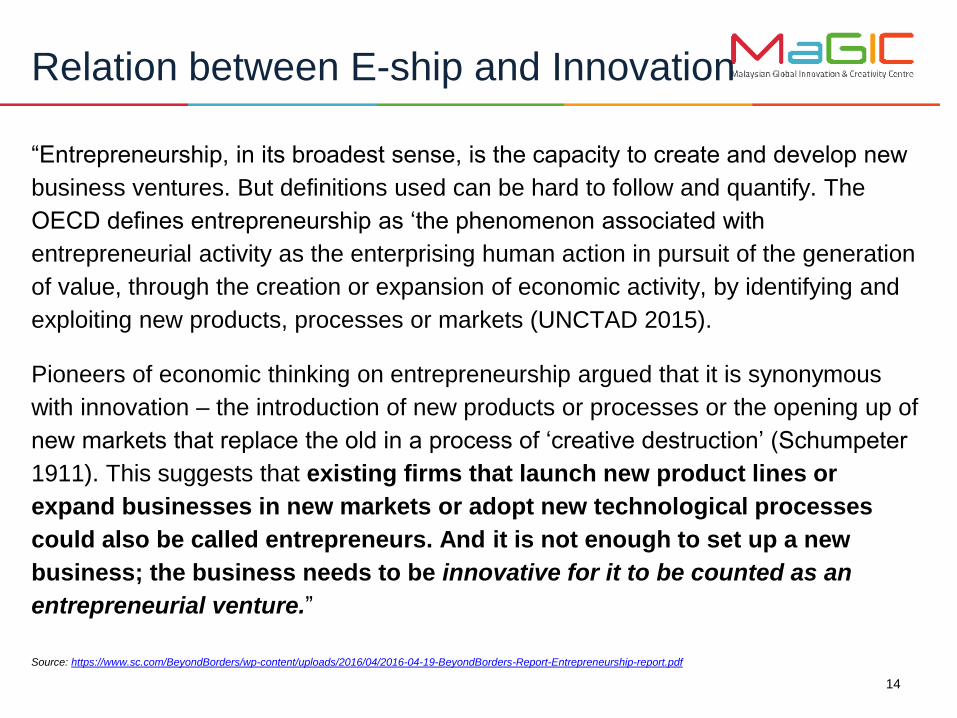
“Entrepreneurship, in its broadest sense, is the capacity to create and develop new
business ventures. But definitions used can be hard to follow and quantify. The
OECD defines entrepreneurship as ‘the phenomenon associated with
entrepreneurial activity as the enterprising human action in pursuit of the generation
of value, through the creation or expansion of economic activity, by identifying and
exploiting new products, processes or markets (UNCTAD 2015).
Pioneers of economic thinking on entrepreneurship argued that it is synonymous
with innovation – the introduction of new products or processes or the opening up of
new markets that replace the old in a process of ‘creative destruction’ (Schumpeter
1911). This suggests that existing firms that launch new product lines or
expand businesses in new markets or adopt new technological processes
could also be called entrepreneurs. And it is not enough to set up a new
business; the business needs to be innovative for it to be counted as an
entrepreneurial venture.”
Source: https://www.sc.com/BeyondBorders/wp-content/uploads/2016/04/2016-04-19-BeyondBorders-Report-Entrepreneurship-report.pdf
14
Relation between E-ship and Innovation

GEM doesn’t produce an index. It ranks economies on various
entrepreneurship related factors. The scores end up showing the quantity of
entrepreneurship, and not necessarily the quality.
GEM’s TEA is made up of both necessity-driven entrepreneurship and opportunity-
driven entrepreneurship. In most of the factor-driven economies and poor
economies of the world, necessity-driven entrepreneurship is high as people as no
option but to self-sustain themselves through entrepreneurship. However this
doesn’t necessarily mean their entrepreneurship ecosystems are well developed –
TEA does not indicate the quality of these ecosystems.
“While many think of the output of ecosystems as more startups, like GEM, this is
wrong and misleading. The dual service created by entrepreneurial ecosystems is
(1) resource allocation towards productive uses and (2) the innovative, high-growth
ventures that drive this process.”
Source: The Global Entrepreneurship Index 2017 Report, https://thegedi.org
15
Why Innovation matters?

16
Focus on Scaleups
Data from World Bank analyzed by
Endeavor Insight shows that scaleups
in SEA account for only 14% of all
companies but create 77% of the net
new jobs.
A scaleup (company) is a company who
has an average annualized return of at
least 20% in the past 3 years with at least
10 employees in the beginning of the
period (OECD, 2007)
The importance of scaleups and the rise of
their terminology can be found in the study
of the World Economic Forum which found
that not all start-ups make it big, but the
ones that do greatly impact society by
means of new techonolgy, services and
increased employment.Source: http://www.ecosysteminsights.org/scaleup-companies-create-most-of-southeast-asias-new-jobs/
https://en.wikipedia.org/wiki/Scaleup_company

17
Relation between GDP and E-ship
en
tre
pre
ne
urs
hip
economic
development
Factor-driven
stage
Efficiency-driven
stage
Innovation-driven
stage
“Countries that have low
necessity entrepreneurship
are more developed and
countries that have a high
level of necessity
entrepreneurship have a low
level of development. The
relationship between
Entrepreneurship and
Economic development is
positive (S-shaped curve)
when only opportunity-
driven entrepreneurship is
considered.”
Innovation accounts for only
5% of economic activity in
factor-driven and 10% of
economic activity in efficiency
driven.
Source: The Global Entrepreneurship Index 2017 Report, https://thegedi.orgh
https://www.imperial.ac.uk/business-school/research/innovation-and-entrepreneurship/events/conferences/gedi/about-gedi/

18
Global Entrepreneurship Index
GEI 2018
(Rank)
Economic
Impact
($bil)
Brunei 34.3 (53) 1.43
Cambodia 17.6 (113) 25.38
Indonesia 20.7 (94) 534.70
Loas 17.8 (112) 12.91
Malaysia 32.7 (58) 100.96
GEI 2018
(Rank)
Economic
Impact ($bil)
Myanmar 13.6 (127) 84.06
Philippines 24.1 (84) 241.09
Singapore 52.7 (27) 28.55
Thailand 27.4 (71) 181.86
Vietnam 23.2 (87) 200
ChileEstonia Singapore
Brunei DarussalamMalaysiaPhilippinesVietnam
Indonesia
Lao PDRMyanmar
R² = 0.7689
0
10
20
30
40
50
60
70
80
90
100
0 10000 20000 30000 40000 50000 60000 70000 80000 90000 100000 110000
GEI 2018 vs GDP Per Capita (PPP)

GEDI defines entrepreneurial ecosystems as
“...dynamic institutionally embedded
interaction between entrepreneurial
attitudes, abilities and aspirations, by
individuals, which drives the allocation of
resources through the creation and operation of
new ventures.”
• It measures include 14 pillars across the
three dimensions of Attitude, Ability, and
Aspiration.
• The measures include both individual-level
and institutional/environment variables. The
individual-level variables are from the GEM
survey, whilst institutions variables are from
other sources.
• It uses the Penalty of Bottleneck algorithm,
to penalize the higher performing pillar
values and adjusts these to the weakest
performing pillar value.
19
Global Entrepreneurship Index
Source: http://thegedi.org/global-entrepreneurship-and-development-index/

20
GEI 2018: Attitude, Ability, Aspiration
ChileEstonia
Singapore
Brunei DarussalamMalaysia
PhilippinesVietnam
Indonesia
Lao PDR
Myanmar
R² = 0.7134
0
20
40
60
80
100
0 10000 20000 30000 40000 50000 60000 70000 80000 90000 100000 110000
Aspiration vs GDP Per Capita (PPP)
ChileEstonia Singapore
Brunei DarussalamMalaysiaPhilippines
Vietnam
Indonesia
Lao PDR
Myanmar
R² = 0.7298
0
20
40
60
80
100
0 10000 20000 30000 40000 50000 60000 70000 80000 90000 100000 110000
Ability vs GDP Per Capita (PPP)
Chile
Estonia
SingaporeBrunei Darussalam
MalaysiaPhilippines
VietnamIndonesia
Lao PDRMyanmar
R² = 0.7067
0
20
40
60
80
100
0 10000 20000 30000 40000 50000 60000 70000 80000 90000 100000 110000
Attitude vs GDP Per Capita (PPP)
For ASEAN countries, the
scores for Attitude and
Aspiration impact overall
GEI score more than the
scores for Ability.
Hence, as per the Penalty of
Bottleneck Algorithm, the way
to improve the overall GEI
scores is to focus more on the
Attitude and Aspiration pillars.
This relates to the findings
from Startup Genome too
where Talent access was not
seen as a stumbling issue.
Source: http://thegedi.org/global-entrepreneurship-and-development-index/

21
GEI Innovation Driven Economies
# # #
Opportunity Perception 0.40 8 Freedom 0.69 2 Opportunity Recognition 0.55 11
Start-up Skills 0.16 17 Tertiary Education 0.62 9 Skill Perception 0.38 17
Risk Acceptance 0.56 3 Country Risk 0.61 3 Risk Perception 0.73 4
Networking 0.58 6 Aggloremation 0.76 1 Known Entrepreneurs 0.63 8
Cultural Support 0.22 15 Corruption 0.56 9 Career Status 0.25 18
Entrepreneurial Attitudes 0.33 10
Opportunity Startup 0.61 5 Governance 0.67 4 Opportunity Motivation 0.93 1
Technology Absorption 0.09 18 Tech Absorption 0.77 1 Technology Level 0.00 18
Human Capital 0.63 4 Labor Market 0.89 1 Educational Level 0.89 3
Competition 0.41 2 Market Dominance 0.81 1 Competitors 0.48 15
Entrepreneurial Abilities 0.36 7
Product Innovation 0.12 18 Technology Transfer 0.82 1 New Product 0.34 18
Process Innovation 0.90 1 Science GERD 0.69 2 New Tech 0.88 4
High Growth 0.13 17 Finance and Strategy 1.00 1 Gazelle 0.10 18
Internationalization 0.45 8 Globalization 0.71 4 Export 0.52 12
Risk Capital 0.14 15 Depth of Capital Market 0.93 1 Informal Investment 0.35 15
Entrepreneurial Aspirations 0.29 13
GEI 0.33 12 INSTITUTIONAL 0.74 1 INDIVIDUAL 0.47 16
Bottom quartile
Lower middle quartile
Higher middle quartile
Top quartile
PILLARS INSTITUTIONAL VARIABLES INDIVIDUAL VARIABLES
# Malaysia's ranking for the variable is indicated next to its pillar value
Countries included in the comparison are: Argentina, Brazil, Chile, Costa Rica, Croatia, Hungary, Latvia, Lebanon, Lithuania, Malaysia,
Mexico, Oman, Panama, Poland, Romania, Russia, Turkey, and Uruguay. Seychelles and Mauratius data is not available.
When compared to other
economies transitioning
to becoming Innovation-
driven, Malaysia ranks
low on individual-level
scores for Startup skills,
Career Status,
Technology level,
Product Innovation, High
Growth, and Risk
Capital.
Most of the above also
applies across ASEAN
countries including
Singapore. The
Institutional variable scores
are mostly stronger than
individual scores, which
are lowest on the Attitude
and Aspiration pillars.

22
GEI 2018: Comparisons
0
0.2
0.4
0.6
0.8
11. Opportunity Perception
2. Startup Skills
3. Risk Acceptance
4. Networking
5. Cultural Support
6. Opportunity Startup
7. Technology Absorption
8.Human Capital
9. Competition
10. Product Innovation
11. Process Innovation
12. High Growth
13. Internationalization
14. Risk Capital
Indonesia Singapore Malaysia
0
0.10.2
0.3
0.4
0.5
0.6
0.7
0.8
0.91. Opportunity Perception
2. Startup Skills
3. Risk Acceptance
4. Networking
5. Cultural Support
6. Opportunity Startup
7. Technology Absorption
8.Human Capital
9. Competition
10. Product Innovation
11. Process Innovation
12. High Growth
13. Internationalization
14. Risk Capital
Thailand Vietnam Philippines
0
0.2
0.4
0.6
0.8
11. Opportunity Perception
2. Startup Skills
3. Risk Acceptance
4. Networking
5. Cultural Support
6. Opportunity Startup
7. Technology Absorption
8.Human Capital
9. Competition
10. Product Innovation
11. Process Innovation
12. High Growth
13. Internationalization
14. Risk Capital
India China MalaysiaSource: http://thegedi.org/global-entrepreneurship-and-development-index/

23
% of Effort on GEI
00.10.20.30.40.50.60.70.80.9
11. Opportunity Perception
2. Startup Skills
3. Risk Acceptance
4. Networking
5. Cultural Support
6. Opportunity Startup
7. Technology Absorption
8.Human Capital
9. Competition
10. Product Innovation
11. Process Innovation
12. High Growth
13. Internationalization
14. Risk Capital
Korea Malaysia Singapore Chile
A 10% increase in GEI scores for all ASEAN economies could add USD1.4trillion to the
ASEAN economy.
Chart below applies to Malaysia, showing the percentage of total effort that needs to go into
increasing Malaysia’s GEI score by 10 points.
Source: http://thegedi.org/global-entrepreneurship-and-development-index/

1. Demographics: Changing demographics (e.g., ageing population) will affect the pipeline
of entrepreneurs and impact entrepreneurial dynamism.
2. New Nature of entrepreneurship: Traditionally entrepreneurial companies create jobs.
However the rate of job growth today lags behind revenue thanks to technology. At the
same time, platforms lower barriers to entry and open more entrepreneurial opportunities
(think Airbnb, Uber etc.) - micro-entrepreneurship is on the rise.
3. Third wave of Innovation: puts corporates at an advantage. This is because the third
wave mostly involves products and services that are much more costly to create. Hence
ecosystem development needs to match corporates that are keen on innovation with
startups and entrepreneurs that have new business model ideas but may not have access
to resource and markets.
4. Collaborative economy is here to stay: Ownerships is reducing, and other ways to
share, borrow, rent are on the rise. The five main sharing economy sectors (collaborative
finance, peer-to-peer accommodation, peer-to-peer transportation, on-demand household
services and on-demand professional services) are poised to generate $335 billion by
20251. Platforms that enable the sharing economy are already some of the biggest
corporations in the world.
Source: 1 The Sharing Economy – Sizing the Revenue Opportunity, PWC, http://pwc.blogs.com/files/sharing-economy-final_0814.pdf24
Entrepreneurial Ecosystem Shifts

25
Ecosystem Stakeholder Model
Source: MIT Reap http://reap.mit.edu/
This is the generally accepted
stakeholder model.
The future though is a
collaborative economy
where our citizens play a
crucial role – not only are
they beneficiaries of
innovation but they have an
important participatory role
to play in the ecosystem.
The ASEAN stakeholder
model needs to be and will
be different.
Platforms such as MaGIC’s
Actyvate (http://actyvate.my/)
are examples of how the
collaborative economy is
shaping up in ASEAN.

1. Startup Genome = Ecosystem Lifecycle Model
Global Entrepreneurship Monitor = Total Early-stage Entrepreneurial
Activity
Global Entrepreneurship and Development Institute = Entrepreneurship
Index
2. ASEAN countries need to focus their entrepreneurship programs on
mindset change, and on supporting not just startups but also scaleups.
3. Collaborative economy needs to include platforms, such as
crowdsourcing and crowdfunding platforms, that involve citizens at
large, unlocking collective creative and innovation capabilities.
Additionally data from these platforms will help in measuring the impact
of this innovation to the economy and will help shape ASEAN’s Social
Enterprise future at the same time.
26
Summary

Private & confidential. 2017 All rights reserved.
https://mymagic.my
@magiccyberjayaAditya Tuli, VP Tech and Innovation, @adityatuli
Private & confidential. 2017 All rights reserved.
28
Appendix
29
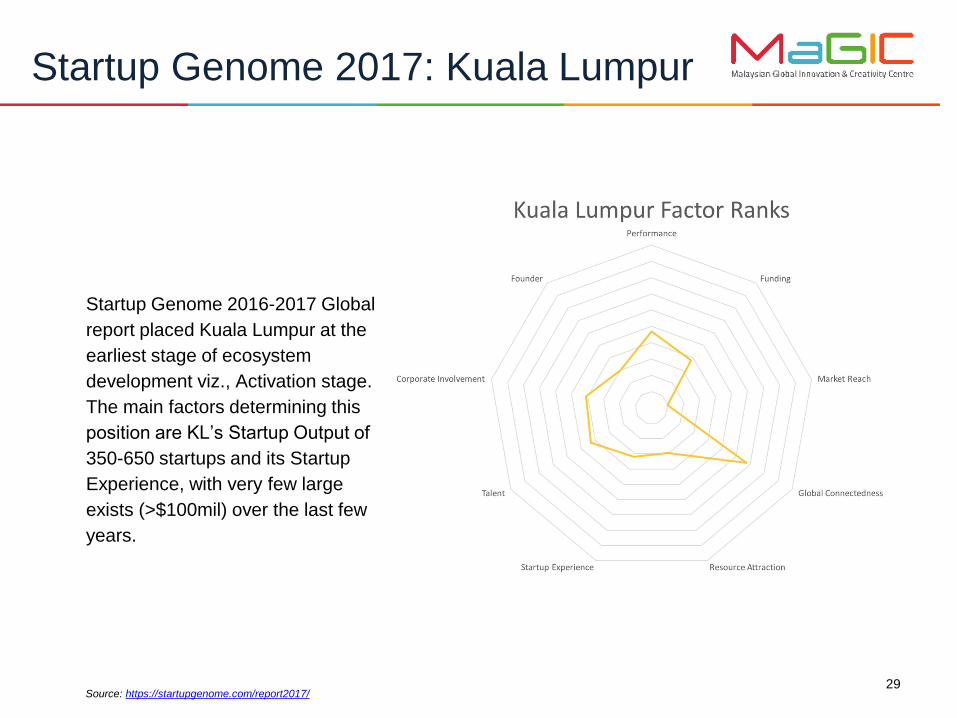
Startup Genome 2017: Kuala Lumpur
Startup Genome 2016-2017 Global
report placed Kuala Lumpur at the
earliest stage of ecosystem
development viz., Activation stage.
The main factors determining this
position are KL’s Startup Output of
350-650 startups and its Startup
Experience, with very few large
exists (>$100mil) over the last few
years.
Source: https://startupgenome.com/report2017/

30
GEM 2016/17: Indonesia
Source: http://www.gemconsortium.org/report

31
GEM 2016/17: Malaysia
Source: http://www.gemconsortium.org/report

32
GEM 2016/17: Thailand
Source: http://www.gemconsortium.org/report
35
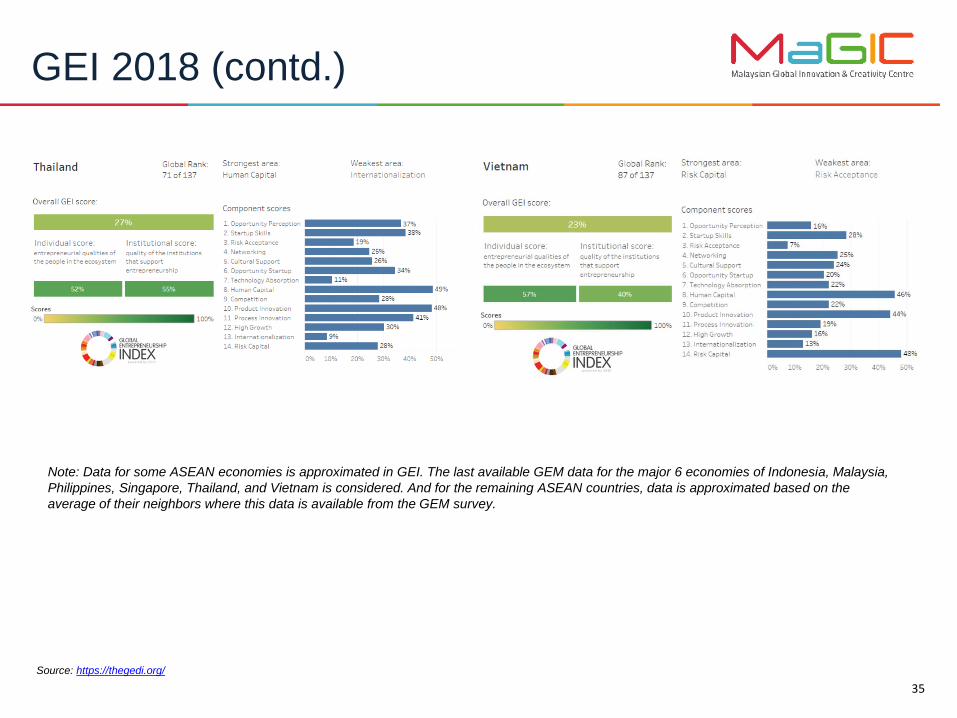
GEI 2018 (contd.)
Source: https://thegedi.org/
Note: Data for some ASEAN economies is approximated in GEI. The last available GEM data for the major 6 economies of Indonesia, Malaysia,
Philippines, Singapore, Thailand, and Vietnam is considered. And for the remaining ASEAN countries, data is approximated based on the
average of their neighbors where this data is available from the GEM survey.

Pillar 2: Startup Skills. Launching a successful venture requires the potential entrepreneur to have the
necessary startup skills. Skill Perception measures the percentage of the population who believe they
have adequate startup skills. Most people in developing countries think they have the skills needed to start
a business, but their skills were usually acquired through workplace trial and error in relatively simple
business activities. In developed countries, business formation, operation, management, etc., require skills
that are acquired through formal education and training. Hence education, especially post-secondary
education, plays a vital role in teaching and developing entrepreneurial skills. Today there are 150 million
students enrolled in some kind of education beyond high school, a 53 percent increase in less than a
decade. People all over the world see education as a pathway out of poverty.
Pillar 5: Cultural Support. This pillar is a combined measure of how a country’s inhabitants view
entrepreneurs in terms of status and career choice, and how the level of corruption in that country affects this
view. Without strong cultural support, the best and brightest do not want to be responsible entrepreneurs,
and they decide to enter a traditional profession. Career Status is the average percentage of the
population age 18-64 who say that entrepreneurship is a good career choice and enjoys high status.
The associated institutional variable measures the level of corruption. High levels of corruption can
undermine the high status and steady career paths of legitimate entrepreneurs.
36
GEI Pillars: Focus Pillars explained

Pillar 7: Technology Absorption. In the modern knowledge economy, information and communication
technologies (ICT) play a crucial role in economic development. Not all sectors provide the same chances for
businesses to survive and or their potential for growth. The Technology Level variable is a measure of the
businesses that are in technology sectors. The institutional variable, Tech Absorption, is a measure of a
country’s capacity for firm-level technology absorption, as reported by the World Economic Forum. The
diffusion of new technology, and the capability to absorb it, is vital for innovative firms with high growth
potential.
Pillar 10: Product Innovation. New products play a crucial role in the economy of all countries. While
countries were once the source of most new products, today developing countries are producing products
that are dramatically cheaper than their Western equivalents. New Product is a measure of a country’s
potential to generate new products and to adopt or imitate existing products. In order to quantify the
potential for new product innovation, an institutional variable related to technology and innovation transfer
seems to be relevant. Technology Transfer is a complex measure of whether a business environment allows
the application of innovations for developing new products.
37
GEI Pillars: Focus Pillars explained

Pillar 12: High Growth. High Growth is a combined measure of the percentage of high-growth
businesses that intend to employ at least 10 people and plan to grow more than 50 percent in five
years (Gazelle variable) with business strategy sophistication (Business Strategy variable) and venture
capital financing possibility (Venture Capital). It might be argued that a shortcoming of the Gazelle variable is
that growth is not an actual but an expected rate. However, a measure of expected growth is in fact a more
appropriate measure of aspiration than a measure of realized growth. Business Strategy refers to “the ability
of companies to pursue distinctive strategies, which involves differentiated positioning and innovative means
of production and service delivery.” High Growth combines high growth potential with a sophisticated
strategy and growth specific venture capital finance.
Pillar 14: Risk Capital. The availability of risk finance, particularly equity rather than debt, is an essential
precondition for fulfilling entrepreneurial aspirations that are beyond an individual entrepreneur’s personal
financial resources. Here we combine two kinds of finance, the informal investment (Informal Investment)
and the institutional depth of capital market (DCM). Informal Investment is defined as the percentage of
informal investors in the population age 18-64, multiplied by the average size of individuals’
investment in other people’s new businesses. While the rate of informal investment is high in factor-
driven economies, the amount of informal investment is considerably larger in efficiency- and innovation-
driven countries; combining them balances these two effects. Our institutional variable here is DCM, one of
the six sub-indices of the Venture Capital and Private Equity Index. This variable is a complex measure of
the size and liquidity of the stock market, level of IPO, M&A, and debt and credit market activity, which
encompass seven aspects of a country’s debt and capital market. 38
GEI Pillars: Focus Pillars explained