
ASEAN Financial Integration towards ASEAN 2025 · Source: ASEAN Secretariat (2014) ASEAN Community...
32
ASEAN Financial Integration towards ASEAN 2025: Call for a well-coordinated supervisory and regulatory framework Satoru (Tomo) Yamadera Principal Financial Sector Specialist Asian Development Bank
Transcript of ASEAN Financial Integration towards ASEAN 2025 · Source: ASEAN Secretariat (2014) ASEAN Community...
ASEAN Financial
Integration towards
ASEAN 2025: Call for a well-coordinated supervisory and
regulatory framework
Satoru (Tomo) Yamadera
Principal Financial Sector Specialist
Asian Development Bank
Outline
• ASEAN Community and ASEAN Economic Community
• ASEAN Financial Integration Framework (AFIF) and ASEAN Banking Integration Framework (ABIF)
• Current status of ASEAN Economic and Financial integration
• Future steps: what needs to be done?
– Strategies embedded in the ASEAN Economic Community Blueprint 2025
2
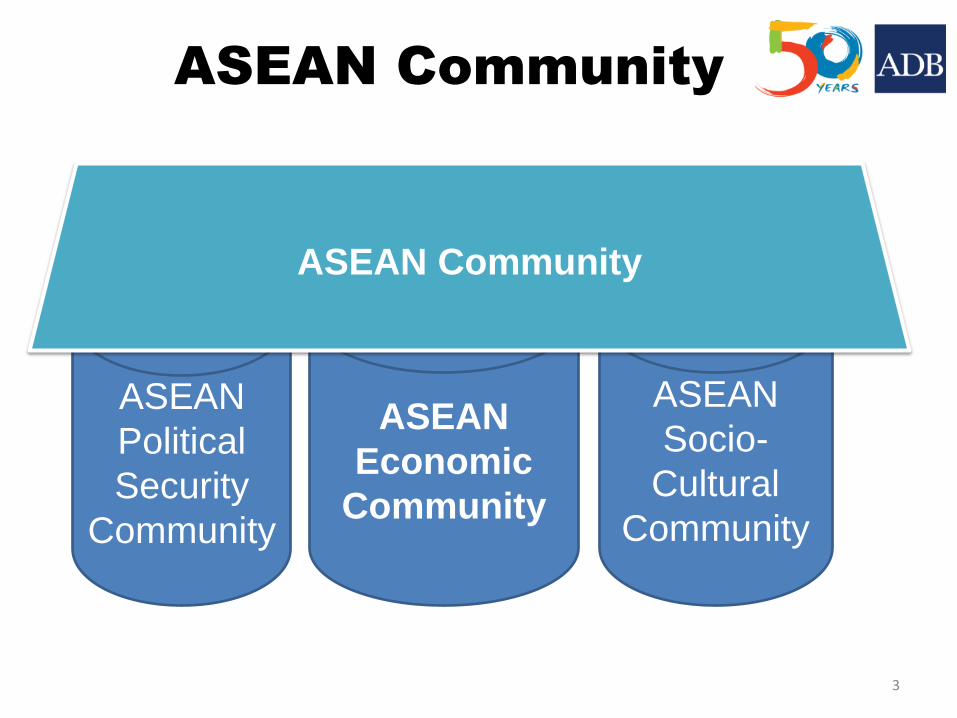
ASEAN Community
ASEAN
Political
Security
Community
ASEAN
Economic
Community
ASEAN
Socio-
Cultural
Community
ASEAN Community
3
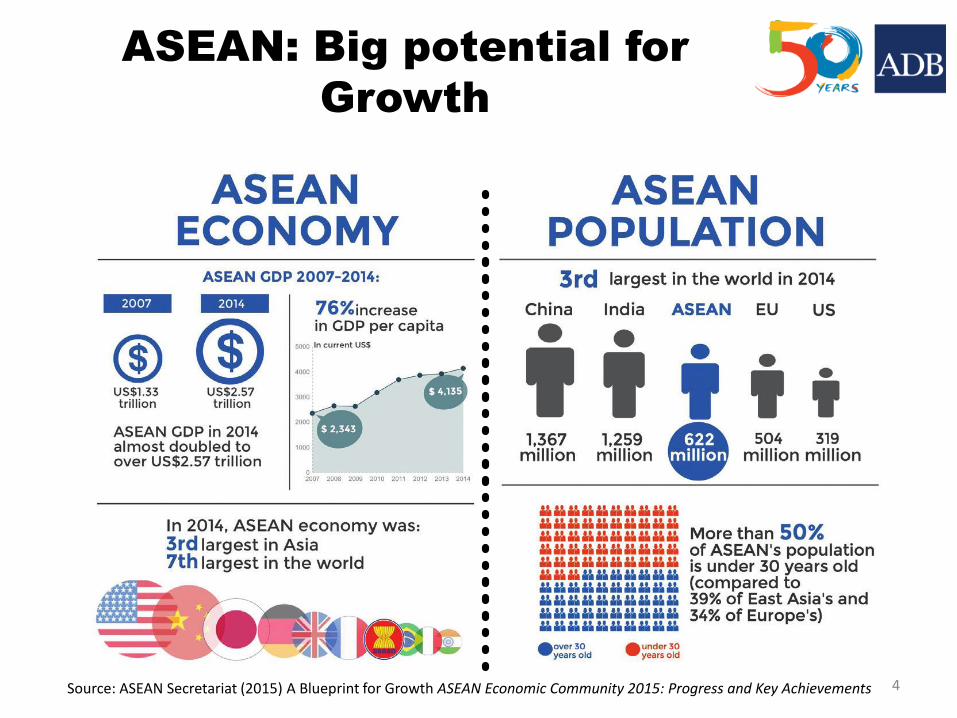
ASEAN: Big potential for
Growth
Source: ASEAN Secretariat (2015) A Blueprint for Growth ASEAN Economic Community 2015: Progress and Key Achievements 4
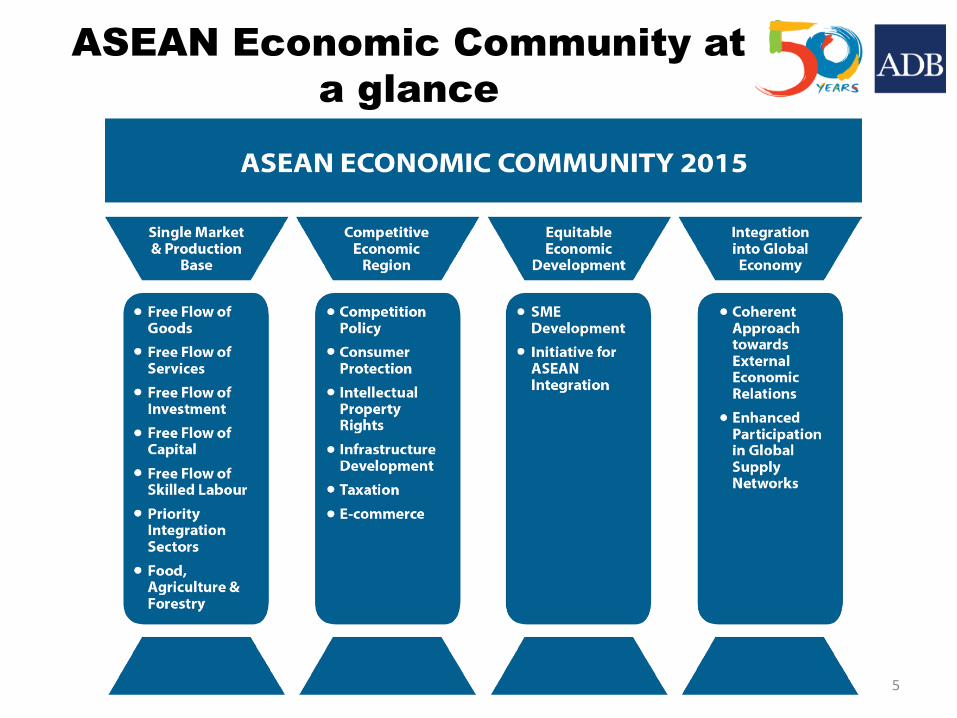
ASEAN Economic Community at
a glance
1.3 The Four Pillars of ASEAN Economic Integration
The AEC Blueprint is built on four interrelated and mutually-reinforcing pillars: (a) a
single market and production base, (b) a highly competitive economic region, (c) a
region of equitable economic development, and (d) a region fully integrated into the
global economy. As broad and multi-faceted as these are, the goals of the AEC have
already been met on many fronts.
The f rst AEC pillar seeks to create a single market and production base through
free f ow of goods, services, investment, skilled labour and freer f ow of capital.
Cumulatively, these aim for a more liberalised market that provides its population
with greater opportunities to trade and do business within the region, with reduced
trade costs and improved investment regimes that make ASEAN a more attractive
investment destination for both international and domestic investors.
The second pillar helps to create a business-friendly and innovation-supporting
regional environment. That is achievable through the adoption of common
4 |A Blueprint for Growth
ASEAN Economic Community 2015: Progress and Key Achievements
| 5 A Blueprint for Growth
ASEAN Economic Community 2015: Progress and Key Achievements
5

AEC 2015 Achievement
Source: ASEAN Secretariat (2015) A Blueprint for Growth ASEAN Economic Community 2015: Progress and Key Achievements
6
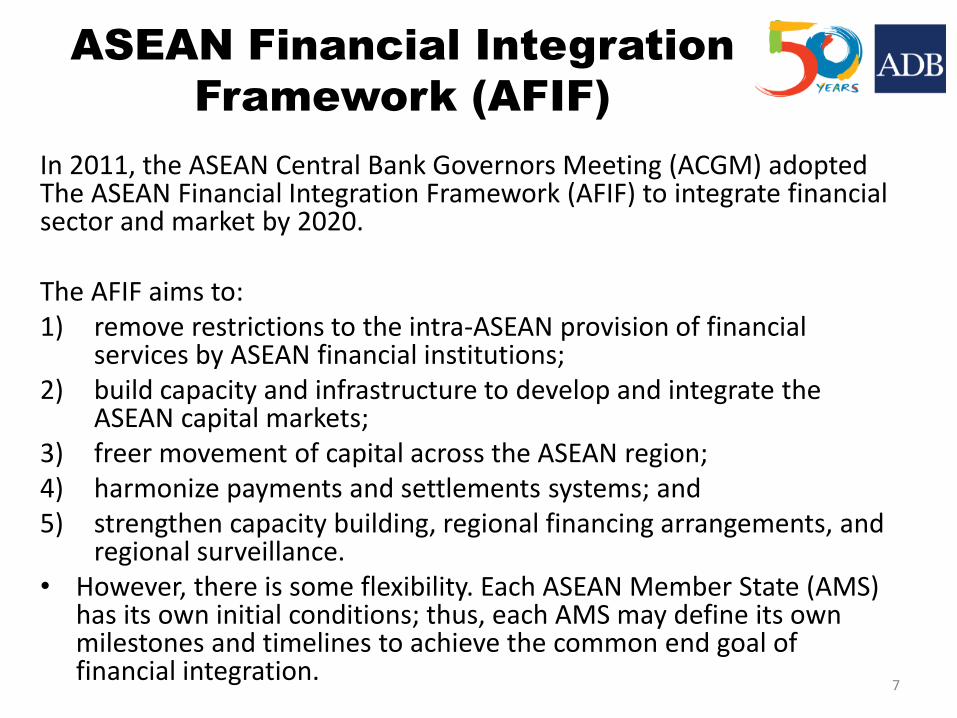
ASEAN Financial Integration
Framework (AFIF)
In 2011, the ASEAN Central Bank Governors Meeting (ACGM) adopted The ASEAN Financial Integration Framework (AFIF) to integrate financial sector and market by 2020. The AFIF aims to: 1) remove restrictions to the intra-ASEAN provision of financial
services by ASEAN financial institutions; 2) build capacity and infrastructure to develop and integrate the
ASEAN capital markets; 3) freer movement of capital across the ASEAN region; 4) harmonize payments and settlements systems; and 5) strengthen capacity building, regional financing arrangements, and
regional surveillance. • However, there is some flexibility. Each ASEAN Member State (AMS)
has its own initial conditions; thus, each AMS may define its own milestones and timelines to achieve the common end goal of financial integration.
7

Governance structure of AFIF
8

In 2014, the ACGM endorsed the ASEAN Banking Integration Framework (ABIF) as a core component of ASEAN Financial Integration Framework (AFIF), and subsequently agreed to the Guidelines for its implementation.
• ABIF allows banks meeting certain criteria to have greater access to other ASEAN markets and more flexibility in operating there.
• ABIF is expected to support ASEAN economic integration by bringing greater competition among ASEAN banks, which would lead to emergence of strong pan-ASEAN regional banks with the scale and the capability to compete against the global banks.
9
ASEAN Banking Integration
Framework (ABIF)

• The Guidelines are kept confidential but focus on the implementation of Qualified ASEAN Banks (QAB). Key points of the Guidelines are following:
a) QAB will be given national treatment in Host country in terms of market access and operational flexibility which is often not enjoyed by a foreign bank (e.g., opening of branches);
b) Financial soundness based on Basel capital accord, sizable market share in Home country and fit-and-proper of bank shareholders and management are key requirements;
c) Granting of QAB status is to be negotiated bilaterally based on a reciprocity principle.
d) In granting QAB status, Indigenous ASEAN banks with existing presence in AMSs are to be given priority.
e) ASEAN central banks aim to have concluded the first set of negotiations among ASEAN 5 by 2018 and among all AMS by 2020.
• Currently MOU or LOI is exchanged between: Malaysia and Thailand; Malaysia and Philippines; Malaysia and Indonesia; Thailand and Indonesia
10
ABIF Guidelines
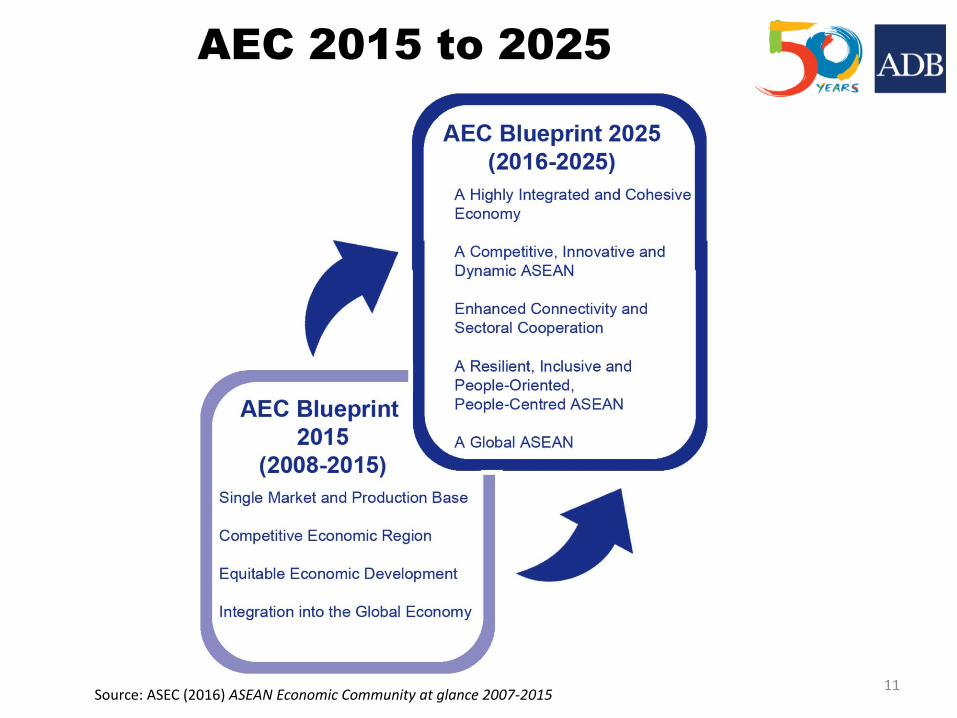
AEC 2015 to 2025
Source: ASEC (2016) ASEAN Economic Community at glance 2007-2015 11
Current state of ASEAN Economic and Financial integration
12

No intra-ASEAN tariff
Source: ASEAN Secretariat (2014) ASEAN Community in Figures – Special Edition 2014
13
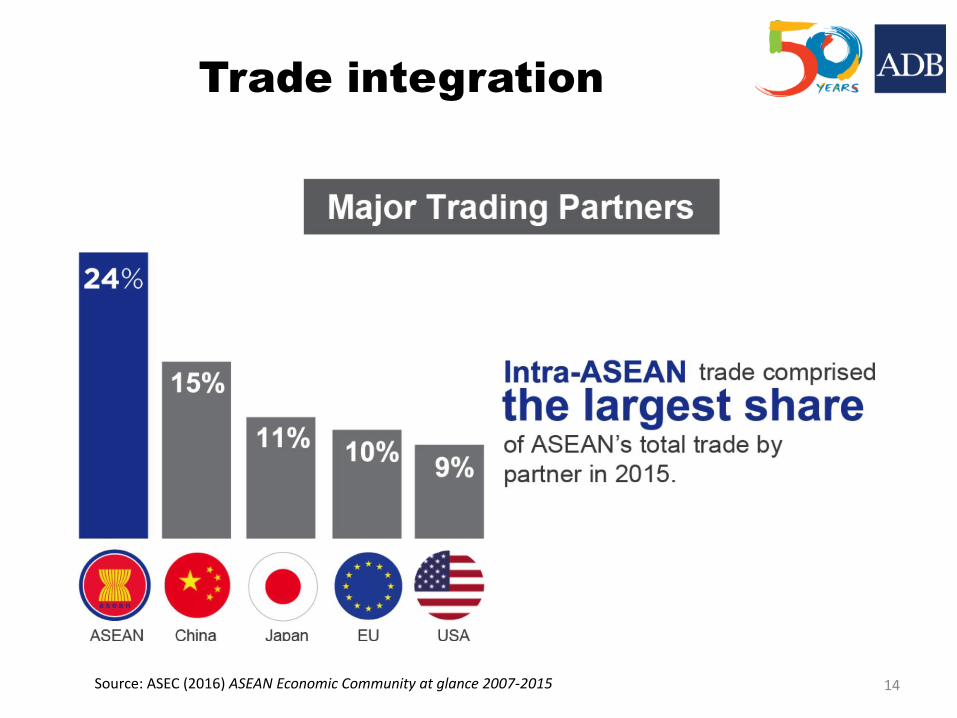
Source: ASEC (2016) ASEAN Economic Community at glance 2007-2015 14
Trade integration

Trend of ASEAN Trade with ASEAN+3,
ASEAN+6 and EAS (in US$ billion),
1993-2013
Source: ASEAN Community in Figures – Special Edition 2014
15
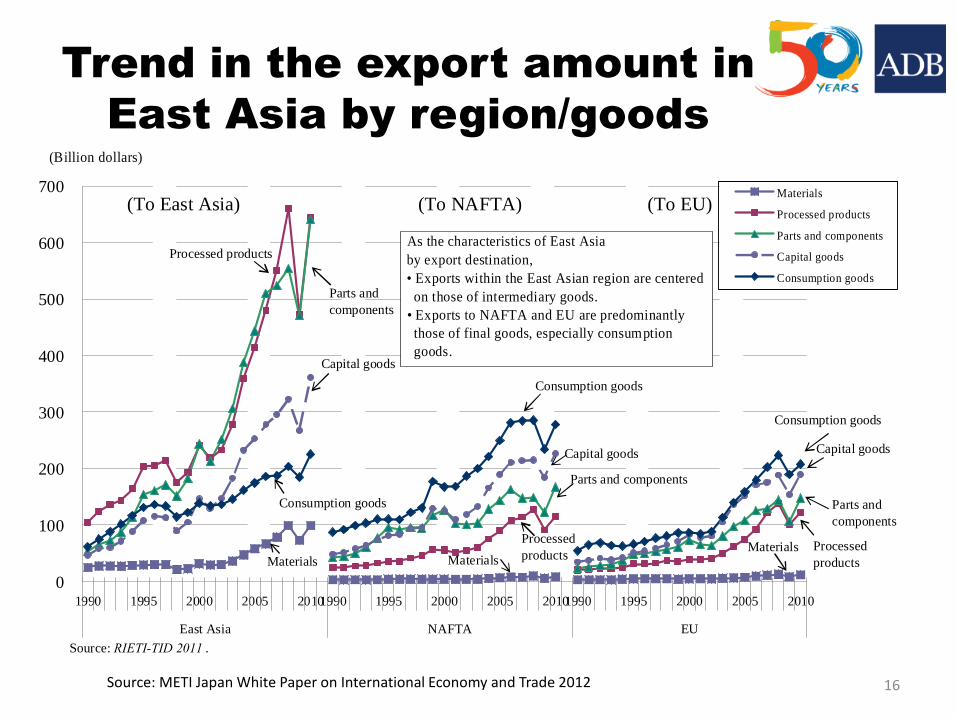
Trend in the export amount in
East Asia by region/goods
298
including Japanese manufacturers. This will be discussed in the next paragraph “2. Division of
production developed in East Asia.”
(B) Differences in inter-regional trades in East Asia, EU and NAFTA
Is this trade structure in East Asia common to other regions (such as EU and NAFTA)? Figure
2-2-1-3 compares the composition by goods in inter-regional trade among three regions. East Asia has
a much higher share of parts and components than NAFTA and EU (East Asia: 32.5%, NAFTA: 17.2%,
EU: 16.2% as of 2010) and conversely has a much lower share of consumption goods than NAFTA
and EU (East Asia: 11.4%, NAFTA: 22.6%, EU: 30.1% as of 2010). This suggest the division of
production has developed more actively in East Asia than in EU and NAFTA, and the entire region
serves as a “factory of the world.”
Figure 2-2-1-3
Composition by goods in inter-regional trade
0
10
20
30
40
50
1990 1995 2000 2005 20101990 1995 2000 2005 20101990 1995 2000 2005 2010
East Asia NAFTA EU
Materials
Processed products
Parts and components
Capital goods
Consumption goods
(%)
(Within East Asia) (Within EU)(Within NAFTA)
Source: RIETI-TID 2011 .
As the characteristics of East Asia,
• The share of trades of parts and components has rapidly increased.
• The share of consumption goods is low and has been declining.
Processed products
Materials
Capital goods
Consumption goods
Parts and components
Consumption goods
11.4
30.1
22.6
16.217.2
32.5
Parts and components
(C) Export destinations of East Asia
Then where are the final consumption goods produced exported to? Figure 2-2-1-4 shows East
Asian exports by region. As was described previously, the share of intermediary goods is high in
exports within the region. Meanwhile, the share of final goods is high, and especially that of
consumption goods is the highest in exports to NAFTA and EU. Exports of consumption goods within
the East Asian region were greater than those to NAFTA as of 2010.
Figure 2-2-1-4
Trend in the export amount in East Asia by region/goods
0
100
200
300
400
500
600
700
1990 1995 2000 2005 20101990 1995 2000 2005 20101990 1995 2000 2005 2010
East Asia NAFTA EU
Materials
Processed products
Parts and components
Capital goods
Consumption goods
(Billion dollars)
(To East Asia) (To EU)(To NAFTA)
Source: RIETI-TID 2011 .
As the characteristics of East Asia
by export destination,
• Exports within the East Asian region are centered
on those of intermediary goods.
• Exports to NAFTA and EU are predominantly
those of final goods, especially consumption
goods.
Processed products
Materials
Capital goods
Consumption goods
Parts and
components
Consumption goods
Consumption goods
Capital goodsCapital goods
Parts and
components
Parts and components
Processed
products
Processed
productsMaterials
Materials
16 Source: METI Japan White Paper on International Economy and Trade 2012

Trend in the export amount of
consumption goods in East Asia by
counterpart country
299
(D) Change of the trade structure before and after the failure of Lehman Brothers
The trade structure described above is susceptible to a demand shock from outside the region
because it has relied on the markets in Europe and the U.S. for final demands such as consumption
goods. In fact, countries highly dependent on exports in particular were greatly affected by the failure
of Lehman Brothers. This led to increasing calls for a departure from dependence on Europe and the
U.S. and growth as self-reliant economic zones based on inter-regional demand within East Asia after
the failure of Lehman Brothers.
Then did such a trade structure actually change? We look at the trend in the amount and share of
final consumption goods in East Asia by export destination as one consideration. First, before the
failure of Lehman Brothers, exports of consumption goods to Europe and the U.S. increased, while
those to East Asia temporarily decreased after the Asian currency crisis in 1997 (Figure 2-2-1-5 (a)). It
is probably because countries affected by the currency crisis in particular expanded exports to Europe
and the U.S. due to the lower exchange rate. After that, although exports to East Asia have been
recovering, their growth is slow. Looking at shares by export destination, exports to East Asia
continued to decrease (Figure 2-2-1-5 (b)). The share of exports to Japan is high among East Asian
economies. Meanwhile, exports to EU have greatly increased in amount and share since 2003 in
exports of consumption goods to Europe and the U.S.
Figure 2-2-1-5 (a)
Trend in the export amount of consumption goods in East Asia by counterpart country
0
50
100
150
200
250
300
1990 1991 1992 1993 1994 1995 1996 1997 1998 1999 2000 2001 2002 2003 2004 2005 2006 2007 2008 2009 2010
East Asia
EU27
U.S.
Japan
ASEAN
China
Hong Kong
Taiwan
South Korea
(Billion dollars)
Note: East Asia consists of Japan, China, South Korea, Hong Kong, Taiwan, Brunei, Cambodia, Indonesia, Malaysia, Philippines, Singapore,
Thailand and Vietnam.
Source: RIETI-TID 2011 .
Asian currency crisis
(1997)
Failure of Lehman Brothers
(2008)
U.S.
EU27
East Asia
ChinaASEAN
Japan
Hong Kong
Taiwan
South
Korea
Figure 2-2-1-5 (b)
Trend in the share of East Asian exports of consumption goods by counterpart country
0
10
20
30
40
50
60
1990 1991 1992 1993 1994 1995 1996 1997 1998 1999 2000 2001 2002 2003 2004 2005 2006 2007 2008 2009 2010
East Asia
EU27
U.S.
Japan
ASEAN
China
Hong Kong
Taiwan
South Korea
(%)
Note: East Asia consists of Japan, China, South Korea, Hong Kong, Taiwan, Brunei, Cambodia, Indonesia, Malaysia, Philippines, Singapore,
Thailand and Vietnam.
Source: RIETI-TID 2011 .
Asian currency crisis
(1997)
Failure of Lehman Brothers
(2008)
U.S.
EU27
East Asia
China
ASEAN
Japan
South
Korea
Taiwan
Hong
Kong
The share of East Asia has increased, while
the share of the U.S. and EU has decreased.
Source: METI Japan White Paper on International Economy and Trade 2012 17

Who is lending to Asia?
Note: Remolona, E. & Shim, I. 2015 The rise of regional banking in Asia and the Pacific, BIS Quarterly Review September 2015
18
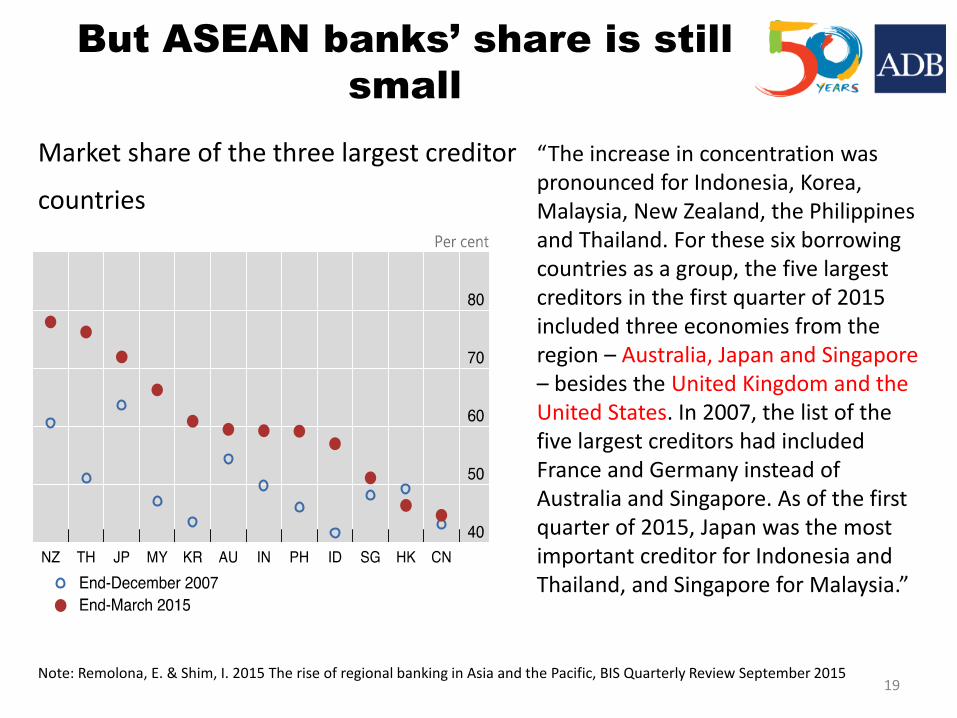
But ASEAN banks’ share is still
small
Market share of the three largest creditor
countries
“The increase in concentration was pronounced for Indonesia, Korea, Malaysia, New Zealand, the Philippines and Thailand. For these six borrowing countries as a group, the five largest creditors in the first quarter of 2015 included three economies from the region – Australia, Japan and Singapore – besides the United Kingdom and the United States. In 2007, the list of the five largest creditors had included France and Germany instead of Australia and Singapore. As of the first quarter of 2015, Japan was the most important creditor for Indonesia and Thailand, and Singapore for Malaysia.”
Note: Remolona, E. & Shim, I. 2015 The rise of regional banking in Asia and the Pacific, BIS Quarterly Review September 2015 19
Current state of ASEAN
Integration (in summary)
• Intra-ASEAN trades is still small comparing to EU. • However, Intra-regional trades within ASEAN+3 is comparable to EU.
• Intra-East Asia’s trade is large, but final destination is outside of the
region. higher. • However, East Asia, particularly China and ASEAN, are growing rapidly
and East Asia is become the biggest final destination of trade.
• Banking within ASEAN is rather limited. • However, Asia-Pacific banks are far much more dominant.
• It is better to broaden the scope of regional integration from ASEAN to
ASEAN+3 and ASEAN+6. • ASEAN can leverage its positon by pursuing open regionalism
20

What needs to be done?
21

Is EU a model for ASEAN?
• EU is – Fully integrated market, with
• the single market • under the same regulations and directives • Unified supervisory bodies
– European Banking Authority – European Securities Authority – European Insurance and Pension
• The Single Resolution Mechanism
• ASEAN needs to seek its Financial Integration model – each AMS may define its own milestones and
timelines to achieve the common end goal of financial integration.
• But how? 22
Strategies included in AEC
Blueprint 2025
- 2015ASEAN 2025: Forging Ahead Together-
• Para 17. i: “Strengthen financial integration to facilitate intra-ASEAN trade and investment by increasing the role of ASEAN indigenous banks, having more integrated insurance markets, and having more connected capital markets “
• Para 17.i.b: “Provide greater market access and operational flexibility for Qualified ASEAN Banks (QABs) through the ASEAN Banking Integration Framework (ABIF), based on each country’s readiness and on a reciprocal basis, thereby reducing gaps in market access and operational flexibility across ASEAN”
• Para 17.i.c: “Promote deeper penetration in insurance markets through the ASEAN Insurance Integration Framework (AIIF), with greater risk diversification, deeper underwriting capacity, improved and strengthened insurance sector supervision and regulatory frameworks”
• Para 17.i.d: “Further deepen and interlink capital markets by progressing towards more connectivity in clearing settlement and custody linkages to facilitate investment in the region, and allow investors and issuers to tap cross-border ASEAN capital markets efficiently, in line with the objective of ASEAN Capital Market Infrastructure (ACMI) Blueprint. “
• Para 17.i.e: “Promote the development of sovereign bond markets as well as corporate issuances that will diversify risks from the banking system and provide savers with greater opportunities to invest“ 23
Financial stability measures
explained in the AEC Blueprint
• Para 17.3.a: “Intensify the existing process of macroeconomic and financial surveillance through identifying financial system risks and vulnerabilities, and intensifying exchange of key macroeconomic information among monetary and fiscal authorities”
• Para 17.3.b: “Further enhance cross-border cooperative arrangements in relation to the implementation of the ABIF with the emergence of regionally active banks during both crisis and in the normal course of business. In the near term, existing regional and bilateral cooperation platforms for macro-surveillance and supervision will continue to perform an integral role.
– ASEAN+3 Macroeconomic Research Office (AMRO)
– EMEAP
• Furthermore, closer dialogues between authorities may be achieved through regional supervisory colleges”
• Para 17.3.c: “Make prudential regulations more cohesive, aimed at achieving greater consistency with international best practices and regulatory standards”
24
The measures for the key cross-
cutting areas under the AEC
Blueprint
• Capital account liberalization – . i. a: “Ensure an orderly capital account liberalisation”
• Payment and Settlement Systems – promoting standardisation – developing settlement infrastructure for cross-border trade, remittance,
retail payment systems and capital markets. – This will provide an enabling environment to promote regional linkages
and payment systems that are safe, efficient and competitive. – This will also require a certain level of harmonisation of standards and
market practices based on international best practices (such as ISO 20022) to foster stability and efficiency within as well as outside the region.
• Capacity building – narrow the financial development gap in the region. This can be
achieved through the conduct of learning programmes and exchanges of knowledge and experiences, and best practices in areas relevant to financial integration and development,
25

ASEAN+3 Asian Bond Markets
Initiatives (ABMI)
(Chairman's Press Release on the Asian Bond Markets Initiative, 7 August
2003)
• ABMI aims to develop efficient and liquid bond markets in
Asia, which would enable better utilization of Asian savings
for Asian investments.
• The ABMI would also
contribute to the mitigation of
currency and maturity
mismatches in financing.
- ABMI contributes to
financial stability by
creating multiple channels
of financing
26

• Harmonization and standardization
• ASEAN+3 Multi-currency Bond Issuance Framework (AMBIF)
• CSD-RTGS Linkages as regional safety-net
CGIF
$ 700 million
Asian Bonds Online
ABMF
Public Private platform
CSIF
CBs
CSDs
27
Major outputs of ABMI
CSD
Central Bank RTGS
CSD
Participant
Participant
Participant
Participant
G
W
G
W
CSD
Centr
al
Bank
RTG
S
Participant
Participant
Participant
Participant
G
W
G
W
Centr
al
Bank
RTG
S
CSD
Participant
Participant
Participant
Participant
G
W
Gateway
Participant
Participant
Research on: • Infra bond
finance • Broadening
the investor base
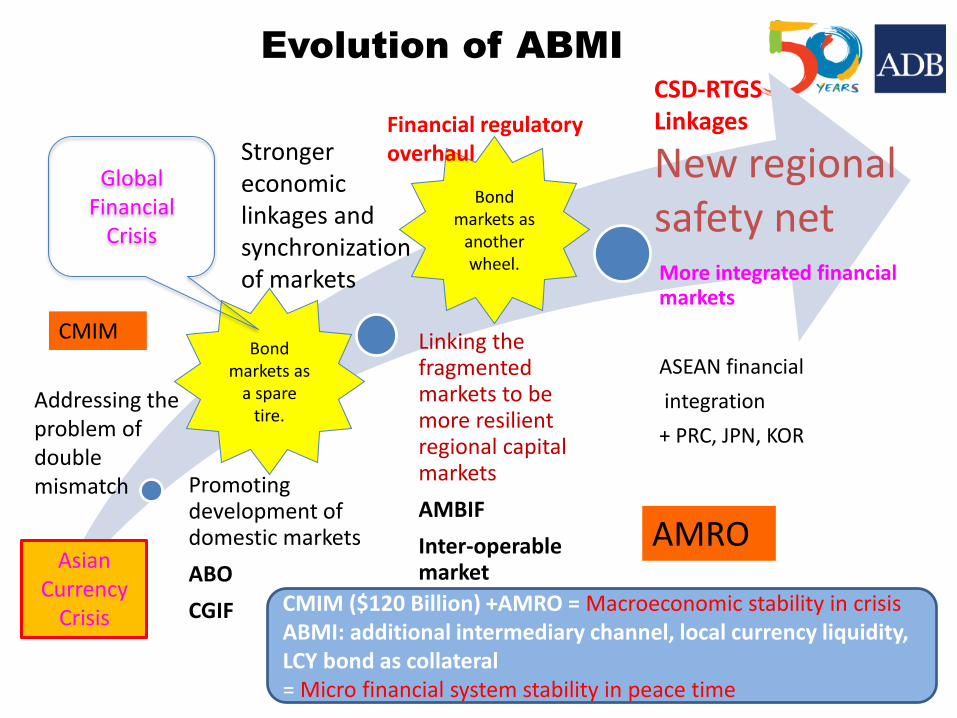
Evolution of ABMI
Promoting development of domestic markets
ABO
CGIF
Linking the fragmented markets to be more resilient regional capital markets
AMBIF
Inter-operable market infrastructures
More integrated financial markets
ASEAN financial
integration
+ PRC, JPN, KOR
28
Addressing the problem of double mismatch
CSD-RTGS Linkages
CMIM ($120 Billion) +AMRO = Macroeconomic stability in crisis ABMI: additional intermediary channel, local currency liquidity, LCY bond as collateral = Micro financial system stability in peace time
Asian Currency
Crisis
Bond markets as
a spare tire.
Global Financial
Crisis
Bond markets as
another wheel.
Stronger economic linkages and synchronization of markets
Financial regulatory overhaul New regional
safety net
CMIM
AMRO

Remaining issues for financial
stability
• Development of institutional safety-net in all ASEAN member states – Deposit Insurance – Insurance policy holders protection – Cross-border collateral and repo
• Coordination among regulators not only among ASEAN but also ASEAN+3 or +6 – Prevention of regulatory arbitrage – Information sharing through supervisory college – Cross-border resolution mechanism
29
Supervisory College
• Colleges are permanent, although flexible, coordination structures that bring together regulatory authorities involved in the supervision of a banking group. In practice, colleges are a mechanism for the exchange of information between home and host authorities, for the planning and performance of key supervisory tasks in a coordinated manner or jointly, including all aspects of ongoing supervision, and also for the preparation for and the handling of emergency situations.
• One of the fundamental tasks for supervisory authorities as members of colleges is reaching joint decisions on the risk-based capital adequacy of cross-border groups and their EEA subsidiaries.
Source: EBA website
30
Challenges
• Need for regional voice presented to the international standard setting bodies
• Regional coordination under different level of market developments – Institutional safety-nets must be developed.
• Participation in supervisory colleges of GSFIs
• Can ASEAN leverage its position in ASEAN+3(or 6) to influence international standard setting discussion? – EMEAP WG on Banking Supervision (WG/BS)
31