Ascott Residence Trust · 30/04/2010 · This presentation may contain forward-looking statements...
29
Ascott Residence Trust 1Q 2010 Financial Results 30 APRIL 2010
Transcript of Ascott Residence Trust · 30/04/2010 · This presentation may contain forward-looking statements...
Ascott Residence Trust 1Q 2010 Financial Results
30 APRIL 2010

• Results Highlights• 1Q 2010 Portfolio Performance• Update on Asset Enhancements• Portfolio Information• Capital and Risk Management• Prospects
Agenda
2
Disclaimer
3
IMPORTANT NOTICEThe value of units in Ascott Residence Trust (“Ascott Reit”) (the “Units”) and the income derived from them may fall as well as rise. The Units are not obligations of, deposits in, or guaranteed by the Manager of Ascott Reit (the “Manager”) or any of its affiliates. An investment in the Units is subject to investment risks, including the possible loss of the principal amount invested. The past performance of Ascott Reit is not necessarily indicative of its future performance.
This presentation may contain forward-looking statements that involve risks and uncertainties. Actualfuture performance, outcomes and results may differ materially from those expressed in forward-looking statements as a result of a number of risks, uncertainties and assumptions. Representative examples of these factors include (without limitation) general industry and economic conditions, interest rate trends, cost of capital and capital availability, competition from similar developments, shifts in expected levels of property rental income, changes in operating expenses, including employee wages, benefits and training, property expenses and governmental and public policy changes and the continued availability of financing in the amounts and the terms necessary to support future business. Prospective investors and Unitholders are cautioned not to place undue reliance on these forward-looking statements, which are based on the current view of the Manager on future events.
Unitholders of Ascott Reit (the “Unitholders”) have no right to request the Manager to redeem their units in Ascott Reit while the units in Ascott Reit are listed. It is intended that Unitholders may only deal in their Units through trading on the Singapore Exchange Securities Trading Limited (“SGX-ST”). Listing of the Units on the SGX-ST does not guarantee a liquid market for the Units.

Results Highlights
4

5
1Q 2010 vs 1Q 2009 Performance
Change
+3%
+1%
-5%
-
1Q 2010
43.5
20.1
10.3(1)
120
1Q 2009
42.1
19.9
10.8
120
Unitholders’ Distribution (S$m)
Distribution Per Unit (S cents)
Revenue Per Available Unit (S$/day) – serviced residences
Gross Profit (S$m)
Revenue (S$m)
1.66 1.77 -6%
(1) Unitholders’ distribution for 1Q 2010 is lower than that for 1Q 2009 due to one-off expenses. The one-off expenses are (1) additional property tax expense in 1Q 2010 of S$0.2m incurred for FY 2009 arising from a reassessment of property annual value by the Inland Revenue Authority of Singapore for one of the serviced residences in Singapore and (2) in 1Q 2009, there was a reversal of 2008 over provision of tax of S$0.5m upon finalisation by the tax authority. Excluding the one-off expenses, the unitholders’ distribution for 1Q 2010 is S$0.2m or 2% higher than 1Q 2009.
1Q 2010 Portfolio Performance
6

0.3 0.4
1.71.9
0
1
2
Revenue Gross Profit
1Q 2009 1Q 2010
S$m
Somerset St George’s
Terrace, Perth
Somerset Gordon Heights,
Melbourne
154126
RevPAUS$
Australia
7
Improved performance due to appreciation of AUD against SGDIn AUD terms, RevPAU was 5% lower due to weaker demand in Perth
+12%
+33%
+22%

China
2.4 2.8
8.2 8.4
0
5
10
Revenue Gross Profit
1Q 2009 1Q 2010
Ascott Beijing Somerset Grand Fortune
Garden Property, Beijing
Somerset Olympic Tower
Property, Tianjin
Somerset Xu Hui,
ShanghaiS$m
RevPAUS$
113 114
8
Improved performance due to increased business activities in Beijing and ShanghaiTianjin’s performance has declined due to increased competition and reduction in
corporate accommodation budget
+2%
+17%
+1%

Indonesia
Ascott Jakarta Somerset Grand Citra,
Jakarta
Country Woods, Jakarta
5.0
2.0
4.9
1.7
0.0
5.0
10.0
Revenue Gross Profit
1Q 2009 1Q 2010
6774
9
-9%S$m
RevPAUS$
Lower performance due to rectification works at Somerset Grand Citra
-2%
-15%

Japan
4.5
2.6
4.1
2.4
0
1
2
3
4
5
Revenue* Gross Profit*
1Q 2009 1Q 2010
*Revenue and Gross Profit includes contribution from serviced residence and rental housing properties.#RevPAU for serviced residence properties.
RevPAU#
S$
133143
10
Somerset Roppongi,
Tokyo
Somerset AzabuEast, Tokyo
18 rental housing properties in
TokyoS$m
2.0 1.9
0.7 0.6
Serviced residence contribution
Lower performance due to lower rental rates of serviced residences in view of weak market demand
Rental housing properties continued to achieve stable rental rates at lower occupancy of above 85%
-9%
-8%
-7%
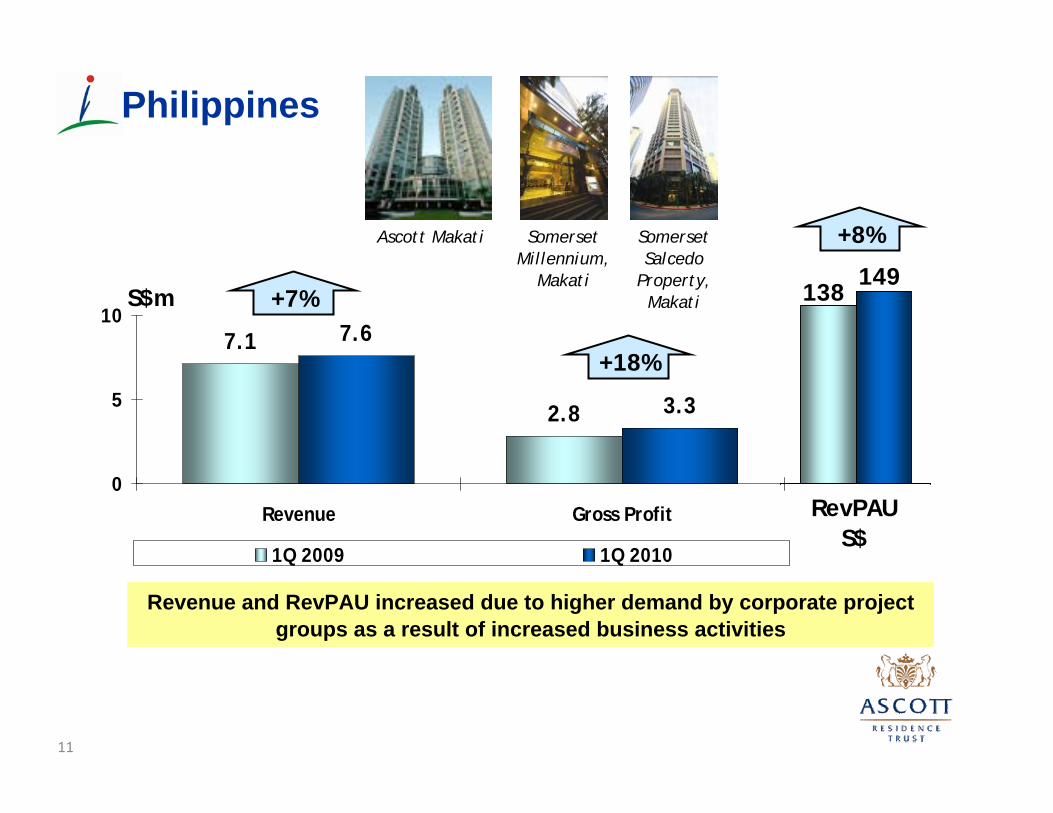
Philippines
Somerset Millennium,
Makati
Somerset Salcedo
Property, Makati
Ascott Makati
7.1
2.8
7.6
3.3
0
5
10
Revenue Gross Profit
1Q 2009 1Q 2010
Revenue and RevPAU increased due to higher demand by corporate project groups as a result of increased business activities
RevPAUS$
149138
11
+7%
+18%
+8%
S$m

Revenue and RevPAU increased as a result of improved business conditionsImprovement not fully captured due to phased renovation of the properties
Lower gross profit due to additional property tax expense in 1Q 2010 incurred for FY 2009 arising from a reassessment of property annual value
Singapore
Somerset Grand
Cairnhill, Singapore
Somerset LiangCourt Property,
Singapore
6.7
3.7
7.3
3.6
0
5
10
Revenue Gross Profit
1Q 2009 1Q 2010
180169
-3%
RevPAUS$
12
S$m +9%
+7%

Higher revenue due to contribution from Somerset West Lake1
Gross profit lower due to increase in utility ratesLower RevPAU due to weaker demand and increase in supply in the market
6.1
8.9
5.9
9.3
0
5
10
Revenue Gross Profit
1Q 2009 1Q 2010
Vietnam
SomersetGrand Hanoi
Somerset Chancellor
Court, Ho Chi Minh City
Somerset Ho Chi Minh City
S$m
115137
RevPAUS$
-16%
13
+4%
Somerset WestLake, Hanoi
8.3
5.3
119
Same Store
1 Somerset West Lake was acquired on 01 April 2009.
-3%

Update on Asset Enhancements
14

On-going AEIs
15
PropertySomerset Grand Cairnhill,
SingaporeSomerset Liang Court,
Singapore
Asset Enhancements Planned
144 apartment units to be renovated in phases
185 apartment units to be renovated in phases
Progress-to-date
Phase 1 - 36 units completed in 1Q 2010
Phase 2 – 60 units to be completed in 2Q 2010
Phase 1 - 48 units completed in 4Q 2009 Phase 2 – 44 units completed
in 1Q 2010 Phase 3 – 93 units to be
completed in 2Q 2010
Renovation Cost S$5.5 million S$10.9 million
Payback Period 4 to 5 years 4 to 5 years

AEIs to Commence in 2Q 2010
16
PropertySomerset Grand Hanoi,
Vietnam
Asset Enhancements Planned
185 apartment units to be renovated in phases
CommencementDate May 2010
Expected Completion 4Q 2011
Renovation Cost US$5.8 million
Payback Period 5 years
Portfolio Information
17

< 1 month32%
1 to 6 months
20%
> 12 months
32%
6 to 12 months
16%
Project10%
Business Trip52%
Family/ Leisure
4%
Relocation34%
Apartment Rental Income By Market Segment1
1 For YTD 31 March 20102 Apartment rental income by length of stay
Apartment Rental Income By Length of Stay1
Length of Stay and Market Segment
18
Average length of stay is 6.5 months2

Others9%
Healthcare3%Real estate/
Lodging4%
Energy &Utilities
9%
IT10%
Financial Institutions
11%
Industrial18%
Govt & NGOs14%
Consumers11%
Media & Telecomms
5%
Manufacturing6%
1 Apartment rental income from corporate accounts for YTD 31 March 2010
Apartment Rental Income By Industry1
Diverse Tenant Mix
19
Earnings diversified, not reliant on any single industry

Note: Emerging markets include China, Indonesia, the Philippines and Vietnam. Stable economies include Australia, Japan and Singapore.
Ascott Reit’s Share of Asset ValuesAs at 31 March 2010
Geographical Diversification
20
Total = S$1.57 billion
Indonesia5%
Japan19%
Singapore28%
China24%
Vietnam12%
Philippines9%
Australia3%
Ascott Reit’s Share of Gross ProfitYTD 31 March 2010
Japan S$2.4m
Australia S$0.5m
PhilippinesS$3.3m
Vietnam S$4.2m
Indonesia S$1.4m
China S$2.8m
Singapore S$3.6m
Total = S$18.2 million

Capital & Risk Management
21

• Gearing of 42.1%, well within the 60% gearing limit allowable under MAS property fund guidelines
Healthy Balance Sheet
22
Ascott Reit’sproportionate share
of asset values
S$1,555.7m
Ascott Reit Gearing ProfileAs at 31 March 2010
Ascott Reit Gearing ProfileAs at 31 March 2010
DebtS$654.6m (42.1%)
EquityS$901.1m (57.9%)

Debt Profile
23
Maturity ProfileAs at 31 March 2010
Ascott Reit’s Share of Bank Loans = S$654.6 m
*2010S$66.7 m (10%)
2012S$166.8 m (26%)
2013S$22.1 m (3%)
Currency ProfileAs at 31 March 2010
Singapore DollarS$214.7 m (33%)
Japanese YenS$283.0 m (43%)
US DollarS$152.7 m (23%)
Australian DollarS$4.2 m (1%)
* As at end April 2010, only S$9.2 million of debt is due for refinancing in FY2010.
2011S$399.0 m (61%)

Interest Rate ProfileAs at 31 March 2010
Interest Rate Profile
24
Interest Cover Ratio of 3.6x
FloatingS$179.8m (27%)
FixedS$474.8 m (73%)
Effective Borrowing Rate of 3.3%

Foreign Exchange Movements
Foreign Exchange Profile
25
Currency
Percentage of Ascott Reit’s
Share of Gross Profit
YTD 31 Mar 2010
Foreign exchange rate movements from
Dec’09 to Mar’10
SGD 20 -USD 31 1.4%PHP 18 3.1%RMB 15 1.4%JPY 13 -2.8%AUD 3 -0.1%Total 100 0.8%
Ascott Reit’s Share of Gross ProfitYTD 31 March 2010
Total = S$18.2 million
Japan, S$2.4m
Australia, S$0.5m
Philippines, S$3.3m
Vietnam, S$4.2m
Indonesia, S$1.4m
China, S$2.8m
Singapore, S$3.6m

Prospects
26

We have seen differing pace of economic recovery in the markets where we operate. Our geographical diversification places us across different stages of economic cycles. This will continue to provide income stability for the Group.
In Singapore, China and Philippines, hospitality demand is expected to continue to improve in line with the more positive economic conditions. In Australia, Indonesia, Japan and Vietnam, we expect to see stability in performance for the remaining quarters, driven mainly by occupancy. We have accelerated asset enhancement initiatives to enhance the long term returns of the selected properties in Singapore, China and Vietnam.
We will also continue to look for opportunities to divest properties which have reached optimal yield and invest in yield-accretive acquisitions in existing and new markets to expand the portfolio.
The Group remains confident of the longer term growth in the markets in which it operates and the operating performance in 2010 is expected to remain profitable.
Prospects

Jakarta
World’s First and Only Pan-Asian Serviced Residence REIT
Beijing Tianjin
S$1.57 billion portfolio value3,644 apartment units in 38 properties
11 Pan-Asian cities in 7 countries
Tokyo
ManilaHanoi
Singapore
MelbournePerth
Ho Chi Minh City
Shanghai
28
Vietnam4 properties with 612 units in Hanoi and
Ho Chi Minh City
Singapore2 properties with 343 units
The Philippines3 properties with 515 units in Manila
Japan20 properties with 652 units in Tokyo
Indonesia3 properties with 652 units in Jakarta
China4 properties with 743 units in Beijing,
Shanghai and Tianjin
Australia2 properties with 127 units in
Melbourne and Perth
As at 31 March 2010

Thank You
29