Ascott Residence Trustinvestor.ascottreit.com/newsroom/20120425_175842_A68U_C0C49720B... · The...
37
Ascott Residence Trust 1Q 2012 Financial Results 25 April 2012
Transcript of Ascott Residence Trustinvestor.ascottreit.com/newsroom/20120425_175842_A68U_C0C49720B... · The...

Ascott Residence Trust 1Q 2012 Financial Results
25 April 2012

• 1Q 2012 Results Highlights • Portfolio Performance • Portfolio Information • Capital and Risk Management • Prospects
Agenda
2
Disclaimer
3
IMPORTANT NOTICE
The value of units in Ascott Residence Trust (“Ascott Reit”) (the “Units”) and the income derived from them may fall as well as rise. The Units are not obligations of, deposits in, or guaranteed by Ascott Residence Trust Management Limited, the Manager of Ascott Reit (the “Manager”) or any of its affiliates. An investment in the Units is subject to investment risks, including the possible loss of the principal amount invested. The past performance of Ascott Reit is not necessarily indicative of its future performance.
This presentation may contain forward-looking statements that involve risks and uncertainties. Actual
future performance, outcomes and results may differ materially from those expressed in forward-looking statements as a result of a number of risks, uncertainties and assumptions. Representative examples of these factors include (without limitation) general industry and economic conditions, interest rate trends, cost of capital and capital availability, competition from similar developments, shifts in expected levels of property rental income, changes in operating expenses, including employee wages, benefits and training, property expenses and governmental and public policy changes and the continued availability of financing in the amounts and the terms necessary to support future business. Prospective investors and Unitholders are cautioned not to place undue reliance on these forward-looking statements, which are based on the current view of the Manager on future events.
Unitholders of Ascott Reit (the “Unitholders”) have no right to request the Manager to redeem their units in Ascott Reit while the units in Ascott Reit are listed. It is intended that Unitholders may only deal in their Units through trading on the Singapore Exchange Securities Trading Limited (“SGX-ST”). Listing of the Units on the SGX-ST does not guarantee a liquid market for the Units.
1Q 2012 Results Highlights
4
5
1Q 2012 vs 1Q 2011 Performance 1Q 2011
67.3
36.4 Gross Profit (S$m)
Revenue (S$m)
1Q 2012
71.6
37.2
Unitholders’ Distribution (S$m)
Distribution Per Unit (S cents)
24.0
2.14
24.2
2.14
Revenue Per Available Unit (S$/day) – serviced residences
137 133
Change
6%
2%
1%
-
3%
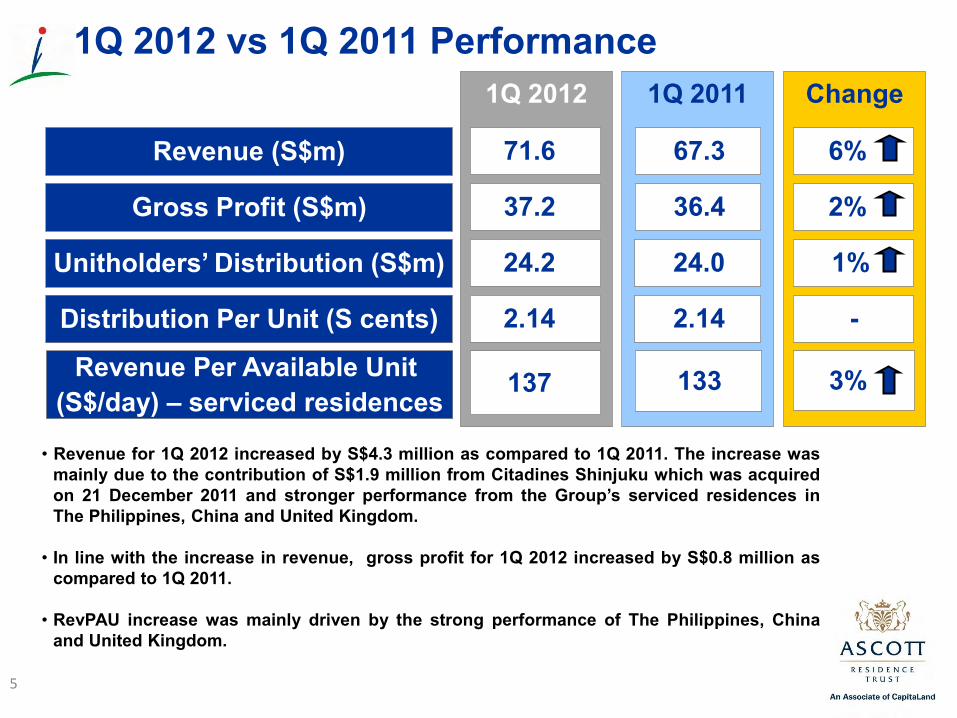
• Revenue for 1Q 2012 increased by S$4.3 million as compared to 1Q 2011. The increase was
mainly due to the contribution of S$1.9 million from Citadines Shinjuku which was acquired on 21 December 2011 and stronger performance from the Group’s serviced residences in The Philippines, China and United Kingdom.
• In line with the increase in revenue, gross profit for 1Q 2012 increased by S$0.8 million as
compared to 1Q 2011. • RevPAU increase was mainly driven by the strong performance of The Philippines, China
and United Kingdom.

1Q 2012 Portfolio Performance
6
Master Leases
7

Overview of Master Leases
8
• 20 out of Ascott Reit’s 66 serviced residences are on master leases
• These serviced residences contributed 26% of the Group’s
gross profit for 1Q 2012
• These master leases have an average weighted remaining tenure of about 7 years
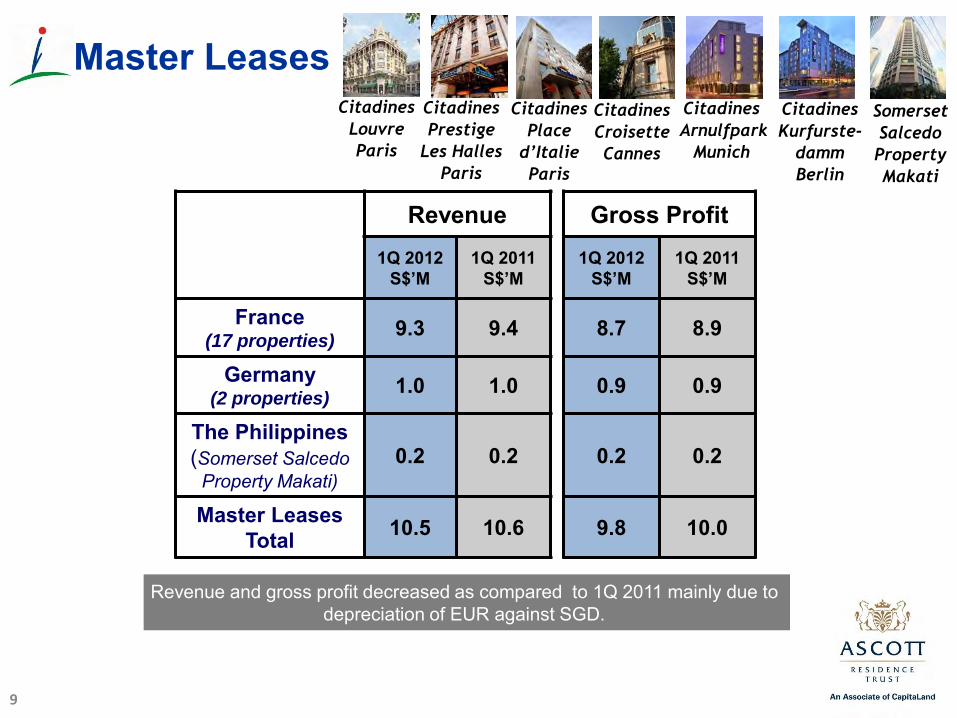
Master Leases
9
Revenue Gross Profit 1Q 2012
S$’M 1Q 2011
S$’M 1Q 2012
S$’M 1Q 2011
S$’M
France (17 properties)
9.3 9.4 8.7 8.9
Germany (2 properties)
1.0 1.0 0.9 0.9
The Philippines (Somerset Salcedo
Property Makati) 0.2 0.2 0.2 0.2
Master Leases Total 10.5 10.6 9.8 10.0
Citadines
Louvre
Paris
Citadines
Prestige
Les Halles
Paris
Citadines
Place
d’Italie
Paris
Citadines
Croisette
Cannes
Citadines
Arnulfpark
Munich
Citadines
Kurfurste-
damm
Berlin
Somerset
Salcedo
Property
Makati
Revenue and gross profit decreased as compared to 1Q 2011 mainly due to depreciation of EUR against SGD.
Management Contracts with Minimum Guaranteed Income
10

Overview of Management Contracts with Minimum Guaranteed Income
11
• 8 out of Ascott Reit’s 66 serviced residences are on management contracts that provide minimum guaranteed income
• These serviced residences contributed 14% of the Group’s gross profit for 1Q 2012
• These management contracts have an average weighted remaining tenure of more than 6 years
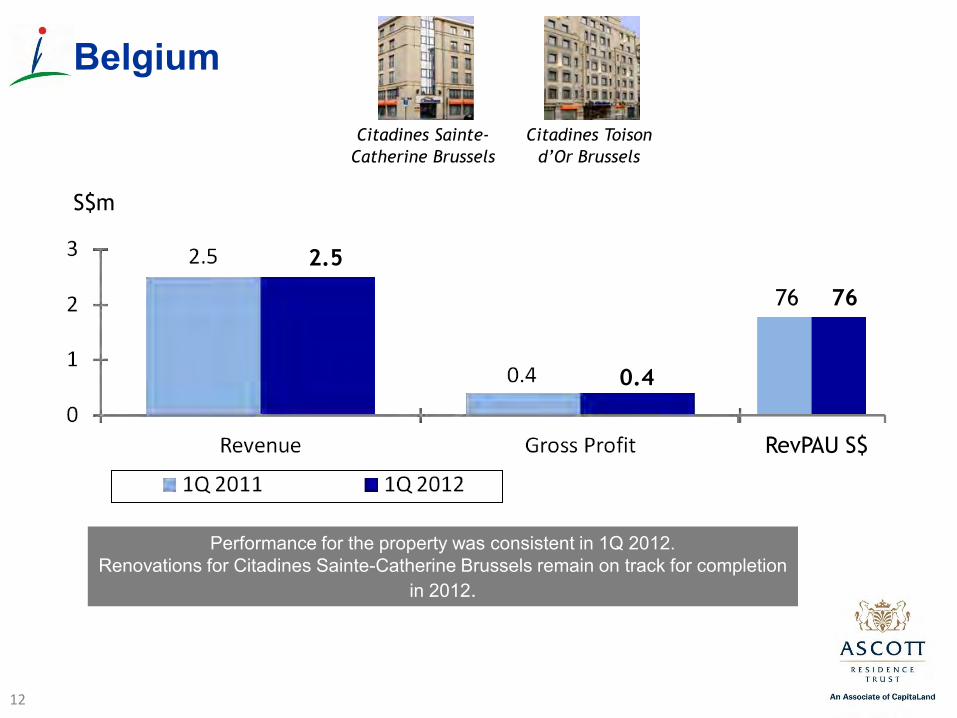
Performance for the property was consistent in 1Q 2012. Renovations for Citadines Sainte-Catherine Brussels remain on track for completion
in 2012.
Belgium
S$m
76 76
12
RevPAU S$
2.5
0.4
Citadines Sainte-
Catherine Brussels
Citadines Toison
d’Or Brussels
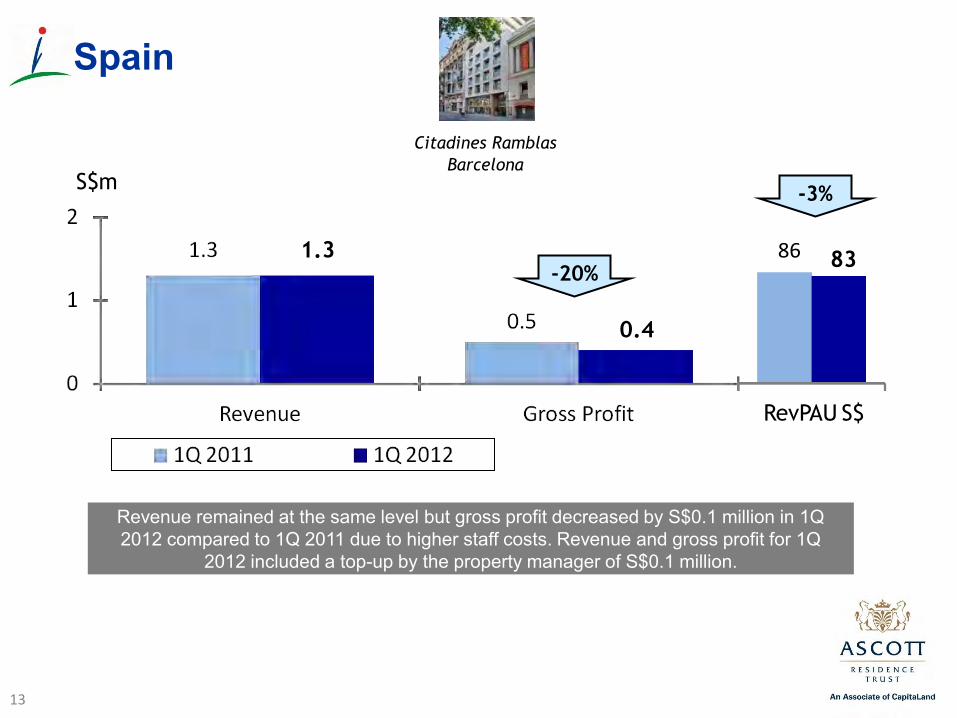
Revenue remained at the same level but gross profit decreased by S$0.1 million in 1Q 2012 compared to 1Q 2011 due to higher staff costs. Revenue and gross profit for 1Q
2012 included a top-up by the property manager of S$0.1 million.
Spain
S$m
86 83
13
RevPAU S$
1.3
0.4
-3%
Citadines Ramblas
Barcelona
-20%
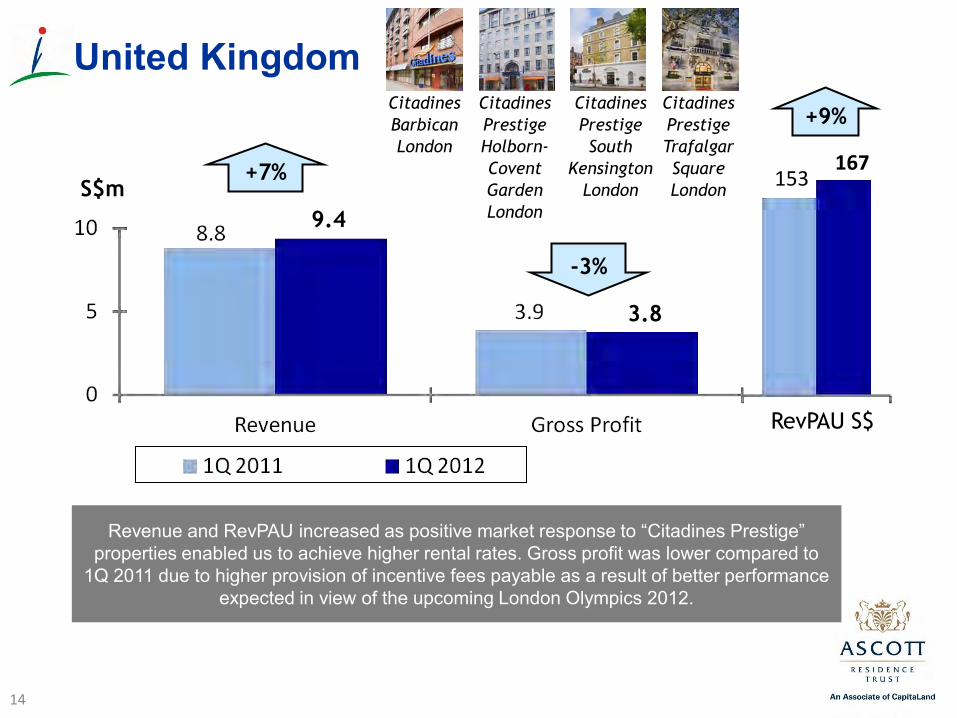
Revenue and RevPAU increased as positive market response to “Citadines Prestige” properties enabled us to achieve higher rental rates. Gross profit was lower compared to
1Q 2011 due to higher provision of incentive fees payable as a result of better performance expected in view of the upcoming London Olympics 2012.
United Kingdom
S$m 153 167
14
RevPAU S$
9.4
3.8
-3%
+9%
+7%
Citadines
Barbican
London
Citadines
Prestige
Holborn-
Covent
Garden
London
Citadines
Prestige
South
Kensington
London
Citadines
Prestige
Trafalgar
Square
London
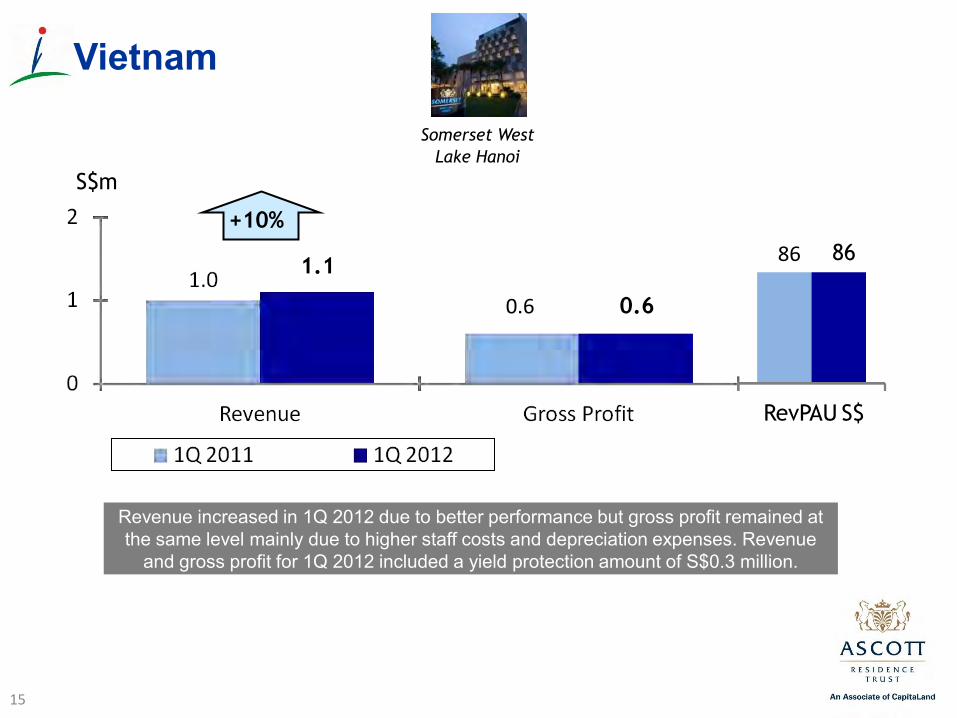
Revenue increased in 1Q 2012 due to better performance but gross profit remained at the same level mainly due to higher staff costs and depreciation expenses. Revenue
and gross profit for 1Q 2012 included a yield protection amount of S$0.3 million.
Vietnam
S$m
86
15
RevPAU S$
1.1
0.6
Somerset West
Lake Hanoi
0.6
86
+10%

Management Contracts
16
Overview of Management Contracts
17
• 38 out of Ascott Reit’s 66 serviced residences are on management contracts
• These serviced residences contributed 60% of the Group’s gross profit for 1Q 2012
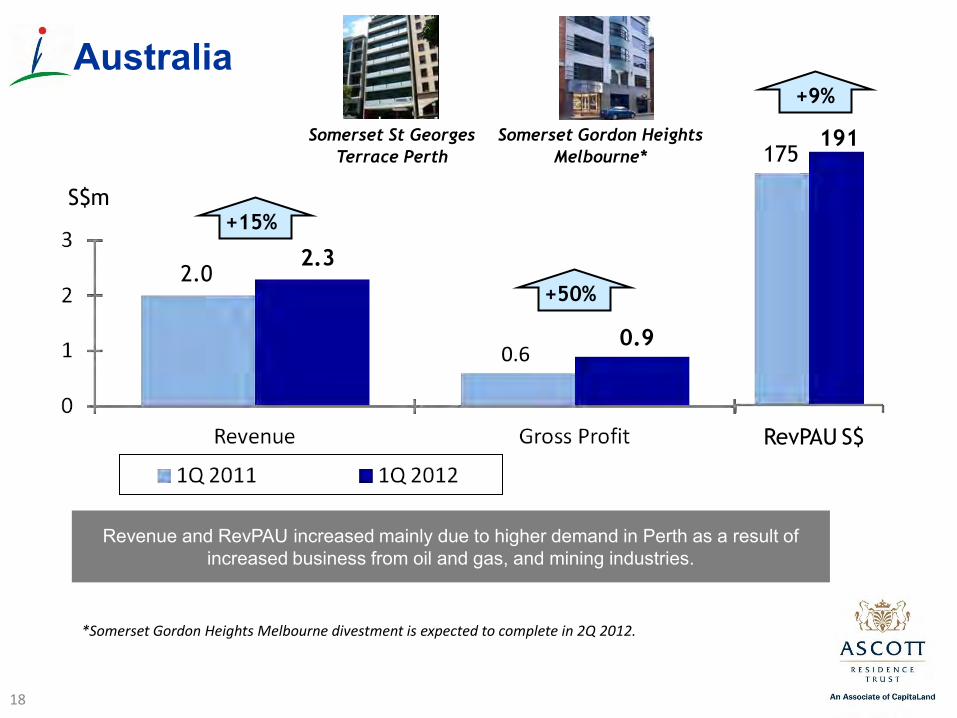
Revenue and RevPAU increased mainly due to higher demand in Perth as a result of increased business from oil and gas, and mining industries.
Australia
S$m
175 191
18
RevPAU S$
+9%
+50%
+15%
0.6 0.9
2.0 2.3
Somerset St Georges
Terrace Perth
Somerset Gordon Heights
Melbourne*
*Somerset Gordon Heights Melbourne divestment is expected to complete in 2Q 2012.
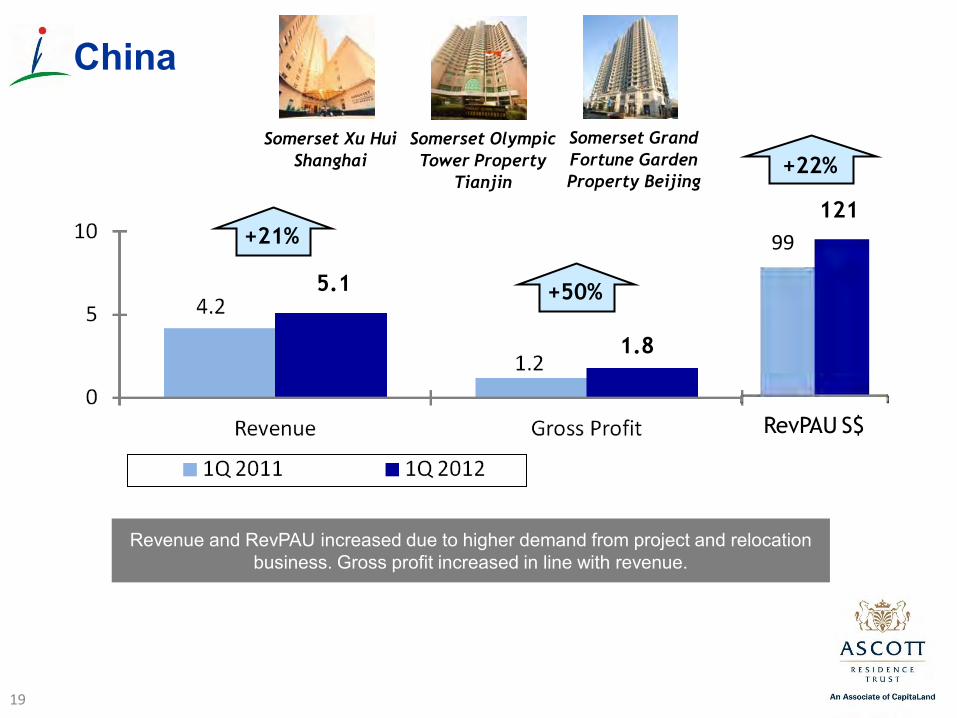
19
China
Somerset Grand
Fortune Garden
Property Beijing
Somerset Olympic
Tower Property
Tianjin
Somerset Xu Hui
Shanghai
Revenue and RevPAU increased due to higher demand from project and relocation business. Gross profit increased in line with revenue.
99
121
1.8
5.1
+21%
+50%
+22%
RevPAU S$

Revenue was at the same level but gross profit increased by S$0.1 million due to one-off reversal of accrued expenses in 1Q 2012.
Indonesia
S$m
97
100
20
RevPAU S$
Ascott
Jakarta
Somerset
Grand Citra
Jakarta
3.8
1.3
+8%
+3%
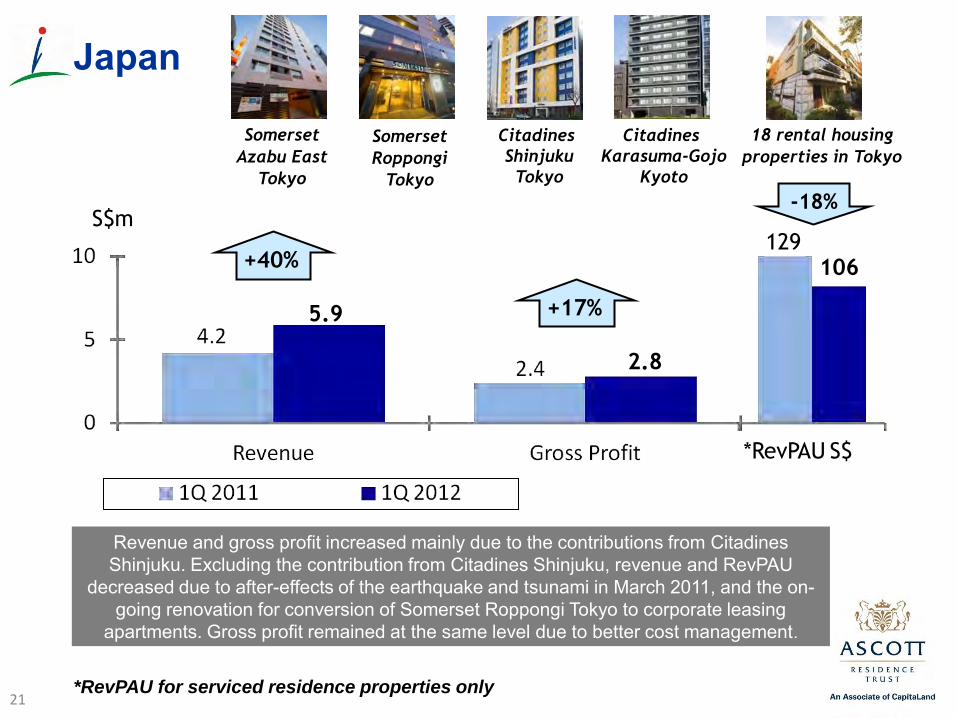
Revenue and gross profit increased mainly due to the contributions from Citadines Shinjuku. Excluding the contribution from Citadines Shinjuku, revenue and RevPAU
decreased due to after-effects of the earthquake and tsunami in March 2011, and the on-going renovation for conversion of Somerset Roppongi Tokyo to corporate leasing
apartments. Gross profit remained at the same level due to better cost management.
Japan
S$m 129
106
21
*RevPAU S$
18 rental housing
properties in Tokyo
Somerset
Roppongi
Tokyo
Citadines
Shinjuku
Tokyo
Citadines
Karasuma-Gojo
Kyoto
2.8
5.9
-18%
+17%
+40%
*RevPAU for serviced residence properties only
Somerset
Azabu East
Tokyo

Revenue and RevPAU increased mainly due to higher demand from business process outsourcing, oil and gas and aircraft engineering industries. Gross profit increased in line
with revenue.
The Philippines
S$m 151
174
22
RevPAU S$
3.2
7.9
+15%
+14%
+16%
Somerset
Millennium
Makati
Ascott Makati
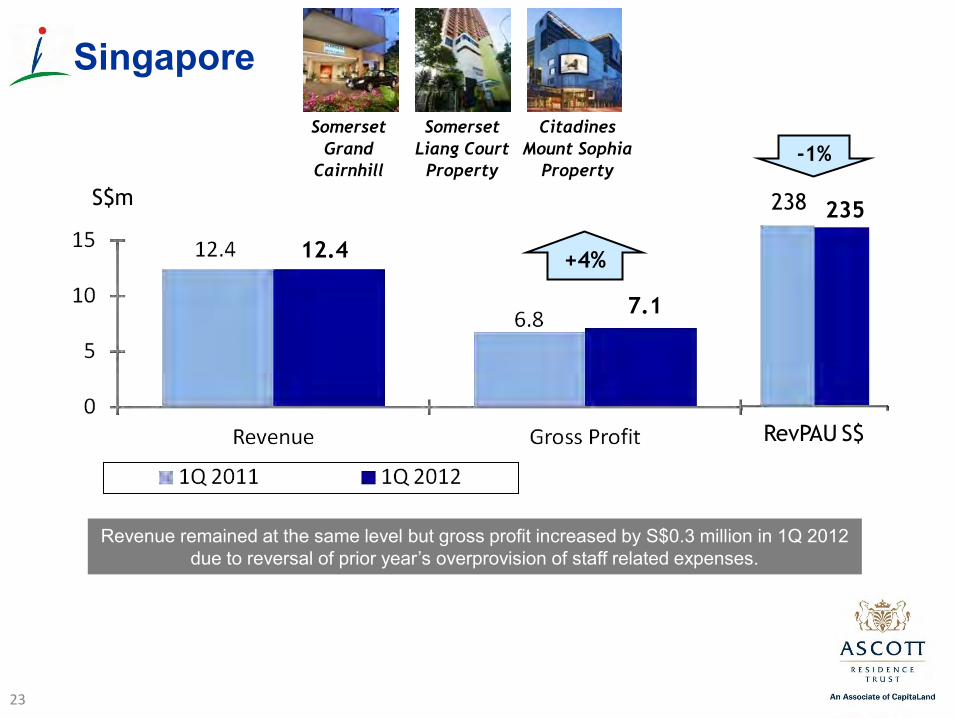
Revenue remained at the same level but gross profit increased by S$0.3 million in 1Q 2012 due to reversal of prior year’s overprovision of staff related expenses.
Singapore
S$m 238 235
23
RevPAU S$
Somerset
Grand
Cairnhill
Somerset
Liang Court
Property
Citadines
Mount Sophia
Property
7.1
12.4
-1%
+4%
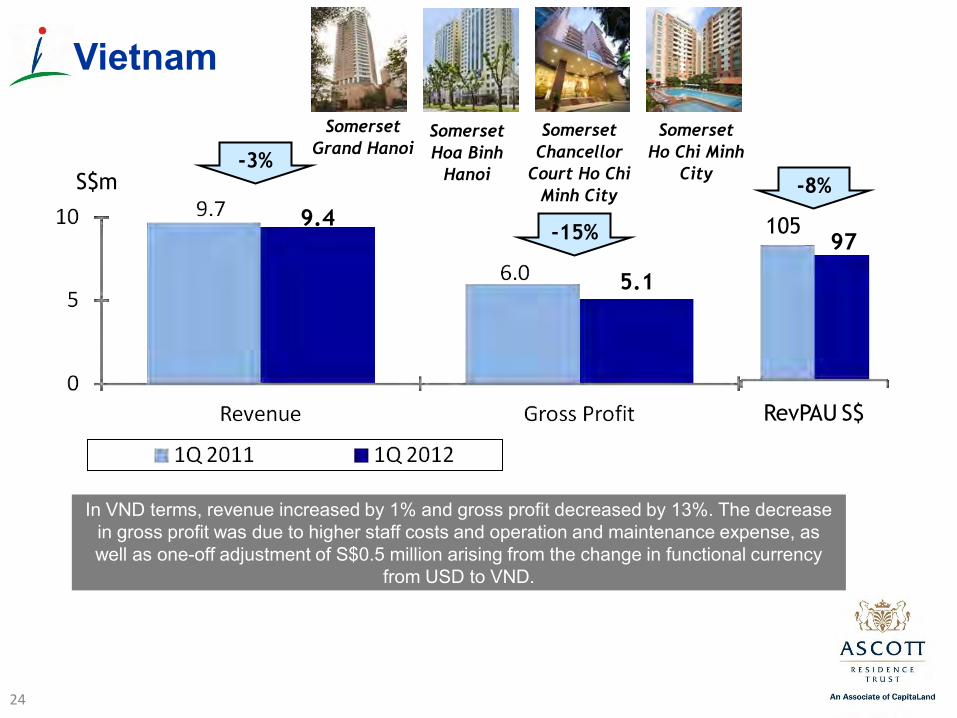
In VND terms, revenue increased by 1% and gross profit decreased by 13%. The decrease in gross profit was due to higher staff costs and operation and maintenance expense, as well as one-off adjustment of S$0.5 million arising from the change in functional currency
from USD to VND.
Vietnam
S$m
105 97
24
RevPAU S$
9.4
5.1
-8%
Somerset
Grand Hanoi Somerset
Chancellor
Court Ho Chi
Minh City
Somerset
Ho Chi Minh
City
Somerset
Hoa Binh
Hanoi
-15%
-3%
3. Portfolio Information
25

1Q 2012 Gross Profit
26
Both master leases and serviced residence management contracts with minimum guaranteed income have average weighted remaining
tenures of more than 6 years
Balance of Income Stability and Growth
Total = S$37.2 million
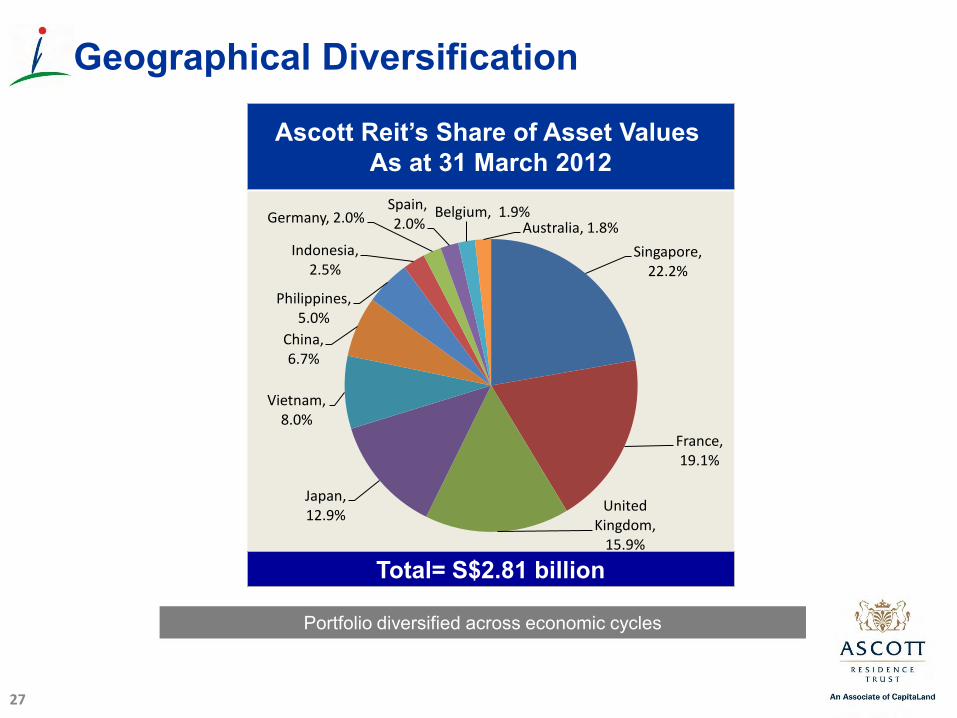
Ascott Reit’s Share of Asset Values As at 31 March 2012
27
Total= S$2.81 billion
Portfolio diversified across economic cycles
Geographical Diversification
Singapore, 22.2%
France, 19.1%
United Kingdom,
15.9%
Japan, 12.9%
Vietnam, 8.0%
China, 6.7%
Philippines, 5.0%
Indonesia, 2.5%
Germany, 2.0% Spain, 2.0%
Belgium, 1.9% Australia, 1.8%
4. Capital & Risk Management
28
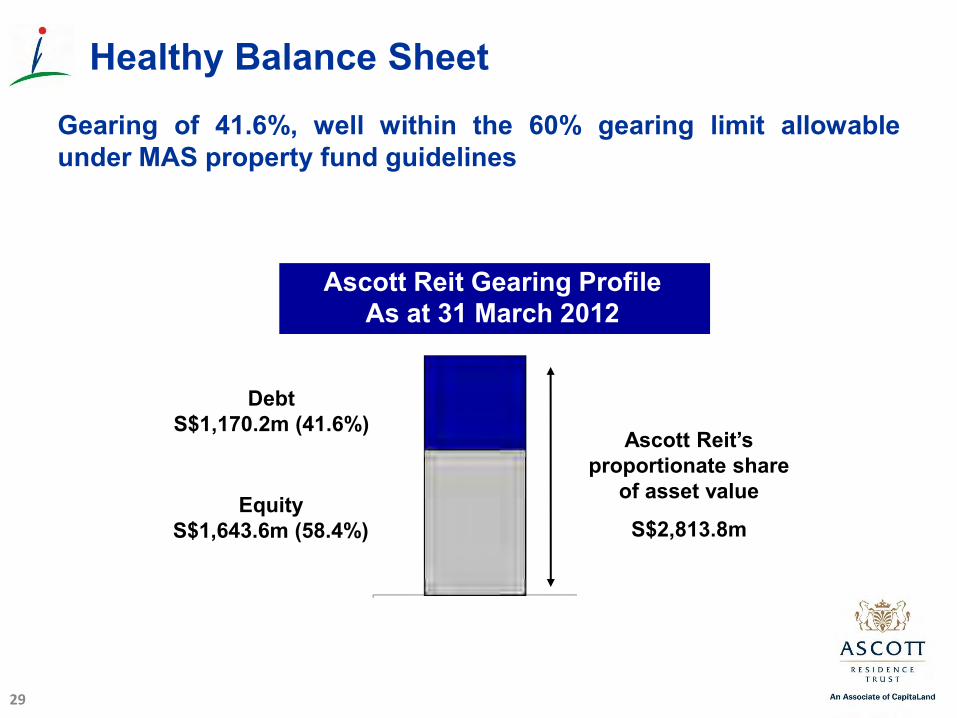
Gearing of 41.6%, well within the 60% gearing limit allowable under MAS property fund guidelines
29
Ascott Reit’s proportionate share
of asset value
S$2,813.8m
Ascott Reit Gearing Profile As at 31 March 2012
Debt S$1,170.2m (41.6%)
Equity S$1,643.6m (58.4%)
Healthy Balance Sheet
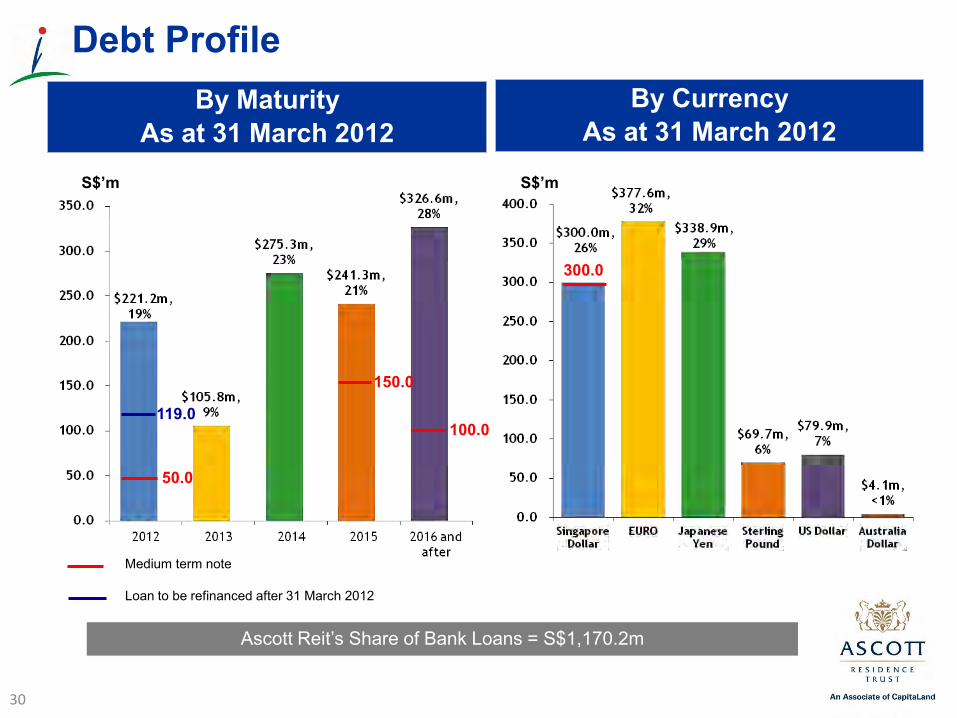
30
By Maturity As at 31 March 2012
By Currency As at 31 March 2012
Debt Profile
S$’m S$’m
50.0
Medium term note Loan to be refinanced after 31 March 2012
Ascott Reit’s Share of Bank Loans = S$1,170.2m
300.0
100.0
150.0
119.0
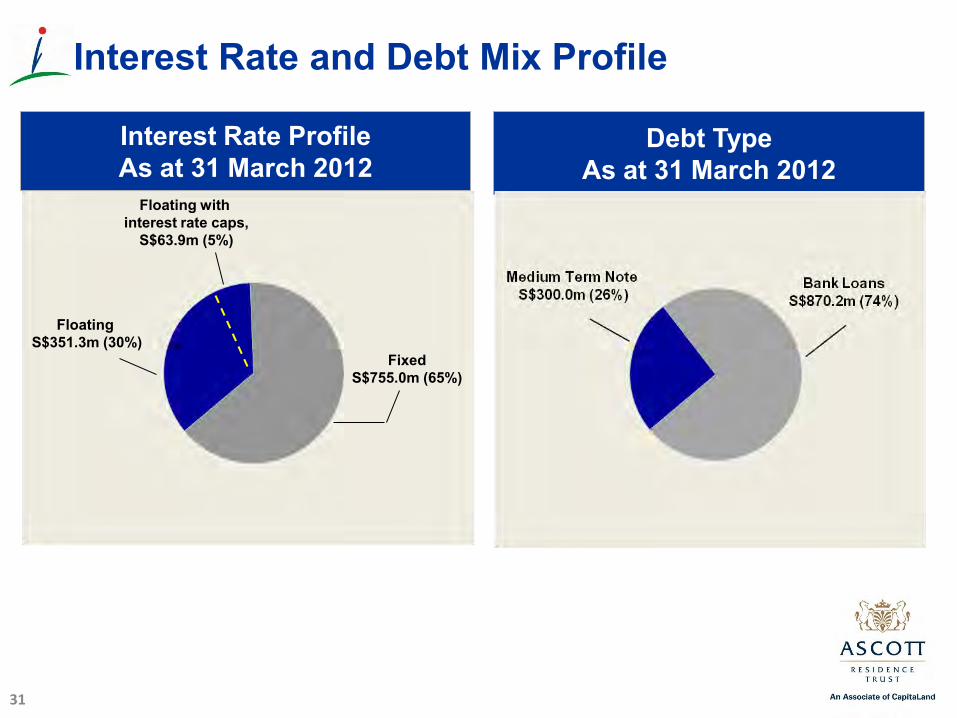
Interest Rate Profile As at 31 March 2012
31
Floating with interest rate caps,
S$63.9m (5%)
Fixed S$755.0m (65%)
Floating S$351.3m (30%)
Interest Rate and Debt Mix Profile
Debt Type As at 31 March 2012

Capital and Risk Management Strategy
32
Credit Metrics as at 31 March 2012
Moody’s Rating
Interest Cover
Effective Borrowing Rate
Baa3
3.6x
3.4%
Weighted Avg Debt to Maturity 3.1 years
Gearing 41.6%

Foreign Exchange Movements Ascott Reit’s Share of Gross Profit YTD March 2012
33
Total = S$35.4 million
Currency
Percentage of Ascott Reit’s Share
of Gross Profit 31 March 2012
Movement of exchange rates from
Dec’11 to Mar'12
SGD 20 -
EUR 29 -3.7
GBP 11 -1.8
JPY 8 -2.3
VND 12 -3.2
RMB 5 -1.0
PHP 10 -1.0
USD 3 -1.8
AUD 2 2.4
Total 100 -2.1
Foreign Exchange Profile
Singapore, 20.0%
France, 24.4%
United Kingdom,
10.8%
Japan, 7.5%
Vietnam, 11.9%
China, 5.0%
Philippines, 9.7%
Indonesia, 3.2%
Germany, 2.6%
Spain, 1.2% Belgium, 1.2% Australia, 2.5%
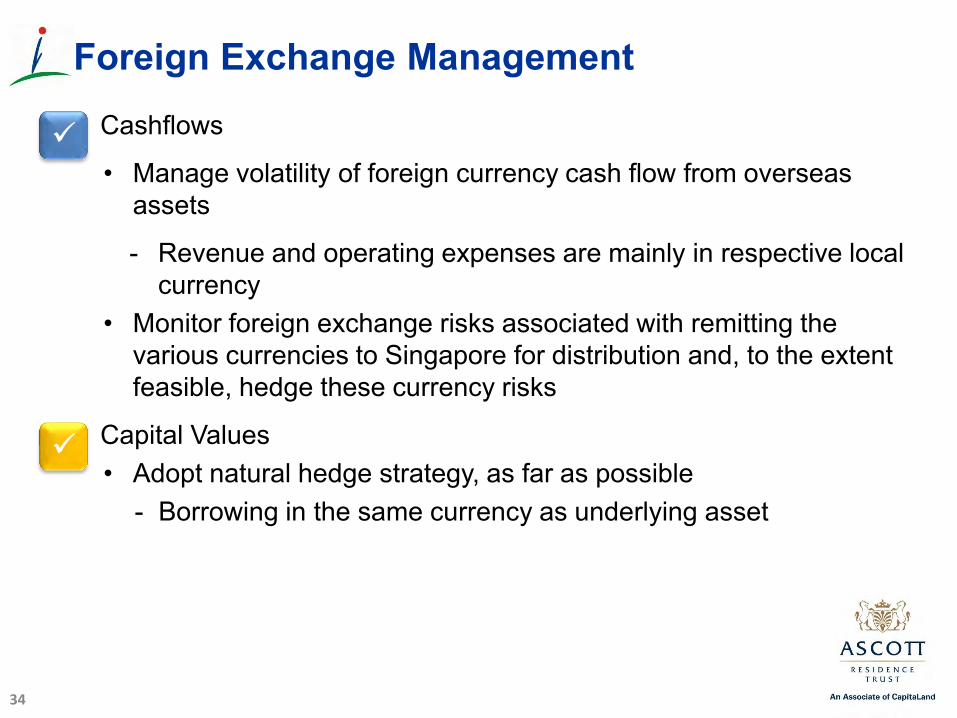
• Cashflows
• Manage volatility of foreign currency cash flow from overseas assets
- Revenue and operating expenses are mainly in respective local currency
• Monitor foreign exchange risks associated with remitting the various currencies to Singapore for distribution and, to the extent feasible, hedge these currency risks
• Capital Values • Adopt natural hedge strategy, as far as possible
- Borrowing in the same currency as underlying asset
Foreign Exchange Management
34
5. Prospects
36
Outlook and Prospects The macroeconomic outlook for 2012 continues to remain volatile.
o Despite such economic conditions, Ascott Reit’s geographically diversified portfolio with exposure to different economic cycles provides stability of income.
o Further income stability is supported by our extended-stay model as well as properties on master lease and serviced residence contracts with minimum guaranteed income.
Actively manage our assets through periodic upgrading, refurbishment
and reconfiguration of properties to maximise returns from assets in Ascott Reit’s portfolio. o Citadines Prestige Trafalgar Square was well received following the completion of
rebranding and renovation in first quarter 2012. o The upcoming London Olympics is expected to have a positive impact on the
properties in United Kingdom. Continue to focus on yield accretive acquisitions in countries where we
operate, and explore opportunities in new markets. The Group’s operating performance for FY 2012 is expected to remain profitable.

Thank You