Ascarite II Performance as a Carbon Dioxide Scrubber
88
Page 1 of 24 Ascarite II Performance as a Carbon Dioxide Scrubber: Use with the Fumiscope Fumigant Monitoring Instrument. April 20-30, 2009 Project Principal Co-investigators: Alan V. Barak, Ph. D. Lisa K. Mosser, B. Sc. Entomologist/Commodity Treatment Sr. Analytical Chemist USDA, CPHST, Otis Laboratory USDA, APHIS, CPHST, NRMAL 1398 West Truck Road 3505 25 th Ave. Buzzards Bay, MA 02542 Gulfport, MS 35901 Ph. 508.563.9303 Ph. 228-822-3111 [email protected] [email protected] Woodward Bailey, Ph. D. Treatment Program Manager USDA, APHIS, CPHST, TQAU 1730 Varsity Drive, Suite 400 Raleigh, NC 27606-5202 Ph. 919-855-7502 [email protected] Background During the course of Methyl Bromide (MeBr) fumigation, certain commodities (green wood, produce) evolve varying and significant amounts of Carbon dioxide (CO 2 ). This CO 2 registers as MeBr on fumigant monitors that use non-discriminatory thermal conductivity technology. The product Ascarite II (Sodium hydroxide based) can remove CO 2 from the sample stream. However, its longevity and performance in conjunction with the Fumiscope and at several CO 2 concentrations has not been verified or well- documented.
Transcript of Ascarite II Performance as a Carbon Dioxide Scrubber
Page 1 of 24
Ascarite II Performance as a Carbon Dioxide Scrubber:
Use with the Fumiscope Fumigant Monitoring Instrument.
April 20-30, 2009
Project Principal Co-investigators:
Alan V. Barak, Ph. D. Lisa K. Mosser, B. Sc.
Entomologist/Commodity Treatment Sr. Analytical Chemist
USDA, CPHST, Otis Laboratory USDA, APHIS, CPHST, NRMAL
1398 West Truck Road 3505 25th
Ave.
Buzzards Bay, MA 02542 Gulfport, MS 35901
Ph. 508.563.9303 Ph. 228-822-3111
[email protected] [email protected]
Woodward Bailey, Ph. D.
Treatment Program Manager
USDA, APHIS, CPHST, TQAU
1730 Varsity Drive, Suite 400
Raleigh, NC 27606-5202
Ph. 919-855-7502
Background
During the course of Methyl Bromide (MeBr) fumigation, certain commodities (green
wood, produce) evolve varying and significant amounts of Carbon dioxide (CO2). This
CO2 registers as MeBr on fumigant monitors that use non-discriminatory thermal
conductivity technology. The product Ascarite II (Sodium hydroxide based) can remove
CO2 from the sample stream. However, its longevity and performance in conjunction
with the Fumiscope and at several CO2 concentrations has not been verified or well-
documented.
Page 2 of 24
Brief Project Outline
The initial objectives were to 1.) Document and quantify possible blow-by of
CO2 through Ascarite. By that, we mean the amount of CO2 that may pass the Ascarite
tube without being scrubbed. 2.) Determine how long and how efficiently tubes of
Ascarite II will perform to our specifications when CO2 of concentrations from 0.5 up to
5% are present under conditions of use during typical fumigation monitoring. These
experiments were conducted at the USDA, APHIS, CPHST, NRMAL facility in
Gulfport, MS. Project supported under Project 94181-C9Q51.
Initial Calibration Tests.
The Qubit S-157 CO2 Analyzer (the Qubit) was calibrated at 0-2000 ppm CO2 as
follows. Clean cylinder air was passed through a Drierite tube (#26930, 10-20 mesh),
then through a polycarbonate Ascarite II tube (made from an empty Drierite 26930 tube)
to clean all CO2. Using factory calibration, this produced a reading of 0 ppm CO2 on the
Qubit. The flow was adjusted to an index of 75 on the Gilmont indexed flow gauge (the
Gauge). Tables from Gilmont indicated that this would supply about 475 ml/min air
flow. T he Qubit was then calibrated at 0 ppm CO2. Then, the Ascarite tube was
removed and the Qubit was calibrated at 2000 ppm CO2 by preparing a 3-L gas bag with
2000 ppm CO2, and then allowing the gas to flow through the Qubit. Lastly, air flow was
produced by connecting an Air Cadet vacuum pump in-line, after the Qubit. The
equipment set-up for calibration is shown in Figure 1. below. Following this, a
calibration check was performed by passing 2000 ppm CO2, applying the Ascarite tube
after about 2.5 minutes, and then removing the Ascarite tube after about 6.5 minutes.
The resultant evidence of accurate calibration is presented below in Figure 2.
Page 3 of 24
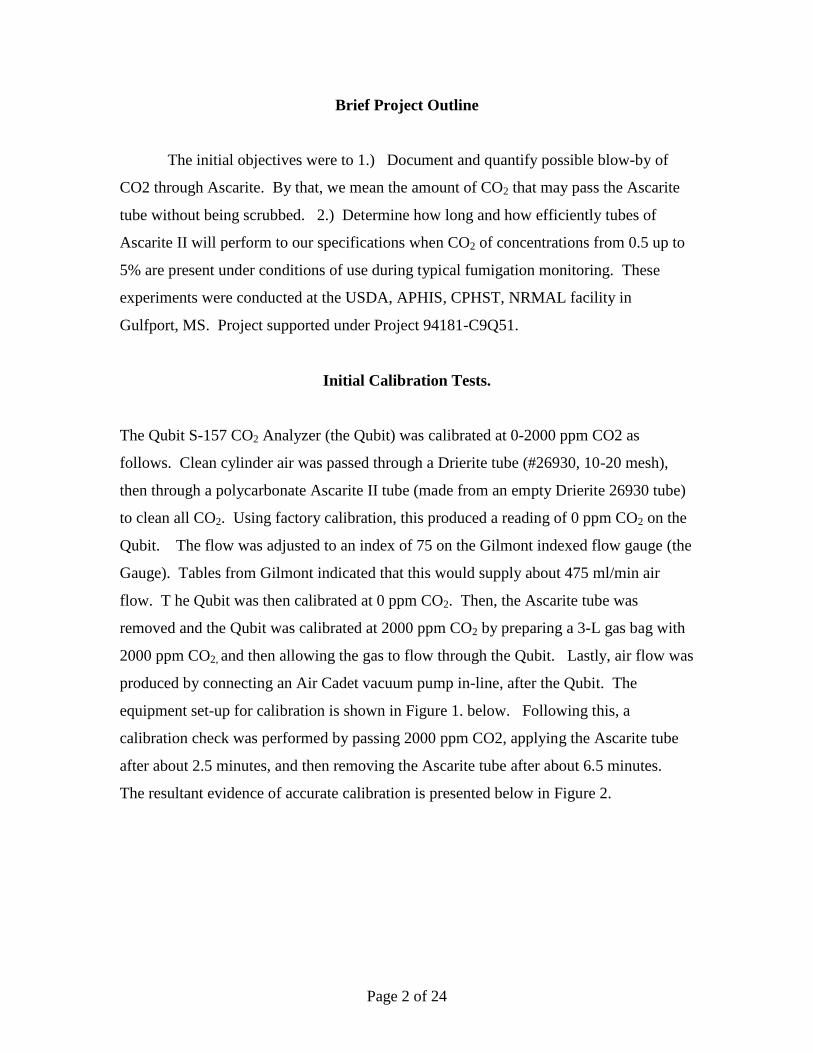
Figure 1. Set-up of the Qubit CO2 for calibration, with (r-l) sample supply bag, Drierite
tube, Ascarite (in Drierite tube), Gilmont gauge, Qubit S-157 CO2 analyzer, and Air
Cadet vacuum source.
Qubit Calibration 0-2000 PPM CO2
0
500
1000
1500
2000
2500
0 2 4 6 8 10 12
Elapsed Time in Minutes
Qu
bit
PP
M C
O2
PPM CO2
Figure 2. Verification of zero and 2000 ppm CO2 span of the Qubit analyzer.
Page 4 of 24
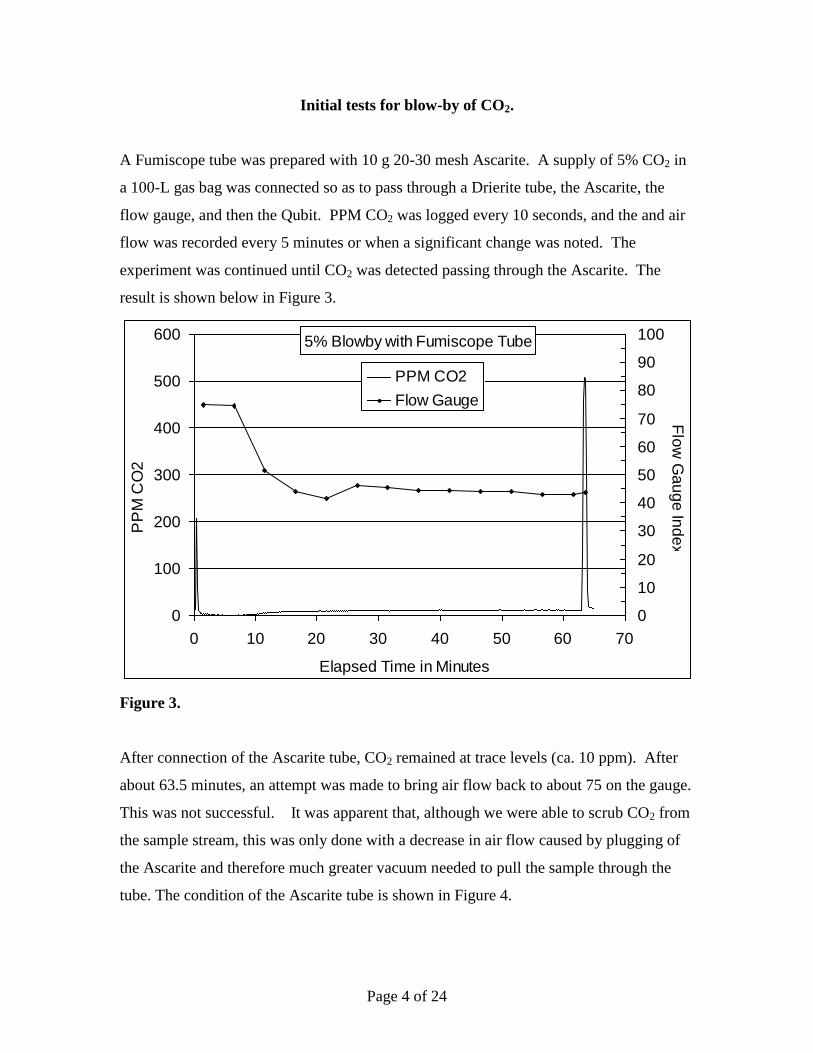
Initial tests for blow-by of CO2.
A Fumiscope tube was prepared with 10 g 20-30 mesh Ascarite. A supply of 5% CO2 in
a 100-L gas bag was connected so as to pass through a Drierite tube, the Ascarite, the
flow gauge, and then the Qubit. PPM CO2 was logged every 10 seconds, and the and air
flow was recorded every 5 minutes or when a significant change was noted. The
experiment was continued until CO2 was detected passing through the Ascarite. The
result is shown below in Figure 3.
5% Blowby with Fumiscope Tube
0
100
200
300
400
500
600
0 10 20 30 40 50 60 70
Elapsed Time in Minutes
PP
M C
O2
0
10
20
30
40
50
60
70
80
90
100
Flo
w G
au
ge
Ind
ex
PPM CO2
Flow Gauge
Figure 3.
After connection of the Ascarite tube, CO2 remained at trace levels (ca. 10 ppm). After
about 63.5 minutes, an attempt was made to bring air flow back to about 75 on the gauge.
This was not successful. It was apparent that, although we were able to scrub CO2 from
the sample stream, this was only done with a decrease in air flow caused by plugging of
the Ascarite and therefore much greater vacuum needed to pull the sample through the
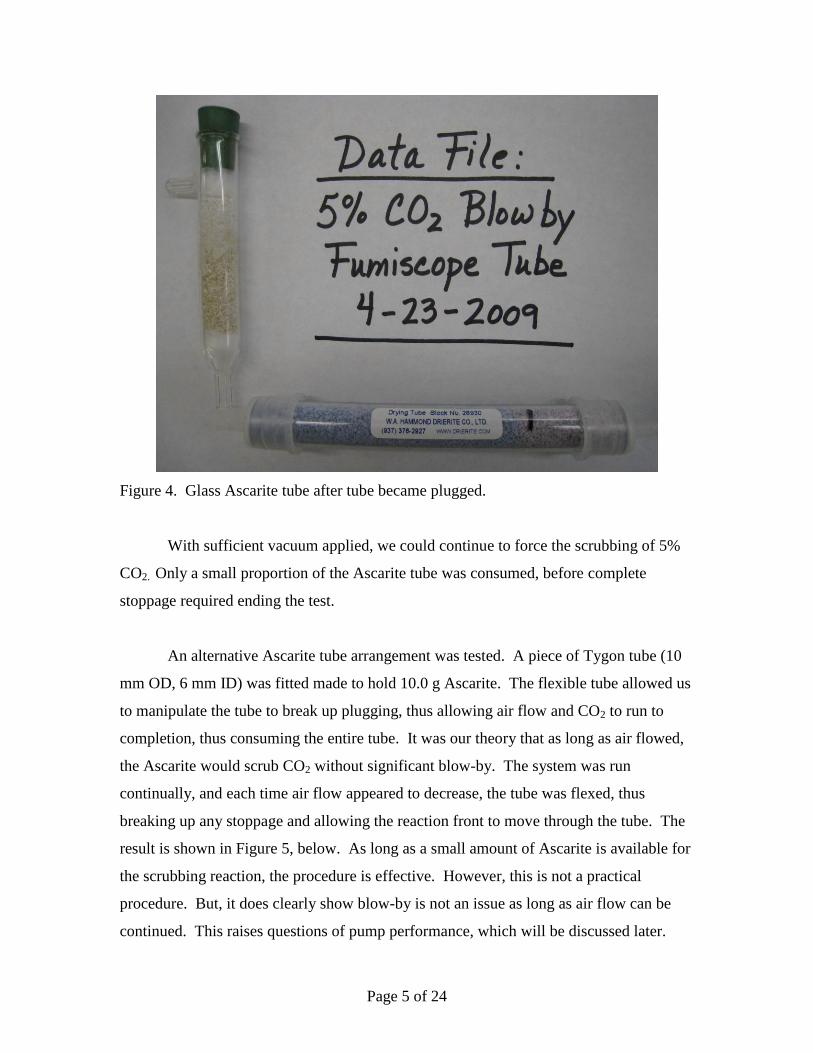
tube. The condition of the Ascarite tube is shown in Figure 4.
Page 5 of 24
Figure 4. Glass Ascarite tube after tube became plugged.
With sufficient vacuum applied, we could continue to force the scrubbing of 5%
CO2. Only a small proportion of the Ascarite tube was consumed, before complete
stoppage required ending the test.
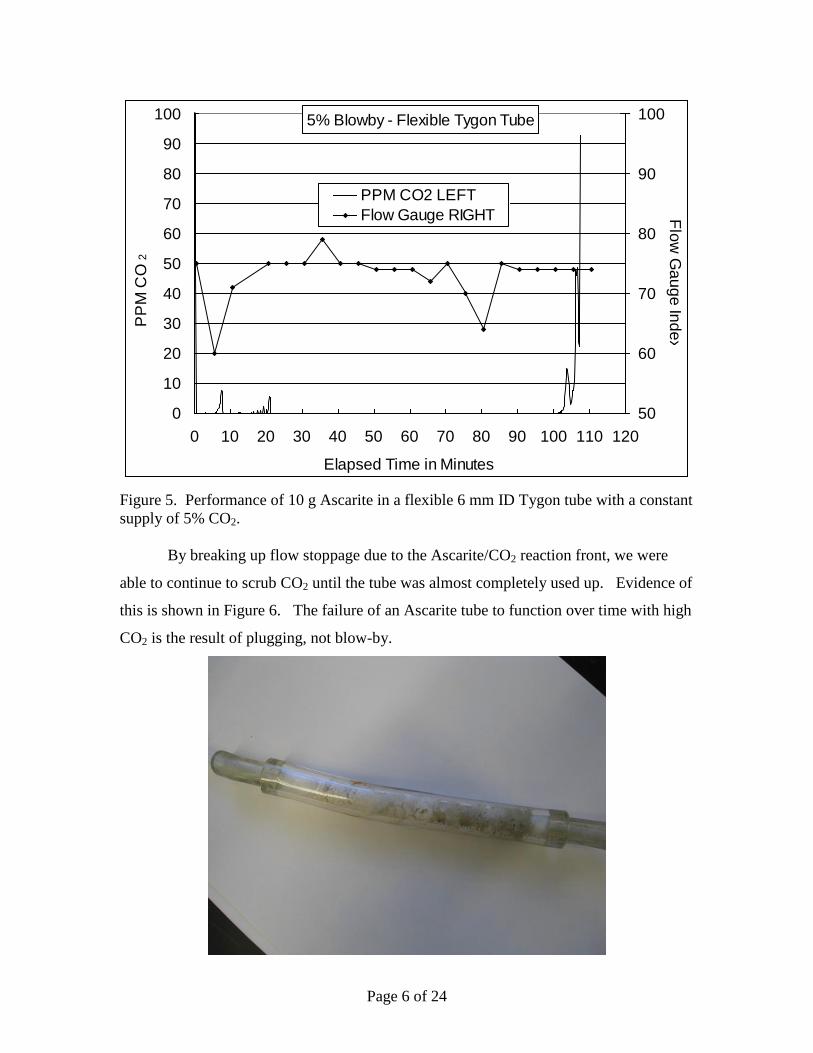
An alternative Ascarite tube arrangement was tested. A piece of Tygon tube (10
mm OD, 6 mm ID) was fitted made to hold 10.0 g Ascarite. The flexible tube allowed us
to manipulate the tube to break up plugging, thus allowing air flow and CO2 to run to
completion, thus consuming the entire tube. It was our theory that as long as air flowed,
the Ascarite would scrub CO2 without significant blow-by. The system was run
continually, and each time air flow appeared to decrease, the tube was flexed, thus
breaking up any stoppage and allowing the reaction front to move through the tube. The
result is shown in Figure 5, below. As long as a small amount of Ascarite is available for
the scrubbing reaction, the procedure is effective. However, this is not a practical
procedure. But, it does clearly show blow-by is not an issue as long as air flow can be
continued. This raises questions of pump performance, which will be discussed later.
Page 6 of 24
5% Blowby - Flexible Tygon Tube
0
10
20
30
40
50
60
70
80
90
100
0 10 20 30 40 50 60 70 80 90 100 110 120
Elapsed Time in Minutes
PP
M C
O2
50
60
70
80
90
100
Flo
w G
au
ge
Ind
ex
PPM CO2 LEFT
Flow Gauge RIGHT
Figure 5. Performance of 10 g Ascarite in a flexible 6 mm ID Tygon tube with a constant
supply of 5% CO2.
By breaking up flow stoppage due to the Ascarite/CO2 reaction front, we were
able to continue to scrub CO2 until the tube was almost completely used up. Evidence of
this is shown in Figure 6. The failure of an Ascarite tube to function over time with high
CO2 is the result of plugging, not blow-by.
Page 7 of 24
Tests with Variable CO2 Concentrations and 20-30 Mesh Ascarite II.
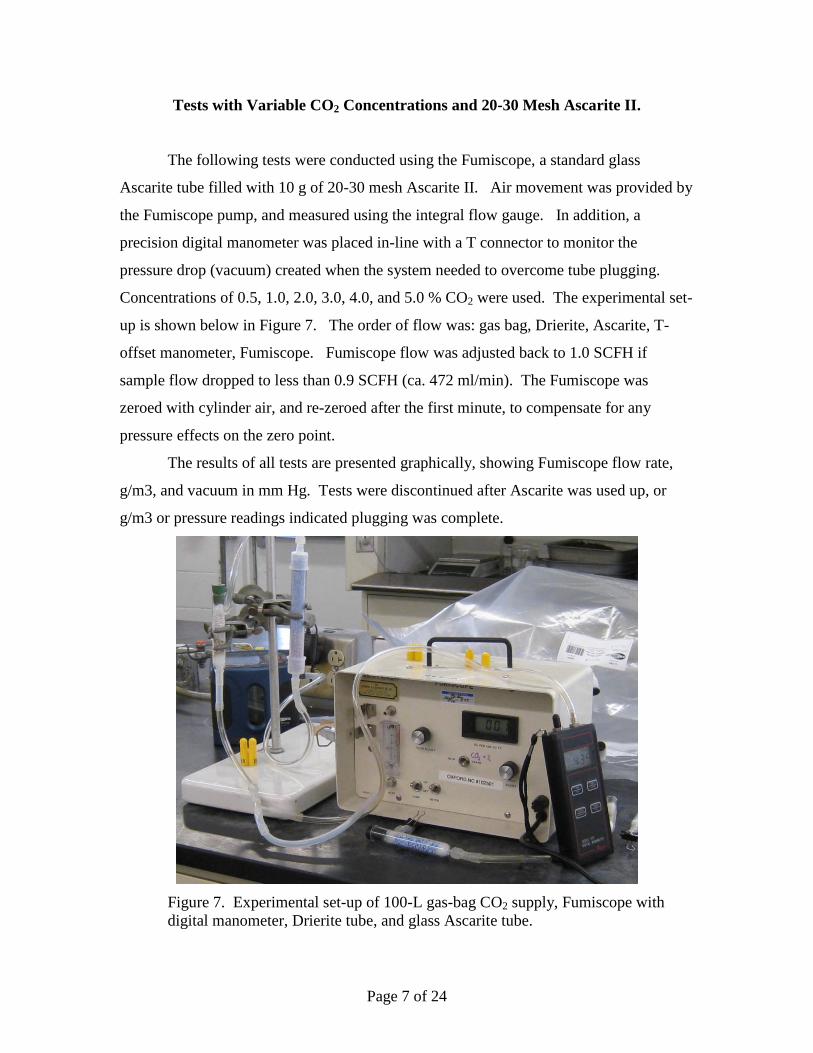
The following tests were conducted using the Fumiscope, a standard glass
Ascarite tube filled with 10 g of 20-30 mesh Ascarite II. Air movement was provided by
the Fumiscope pump, and measured using the integral flow gauge. In addition, a
precision digital manometer was placed in-line with a T connector to monitor the
pressure drop (vacuum) created when the system needed to overcome tube plugging.
Concentrations of 0.5, 1.0, 2.0, 3.0, 4.0, and 5.0 % CO2 were used. The experimental set-
up is shown below in Figure 7. The order of flow was: gas bag, Drierite, Ascarite, T-
offset manometer, Fumiscope. Fumiscope flow was adjusted back to 1.0 SCFH if
sample flow dropped to less than 0.9 SCFH (ca. 472 ml/min). The Fumiscope was
zeroed with cylinder air, and re-zeroed after the first minute, to compensate for any
pressure effects on the zero point.
The results of all tests are presented graphically, showing Fumiscope flow rate,
g/m3, and vacuum in mm Hg. Tests were discontinued after Ascarite was used up, or
g/m3 or pressure readings indicated plugging was complete.
Figure 7. Experimental set-up of 100-L gas-bag CO2 supply, Fumiscope with
digital manometer, Drierite tube, and glass Ascarite tube.
Page 8 of 24
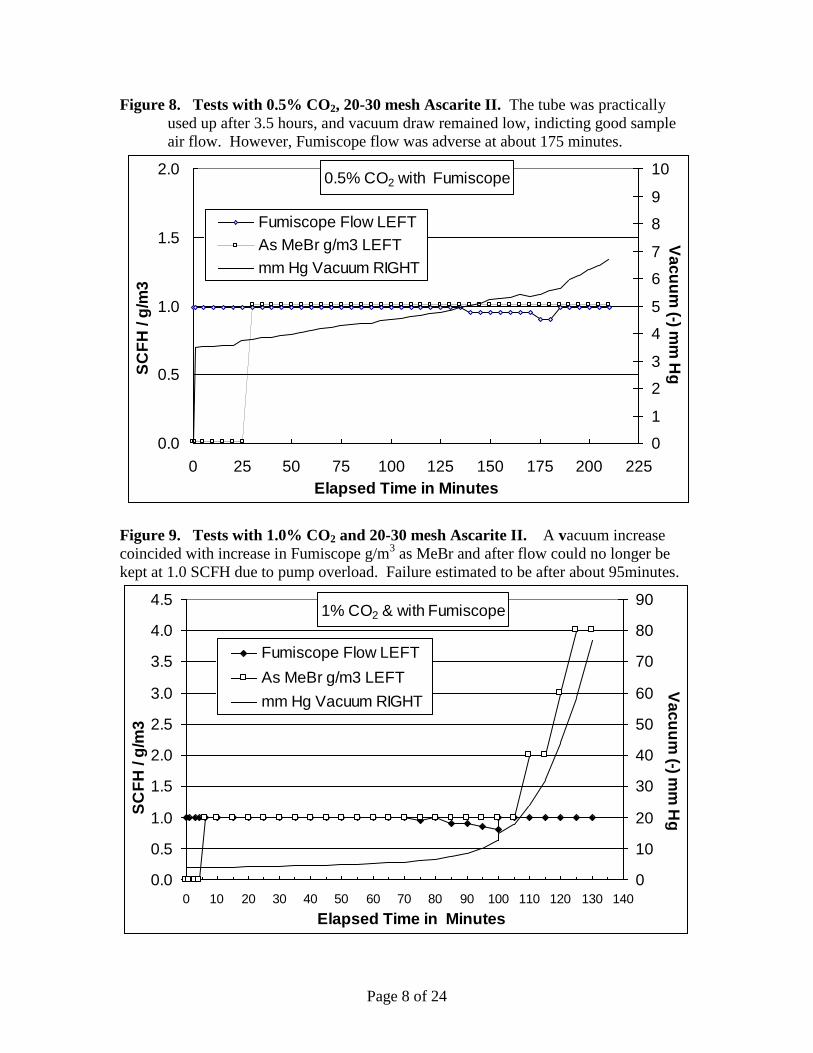
Figure 8. Tests with 0.5% CO2, 20-30 mesh Ascarite II. The tube was practically
used up after 3.5 hours, and vacuum draw remained low, indicting good sample
air flow. However, Fumiscope flow was adverse at about 175 minutes.
0.5% CO2 with Fumiscope
0.0
0.5
1.0
1.5
2.0
0 25 50 75 100 125 150 175 200 225
Elapsed Time in Minutes
SC
FH
/ g
/m3
0
1
2
3
4
5
6
7
8
9
10
Va
cu
um
(-) mm
Hg
Fumiscope Flow LEFT
As MeBr g/m3 LEFT
mm Hg Vacuum RIGHT
Figure 9. Tests with 1.0% CO2 and 20-30 mesh Ascarite II. A vacuum increase
coincided with increase in Fumiscope g/m3 as MeBr and after flow could no longer be
kept at 1.0 SCFH due to pump overload. Failure estimated to be after about 95minutes.
1% CO2 & with Fumiscope
0.0
0.5
1.0
1.5
2.0
2.5
3.0
3.5
4.0
4.5
0 10 20 30 40 50 60 70 80 90 100 110 120 130 140
Elapsed Time in Minutes
SC
FH
/ g
/m3
0
10
20
30
40
50
60
70
80
90
Va
cu
um
(-) mm
Hg
Fumiscope Flow LEFT
As MeBr g/m3 LEFT
mm Hg Vacuum RIGHT
Page 9 of 24
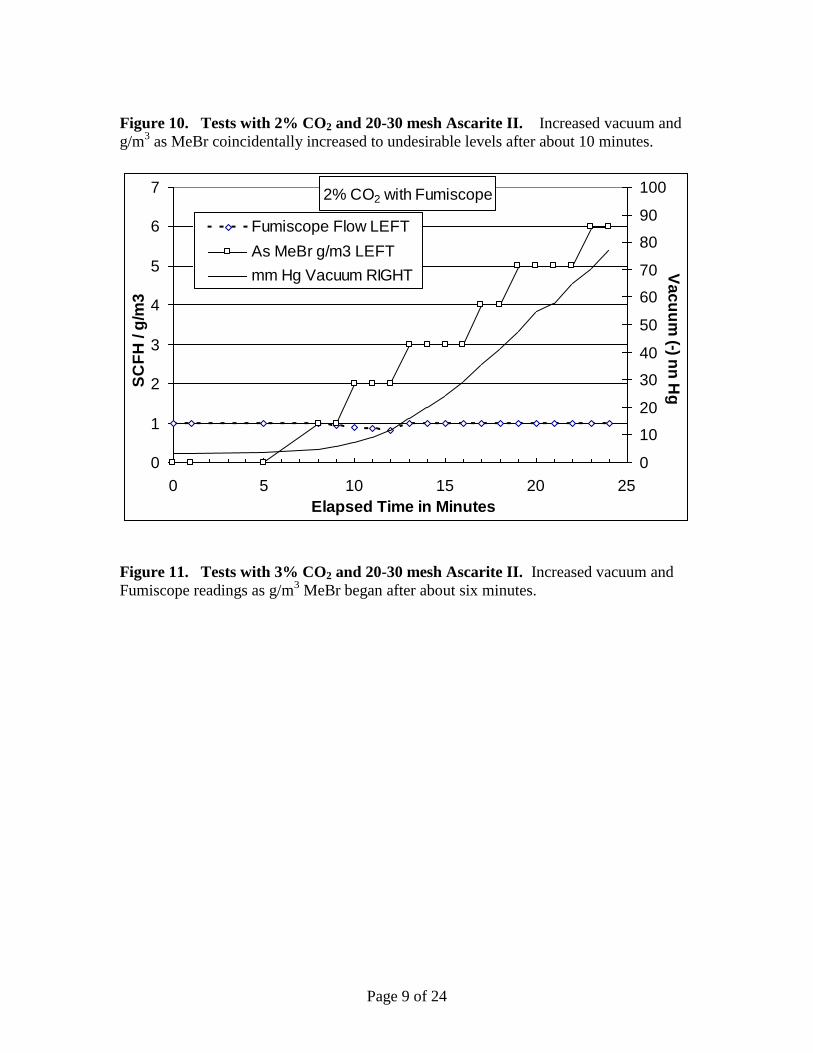
Figure 10. Tests with 2% CO2 and 20-30 mesh Ascarite II. Increased vacuum and
g/m3 as MeBr coincidentally increased to undesirable levels after about 10 minutes.
2% CO2 with Fumiscope
0
1
2
3
4
5
6
7
0 5 10 15 20 25
Elapsed Time in Minutes
SC
FH
/ g
/m3
0
10
20
30
40
50
60
70
80
90
100
Va
cu
um
(-) nn
Hg
Fumiscope Flow LEFT
As MeBr g/m3 LEFT
mm Hg Vacuum RIGHT
Figure 11. Tests with 3% CO2 and 20-30 mesh Ascarite II. Increased vacuum and
Fumiscope readings as g/m3 MeBr began after about six minutes.

Page 10 of 24
3% CO2 with Fumiscope
0
1
2
3
4
5
6
7
0 1 2 3 4 5 6 7 8 9 10
Elapsed Time in Minutes
SC
FH
/ g
/m3
0
10
20
30
40
50
60
70
80
90
Va
cu
um
(-) mm
Hg
Fumiscope Flow LEFT
As MeBr g/m3 LEFT
mm Hg Vacuum RIGHT
Figure 12. Tests with 4% CO2 and 20-30 mesh Ascarite II. Failure due to increased
vacuum, Fumiscope pump overload and increase in g/m3 as MeBr indication after about
three minutes.
4% CO2 with Fumiscope
0
1
2
3
4
5
0 1 2 3 4 5 6
Elapsed Time in Minutes
SC
FH
/ g
/m3
0
10
20
30
40
50
60
70
80
90
100
Va
cu
um
(-) mm
Hg
Fumiscope Flow LEFT
As MeBr g/m3 LEFT
mm Hg Vacuum RIGHT
Page 11 of 24
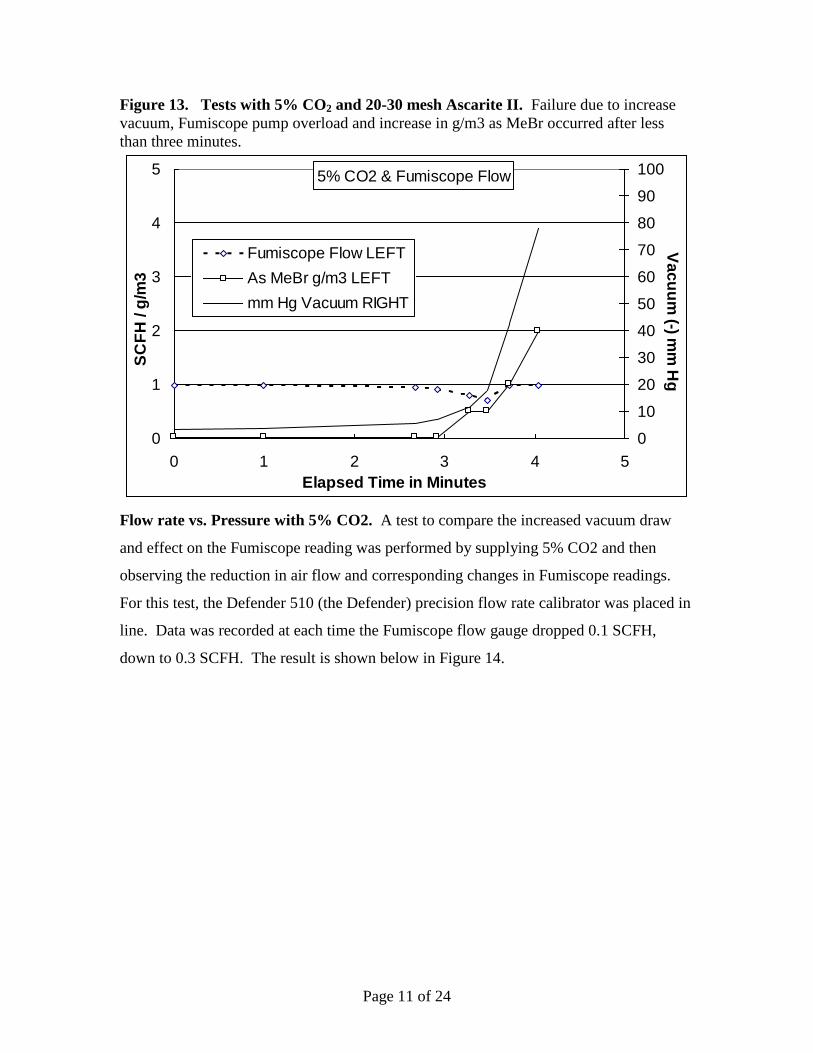
Figure 13. Tests with 5% CO2 and 20-30 mesh Ascarite II. Failure due to increase
vacuum, Fumiscope pump overload and increase in g/m3 as MeBr occurred after less
than three minutes.
5% CO2 & Fumiscope Flow
0
1
2
3
4
5
0 1 2 3 4 5
Elapsed Time in Minutes
SC
FH
/ g
/m3
0
10
20
30
40
50
60
70
80
90
100
Va
cu
um
(-) mm
Hg
Fumiscope Flow LEFT
As MeBr g/m3 LEFT
mm Hg Vacuum RIGHT
Flow rate vs. Pressure with 5% CO2. A test to compare the increased vacuum draw
and effect on the Fumiscope reading was performed by supplying 5% CO2 and then
observing the reduction in air flow and corresponding changes in Fumiscope readings.
For this test, the Defender 510 (the Defender) precision flow rate calibrator was placed in
line. Data was recorded at each time the Fumiscope flow gauge dropped 0.1 SCFH,
down to 0.3 SCFH. The result is shown below in Figure 14.
Page 12 of 24
Pressure vs. Flow Rate with 5% CO2
0
5
10
15
20
25
30
35
40
0.20.40.60.81
Fumiscope Flow Decrease SCFH
(-) mm
Hg
Va
cu
um
/ g/m
3
200
250
300
350
400
450
500
550
Flo
w R
ate
ml / m
in
Fumiscope FLow
LEFT(-) mm Hg RIGHT
Defender Flow
ml/min LEFT
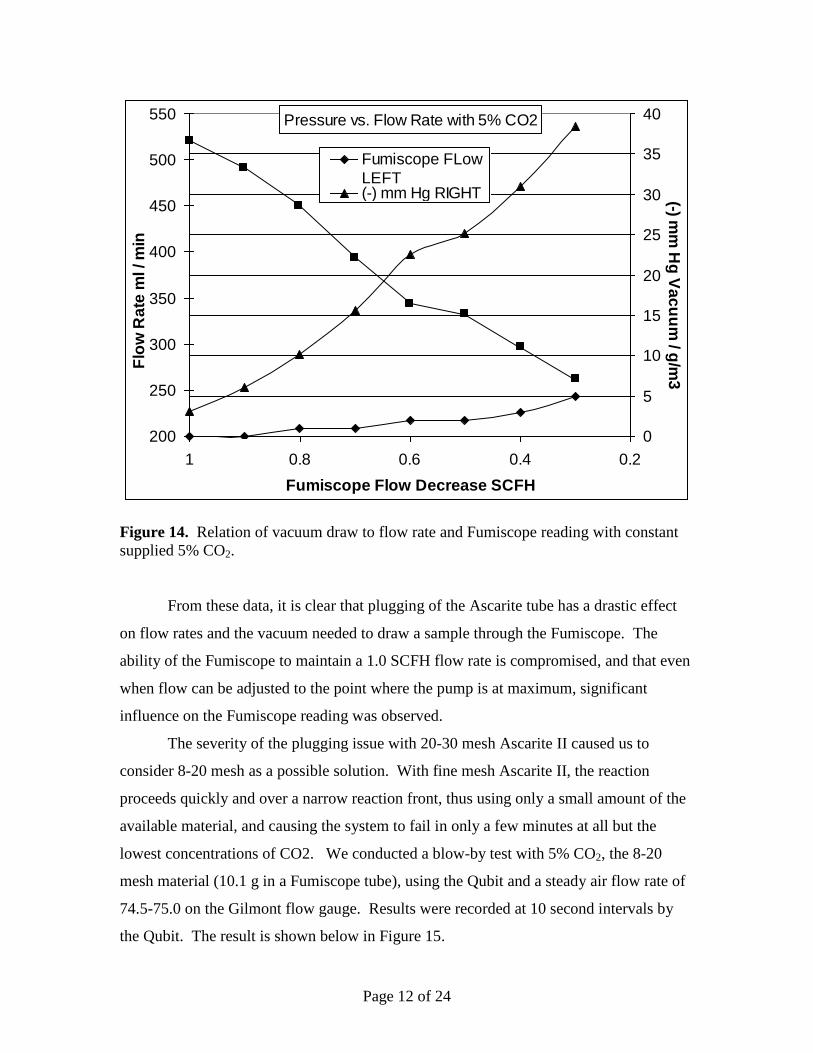
Figure 14. Relation of vacuum draw to flow rate and Fumiscope reading with constant
supplied 5% CO2.
From these data, it is clear that plugging of the Ascarite tube has a drastic effect
on flow rates and the vacuum needed to draw a sample through the Fumiscope. The
ability of the Fumiscope to maintain a 1.0 SCFH flow rate is compromised, and that even
when flow can be adjusted to the point where the pump is at maximum, significant
influence on the Fumiscope reading was observed.
The severity of the plugging issue with 20-30 mesh Ascarite II caused us to
consider 8-20 mesh as a possible solution. With fine mesh Ascarite II, the reaction
proceeds quickly and over a narrow reaction front, thus using only a small amount of the
available material, and causing the system to fail in only a few minutes at all but the
lowest concentrations of CO2. We conducted a blow-by test with 5% CO2, the 8-20
mesh material (10.1 g in a Fumiscope tube), using the Qubit and a steady air flow rate of
74.5-75.0 on the Gilmont flow gauge. Results were recorded at 10 second intervals by
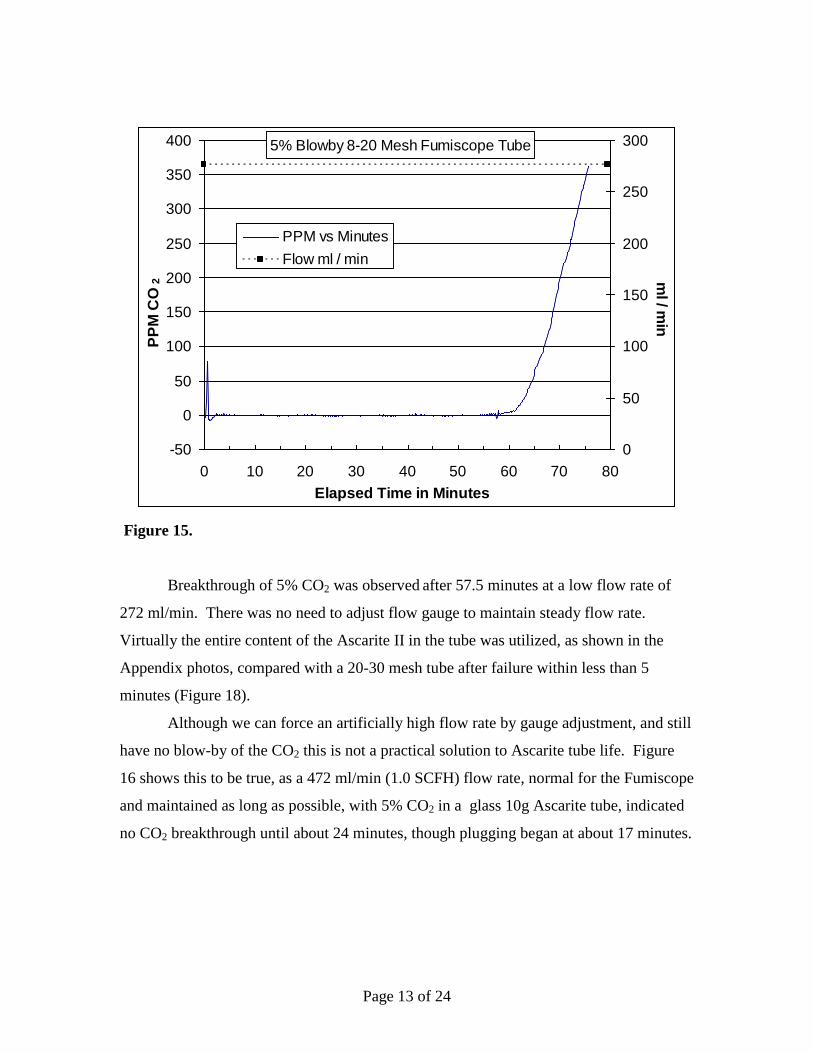
the Qubit. The result is shown below in Figure 15.
Page 13 of 24
5% Blowby 8-20 Mesh Fumiscope Tube
-50
0
50
100
150
200
250
300
350
400
0 10 20 30 40 50 60 70 80
Elapsed Time in Minutes
PP
M C
O2
0
50
100
150
200
250
300m
l / min
PPM vs Minutes
Flow ml / min
Figure 15.
Breakthrough of 5% CO2 was observed after 57.5 minutes at a low flow rate of
272 ml/min. There was no need to adjust flow gauge to maintain steady flow rate.
Virtually the entire content of the Ascarite II in the tube was utilized, as shown in the
Appendix photos, compared with a 20-30 mesh tube after failure within less than 5
minutes (Figure 18).
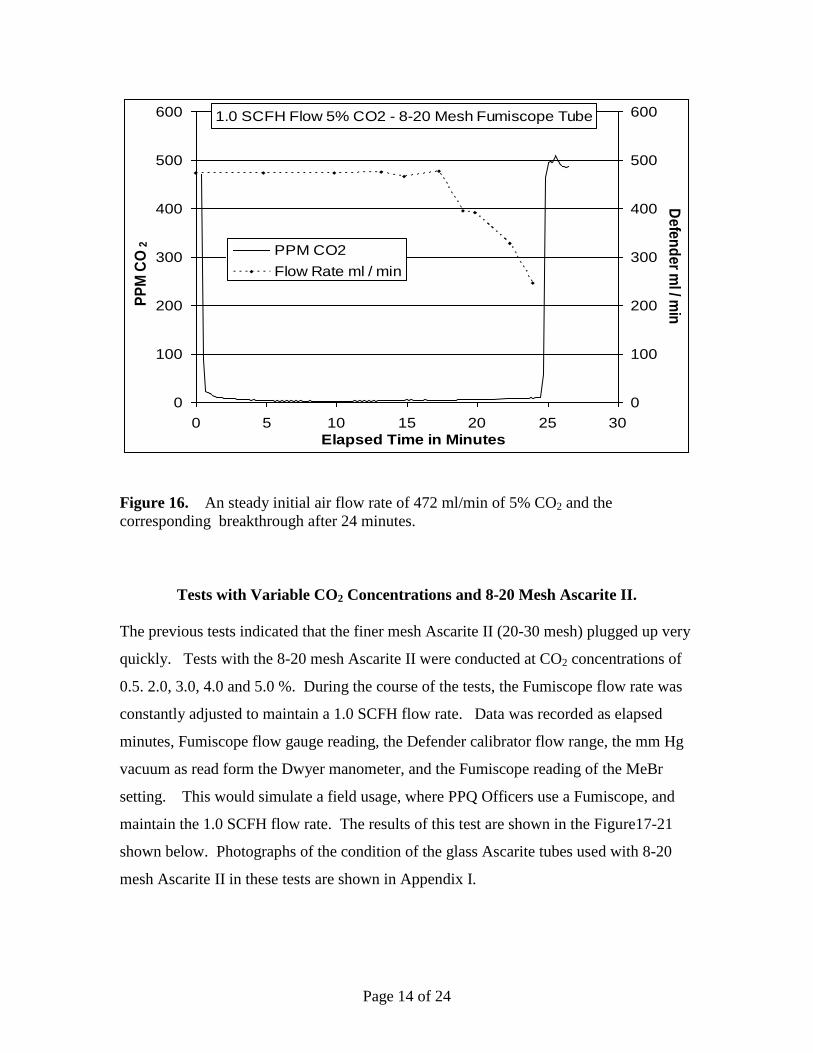
Although we can force an artificially high flow rate by gauge adjustment, and still
have no blow-by of the CO2 this is not a practical solution to Ascarite tube life. Figure
16 shows this to be true, as a 472 ml/min (1.0 SCFH) flow rate, normal for the Fumiscope
and maintained as long as possible, with 5% CO2 in a glass 10g Ascarite tube, indicated
no CO2 breakthrough until about 24 minutes, though plugging began at about 17 minutes.
Page 14 of 24
1.0 SCFH Flow 5% CO2 - 8-20 Mesh Fumiscope Tube
0
100
200
300
400
500
600
0 5 10 15 20 25 30
Elapsed Time in Minutes
PP
M C
O2
0
100
200
300
400
500
600
De
fen
de
r ml / m
in
PPM CO2
Flow Rate ml / min
Figure 16. An steady initial air flow rate of 472 ml/min of 5% CO2 and the
corresponding breakthrough after 24 minutes.
Tests with Variable CO2 Concentrations and 8-20 Mesh Ascarite II.
The previous tests indicated that the finer mesh Ascarite II (20-30 mesh) plugged up very
quickly. Tests with the 8-20 mesh Ascarite II were conducted at CO2 concentrations of
0.5. 2.0, 3.0, 4.0 and 5.0 %. During the course of the tests, the Fumiscope flow rate was
constantly adjusted to maintain a 1.0 SCFH flow rate. Data was recorded as elapsed
minutes, Fumiscope flow gauge reading, the Defender calibrator flow range, the mm Hg
vacuum as read form the Dwyer manometer, and the Fumiscope reading of the MeBr
setting. This would simulate a field usage, where PPQ Officers use a Fumiscope, and
maintain the 1.0 SCFH flow rate. The results of this test are shown in the Figure17-21
shown below. Photographs of the condition of the glass Ascarite tubes used with 8-20
mesh Ascarite II in these tests are shown in Appendix I.
Page 15 of 24
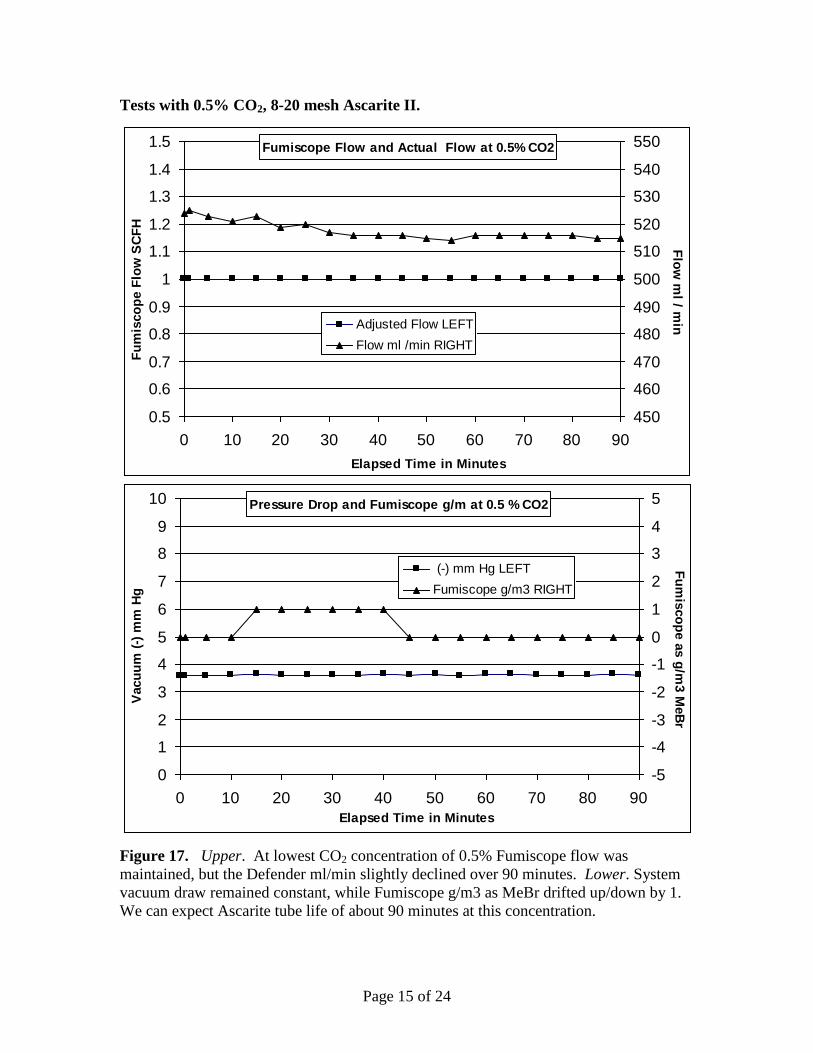
Tests with 0.5% CO2, 8-20 mesh Ascarite II.
Fumiscope Flow and Actual Flow at 0.5% CO2
0.5
0.6
0.7
0.8
0.9
1
1.1
1.2
1.3
1.4
1.5
0 10 20 30 40 50 60 70 80 90
Elapsed Time in Minutes
Fu
mis
co
pe F
low
SC
FH
450
460
470
480
490
500
510
520
530
540
550F
low
ml / m
inAdjusted Flow LEFT
Flow ml /min RIGHT
Pressure Drop and Fumiscope g/m at 0.5 % CO2
0
1
2
3
4
5
6
7
8
9
10
0 10 20 30 40 50 60 70 80 90
Elapsed Time in Minutes
Vacu
um
(-)
mm
Hg
-5
-4
-3
-2
-1
0
1
2
3
4
5
Fu
mis
co
pe a
s g
/m3 M
eB
r
(-) mm Hg LEFT
Fumiscope g/m3 RIGHT
Figure 17. Upper. At lowest CO2 concentration of 0.5% Fumiscope flow was
maintained, but the Defender ml/min slightly declined over 90 minutes. Lower. System
vacuum draw remained constant, while Fumiscope g/m3 as MeBr drifted up/down by 1.
We can expect Ascarite tube life of about 90 minutes at this concentration.
Page 16 of 24
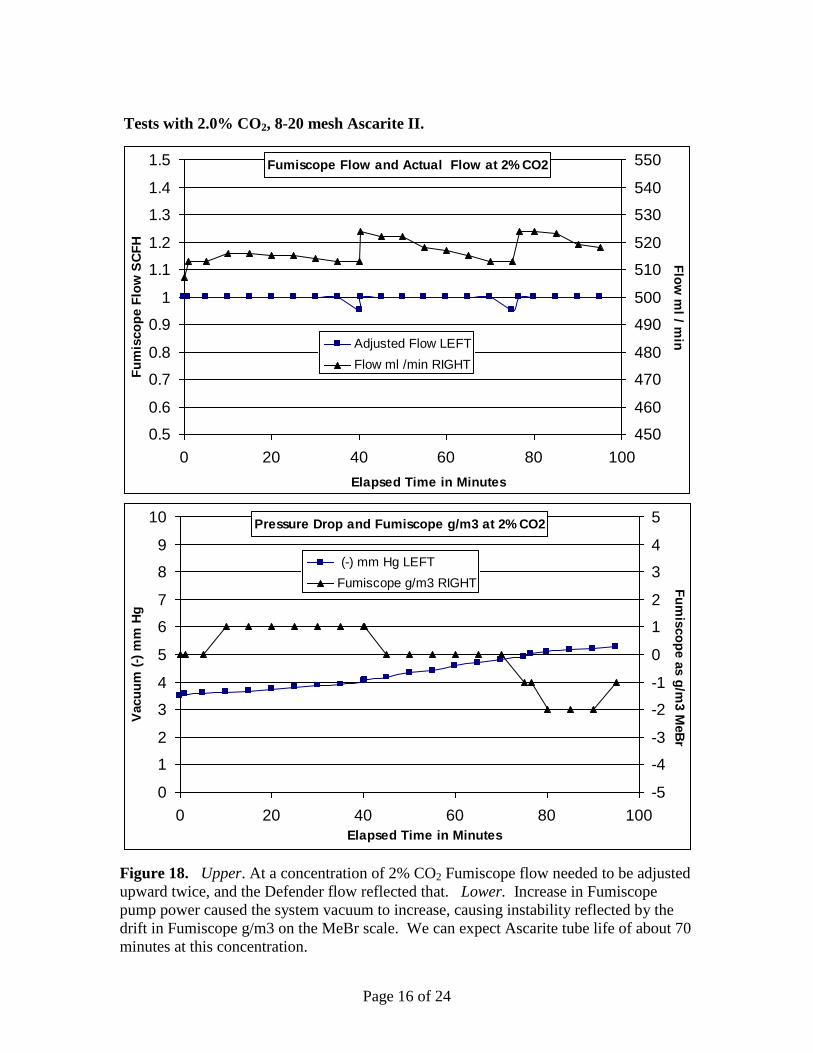
Tests with 2.0% CO2, 8-20 mesh Ascarite II.
Fumiscope Flow and Actual Flow at 2% CO2
0.5
0.6
0.7
0.8
0.9
1
1.1
1.2
1.3
1.4
1.5
0 20 40 60 80 100
Elapsed Time in Minutes
Fu
mis
co
pe F
low
SC
FH
450
460
470
480
490
500
510
520
530
540
550
Flo
w m
l / minAdjusted Flow LEFT
Flow ml /min RIGHT
Pressure Drop and Fumiscope g/m3 at 2% CO2
0
1
2
3
4
5
6
7
8
9
10
0 20 40 60 80 100
Elapsed Time in Minutes
Vacu
um
(-)
mm
Hg
-5
-4
-3
-2
-1
0
1
2
3
4
5
Fu
mis
co
pe a
s g
/m3 M
eB
r
(-) mm Hg LEFT
Fumiscope g/m3 RIGHT
Figure 18. Upper. At a concentration of 2% CO2 Fumiscope flow needed to be adjusted
upward twice, and the Defender flow reflected that. Lower. Increase in Fumiscope
pump power caused the system vacuum to increase, causing instability reflected by the
drift in Fumiscope g/m3 on the MeBr scale. We can expect Ascarite tube life of about 70
minutes at this concentration.
Page 17 of 24
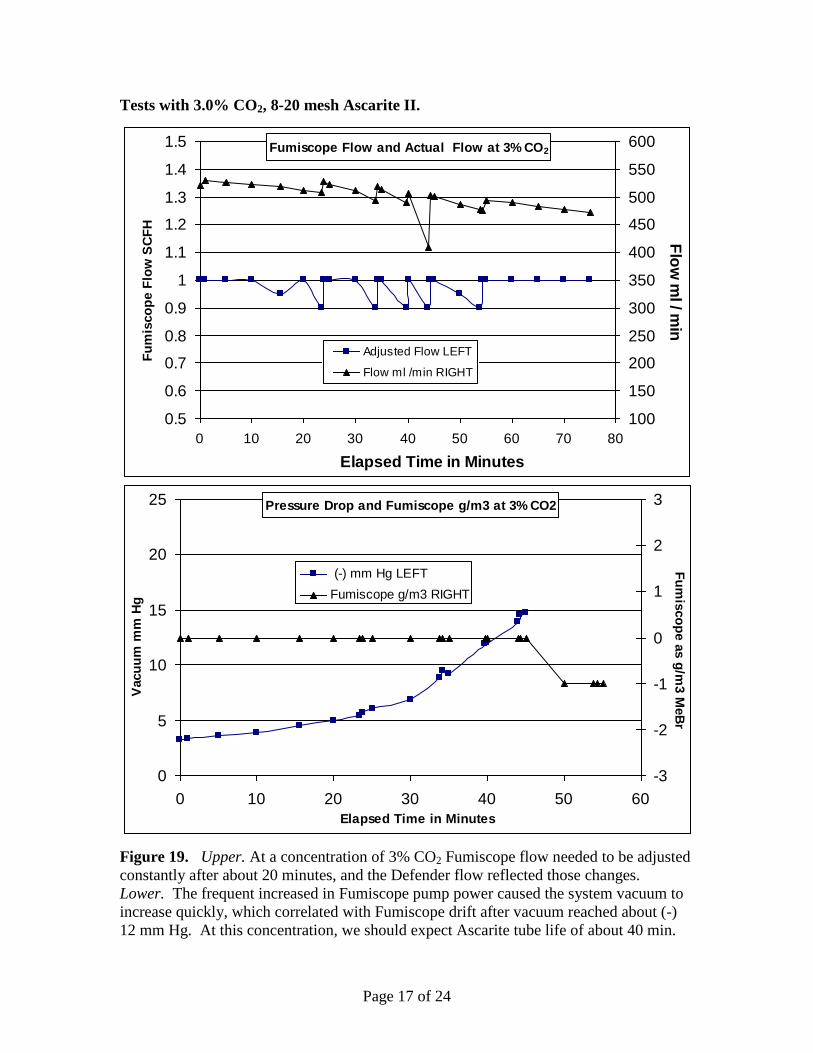
Tests with 3.0% CO2, 8-20 mesh Ascarite II.
Fumiscope Flow and Actual Flow at 3% CO2
0.5
0.6
0.7
0.8
0.9
1
1.1
1.2
1.3
1.4
1.5
0 10 20 30 40 50 60 70 80
Elapsed Time in Minutes
Fu
mis
co
pe F
low
SC
FH
100
150
200
250
300
350
400
450
500
550
600F
low
ml / m
in
Adjusted Flow LEFT
Flow ml /min RIGHT
Pressure Drop and Fumiscope g/m3 at 3% CO2
0
5
10
15
20
25
0 10 20 30 40 50 60
Elapsed Time in Minutes
Vacu
um
mm
Hg
-3
-2
-1
0
1
2
3
Fu
mis
co
pe a
s g
/m3 M
eB
r
(-) mm Hg LEFT
Fumiscope g/m3 RIGHT
Figure 19. Upper. At a concentration of 3% CO2 Fumiscope flow needed to be adjusted
constantly after about 20 minutes, and the Defender flow reflected those changes.
Lower. The frequent increased in Fumiscope pump power caused the system vacuum to
increase quickly, which correlated with Fumiscope drift after vacuum reached about (-)
12 mm Hg. At this concentration, we should expect Ascarite tube life of about 40 min.
Page 18 of 24
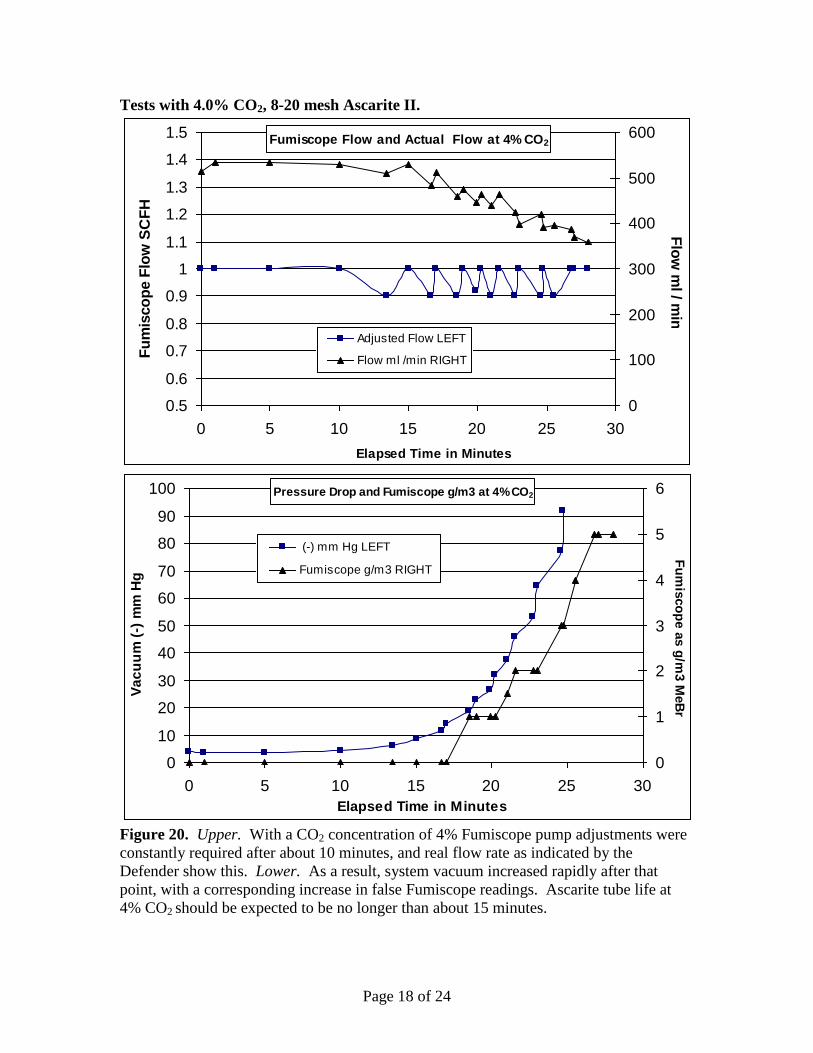
Tests with 4.0% CO2, 8-20 mesh Ascarite II.
Fumiscope Flow and Actual Flow at 4% CO2
0.5
0.6
0.7
0.8
0.9
1
1.1
1.2
1.3
1.4
1.5
0 5 10 15 20 25 30
Elapsed Time in Minutes
Fu
mis
co
pe F
low
SC
FH
0
100
200
300
400
500
600F
low
ml / m
in
Adjusted Flow LEFT
Flow ml /min RIGHT
Pressure Drop and Fumiscope g/m3 at 4% CO2
0
10
20
30
40
50
60
70
80
90
100
0 5 10 15 20 25 30
Elapsed Time in Minutes
Va
cu
um
(-)
mm
Hg
0
1
2
3
4
5
6
Fu
mis
co
pe a
s g
/m3 M
eB
r
(-) mm Hg LEFT
Fumiscope g/m3 RIGHT
Figure 20. Upper. With a CO2 concentration of 4% Fumiscope pump adjustments were
constantly required after about 10 minutes, and real flow rate as indicated by the
Defender show this. Lower. As a result, system vacuum increased rapidly after that
point, with a corresponding increase in false Fumiscope readings. Ascarite tube life at
4% CO2 should be expected to be no longer than about 15 minutes.
Page 19 of 24
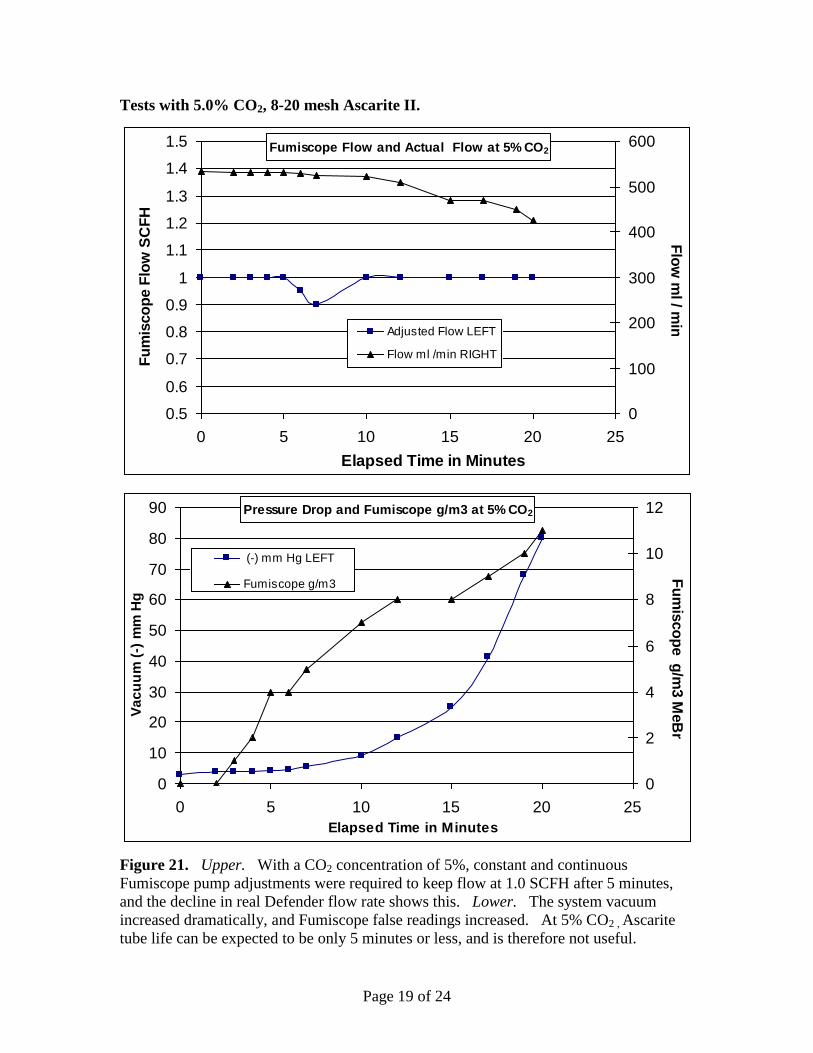
Tests with 5.0% CO2, 8-20 mesh Ascarite II.
Fumiscope Flow and Actual Flow at 5% CO2
0.5
0.6
0.7
0.8
0.9
1
1.1
1.2
1.3
1.4
1.5
0 5 10 15 20 25
Elapsed Time in Minutes
Fu
mis
co
pe F
low
SC
FH
0
100
200
300
400
500
600F
low
ml / m
in
Adjusted Flow LEFT
Flow ml /min RIGHT
Pressure Drop and Fumiscope g/m3 at 5% CO2
0
10
20
30
40
50
60
70
80
90
0 5 10 15 20 25
Elapsed Time in Minutes
Va
cu
um
(-)
mm
Hg
0
2
4
6
8
10
12
Fu
mis
co
pe g
/m3 M
eB
r
(-) mm Hg LEFT
Fumiscope g/m3
RIGHT
Figure 21. Upper. With a CO2 concentration of 5%, constant and continuous
Fumiscope pump adjustments were required to keep flow at 1.0 SCFH after 5 minutes,
and the decline in real Defender flow rate shows this. Lower. The system vacuum
increased dramatically, and Fumiscope false readings increased. At 5% CO2 , Ascarite
tube life can be expected to be only 5 minutes or less, and is therefore not useful.
Page 20 of 24
Conclusion.
The use of Ascarite II as a CO2 scrubber used with the Fumiscope has useful value, but it
is seriously affected by concentration and Ascarite mesh. We cite the following
evidence:
1. Ascarite II of either coarse or fine mesh is very efficient at scrubbing CO2, but this
only applies practically if flow and pump pressure can be maintained at suitable low
levels.
2. Ascarite II of fine 20-30 mesh is only useful at very low CO2 concentrations, as the
large reaction surface allows the scrubbing front to concentrate in the upper portion, thus
wasting the remainder, as well as causing air flow restrictions. At high concentrations,
plugging happens very fast.
3. Ascarite II of 8-20 mesh allows the reaction to proceed further and faster down the
tube, however, plugging will eventually occur. A mesh size of 8-20 is necessary at
higher concentrations.
4. Tube life should not be extended beyond time at which Fumiscope flow (and
therefore vacuum) drops below 0.8 SCFH (from original 1.0 SCFH setting). This may
occur near the end of the tube contents. Increasing the flow at this point may cause
erroneous false readings and overload Fumiscope pump.
5. The Ascarite II reaction region, as evidenced by a white reaction product, may reach
about 75% of the length of a 10 g Ascarite II charge before plugging makes change
necessary. The reaction front extends further down the tube than the solid white band,
which indicated near total consumption with increased plugging.
Page 21 of 24
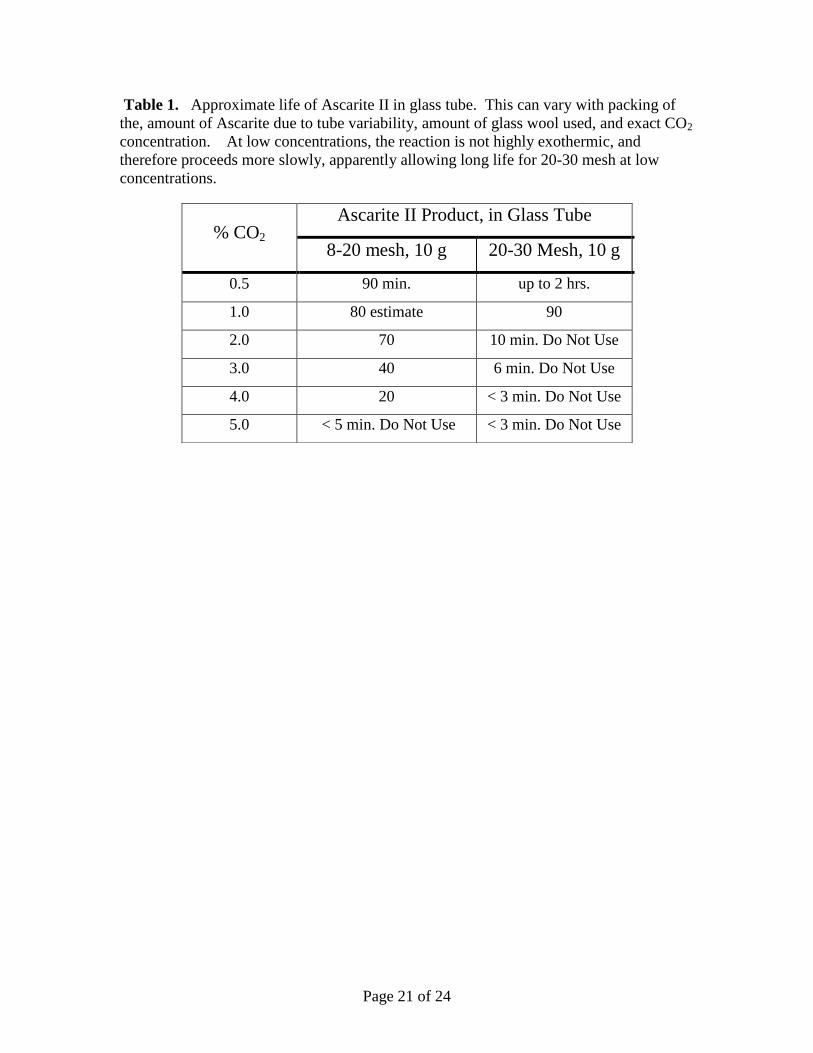
Table 1. Approximate life of Ascarite II in glass tube. This can vary with packing of
the, amount of Ascarite due to tube variability, amount of glass wool used, and exact CO2
concentration. At low concentrations, the reaction is not highly exothermic, and
therefore proceeds more slowly, apparently allowing long life for 20-30 mesh at low
concentrations.
% CO2 Ascarite II Product, in Glass Tube
8-20 mesh, 10 g 20-30 Mesh, 10 g
0.5 90 min. up to 2 hrs.
1.0 80 estimate 90
2.0 70 10 min. Do Not Use
3.0 40 6 min. Do Not Use
4.0 20 < 3 min. Do Not Use
5.0 < 5 min. Do Not Use < 3 min. Do Not Use
Page 22 of 24
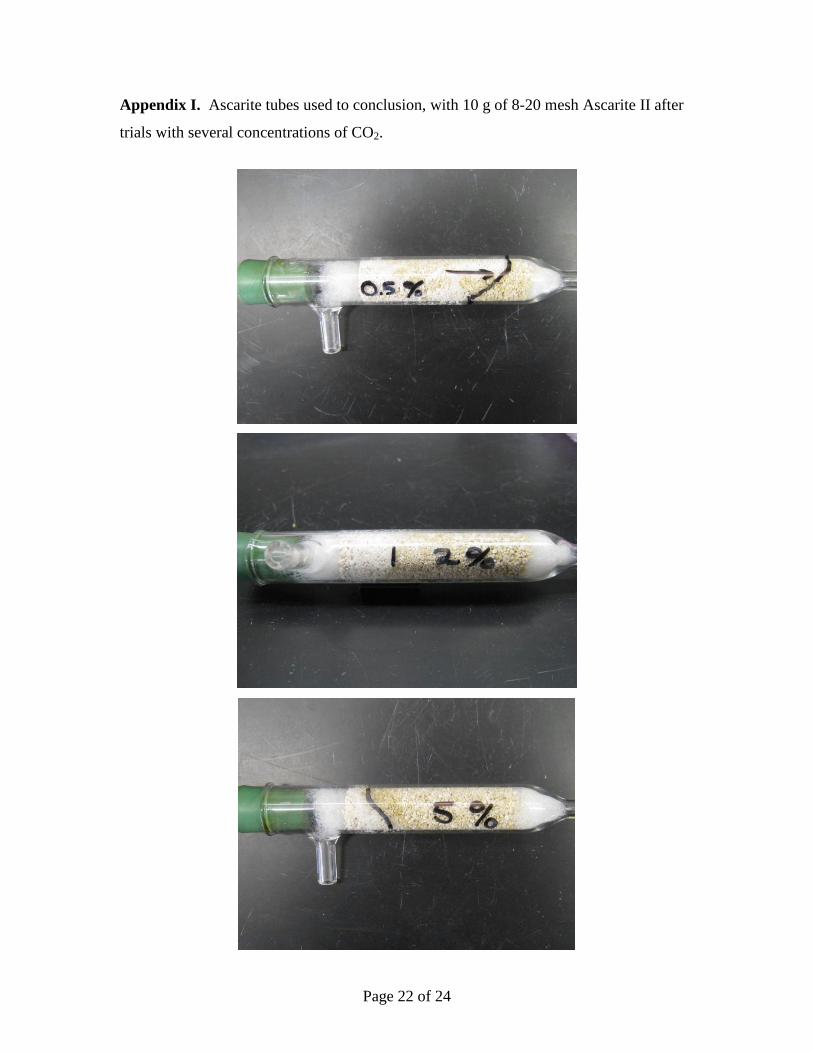
Appendix I. Ascarite tubes used to conclusion, with 10 g of 8-20 mesh Ascarite II after
trials with several concentrations of CO2.
Page 23 of 24
Appendix II.
Equipment used.
1. Fumiscope, with internal drying system, and associated glass Drierite/Ascarite II
tubes. Associated silicone and Tygon® connecting tubing.
Key Chemical Company
13195 49th
Street N Ste. A
Clearwater, FL 33762
727-572-1159
2. Drying tube, Number 26930. Indicating Drierite.
W. A. Hammond Drierite Company, Ltd.
P.O. Box 460
Xenia, OH 45385
937-376-2927
3. Ascarite II. 8-20 Mesh and 20-30 Mesh. Used in glass “Fumiscope tubes” (10 g
capacity) and in polycarbonate tubes (30 g capacity).
Thomas Scientific
P.O. Box 99
Swedesboro, NJ 08085
856-467-2000
4. Qubit CO2 Analyzer, Model S157. With Logger-Pro Software and Go-Link Interface.
0-2000 ppm range.
Qubit Systems Inc.
700 Gardiners Road, Unit 105
Kingston, Ontario
Canada K7M 3X9
613-384-1977
5. Precision air flow meter. Ball type rotameter. Model 7160 PTFE precision valve.
Gilmont Instruments
28W092 Commercial Avenue
Barrington, Illinois 60010
1-800-962-7142

Page 24 of 24
6. Bios Defender 510 precision air flow calibrator.
Bios International Corporation
10 Park Place
Butler, NJ 07405
973-492-8400
7. Dwyer precision digital manometer. Model 477-2.
Dwyer Instruments, Inc.
102 Highway 212
Michigan City, IN46361-0373
219-879-8000
8. Calibration gas. Certified ± 2.0% Carbon dioxide in several concentrations from 0.5
through 5.0 %.
Airgas South, Inc.
5480 Hamilton Blvd.
Theodore, AL 36582
251-653-2530
9. Gas bags, non-sorptive Tedlar®, up to 100 liter capacity.
SKC, Inc.
863 Valley View Road
Eighty Four PA, 15330
724-941-9704
`
- 1 -
MeBr Monitors: Response under cold conditions.
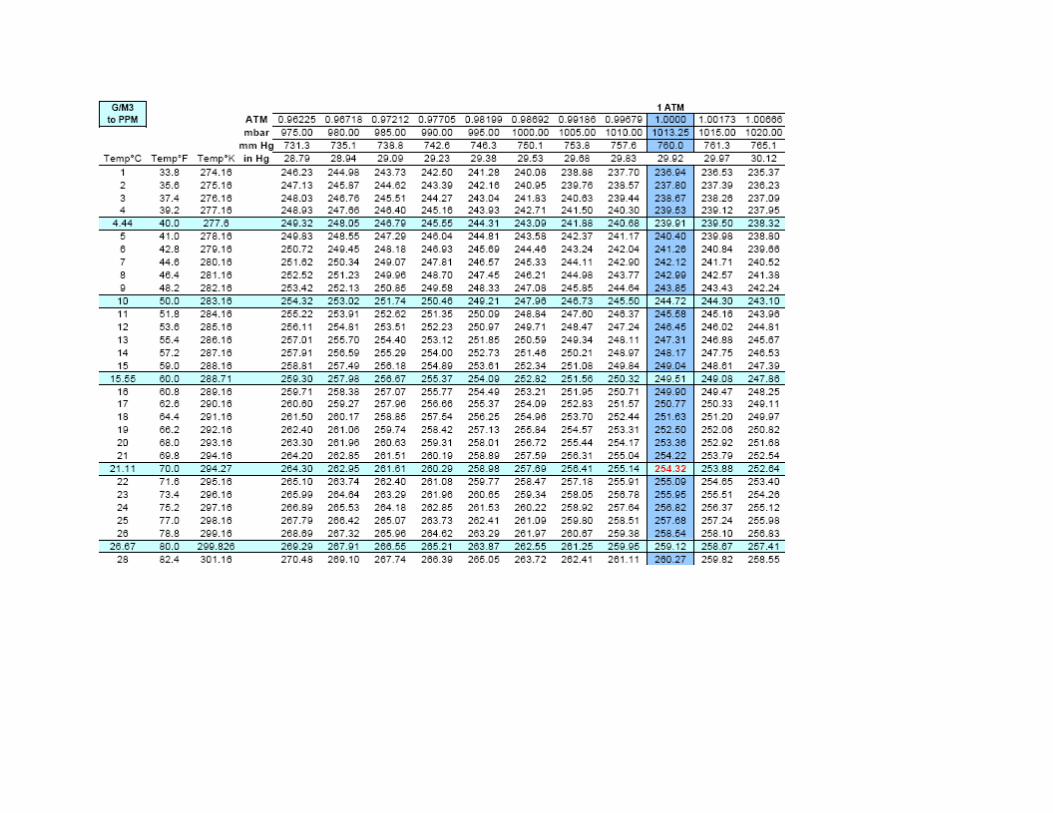
Any gas is subject to changes in atmospheric pressure and temperature. While the ppm
of a mixture remains constant, molecular density (g/m3, mass density) will increase with an
increase in pressure and a decrease in temperature. The magnitude of the change is proportional
to pressure in atmospheres (1 atm. = 760 mm Hg at sea level) and temperature Kelvin (Kelvin =
°C + 273.15).
Two fumigant monitors approved by APHIS for quarantine fumigation were tested with
custom standards prepared with 100% Q-label MeBr or a certified calibration gas of 20,720 ppm
± 1% MeBr. At 760 mm Hg and 23°C, this mixture had a MeBr density of 80.95 (80.14-81.76)
g/m3, as calculated with the ideal gas law where PV = nRT and a gas constant of 0.0820575 liter-
atm/mole/K.
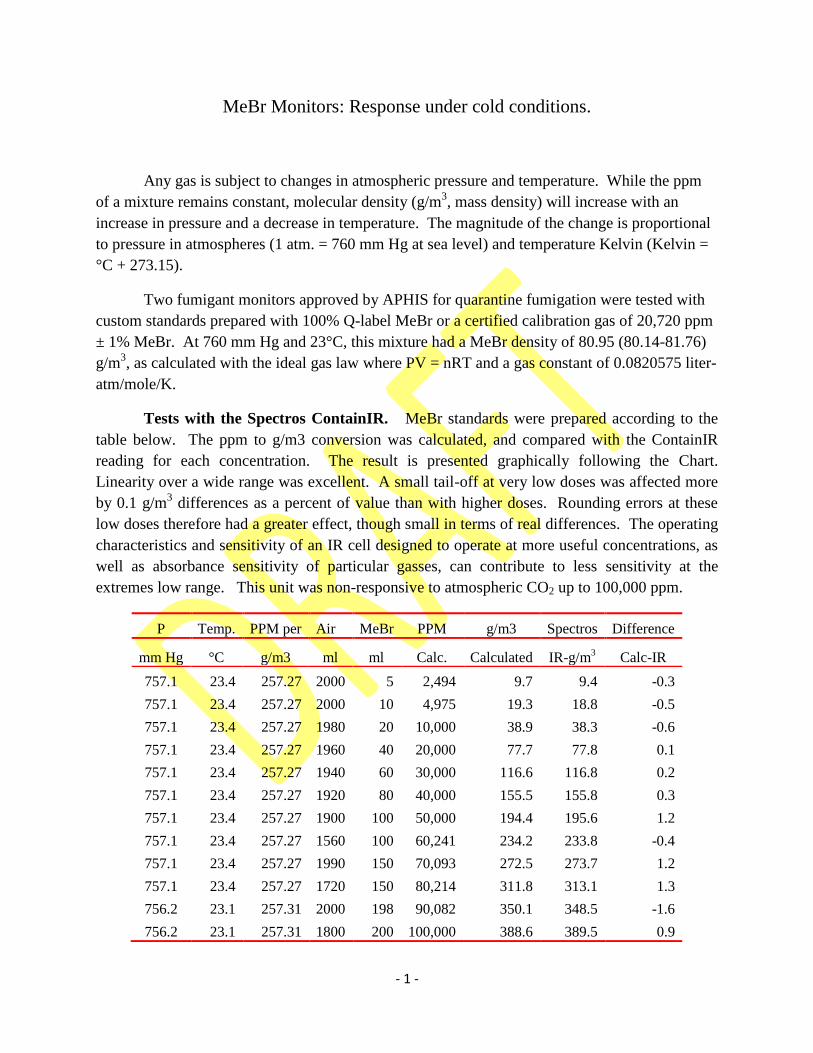
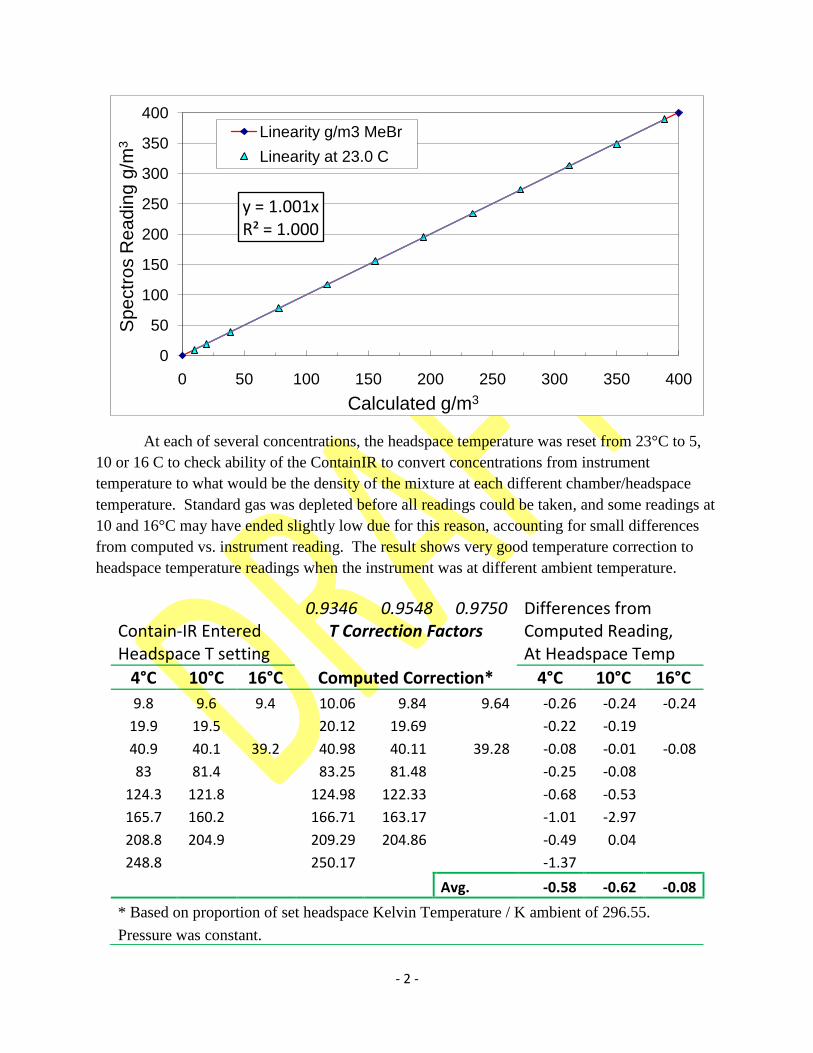
Tests with the Spectros ContainIR. MeBr standards were prepared according to the
table below. The ppm to g/m3 conversion was calculated, and compared with the ContainIR
reading for each concentration. The result is presented graphically following the Chart.
Linearity over a wide range was excellent. A small tail-off at very low doses was affected more
by 0.1 g/m3 differences as a percent of value than with higher doses. Rounding errors at these
low doses therefore had a greater effect, though small in terms of real differences. The operating
characteristics and sensitivity of an IR cell designed to operate at more useful concentrations, as
well as absorbance sensitivity of particular gasses, can contribute to less sensitivity at the
extremes low range. This unit was non-responsive to atmospheric CO2 up to 100,000 ppm.
P Temp. PPM per Air MeBr PPM g/m3 Spectros Difference
mm Hg °C g/m3 ml ml Calc. Calculated IR-g/m3 Calc-IR
757.1 23.4 257.27 2000 5 2,494 9.7 9.4 -0.3
757.1 23.4 257.27 2000 10 4,975 19.3 18.8 -0.5
757.1 23.4 257.27 1980 20 10,000 38.9 38.3 -0.6
757.1 23.4 257.27 1960 40 20,000 77.7 77.8 0.1
757.1 23.4 257.27 1940 60 30,000 116.6 116.8 0.2
757.1 23.4 257.27 1920 80 40,000 155.5 155.8 0.3
757.1 23.4 257.27 1900 100 50,000 194.4 195.6 1.2
757.1 23.4 257.27 1560 100 60,241 234.2 233.8 -0.4
757.1 23.4 257.27 1990 150 70,093 272.5 273.7 1.2
757.1 23.4 257.27 1720 150 80,214 311.8 313.1 1.3
756.2 23.1 257.31 2000 198 90,082 350.1 348.5 -1.6
756.2 23.1 257.31 1800 200 100,000 388.6 389.5 0.9
- 2 -
At each of several concentrations, the headspace temperature was reset from 23°C to 5,
10 or 16 C to check ability of the ContainIR to convert concentrations from instrument
temperature to what would be the density of the mixture at each different chamber/headspace
temperature. Standard gas was depleted before all readings could be taken, and some readings at
10 and 16°C may have ended slightly low due for this reason, accounting for small differences
from computed vs. instrument reading. The result shows very good temperature correction to
headspace temperature readings when the instrument was at different ambient temperature.
y = 1.001xR² = 1.000
0
50
100
150
200
250
300
350
400
0 50 100 150 200 250 300 350 400
Sp
ectr
os R
ea
din
g g
/m3
Calculated g/m3
Linearity g/m3 MeBr
Linearity at 23.0 C
0.9346 0.9548 0.9750 Differences from
Computed Reading, At Headspace Temp
Contain-IR Entered Headspace T setting
T Correction Factors
4°C 10°C 16°C Computed Correction* 4°C 10°C 16°C
9.8 9.6 9.4 10.06 9.84 9.64 -0.26 -0.24 -0.24
19.9 19.5
20.12 19.69
-0.22 -0.19
40.9 40.1 39.2 40.98 40.11 39.28 -0.08 -0.01 -0.08
83 81.4
83.25 81.48
-0.25 -0.08
124.3 121.8
124.98 122.33
-0.68 -0.53
165.7 160.2
166.71 163.17
-1.01 -2.97
208.8 204.9
209.29 204.86
-0.49 0.04
248.8
250.17
-1.37
Avg. -0.58 -0.62 -0.08
* Based on proportion of set headspace Kelvin Temperature / K ambient of 296.55.
Pressure was constant.
- 3 -
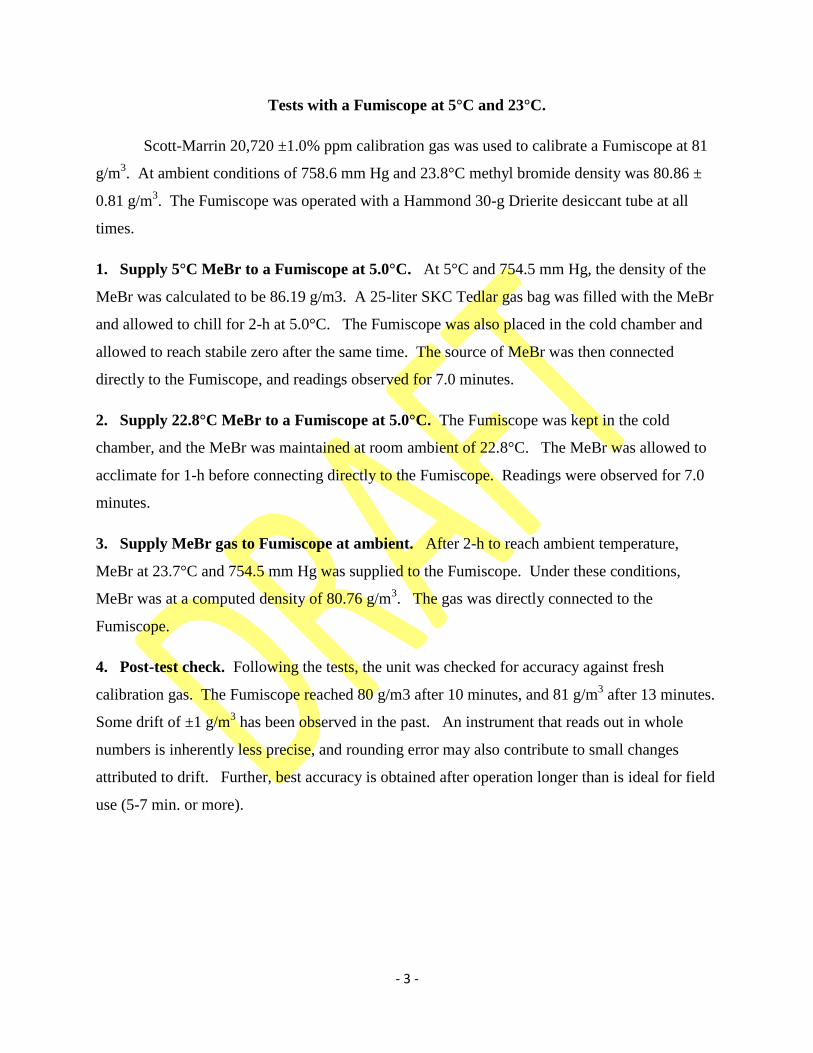
Tests with a Fumiscope at 5°C and 23°C.
Scott-Marrin 20,720 ±1.0% ppm calibration gas was used to calibrate a Fumiscope at 81
g/m3. At ambient conditions of 758.6 mm Hg and 23.8°C methyl bromide density was 80.86 ±
0.81 g/m3. The Fumiscope was operated with a Hammond 30-g Drierite desiccant tube at all
times.
1. Supply 5°C MeBr to a Fumiscope at 5.0°C. At 5°C and 754.5 mm Hg, the density of the
MeBr was calculated to be 86.19 g/m3. A 25-liter SKC Tedlar gas bag was filled with the MeBr
and allowed to chill for 2-h at 5.0°C. The Fumiscope was also placed in the cold chamber and
allowed to reach stabile zero after the same time. The source of MeBr was then connected
directly to the Fumiscope, and readings observed for 7.0 minutes.
2. Supply 22.8°C MeBr to a Fumiscope at 5.0°C. The Fumiscope was kept in the cold
chamber, and the MeBr was maintained at room ambient of 22.8°C. The MeBr was allowed to
acclimate for 1-h before connecting directly to the Fumiscope. Readings were observed for 7.0
minutes.
3. Supply MeBr gas to Fumiscope at ambient. After 2-h to reach ambient temperature,
MeBr at 23.7°C and 754.5 mm Hg was supplied to the Fumiscope. Under these conditions,
MeBr was at a computed density of 80.76 g/m3. The gas was directly connected to the
Fumiscope.
4. Post-test check. Following the tests, the unit was checked for accuracy against fresh
calibration gas. The Fumiscope reached 80 g/m3 after 10 minutes, and 81 g/m3 after 13 minutes.
Some drift of ±1 g/m3 has been observed in the past. An instrument that reads out in whole
numbers is inherently less precise, and rounding error may also contribute to small changes
attributed to drift. Further, best accuracy is obtained after operation longer than is ideal for field
use (5-7 min. or more).
- 4 -
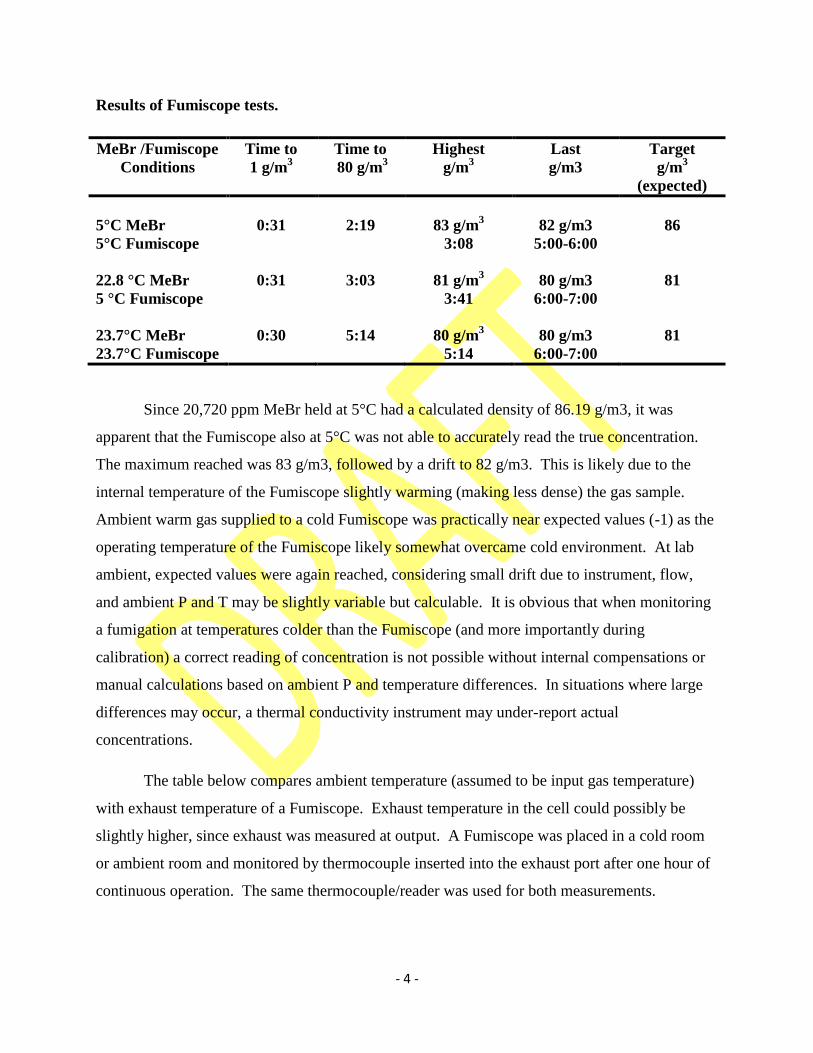
Results of Fumiscope tests.
MeBr /Fumiscope
Conditions
Time to
1 g/m3
Time to
80 g/m3
Highest
g/m3
Last
g/m3
Target
g/m3
(expected)
5°C MeBr
5°C Fumiscope
0:31
2:19
83 g/m3
3:08
82 g/m3
5:00-6:00
86
22.8 °C MeBr
5 °C Fumiscope
0:31 3:03 81 g/m3
3:41
80 g/m3
6:00-7:00
81
23.7°C MeBr
23.7°C Fumiscope
0:30 5:14
80 g/m3
5:14
80 g/m3
6:00-7:00
81
Since 20,720 ppm MeBr held at 5°C had a calculated density of 86.19 g/m3, it was
apparent that the Fumiscope also at 5°C was not able to accurately read the true concentration.
The maximum reached was 83 g/m3, followed by a drift to 82 g/m3. This is likely due to the
internal temperature of the Fumiscope slightly warming (making less dense) the gas sample.
Ambient warm gas supplied to a cold Fumiscope was practically near expected values (-1) as the
operating temperature of the Fumiscope likely somewhat overcame cold environment. At lab
ambient, expected values were again reached, considering small drift due to instrument, flow,
and ambient P and T may be slightly variable but calculable. It is obvious that when monitoring
a fumigation at temperatures colder than the Fumiscope (and more importantly during
calibration) a correct reading of concentration is not possible without internal compensations or
manual calculations based on ambient P and temperature differences. In situations where large
differences may occur, a thermal conductivity instrument may under-report actual
concentrations.
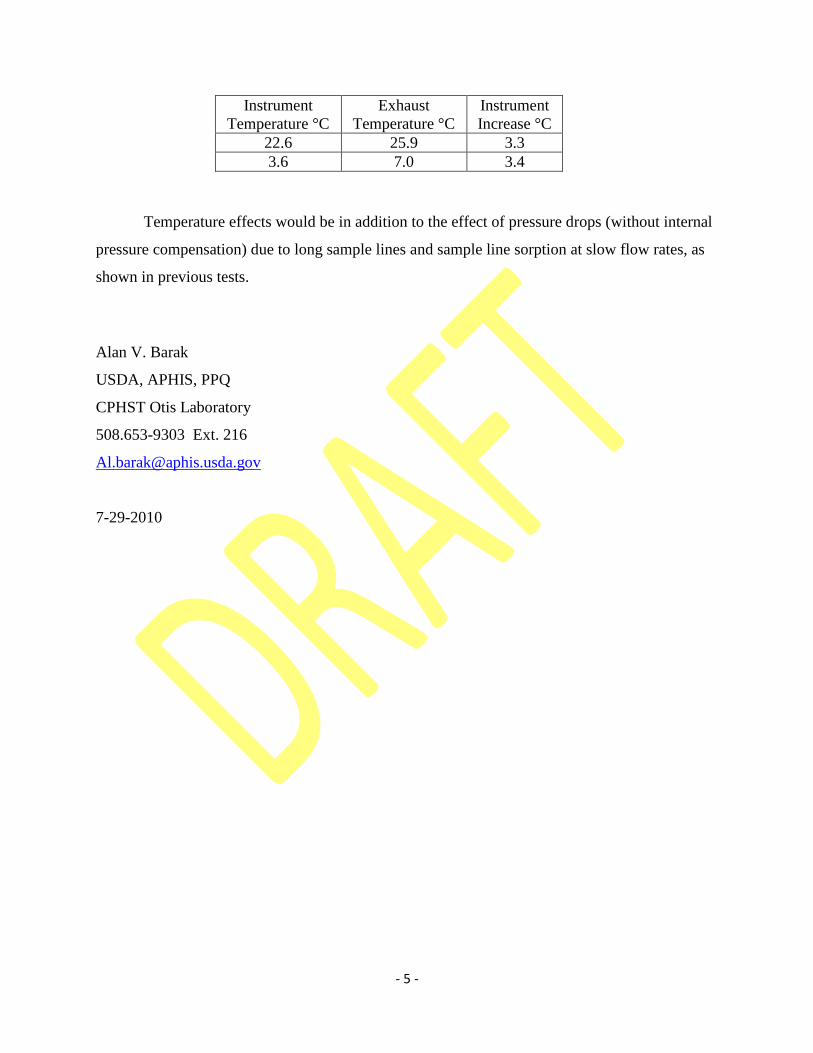
The table below compares ambient temperature (assumed to be input gas temperature)
with exhaust temperature of a Fumiscope. Exhaust temperature in the cell could possibly be
slightly higher, since exhaust was measured at output. A Fumiscope was placed in a cold room
or ambient room and monitored by thermocouple inserted into the exhaust port after one hour of
continuous operation. The same thermocouple/reader was used for both measurements.
- 5 -
Instrument
Temperature °C
Exhaust
Temperature °C
Instrument
Increase °C
22.6 25.9 3.3
3.6 7.0 3.4
Temperature effects would be in addition to the effect of pressure drops (without internal
pressure compensation) due to long sample lines and sample line sorption at slow flow rates, as
shown in previous tests.
Alan V. Barak
USDA, APHIS, PPQ
CPHST Otis Laboratory
508.653-9303 Ext. 216
7-29-2010
Comparisons of Spectros IR Monitor with the Fumiscope or Thermal Conductivity Instrument: Issues and procedures.
Calibration Error.
1. Spectros Calibration. The Spectros unit is factory calibrated, based on molecular concentration. It automatically compensates for
ambient pressure and temperature with built-in programming. Large differences in pressure or temperature during calibration can be
easily be introduced by weather patterns of the day of calibration.
2. Fumiscope Calibration. When calibrating a thermal conductivity (TC) instrument, a known ppm gas is used. This gas will vary in
density (g/m3) with ambient temperature and pressure.
Pressure Effects.
1. Spectros IR. The Spectros has internal pressure compensation. A sample of gas, due to pump pressure, will be different than
ambient headspace pressure, therefore air density. Increasing sample leads require more pump pressure, and therefore affects air
density proportionally.
2. Fumiscope. There is no pressure compensation ability. Measuring pressure of input/output air with 0, 100, 200, 300 feet of 0.25
inch LDPE sample line has indicated that pressure error of 1.5 % can be introduced with 300 feet of tube, and is proportional to tube
length. In real terms, that can easily exceed 1 g/m3 in typical produce fumigation.
Temperature Effects.
1. IR Temperature effects. Spectros monitors compensate for temperature differences between headspace sample and instrument
temperature. As gas warms, it becomes less dense, and will alter a reading by 1.01 % for each 3°C difference. Spectros compensates
for this by prompting for entry of headspace sample temperature.
2. Fumiscope temperature effects. The Fumiscope does not compensate for temperature differences during sampling fumigations at
different temperatures. An example of this is when leads are from a 40°F fumigation headspace, and the unit is in a heated room at
70°F. An error of 2.72 g/m3 in a 48 g/m3 fumigation can be introduced (5.66%).
Competing gasses. 1. Spectros uses IR technology. IR technology is not affected by competing gasses such as CO2 or ethylene. IR technology is specific
to a wavelength that is absorbed by MeBr. There is no need for Ascarite for CO2 or Drierite to remove moisture.
2. With TC technology, air density is increased by CO2. For every 1% of CO2, the Fumiscope will register MeBr as 12 g/m3 higher
than actual levels. Scrubbing this CO2 by means of Ascarite is problematic. Ascarite is very hazardous, expensive, and difficult to
use. It also complicates the re-zeroing process. The accuracy of CO2 scrubbing will be affected by the amount and condition of
scrubber used. Ascarite and Drierite retain residual MeBr, thus making re-zeroing difficult.
Speed of Operation. 1 The Spectros IR unit will sample about 1.5 liters per minute. This allows fast purging of leads. The self-calibrating and purging
cycle allows readings to be taken in about a minute in some situations. Self-purging/re-zeroing is fast, taking about 15 seconds. The
unit is exceptionally very fast if sample lines are purged with auxiliary pump. For example, ½ hour readings will be on time, instead
of 15 or more minutes late.
2. The Fumiscope processes sample air at about 1 SCFH (0.472 L-min.). In addition, it takes a long time to reach true value due to its
slow rate of sample. Several minutes are required for full reading. Re-zeroing time is long, often taking several minutes. Accurate
re-zeroing requires similar length of tubing compared with sample lines to avoid pressure complications, and consistent quality and
quantity of Ascarite or Drierite.
Topic/Feature
Spectros MB-ContainIR® Monitor
Thermal Conductivity Fumiscope®
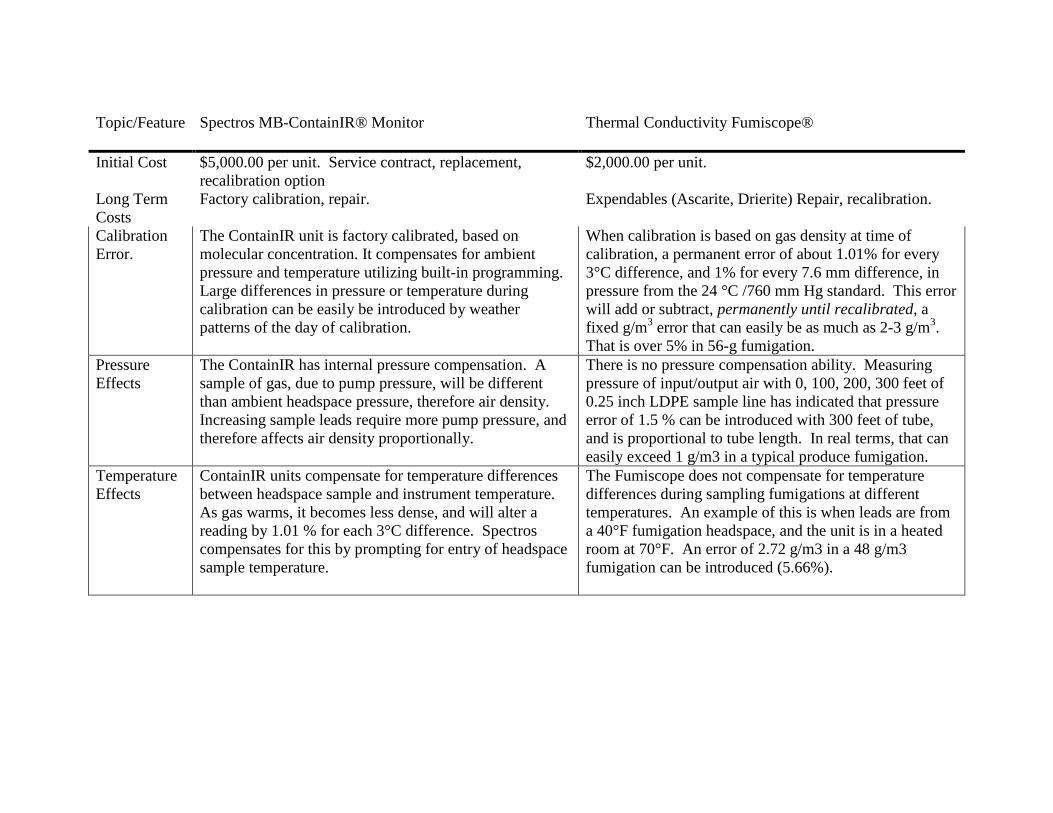
Initial Cost $5,000.00 per unit. Service contract, replacement,
recalibration option
$2,000.00 per unit.
Long Term
Costs
Factory calibration, repair. Expendables (Ascarite, Drierite) Repair, recalibration.
Calibration
Error.
The ContainIR unit is factory calibrated, based on
molecular concentration. It compensates for ambient
pressure and temperature utilizing built-in programming.
Large differences in pressure or temperature during
calibration can be easily be introduced by weather
patterns of the day of calibration.
When calibration is based on gas density at time of
calibration, a permanent error of about 1.01% for every
3°C difference, and 1% for every 7.6 mm difference, in
pressure from the 24 °C /760 mm Hg standard. This error
will add or subtract, permanently until recalibrated, a
fixed g/m3 error that can easily be as much as 2-3 g/m
3.
That is over 5% in 56-g fumigation.
Pressure
Effects
The ContainIR has internal pressure compensation. A
sample of gas, due to pump pressure, will be different
than ambient headspace pressure, therefore air density.
Increasing sample leads require more pump pressure, and
therefore affects air density proportionally.
There is no pressure compensation ability. Measuring
pressure of input/output air with 0, 100, 200, 300 feet of
0.25 inch LDPE sample line has indicated that pressure
error of 1.5 % can be introduced with 300 feet of tube,
and is proportional to tube length. In real terms, that can
easily exceed 1 g/m3 in a typical produce fumigation.
Temperature
Effects
ContainIR units compensate for temperature differences
between headspace sample and instrument temperature.
As gas warms, it becomes less dense, and will alter a
reading by 1.01 % for each 3°C difference. Spectros
compensates for this by prompting for entry of headspace
sample temperature.
The Fumiscope does not compensate for temperature
differences during sampling fumigations at different
temperatures. An example of this is when leads are from
a 40°F fumigation headspace, and the unit is in a heated
room at 70°F. An error of 2.72 g/m3 in a 48 g/m3
fumigation can be introduced (5.66%).
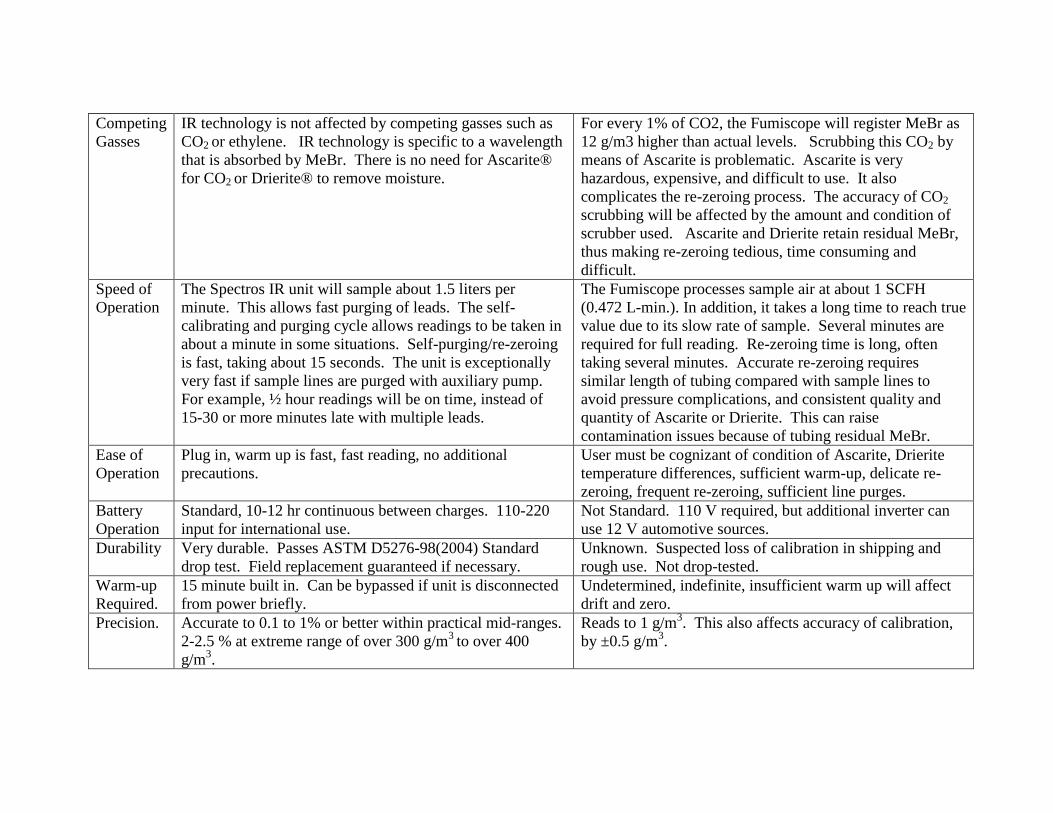
Competing
Gasses
IR technology is not affected by competing gasses such as
CO2 or ethylene. IR technology is specific to a wavelength
that is absorbed by MeBr. There is no need for Ascarite®
for CO2 or Drierite® to remove moisture.
For every 1% of CO2, the Fumiscope will register MeBr as
12 g/m3 higher than actual levels. Scrubbing this CO2 by
means of Ascarite is problematic. Ascarite is very
hazardous, expensive, and difficult to use. It also
complicates the re-zeroing process. The accuracy of CO2
scrubbing will be affected by the amount and condition of
scrubber used. Ascarite and Drierite retain residual MeBr,
thus making re-zeroing tedious, time consuming and
difficult.
Speed of
Operation
The Spectros IR unit will sample about 1.5 liters per
minute. This allows fast purging of leads. The self-
calibrating and purging cycle allows readings to be taken in
about a minute in some situations. Self-purging/re-zeroing
is fast, taking about 15 seconds. The unit is exceptionally
very fast if sample lines are purged with auxiliary pump.
For example, ½ hour readings will be on time, instead of
15-30 or more minutes late with multiple leads.
The Fumiscope processes sample air at about 1 SCFH
(0.472 L-min.). In addition, it takes a long time to reach true
value due to its slow rate of sample. Several minutes are
required for full reading. Re-zeroing time is long, often
taking several minutes. Accurate re-zeroing requires
similar length of tubing compared with sample lines to
avoid pressure complications, and consistent quality and
quantity of Ascarite or Drierite. This can raise
contamination issues because of tubing residual MeBr.
Ease of
Operation
Plug in, warm up is fast, fast reading, no additional
precautions.
User must be cognizant of condition of Ascarite, Drierite
temperature differences, sufficient warm-up, delicate re-
zeroing, frequent re-zeroing, sufficient line purges.
Battery
Operation
Standard, 10-12 hr continuous between charges. 110-220
input for international use.
Not Standard. 110 V required, but additional inverter can
use 12 V automotive sources.
Durability Very durable. Passes ASTM D5276-98(2004) Standard
drop test. Field replacement guaranteed if necessary.
Unknown. Suspected loss of calibration in shipping and
rough use. Not drop-tested.
Warm-up
Required.
15 minute built in. Can be bypassed if unit is disconnected
from power briefly.
Undetermined, indefinite, insufficient warm up will affect
drift and zero.
Precision. Accurate to 0.1 to 1% or better within practical mid-ranges.
2-2.5 % at extreme range of over 300 g/m3
to over 400
g/m3.
Reads to 1 g/m3. This also affects accuracy of calibration,
by ±0.5 g/m3.
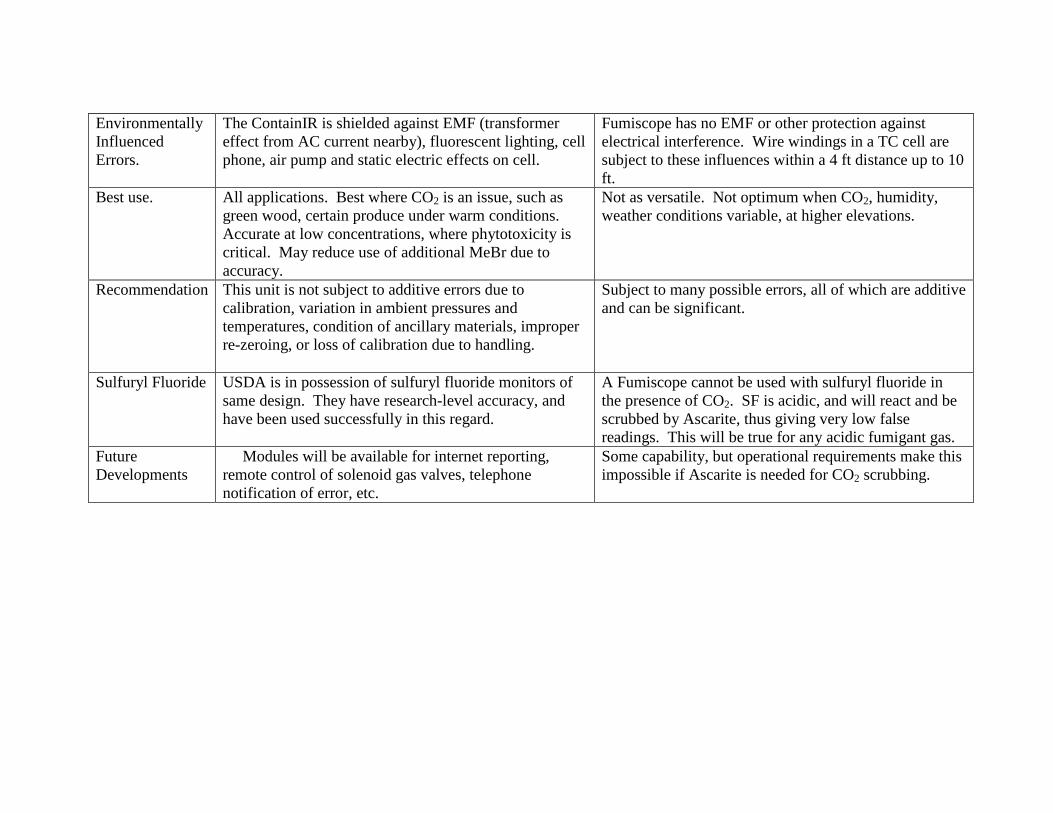
Environmentally
Influenced
Errors.
The ContainIR is shielded against EMF (transformer
effect from AC current nearby), fluorescent lighting, cell
phone, air pump and static electric effects on cell.
Fumiscope has no EMF or other protection against
electrical interference. Wire windings in a TC cell are
subject to these influences within a 4 ft distance up to 10
ft.
Best use. All applications. Best where CO2 is an issue, such as
green wood, certain produce under warm conditions.
Accurate at low concentrations, where phytotoxicity is
critical. May reduce use of additional MeBr due to
accuracy.
Not as versatile. Not optimum when CO2, humidity,
weather conditions variable, at higher elevations.
Recommendation This unit is not subject to additive errors due to
calibration, variation in ambient pressures and
temperatures, condition of ancillary materials, improper
re-zeroing, or loss of calibration due to handling.
Subject to many possible errors, all of which are additive
and can be significant.
Sulfuryl Fluoride USDA is in possession of sulfuryl fluoride monitors of
same design. They have research-level accuracy, and
have been used successfully in this regard.
A Fumiscope cannot be used with sulfuryl fluoride in
the presence of CO2. SF is acidic, and will react and be
scrubbed by Ascarite, thus giving very low false
readings. This will be true for any acidic fumigant gas.
Future
Developments
Modules will be available for internet reporting,
remote control of solenoid gas valves, telephone
notification of error, etc.
Some capability, but operational requirements make this
impossible if Ascarite is needed for CO2 scrubbing.
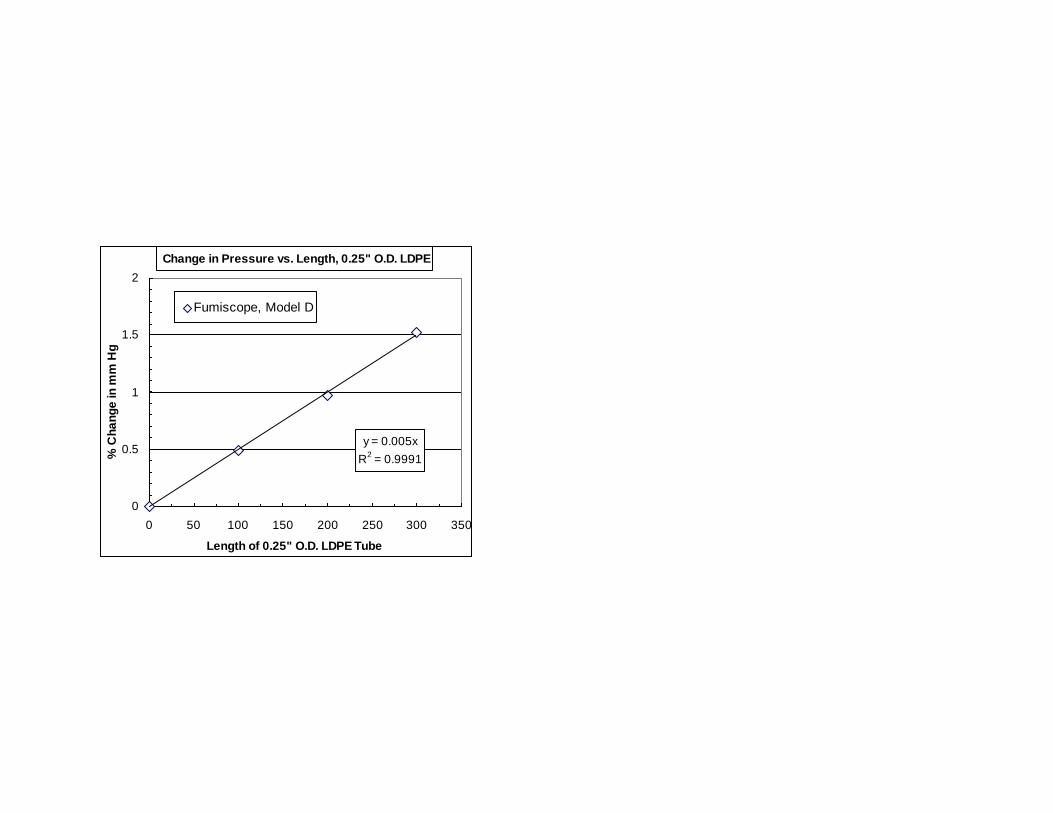
Change in Pressure vs. Length, 0.25" O.D. LDPE
y = 0.005x
R2 = 0.9991
0
0.5
1
1.5
2
0 50 100 150 200 250 300 350
Length of 0.25" O.D. LDPE Tube
% C
ha
ng
e in
mm
Hg
Fumiscope, Model D
Page 1 of 33
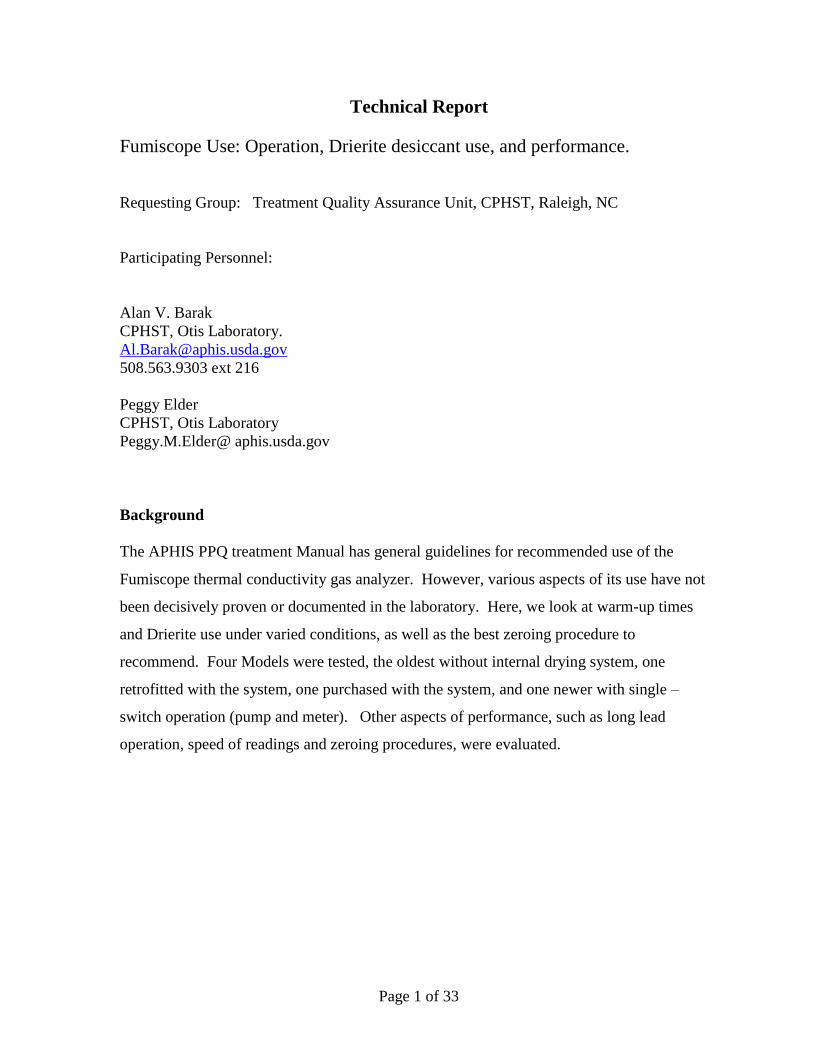
Technical Report
Fumiscope Use: Operation, Drierite desiccant use, and performance.
Requesting Group: Treatment Quality Assurance Unit, CPHST, Raleigh, NC
Participating Personnel:
Alan V. Barak
CPHST, Otis Laboratory.
508.563.9303 ext 216
Peggy Elder
CPHST, Otis Laboratory
Peggy.M.Elder@ aphis.usda.gov
Background
The APHIS PPQ treatment Manual has general guidelines for recommended use of the
Fumiscope thermal conductivity gas analyzer. However, various aspects of its use have not
been decisively proven or documented in the laboratory. Here, we look at warm-up times
and Drierite use under varied conditions, as well as the best zeroing procedure to
recommend. Four Models were tested, the oldest without internal drying system, one
retrofitted with the system, one purchased with the system, and one newer with single –
switch operation (pump and meter). Other aspects of performance, such as long lead
operation, speed of readings and zeroing procedures, were evaluated.

Page 2 of 33
Introduction.
Questions have arisen over the best technique concerning operation of the Fumiscope.
(Key Chemical, Clearwater, FL). This is critical, since APHIS PPQ has a number of
Fumiscope thermal conductivity instruments in use for routine monitoring of quarantine
fumigations with methyl bromide (MeBr). The thermal conductivity instrument measures air
density, and thus is affected by the total volatile load of a given air sample. This may include
compounds such as carbon dioxide (CO2) water vapor, and volatiles evolving form
commodities undergoing fumigation. These compounds may increase in concentration
while a commodity is sealed under a tarpaulin or in a fumigation chamber, as well as in a
cargo container, or in very humid location with water vapor. Further, being an electronic
device, uncertainties exist regarding instrument drift over time and warm-up time required.
Also, the effect of drawing samples through long sample leads is unknown at this time.
Fumiscope instruments tested and referred to in this report:
1. “Old Model”. This was an older Fumiscope without the internal drying system now
standard on newer models. This unit requires the desiccant Drierite® (W. A. Hammond
Drierite Co., Ltd. Xenia, OH) to dry the sample for proper operation. These were equipped
with a glass “Drierite tube” which holds about 10 g of Drierite. This tube has also been used
in conjunction with Ascarite, a CO2 absorbent, to scrub CO2 from the sample stream. In
these tests we used the Hammond 26930 disposable Drierite tube, which held 32 g of 10-20
mesh material. This as with similar units below, are designed to operate and are calibrated at
an air flow rate of 1.0 SCFH, as measured by the integral Dwyer air flow gauge.
2. “Old-Retro”. This was an older Fumiscope as 1, above, retrofitted with the internal
drying system by Key Chemical. The manufacturer claims that this eliminates the need for
Drierite. This has yet to be confirmed by APHIS, and as a result, we continue to recommend
the use of Drierite desiccant.
Page 3 of 33
3. “New-2sw”. This is a newer model, with original internal drying from the factory. It
has, as with 1, 2 above, independent switching of the electronics and pump. It is possible to
warm up this unit without continuous pump operation.
4. “New-1sw”. This unit is similar to 3, above, except that it has a single power switch.
Thus, it cannot warm-up without pump operation.
5. “Spectros”. A ContainIR MeBr monitor from Spectros Instruments, configured for
automatic 20 second purges and one minute measure cycles, with automatic pressure and
temperature compensations.
Methods.
Several scenarios of possible use were tested for warm-up time. They are listed
below. This covers several situations under which Fumiscopes will be used, including long
inactivity, use on consecutive days, using previous zero settings, start up in cold temperature,
and transported in cold weather to use in a warm room or monitoring site. In this report, a
“cold start” refers to a unit turned on at the beginning after a period of non-use of 1-4 d.
Blue-to- pink indicating Drierite desiccant in disposable tubes was used at all times. A
“clean zero” refers to zeroing a Fumiscope with fresh Drierite uncontaminated with MeBr.
Part 1. Tests on warm-up and stability.
1. Warm-up from cold start at 23.1° using previous zero, not used several months.
2. Warm-up form cold start at 23.1, previous zero, and turned off 1-day.
3. Warm-up form cold start at 23.1, previous zero, and turned off 4-days.
4. Old model, in 4-h warmed up condition with increased RH, a Drierite test.
5. Warm up from cold start at 9.8°C, only older units re-zeroed, turned off 1-day.
6. Repeat cold start at 9.8°C, previous zero, turned off 1-day.
7. Warm-up of cold (9.8°C) units moved to 23.2°C, turned off 1-day.
8. Warm up electronics 30 minute, and then turn on pump (2-switch models).
9. Supply 95% RH air to warmed-up, stable Old Model over 3.5 hours.
Page 4 of 33
10. Influence of a long leads (300 ft) on zeroing and stability.
Part 2. Tests with methyl bromide and long leads.
11. Performance of Fumiscope with short or long leads and Methyl Bromide.
12. Performance of Spectros and Fumiscope with sequential sampling.
13. Collection of exhaust gas to cross-check lower levels.
Part 1. Tests on warm-up and stability.
1. A 23.1°C cold start warm-up, no previous zero. All four units have been in
laboratory storage and have not been used within the last month. All units were set up for
simultaneous operation with an individually switched power outlet. All units were operated
with the in-line Drierite column (Hammond, OEM #26930) that contained about 32 g 10-20
mesh Drierite, and which was allowed to be used in a vertical position (Figure 8). All units
have been previously calibrated with 14,610 ppm MeBr and the span set to 56 g/m3 MeBr at
23°C and a flow rate of 1.0 SCFH (472 ml/min) as indicated on the unit’s flow gauge. Room
temperature was 23.1°C ± 0.65 SD, and RH was 45.1% ± 2.18 as measured by a HOBO data
logger (Onset Computer, Pocasset, MA).
After all units were in position and supplied with fresh Drierite tubes (regardless of
any internal drying system) the units were switched on, immediately set to “zero”, and
allowed to run continually at the recommended flow rate. The reading was recorded at one
minute intervals or as needed. After 18 minutes, when the unit’s display became more stable,
the units were re-zeroed. After recording changes, the units were again re-zeroed after 25
minutes. No further zeroing was done, and the test was terminated after 50 minutes due to
apparent stability in readout after all units operated for 10-20 minutes without change. The
result is shown in Figure 1. Flow rates of all four units were measured during operation, and
were determined to be as follows with Fumiscope air flow gauge set at 1.0 SCFH:
Old Model: 444 ml/min.
Page 5 of 33
Old-Retro: 422 ml/min.
New-2sw: 518 ml/min.
New-1sw: 437 ml/min.
Fumiscope readings continually increased for, startup values of 0 to 6-12 after 18
minutes. Following re-zero, the readings again gradually climbed to 1-4, and were re-zeroed.
Readings again climbed to 1-5 over the next several minutes, finally becoming more stable
after 30-40 minutes total. The span of changes during warm-up was between -3 to +12 on
the MeBr scale, more if changes after re-zero were included. Drierite was 1/3 used after 45
minutes. New full tubes were attached, with no changes observed.
Results varied between instruments. The Old Model (requires external Drierite)
warmed up with least displacement and in less time. The New models had the most
displacement and took longer to stabilize. It appears a 30-40 min warm-up was required to
become reasonably stable. By that it is meant the time required for a reliable reading to be
taken was passed without changes in reading of more than 1 g/m3 or about 10 minutes.
2. A 23.1°C cold start warm-up with previous zero. The four units as describe above
were again cold-started the next day, while retaining the zero position of the zero control
from the previous tests. After 10 and again 32 minutes the units were all re-zeroed. After
10-18 additional minutes of stable readings, the Drierite tubes were removed, the flow
slightly readjusted to 1.0 SCFH. Readings were monitored for 6 minutes during which
substantial changes were noted. At that time the Drierite tubes were replaced, and readings
monitored an additional 15 minutes until no changes were noted for several minutes. The
results are shown in Figure 2.
The units initially read -3 to -9 g/m3 at startup. Readings gradually drifted upwards
for 30 minutes, though less so for an additional 18 minutes. Removing the Drierite tube
(about 40% used) caused the Old Model to drop drastically to -13 g/m3. The other units
dropped as well by about -5, even though these units had the internal drying system.
Drierite is essential in the Old Model, which was most sensitive to humidity, and probably
improves stability of the newer Fumiscopes with internal drying systems. Water vapor (m.w.
18) being less dense than N2 or air (m.w. 28) reduces air density. After reinstalling the

Page 6 of 33
Drierite tubes, the units again drifted upward significantly, though the Old Model had further
to recover, it also showed less drift after the initial recovery. Though difficult to quantify, it
would seem good practice to avoid letting the units run without a Drierite tube attached at all
times.
3. A 23.1°C cold start after 4-d unused. After allowing all units to remain unused for 4-d,
the warm-up test was repeated. This test was allowed to run continually for 3.5 h without re-
zeroing. The test started with units at the previous zero setting. The test was terminated after
5 hours. After 3 hours of operation, the Drierite tube was about 53% consumed (pink) and
was measured every hour for consumption until the end. The data is presented in Figs. 3a, b.
At startup, the units read from -5 to -10, the Old Model again appeared less affected.
Rapid increase took place over the first 15 minutes, with rate of change decreasing, but still
high, over the next 30 minutes. By 60 min greater stability was achieved, and readings were
taken at 5-min intervals. After 3 hours of relative stability (changes of 1 g/m3 increments
every 20-30 min) the units were re-zeroed (the Old Model was again most stable and
removed for another test). After this time, the units renewed the gradual upward drift by 1
g/m3
but still had longer periods of 10-20 minutes of no change. After about the 50-60-min
mark, stable times were long enough to allow consecutive readings without re-zeroing the
Fumiscope, since changes were slight, and within operating sensitivity of the units. The Old
Model performed the best. Measuring the Drierite indicated no effect on the baseline zero,
even though about 70% of the tubes were consumed (Figure 9).
4. A 23°C warm start with stable Old Model with increased R.H. After 4-h of
continuous operation, the Old Model was connected to higher humidity source made by
putting an aquarium air stone in a 2-L flask with 1.8-L of distilled water. It was not possible
to accurately measure this RH. But, it will be intuitively a higher RH than room air at 45%.
The Old Model was run continually for 2-h, with fresh Drierite. The consumed Drierite was
estimated periodically by measuring the proportion of pink/blue 32 g Drierite tube. Since
this unit was in operation 4-h previous, the warm-up drift was negligible over 2-h, shifting up
1 g/m3 after 22 min, and remaining there for the duration. After 2-h, the Drierite was
Page 7 of 33
removed and the effect noted. With this degree of stability, multiple readings can be taken
without re-zero. Results are shown in Figure 5.
The condition of the Drierite indicated that in a humid environment, 40% was used,
with no apparent effect on the Fumiscope. Any breakthrough or low efficiency should be
indicated by a large drop from the zero, as indicated when the Drierite was removed. The
effect was even less when Drierite was removed form units with internal drying, as would be
expected. Still, it would be advisable to use Drierite tubes at all times. When Drierite is
extensively used, the primary pink front moves roughly equally through a vertical column.
There was no sharp demarcation line between pink and blue.
5. A 9.8°C cold start, only older units re-zeroed, turned off 1-day. In this test, only the
Old and Old-Retro units were re-zeroed at startup, the “New” units were kept at previous
zero. The units were kept overnight in a refrigerated cabinet, where all tests took place
(Figure 11)
Results are shown in Figure 5. On turn-on, the older units read out deeply negative
g/m3. After 25 minutes of operation drift was surprisingly small from turn-on values,
compared with the earlier tests, but still drifted upward as much as 2 g/m3. All units were
re-zeroed after 25 minutes. After this point, units remained within 1 g/m3 of zero value.
After two hours, the Ascarite was about 50% consumed, with no visible effect on operation.
The units were turned off until the next test 1-Day later.
6. Repeat cold start at 9.8°C, previous zero, turned off 1-day. The 9.8°C start-up was
repeated, with units left at zero from the previous 9.8°C test. Units were not re-zeroed at
startup, and had fresh Drierite tubes. The result is shown in Figure 6. Units read -2 to -4
g/m3 at startup, with immediate upward drift over the first 15-35 minutes, after which time
good stability (0 to + 1 g/m3 over 25-120 minutes) prevailed. Following this, the units were
turned off and allowed to remain on the cold cabinet overnight for the next test. Drierite
consumption was about 50%. However there was a secondary drying front observed, as a
very pale coloration for the first two cm at the input. This is shown in Figure 10, and
indicated heavy use. No “plugging” effect was seen, as the tube was easily emptied.
Page 8 of 33
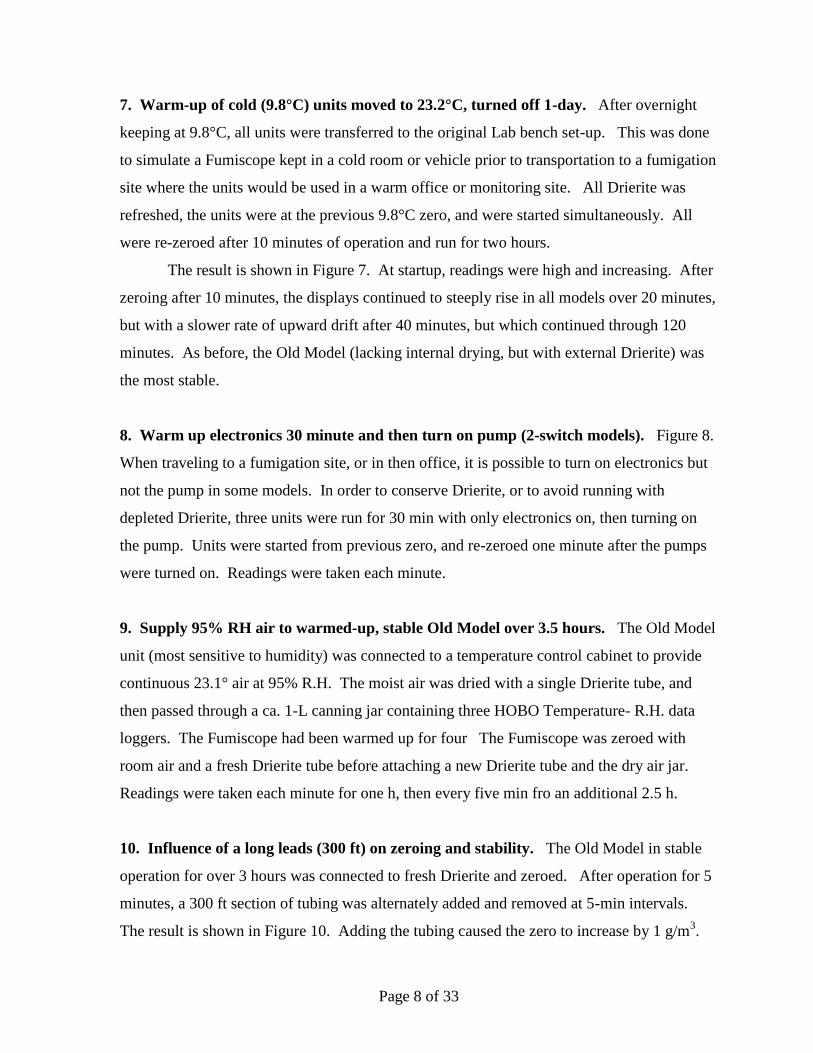
7. Warm-up of cold (9.8°C) units moved to 23.2°C, turned off 1-day. After overnight
keeping at 9.8°C, all units were transferred to the original Lab bench set-up. This was done
to simulate a Fumiscope kept in a cold room or vehicle prior to transportation to a fumigation
site where the units would be used in a warm office or monitoring site. All Drierite was
refreshed, the units were at the previous 9.8°C zero, and were started simultaneously. All
were re-zeroed after 10 minutes of operation and run for two hours.
The result is shown in Figure 7. At startup, readings were high and increasing. After
zeroing after 10 minutes, the displays continued to steeply rise in all models over 20 minutes,
but with a slower rate of upward drift after 40 minutes, but which continued through 120
minutes. As before, the Old Model (lacking internal drying, but with external Drierite) was
the most stable.
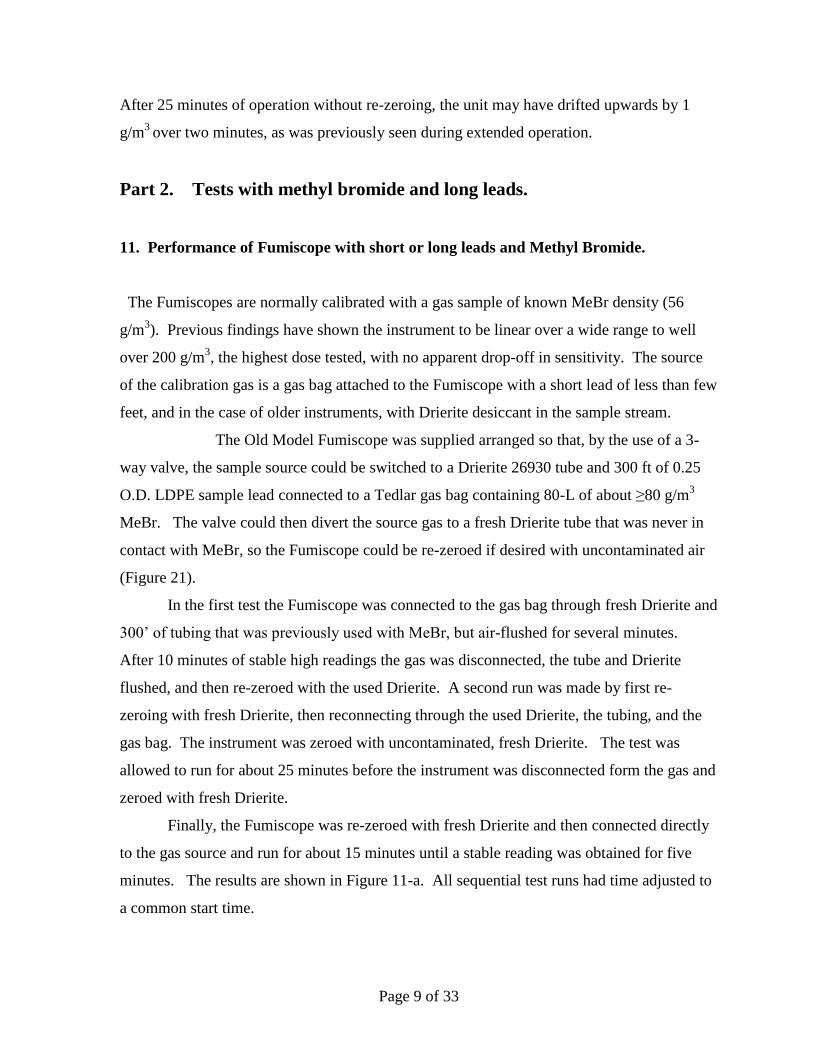
8. Warm up electronics 30 minute and then turn on pump (2-switch models). Figure 8.
When traveling to a fumigation site, or in then office, it is possible to turn on electronics but
not the pump in some models. In order to conserve Drierite, or to avoid running with
depleted Drierite, three units were run for 30 min with only electronics on, then turning on
the pump. Units were started from previous zero, and re-zeroed one minute after the pumps
were turned on. Readings were taken each minute.
9. Supply 95% RH air to warmed-up, stable Old Model over 3.5 hours. The Old Model
unit (most sensitive to humidity) was connected to a temperature control cabinet to provide
continuous 23.1° air at 95% R.H. The moist air was dried with a single Drierite tube, and
then passed through a ca. 1-L canning jar containing three HOBO Temperature- R.H. data
loggers. The Fumiscope had been warmed up for four The Fumiscope was zeroed with
room air and a fresh Drierite tube before attaching a new Drierite tube and the dry air jar.
Readings were taken each minute for one h, then every five min fro an additional 2.5 h.
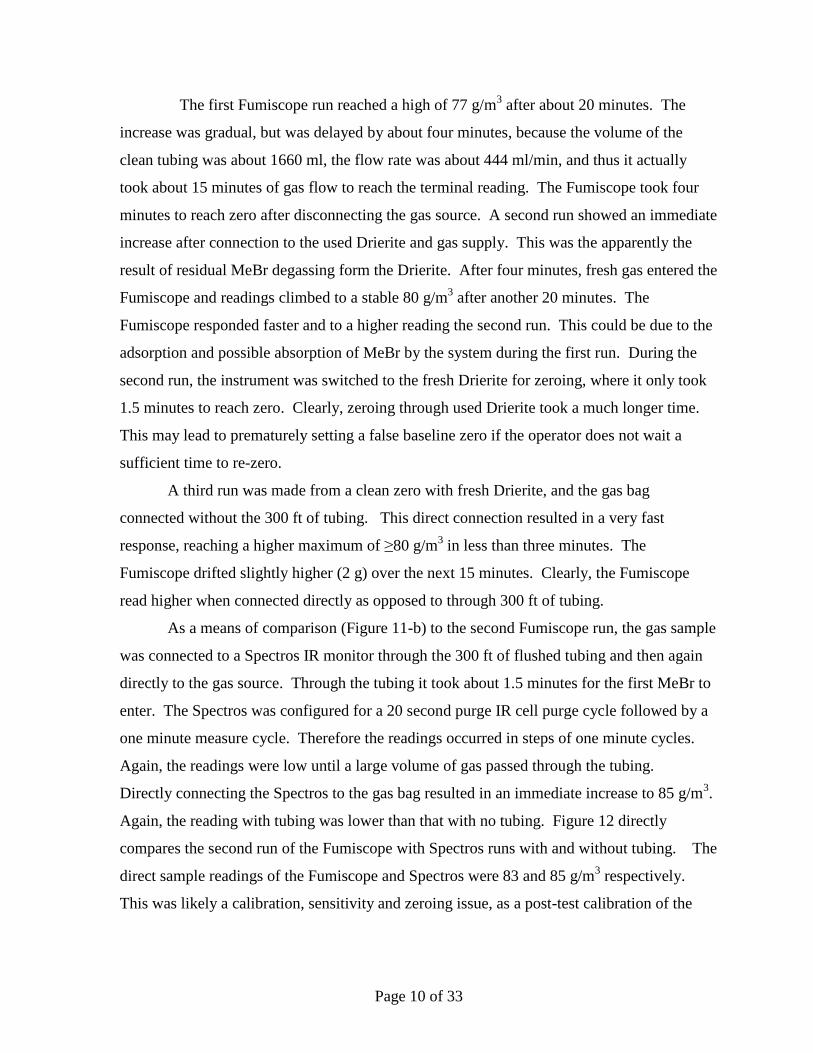
10. Influence of a long leads (300 ft) on zeroing and stability. The Old Model in stable
operation for over 3 hours was connected to fresh Drierite and zeroed. After operation for 5
minutes, a 300 ft section of tubing was alternately added and removed at 5-min intervals.
The result is shown in Figure 10. Adding the tubing caused the zero to increase by 1 g/m3.
Page 9 of 33
After 25 minutes of operation without re-zeroing, the unit may have drifted upwards by 1
g/m3
over two minutes, as was previously seen during extended operation.
Part 2. Tests with methyl bromide and long leads.
11. Performance of Fumiscope with short or long leads and Methyl Bromide.
The Fumiscopes are normally calibrated with a gas sample of known MeBr density (56
g/m3). Previous findings have shown the instrument to be linear over a wide range to well
over 200 g/m3, the highest dose tested, with no apparent drop-off in sensitivity. The source
of the calibration gas is a gas bag attached to the Fumiscope with a short lead of less than few
feet, and in the case of older instruments, with Drierite desiccant in the sample stream.
The Old Model Fumiscope was supplied arranged so that, by the use of a 3-
way valve, the sample source could be switched to a Drierite 26930 tube and 300 ft of 0.25
O.D. LDPE sample lead connected to a Tedlar gas bag containing 80-L of about ≥80 g/m3
MeBr. The valve could then divert the source gas to a fresh Drierite tube that was never in
contact with MeBr, so the Fumiscope could be re-zeroed if desired with uncontaminated air
(Figure 21).
In the first test the Fumiscope was connected to the gas bag through fresh Drierite and
300’ of tubing that was previously used with MeBr, but air-flushed for several minutes.
After 10 minutes of stable high readings the gas was disconnected, the tube and Drierite
flushed, and then re-zeroed with the used Drierite. A second run was made by first re-
zeroing with fresh Drierite, then reconnecting through the used Drierite, the tubing, and the
gas bag. The instrument was zeroed with uncontaminated, fresh Drierite. The test was
allowed to run for about 25 minutes before the instrument was disconnected form the gas and
zeroed with fresh Drierite.
Finally, the Fumiscope was re-zeroed with fresh Drierite and then connected directly
to the gas source and run for about 15 minutes until a stable reading was obtained for five
minutes. The results are shown in Figure 11-a. All sequential test runs had time adjusted to
a common start time.
Page 10 of 33
The first Fumiscope run reached a high of 77 g/m3 after about 20 minutes. The
increase was gradual, but was delayed by about four minutes, because the volume of the
clean tubing was about 1660 ml, the flow rate was about 444 ml/min, and thus it actually
took about 15 minutes of gas flow to reach the terminal reading. The Fumiscope took four
minutes to reach zero after disconnecting the gas source. A second run showed an immediate
increase after connection to the used Drierite and gas supply. This was the apparently the
result of residual MeBr degassing form the Drierite. After four minutes, fresh gas entered the
Fumiscope and readings climbed to a stable 80 g/m3 after another 20 minutes. The
Fumiscope responded faster and to a higher reading the second run. This could be due to the
adsorption and possible absorption of MeBr by the system during the first run. During the
second run, the instrument was switched to the fresh Drierite for zeroing, where it only took
1.5 minutes to reach zero. Clearly, zeroing through used Drierite took a much longer time.
This may lead to prematurely setting a false baseline zero if the operator does not wait a
sufficient time to re-zero.
A third run was made from a clean zero with fresh Drierite, and the gas bag
connected without the 300 ft of tubing. This direct connection resulted in a very fast
response, reaching a higher maximum of ≥80 g/m3 in less than three minutes. The
Fumiscope drifted slightly higher (2 g) over the next 15 minutes. Clearly, the Fumiscope
read higher when connected directly as opposed to through 300 ft of tubing.
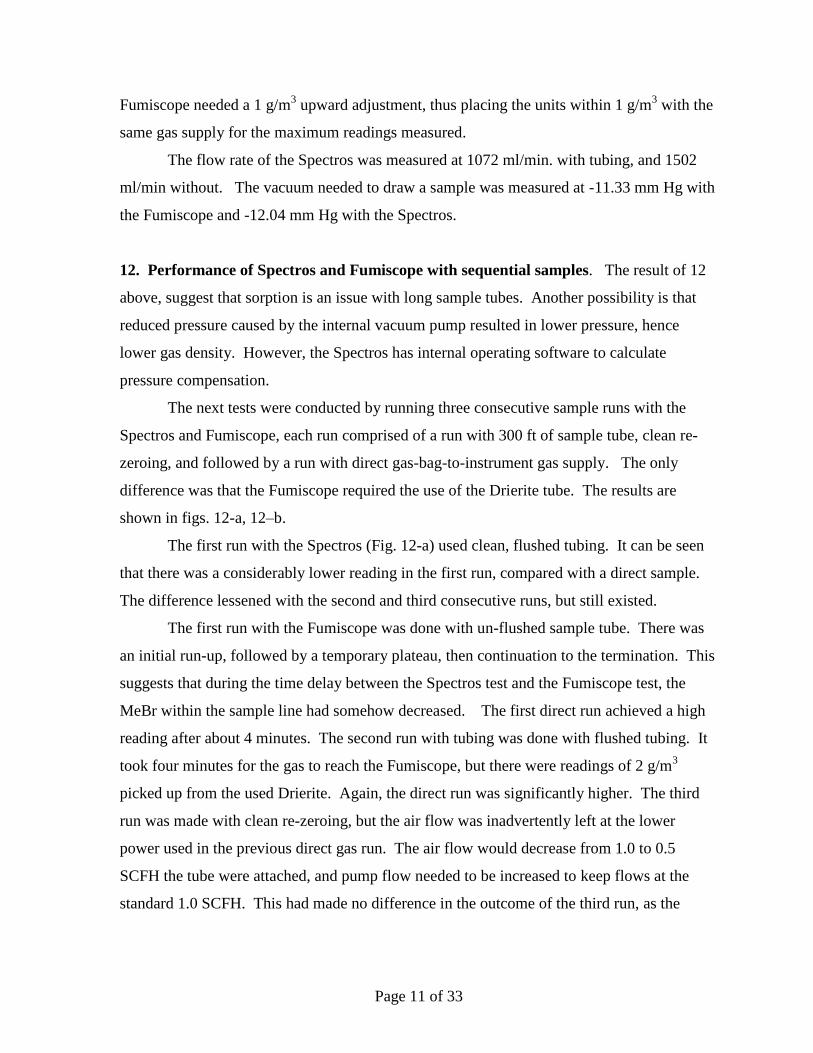
As a means of comparison (Figure 11-b) to the second Fumiscope run, the gas sample
was connected to a Spectros IR monitor through the 300 ft of flushed tubing and then again
directly to the gas source. Through the tubing it took about 1.5 minutes for the first MeBr to
enter. The Spectros was configured for a 20 second purge IR cell purge cycle followed by a
one minute measure cycle. Therefore the readings occurred in steps of one minute cycles.
Again, the readings were low until a large volume of gas passed through the tubing.
Directly connecting the Spectros to the gas bag resulted in an immediate increase to 85 g/m3.
Again, the reading with tubing was lower than that with no tubing. Figure 12 directly
compares the second run of the Fumiscope with Spectros runs with and without tubing. The
direct sample readings of the Fumiscope and Spectros were 83 and 85 g/m3 respectively.
This was likely a calibration, sensitivity and zeroing issue, as a post-test calibration of the
Page 11 of 33
Fumiscope needed a 1 g/m3 upward adjustment, thus placing the units within 1 g/m
3 with the
same gas supply for the maximum readings measured.
The flow rate of the Spectros was measured at 1072 ml/min. with tubing, and 1502
ml/min without. The vacuum needed to draw a sample was measured at -11.33 mm Hg with
the Fumiscope and -12.04 mm Hg with the Spectros.
12. Performance of Spectros and Fumiscope with sequential samples. The result of 12
above, suggest that sorption is an issue with long sample tubes. Another possibility is that
reduced pressure caused by the internal vacuum pump resulted in lower pressure, hence
lower gas density. However, the Spectros has internal operating software to calculate
pressure compensation.
The next tests were conducted by running three consecutive sample runs with the
Spectros and Fumiscope, each run comprised of a run with 300 ft of sample tube, clean re-
zeroing, and followed by a run with direct gas-bag-to-instrument gas supply. The only
difference was that the Fumiscope required the use of the Drierite tube. The results are
shown in figs. 12-a, 12–b.
The first run with the Spectros (Fig. 12-a) used clean, flushed tubing. It can be seen
that there was a considerably lower reading in the first run, compared with a direct sample.
The difference lessened with the second and third consecutive runs, but still existed.
The first run with the Fumiscope was done with un-flushed sample tube. There was
an initial run-up, followed by a temporary plateau, then continuation to the termination. This
suggests that during the time delay between the Spectros test and the Fumiscope test, the
MeBr within the sample line had somehow decreased. The first direct run achieved a high
reading after about 4 minutes. The second run with tubing was done with flushed tubing. It
took four minutes for the gas to reach the Fumiscope, but there were readings of 2 g/m3
picked up from the used Drierite. Again, the direct run was significantly higher. The third
run was made with clean re-zeroing, but the air flow was inadvertently left at the lower
power used in the previous direct gas run. The air flow would decrease from 1.0 to 0.5
SCFH the tube were attached, and pump flow needed to be increased to keep flows at the
standard 1.0 SCFH. This had made no difference in the outcome of the third run, as the
Page 12 of 33
MeBr reading increased slightly (due to less sorption?) but the direct sample still remained
higher.
13. Collection of exhaust gas to cross-check lower levels. It was speculated that if the
exhaust gas could be collected and re-fed to the instruments, we could see that the decrease
was not due to vacuum influences, but to MeBr lost to sorption of dissipation through the
tube wall. To test this, we collected, in a 3-L Tedlar bag, the exhaust from both instruments
during a terminal period of stability when both units were at maximum readout for the three
sequential replicates as described in 12 (above) both with 300 ft of tube and again direct into
the instrument. The readout from the immediate reinfusion of the collected gas was time-
adjusted so as to appear simultaneous with the original reading. The results for the Spectros
and Fumiscope are shown in Figs. 13-a, 13-b, respectively.
The first Spectros (13-a) run was with a clean, flushed sample line and fresh Drierite.
Re-infused gas read lower than the original. If the first observed discrepancies were due to
pressure changes, we would have expected readings of ≥80 g/m3 or above. This was not the
case. The direct input reading and collection for the Spectros also had a first low replicate,
due to the fresh Drierite, though readings increased after multiple runs, but still were
different. This suggests sorption has decreased during conditioning of the sample tube.
With the Fumiscope (13-b), the result was similar. The tube was not flushed for the
first replicate, and this showed as an early plateau in the reading. This would indicate that
during set-up time, the tube lost MeBr. The second replicate had initial low readings due to
degassing form the contaminated Drierite, again pointing to the need for fresh Drierite during
re-zeroing. A short plateau for the third replicate was described above (12.) caused by failure
to increase air flow between previous direct reading after adding the 300 ft of tubing. This
was remedied and the replicate continued with no obvious fault, since recovery during the
peak was the objective.
Subsequent replicates had higher readings, but the discrepancy did not disappear.
Gas loss from the tubing due to sorption (both adsorption and possibly absorption) is the
probable cause.
Conclusions and Recommendations.
Page 13 of 33
1. All units tested required warm-up times longer than 10 minutes to reach good stability.
Good stability should be defined as a stable zero with drift not to exceed 1 g/m3 over an
arbitrary period, perhaps 10 minutes. This allows a useful reading to be taken without
introducing a false baseline zero. Warm-up may be as long as ½ hour.
2. The use of Drierite should be mandatory at all times. Units should not be run without
Drierite. It might be prudent to store the Fumiscopes with one fresh (mostly blue) Drierite
tube attached and connected at both input in exit. It would be recommended avoid large
temperature differences between storage and use at a fumigation site.
3. The 15-cm Drierite tubes (Hammond #26930) have a long life and can be used until at
least ¾ used up. There was no indication of failure to that point.
4. It is possible to reduce pre-use warm-up time if units with dual switching can be warmed
up in the meter mode for a half hour before using the pump, which then requires an
additional 10 minute after the pump is turned on.
5. There is a conditioning period required when using fresh Drierite as the readings will be
lower until the Drierite has fully absorbed the sample MeBr. Corollary to this, Drierite
degasses when no gas source is connected.
6. Due to 5 (above) it is essential that Fumiscopes be zeroed with fresh Drierite not exposed
to MeBr. Unused Drierite zeros much faster. To not do this requires a much longer zeroing
time, and may lead to setting a false lower baseline if adequate time is not allowed. This also
slows the entire process of getting timely readings.
7. Adding a significant amount of tubing (here 300 ft) after zeroing may change the zero
upward, when reconnecting to sample lines, though the change was 1 g/m3, longer leads
might have greater effect.
Page 14 of 33
8. The initial use of sample leads (and Drierite) not fully sorbed with MeBr will result in low
readings. This may take a long time to come to equilibrium. It is essential to purge long
leads continually, and not allow leads to remain idle while monitoring multiple leads if
timely readings are needed.
9. The problems with long leads applies to both the Fumiscope and Spectros monitors,
though much less so than with the Spectros, due to its much faster flow rates.
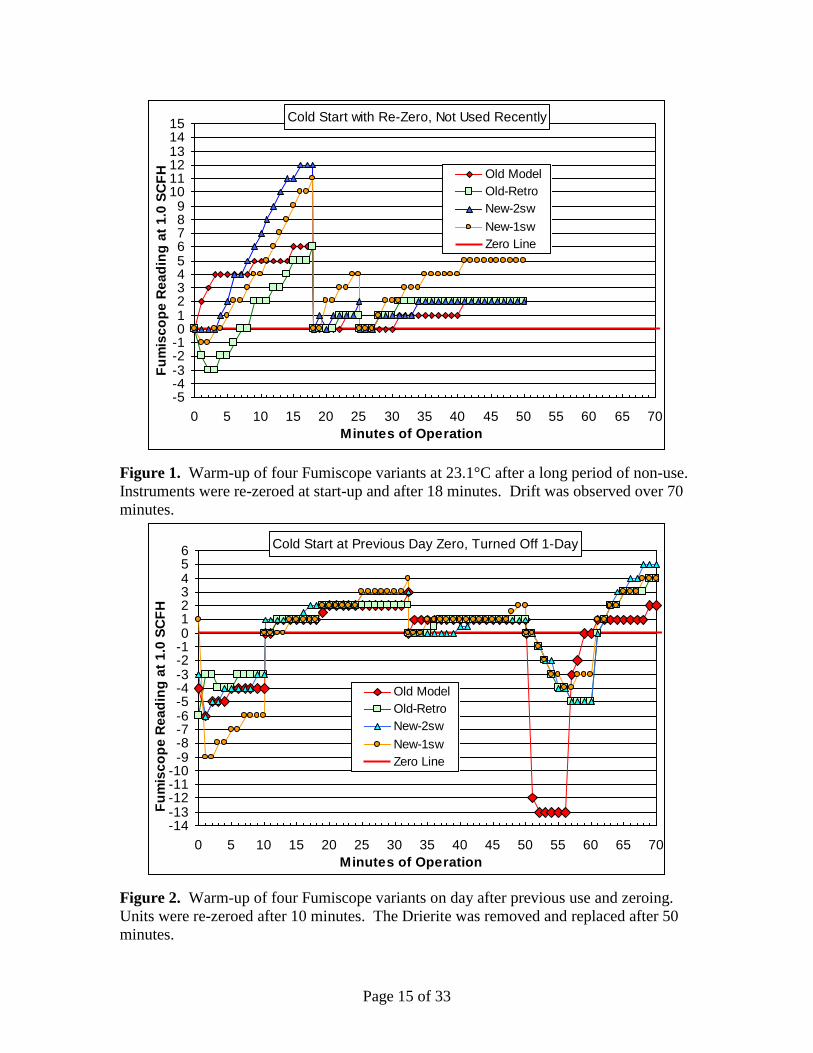
Page 15 of 33
Cold Start with Re-Zero, Not Used Recently
-5-4-3-2-10123456789
101112131415
0 5 10 15 20 25 30 35 40 45 50 55 60 65 70
Minutes of Operation
Fu
mis
co
pe
Re
ad
ing
at
1.0
SC
FH Old Model
Old-Retro
New-2sw
New-1sw
Zero Line
Figure 1. Warm-up of four Fumiscope variants at 23.1°C after a long period of non-use.
Instruments were re-zeroed at start-up and after 18 minutes. Drift was observed over 70
minutes.
Cold Start at Previous Day Zero, Turned Off 1-Day
-14-13-12-11-10
-9-8-7-6-5-4-3-2-10123456
0 5 10 15 20 25 30 35 40 45 50 55 60 65 70
Minutes of Operation
Fu
mis
co
pe
Re
ad
ing
at
1.0
SC
FH
Old Model
Old-Retro
New-2sw
New-1sw
Zero Line
Figure 2. Warm-up of four Fumiscope variants on day after previous use and zeroing.
Units were re-zeroed after 10 minutes. The Drierite was removed and replaced after 50
minutes.
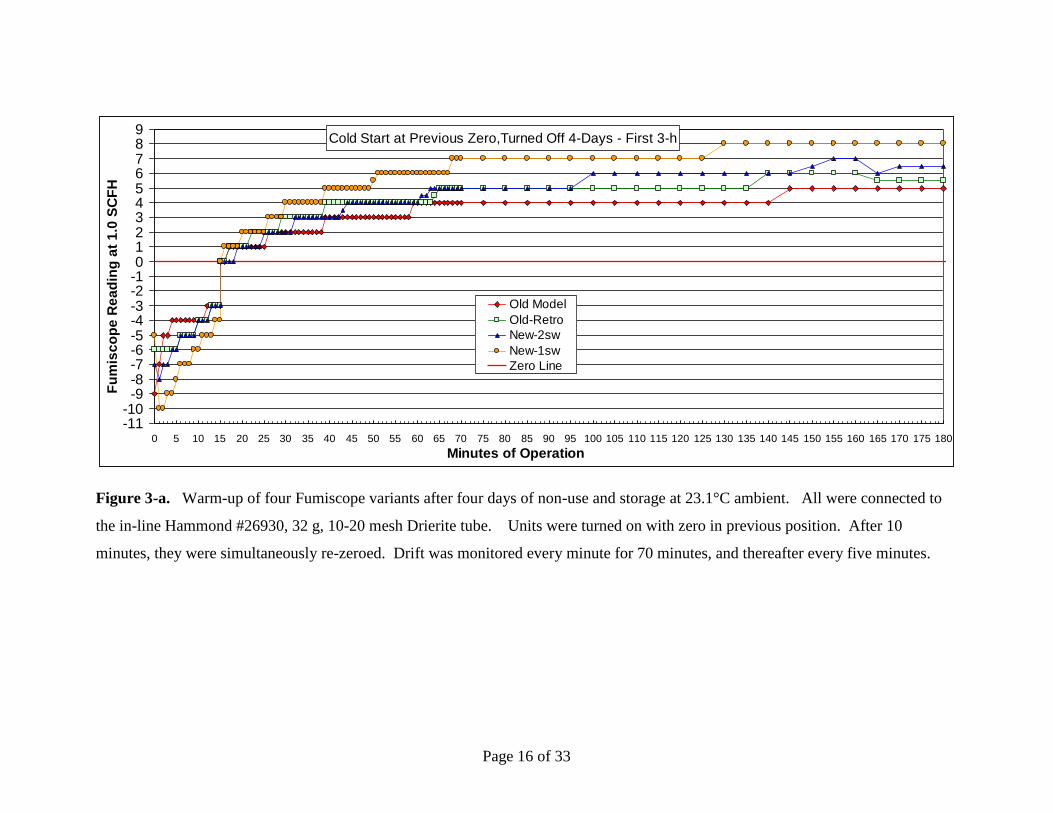
Page 16 of 33
Cold Start at Previous Zero,Turned Off 4-Days - First 3-h
-11-10-9-8-7-6-5-4-3-2-10123456789
0 5 10 15 20 25 30 35 40 45 50 55 60 65 70 75 80 85 90 95 100 105 110 115 120 125 130 135 140 145 150 155 160 165 170 175 180
Minutes of Operation
Fu
mis
co
pe
Re
ad
ing
at
1.0
SC
FH
Old Model
Old-Retro
New-2sw
New-1sw
Zero Line
Figure 3-a. Warm-up of four Fumiscope variants after four days of non-use and storage at 23.1°C ambient. All were connected to
the in-line Hammond #26930, 32 g, 10-20 mesh Drierite tube. Units were turned on with zero in previous position. After 10
minutes, they were simultaneously re-zeroed. Drift was monitored every minute for 70 minutes, and thereafter every five minutes.
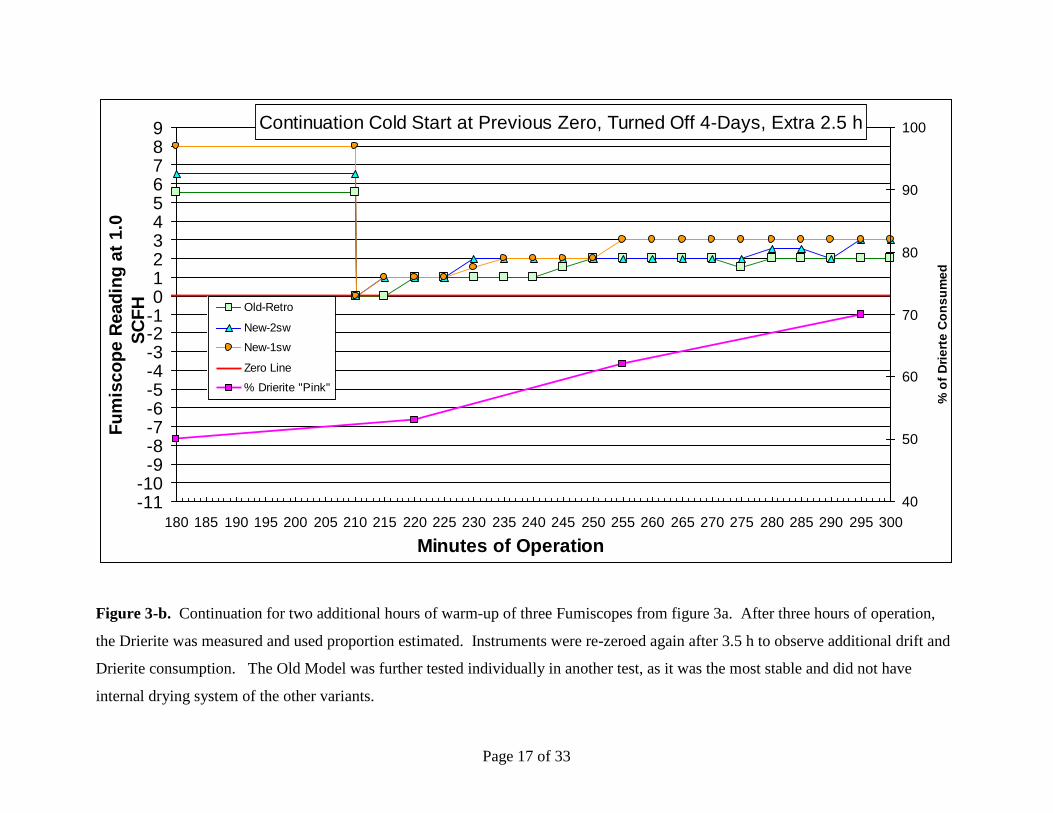
Page 17 of 33
Continuation Cold Start at Previous Zero, Turned Off 4-Days, Extra 2.5 h
-11-10-9-8-7-6-5-4-3-2-10123456789
180 185 190 195 200 205 210 215 220 225 230 235 240 245 250 255 260 265 270 275 280 285 290 295 300
Minutes of Operation
Fu
mis
co
pe R
ead
ing
at
1.0
SC
FH
40
50
60
70
80
90
100
% o
f D
rie
rte
Co
ns
um
ed
Old-Retro
New-2sw
New-1sw
Zero Line
% Drierite "Pink"
Figure 3-b. Continuation for two additional hours of warm-up of three Fumiscopes from figure 3a. After three hours of operation,
the Drierite was measured and used proportion estimated. Instruments were re-zeroed again after 3.5 h to observe additional drift and
Drierite consumption. The Old Model was further tested individually in another test, as it was the most stable and did not have
internal drying system of the other variants.
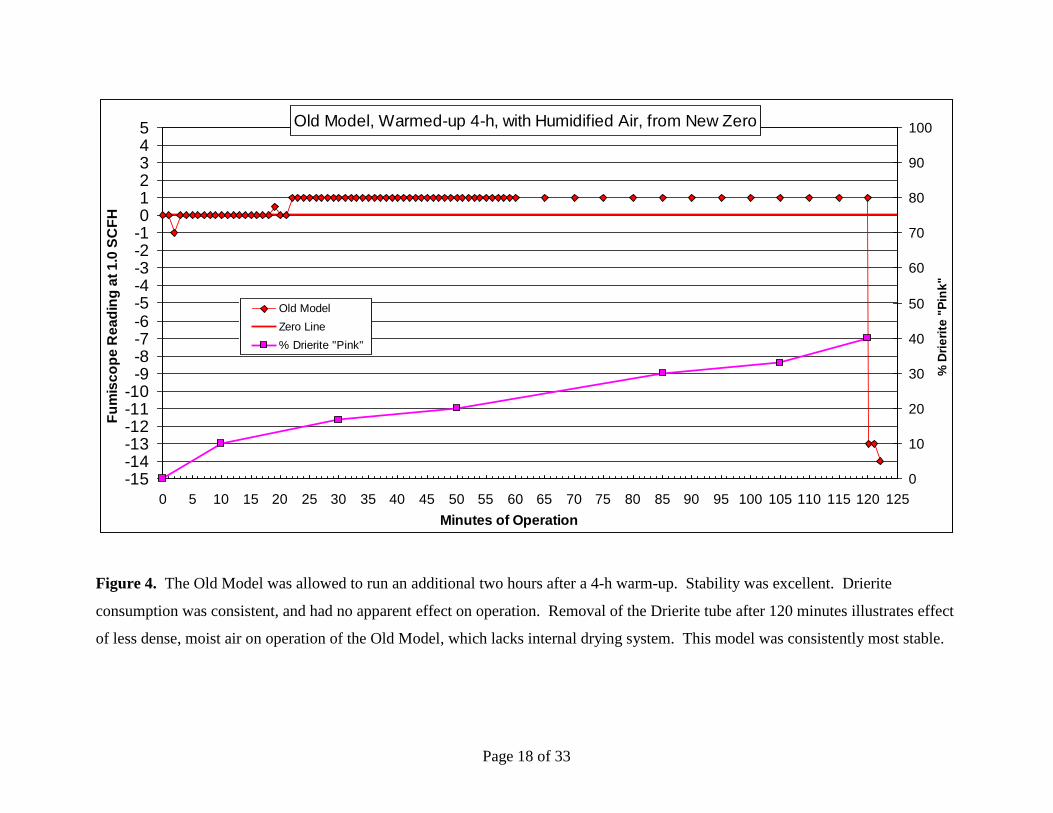
Page 18 of 33
Old Model, Warmed-up 4-h, with Humidified Air, from New Zero
-15-14-13-12-11-10
-9-8-7-6-5-4-3-2-1012345
0 5 10 15 20 25 30 35 40 45 50 55 60 65 70 75 80 85 90 95 100 105 110 115 120 125
Minutes of Operation
Fu
mis
co
pe
Re
ad
ing
at
1.0
SC
FH
0
10
20
30
40
50
60
70
80
90
100
% D
rie
rite
"P
ink
"
Old Model
Zero Line
% Drierite "Pink"
Figure 4. The Old Model was allowed to run an additional two hours after a 4-h warm-up. Stability was excellent. Drierite
consumption was consistent, and had no apparent effect on operation. Removal of the Drierite tube after 120 minutes illustrates effect
of less dense, moist air on operation of the Old Model, which lacks internal drying system. This model was consistently most stable.
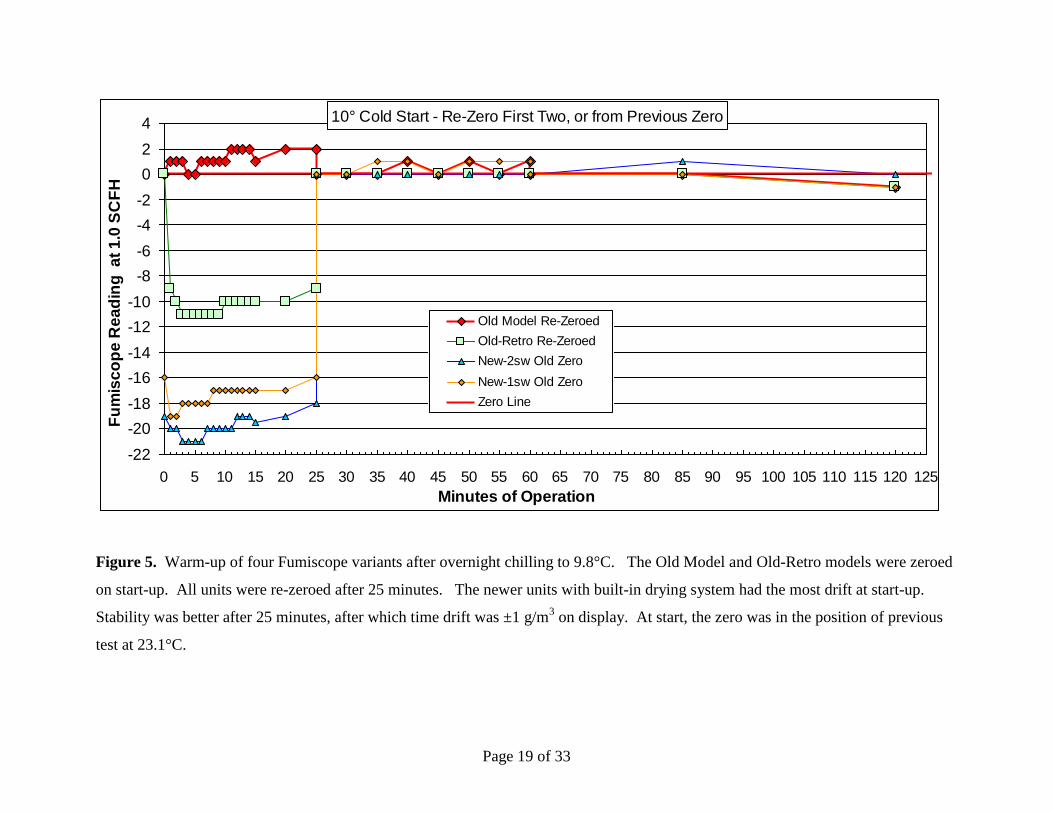
Page 19 of 33
10° Cold Start - Re-Zero First Two, or from Previous Zero
-22
-20
-18
-16
-14
-12
-10
-8
-6
-4
-2
0
2
4
0 5 10 15 20 25 30 35 40 45 50 55 60 65 70 75 80 85 90 95 100 105 110 115 120 125
Minutes of Operation
Fu
mis
co
pe
Re
ad
ing
a
t 1
.0 S
CF
H
Old Model Re-Zeroed
Old-Retro Re-Zeroed
New-2sw Old Zero
New-1sw Old Zero
Zero Line
Figure 5. Warm-up of four Fumiscope variants after overnight chilling to 9.8°C. The Old Model and Old-Retro models were zeroed
on start-up. All units were re-zeroed after 25 minutes. The newer units with built-in drying system had the most drift at start-up.
Stability was better after 25 minutes, after which time drift was ±1 g/m3 on display. At start, the zero was in the position of previous
test at 23.1°C.
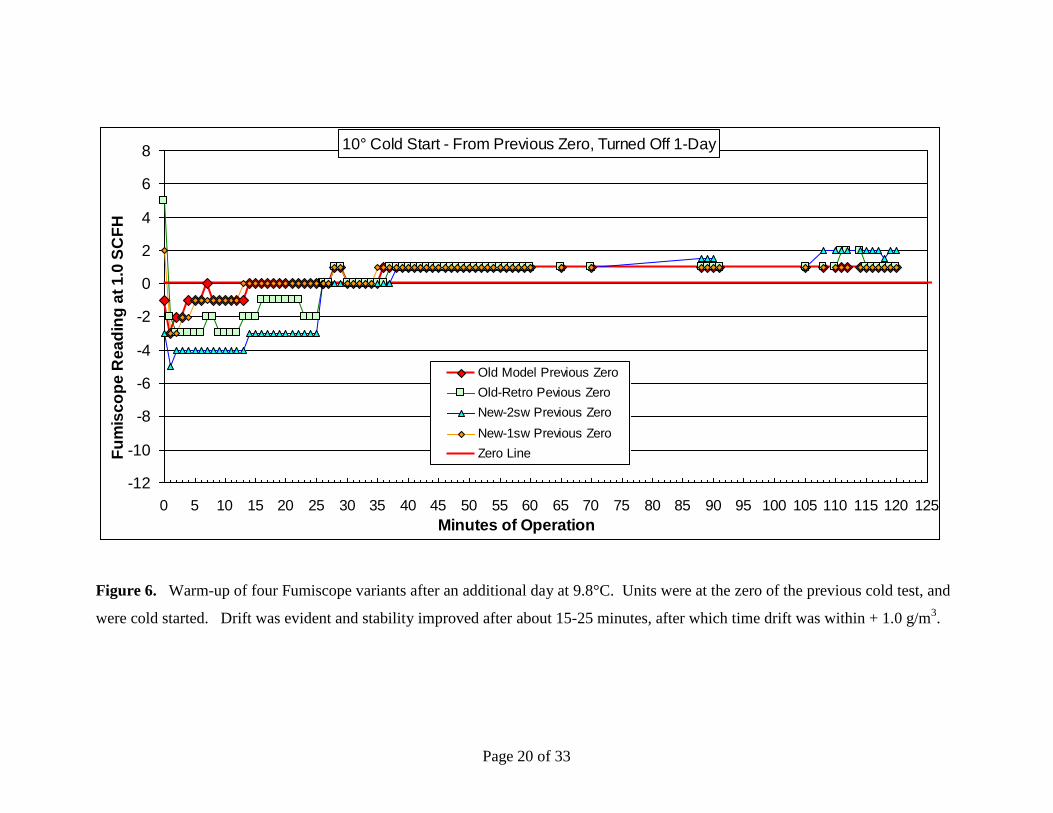
Page 20 of 33
10° Cold Start - From Previous Zero, Turned Off 1-Day
-12
-10
-8
-6
-4
-2
0
2
4
6
8
0 5 10 15 20 25 30 35 40 45 50 55 60 65 70 75 80 85 90 95 100 105 110 115 120 125
Minutes of Operation
Fu
mis
co
pe
Re
ad
ing
at
1.0
SC
FH
Old Model Previous Zero
Old-Retro Pevious Zero
New-2sw Previous Zero
New-1sw Previous Zero
Zero Line
Figure 6. Warm-up of four Fumiscope variants after an additional day at 9.8°C. Units were at the zero of the previous cold test, and
were cold started. Drift was evident and stability improved after about 15-25 minutes, after which time drift was within + 1.0 g/m3.
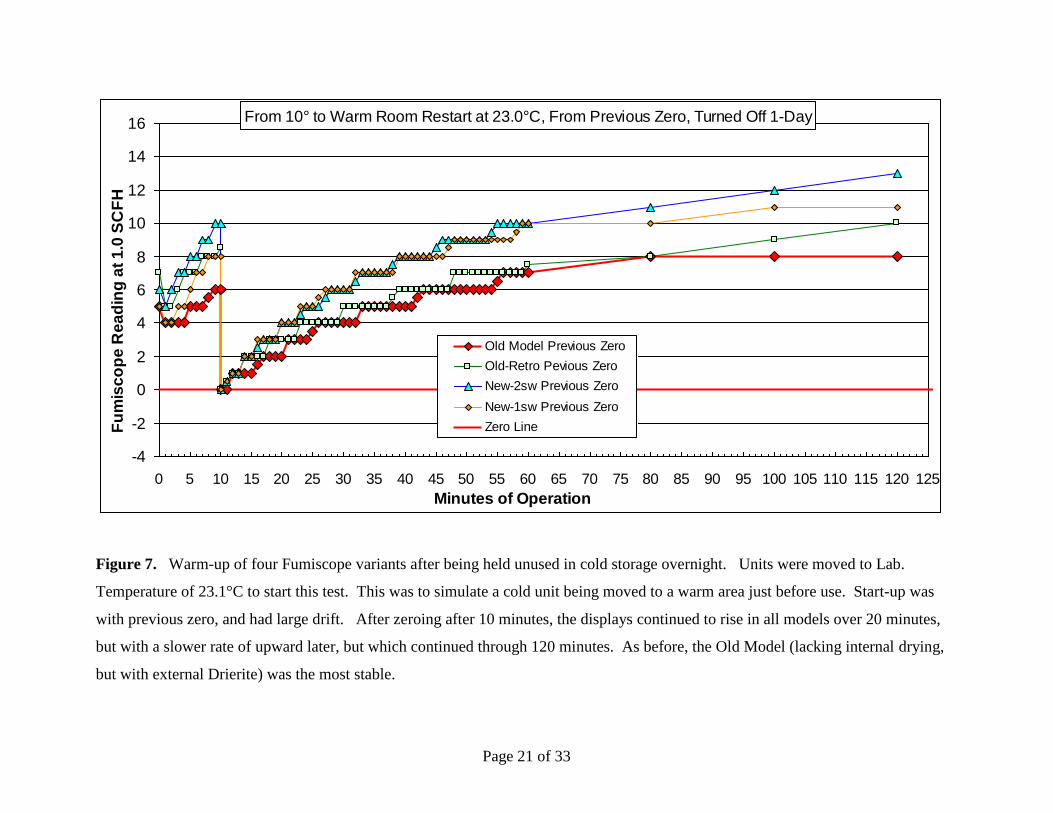
Page 21 of 33
From 10° to Warm Room Restart at 23.0°C, From Previous Zero, Turned Off 1-Day
-4
-2
0
2
4
6
8
10
12
14
16
0 5 10 15 20 25 30 35 40 45 50 55 60 65 70 75 80 85 90 95 100 105 110 115 120 125
Minutes of Operation
Fu
mis
co
pe
Re
ad
ing
at
1.0
SC
FH
Old Model Previous Zero
Old-Retro Pevious Zero
New-2sw Previous Zero
New-1sw Previous Zero
Zero Line
Figure 7. Warm-up of four Fumiscope variants after being held unused in cold storage overnight. Units were moved to Lab.
Temperature of 23.1°C to start this test. This was to simulate a cold unit being moved to a warm area just before use. Start-up was
with previous zero, and had large drift. After zeroing after 10 minutes, the displays continued to rise in all models over 20 minutes,
but with a slower rate of upward later, but which continued through 120 minutes. As before, the Old Model (lacking internal drying,
but with external Drierite) was the most stable.
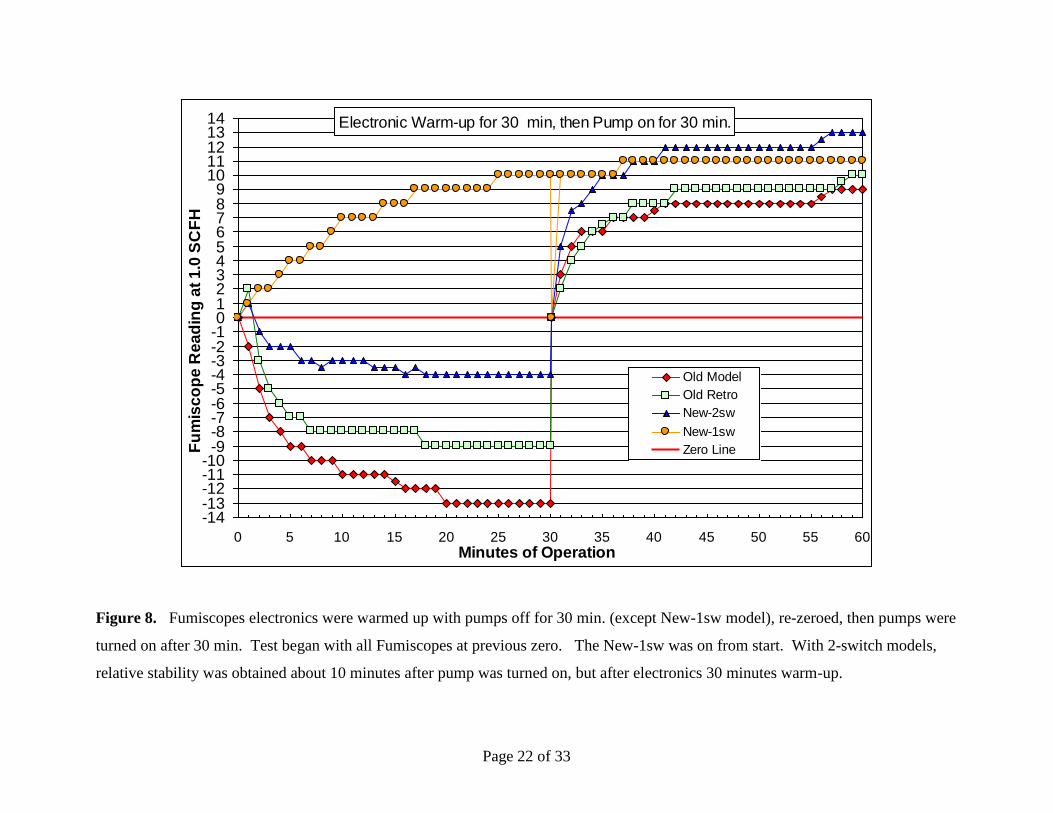
Page 22 of 33
Electronic Warm-up for 30 min, then Pump on for 30 min.
-14-13-12-11-10
-9-8-7-6-5-4-3-2-10123456789
1011121314
0 5 10 15 20 25 30 35 40 45 50 55 60Minutes of Operation
Fu
mis
co
pe
Re
ad
ing
at
1.0
SC
FH
Old Model
Old Retro
New-2sw
New-1sw
Zero Line
Figure 8. Fumiscopes electronics were warmed up with pumps off for 30 min. (except New-1sw model), re-zeroed, then pumps were
turned on after 30 min. Test began with all Fumiscopes at previous zero. The New-1sw was on from start. With 2-switch models,
relative stability was obtained about 10 minutes after pump was turned on, but after electronics 30 minutes warm-up.
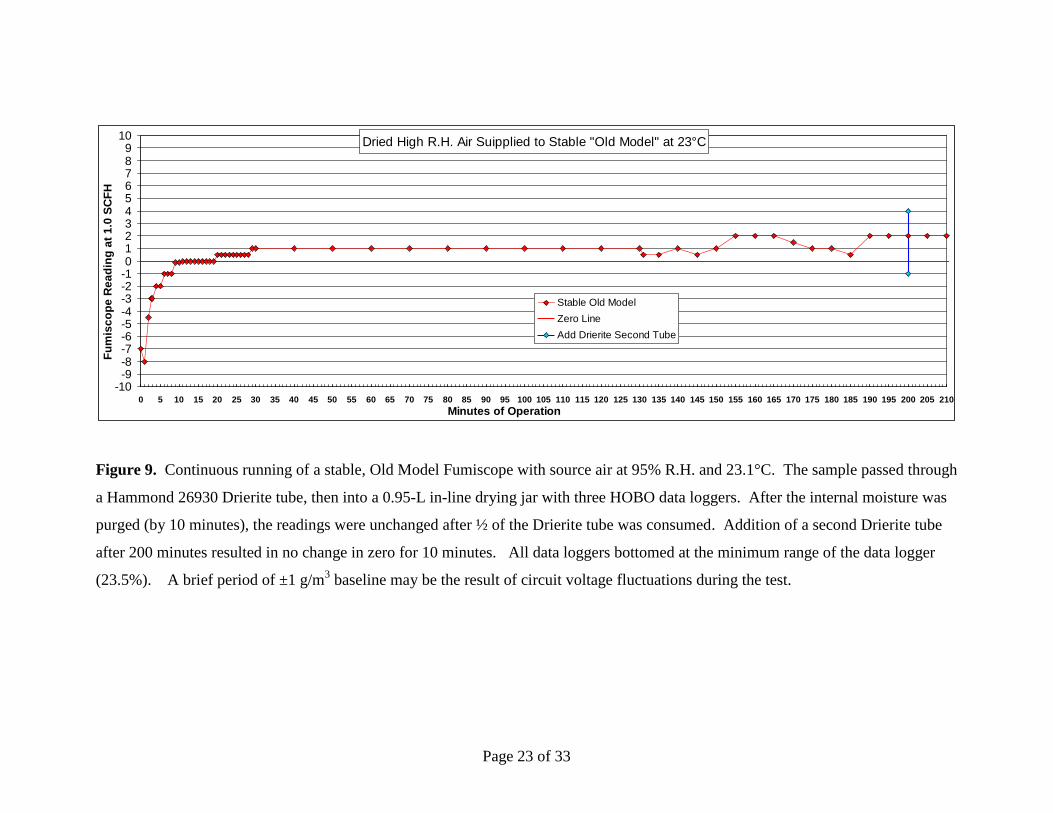
Page 23 of 33
Dried High R.H. Air Suipplied to Stable "Old Model" at 23°C
-10-9-8-7-6-5-4-3-2-10123456789
10
0 5 10 15 20 25 30 35 40 45 50 55 60 65 70 75 80 85 90 95 100 105 110 115 120 125 130 135 140 145 150 155 160 165 170 175 180 185 190 195 200 205 210
Minutes of Operation
Fu
mis
co
pe
Re
ad
ing
at
1.0
SC
FH
Stable Old Model
Zero Line
Add Drierite Second Tube
Figure 9. Continuous running of a stable, Old Model Fumiscope with source air at 95% R.H. and 23.1°C. The sample passed through
a Hammond 26930 Drierite tube, then into a 0.95-L in-line drying jar with three HOBO data loggers. After the internal moisture was
purged (by 10 minutes), the readings were unchanged after ½ of the Drierite tube was consumed. Addition of a second Drierite tube
after 200 minutes resulted in no change in zero for 10 minutes. All data loggers bottomed at the minimum range of the data logger
(23.5%). A brief period of ±1 g/m3 baseline may be the result of circuit voltage fluctuations during the test.
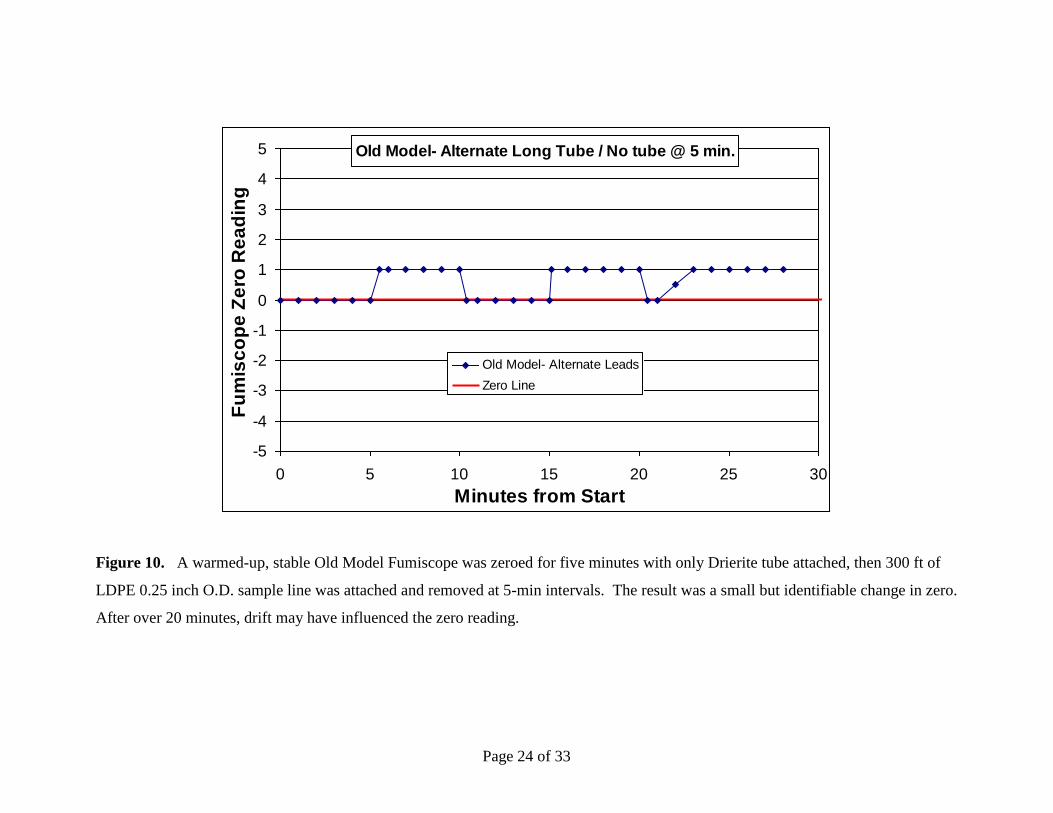
Page 24 of 33
Old Model- Alternate Long Tube / No tube @ 5 min.
-5
-4
-3
-2
-1
0
1
2
3
4
5
0 5 10 15 20 25 30
Minutes from Start
Fu
mis
co
pe
Ze
ro R
ea
din
g
Old Model- Alternate Leads
Zero Line
Figure 10. A warmed-up, stable Old Model Fumiscope was zeroed for five minutes with only Drierite tube attached, then 300 ft of
LDPE 0.25 inch O.D. sample line was attached and removed at 5-min intervals. The result was a small but identifiable change in zero.
After over 20 minutes, drift may have influenced the zero reading.
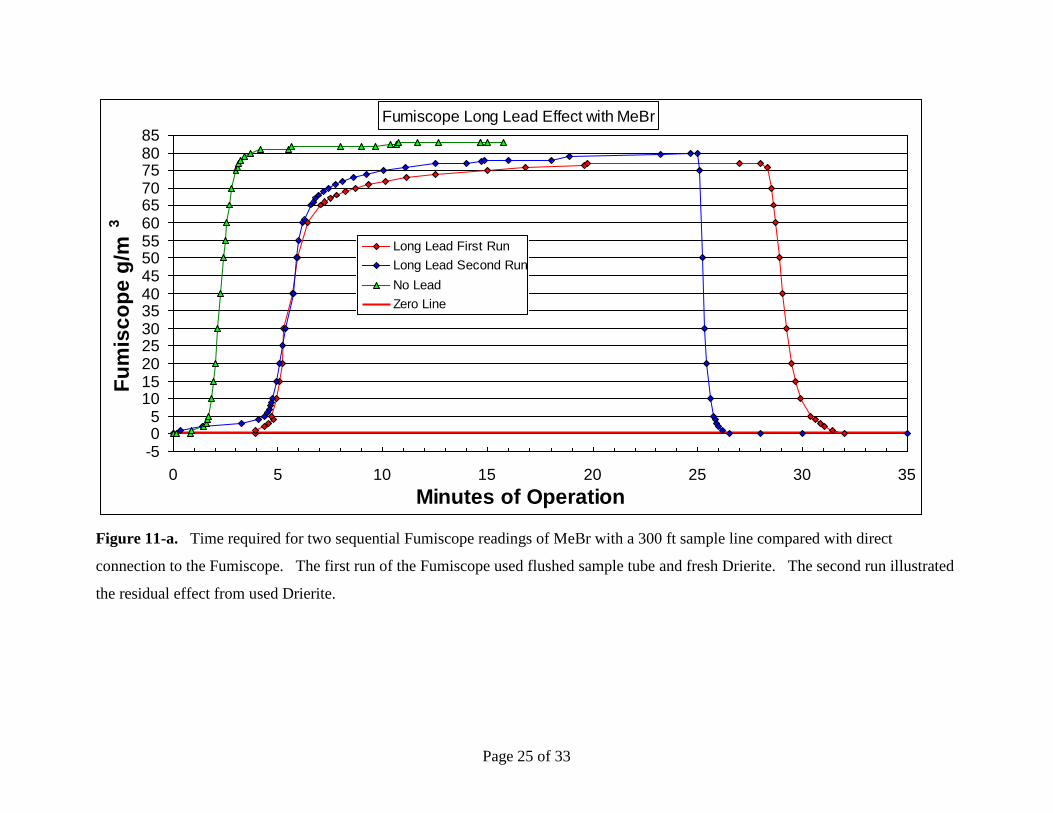
Page 25 of 33
Fumiscope Long Lead Effect with MeBr
-505
10152025303540455055606570758085
0 5 10 15 20 25 30 35
Minutes of Operation
Fu
mis
co
pe
g/m
3
Long Lead First Run
Long Lead Second Run
No Lead
Zero Line
Figure 11-a. Time required for two sequential Fumiscope readings of MeBr with a 300 ft sample line compared with direct
connection to the Fumiscope. The first run of the Fumiscope used flushed sample tube and fresh Drierite. The second run illustrated
the residual effect from used Drierite.
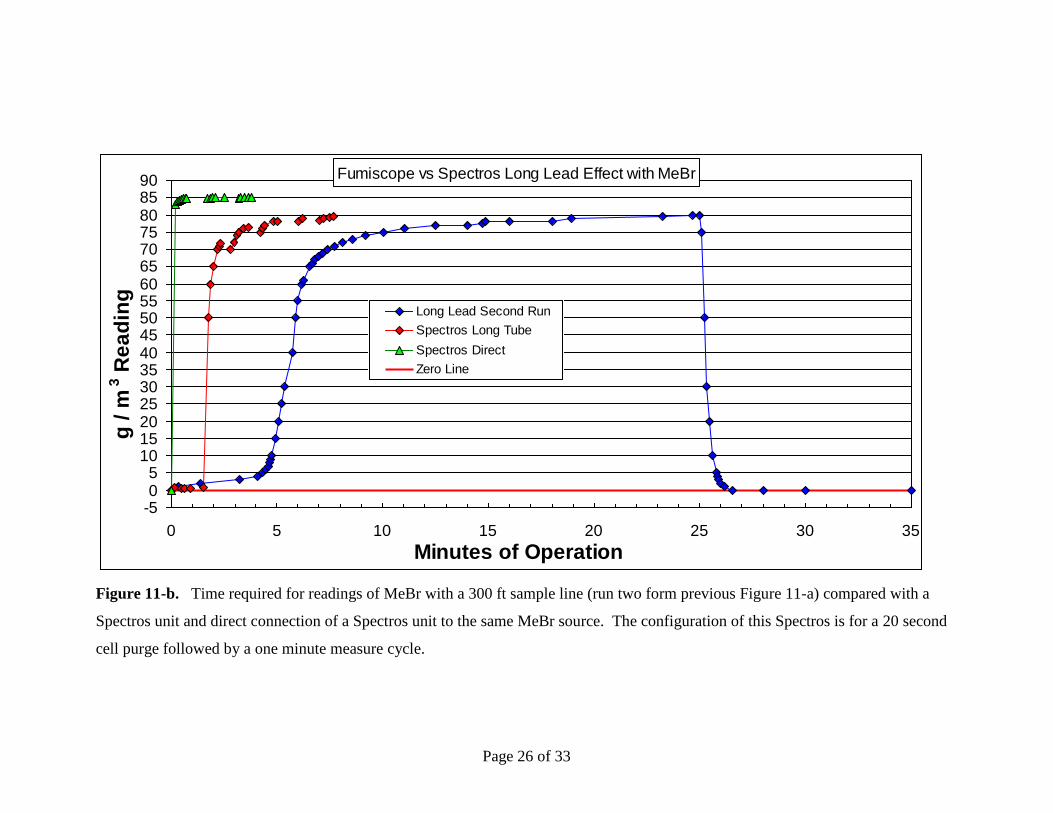
Page 26 of 33
Fumiscope vs Spectros Long Lead Effect with MeBr
-505
1015202530354045505560657075808590
0 5 10 15 20 25 30 35
Minutes of Operation
g /
m3 R
ea
din
g
Long Lead Second Run
Spectros Long Tube
Spectros Direct
Zero Line
Figure 11-b. Time required for readings of MeBr with a 300 ft sample line (run two form previous Figure 11-a) compared with a
Spectros unit and direct connection of a Spectros unit to the same MeBr source. The configuration of this Spectros is for a 20 second
cell purge followed by a one minute measure cycle.
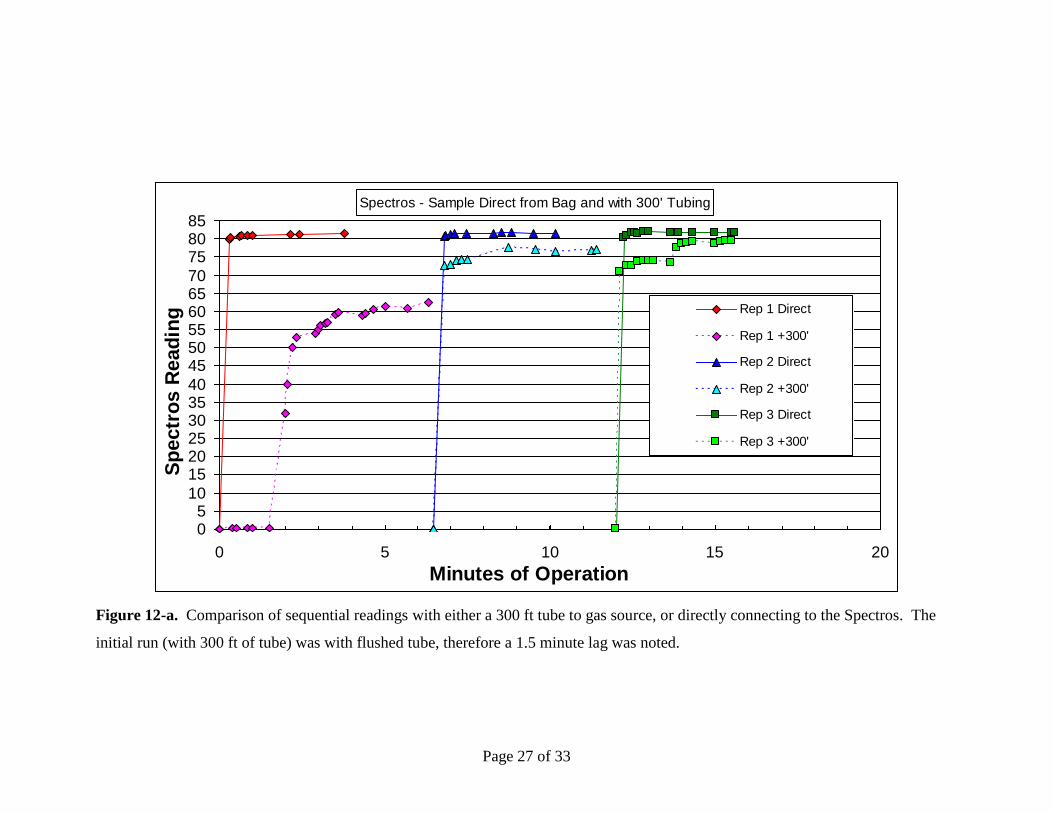
Page 27 of 33
Spectros - Sample Direct from Bag and with 300' Tubing
05
10
152025303540
455055606570
758085
0 5 10 15 20
Minutes of Operation
Sp
ectr
os R
ead
ing Rep 1 Direct
Rep 1 +300'
Rep 2 Direct
Rep 2 +300'
Rep 3 Direct
Rep 3 +300'
Figure 12-a. Comparison of sequential readings with either a 300 ft tube to gas source, or directly connecting to the Spectros. The
initial run (with 300 ft of tube) was with flushed tube, therefore a 1.5 minute lag was noted.

Page 28 of 33
Fumiscope - Sample Direct from Bag and with 300' Tubing
05
1015
202530
3540
4550
556065
7075
8085
0 5 10 15 20 25 30 35 40 45
Minutes of Operation
Fu
mis
co
pe R
ead
ing
Rep 1 Direct
Rep 1 +300'
Rep 2 Direct
Rep 2 +300'
Rep 3 Direct
Rep 3 +300'
Figure 12-b. Comparison of paired, sequential readings with either a 300 ft tube to gas source, or directly connecting to the
Fumiscope. The initial run (with 300 ft of tube) was with an un-purged flushed tube, therefore response was quick, but a plateau
was noted due to loss of gas from the tube during operating with a direct connection.
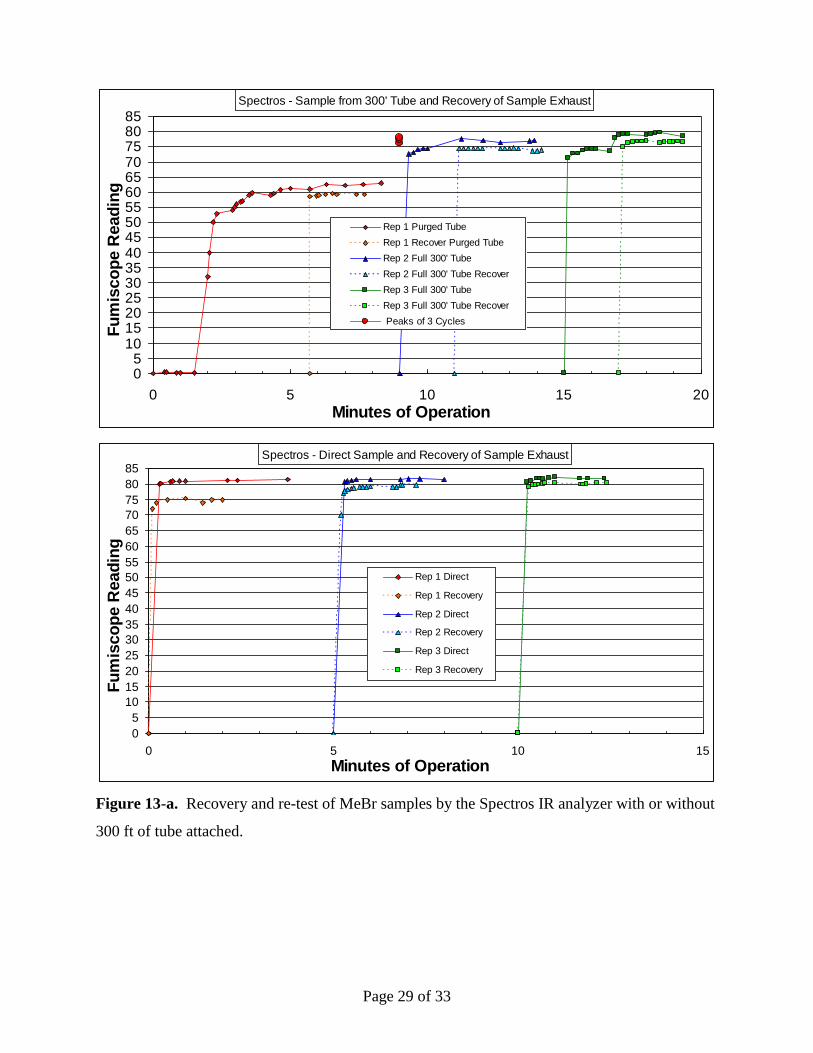
Page 29 of 33
Spectros - Sample from 300' Tube and Recovery of Sample Exhaust
05
10152025303540455055606570758085
0 5 10 15 20
Minutes of Operation
Fu
mis
co
pe R
ead
ing
Rep 1 Purged Tube
Rep 1 Recover Purged Tube
Rep 2 Full 300' Tube
Rep 2 Full 300' Tube Recover
Rep 3 Full 300' Tube
Rep 3 Full 300' Tube Recover
Peaks of 3 Cycles
Spectros - Direct Sample and Recovery of Sample Exhaust
0
5
10
15
20
25
30
35
40
45
50
55
60
65
70
75
80
85
0 5 10 15
Minutes of Operation
Fu
mis
co
pe R
ead
ing
Rep 1 Direct
Rep 1 Recovery
Rep 2 Direct
Rep 2 Recovery
Rep 3 Direct
Rep 3 Recovery
Figure 13-a. Recovery and re-test of MeBr samples by the Spectros IR analyzer with or without
300 ft of tube attached.
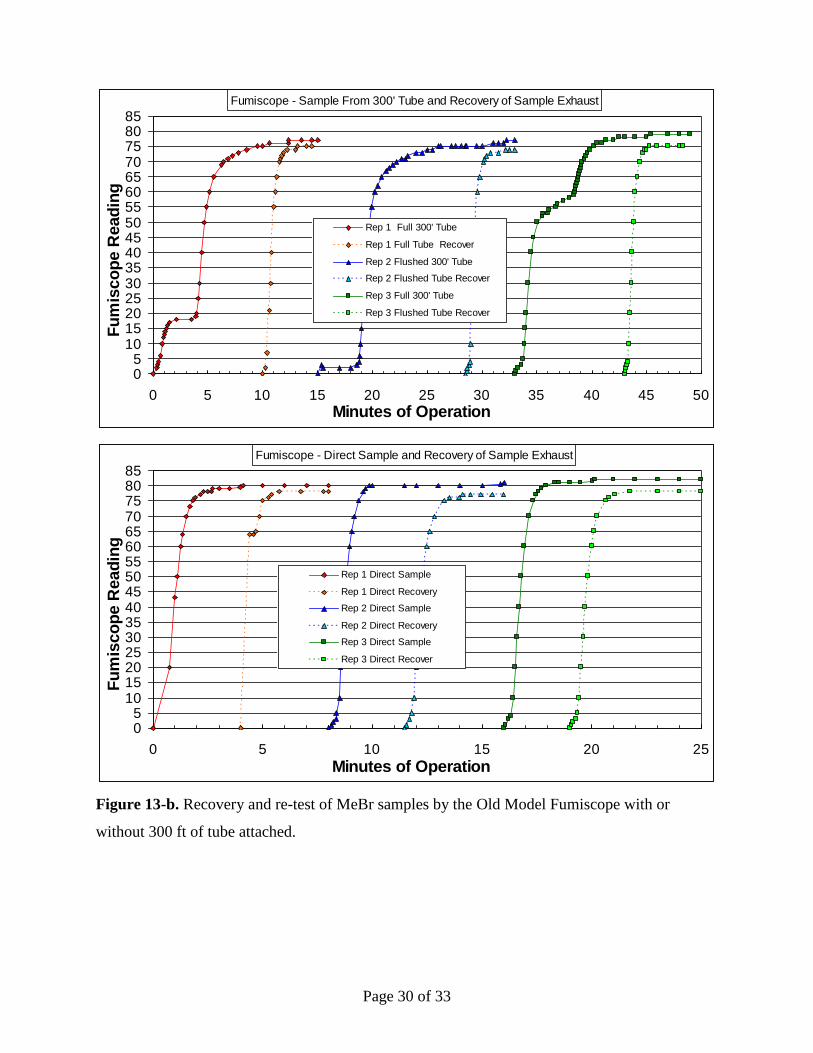
Page 30 of 33
Fumiscope - Sample From 300' Tube and Recovery of Sample Exhaust
05
10152025303540455055606570758085
0 5 10 15 20 25 30 35 40 45 50
Minutes of Operation
Fu
mis
co
pe R
ead
ing
Rep 1 Full 300' Tube
Rep 1 Full Tube Recover
Rep 2 Flushed 300' Tube
Rep 2 Flushed Tube Recover
Rep 3 Full 300' Tube
Rep 3 Flushed Tube Recover
Fumiscope - Direct Sample and Recovery of Sample Exhaust
05
10152025303540455055606570758085
0 5 10 15 20 25
Minutes of Operation
Fu
mis
co
pe R
ead
ing
Rep 1 Direct Sample
Rep 1 Direct Recovery
Rep 2 Direct Sample
Rep 2 Direct Recovery
Rep 3 Direct Sample
Rep 3 Direct Recover
Figure 13-b. Recovery and re-test of MeBr samples by the Old Model Fumiscope with or
without 300 ft of tube attached.
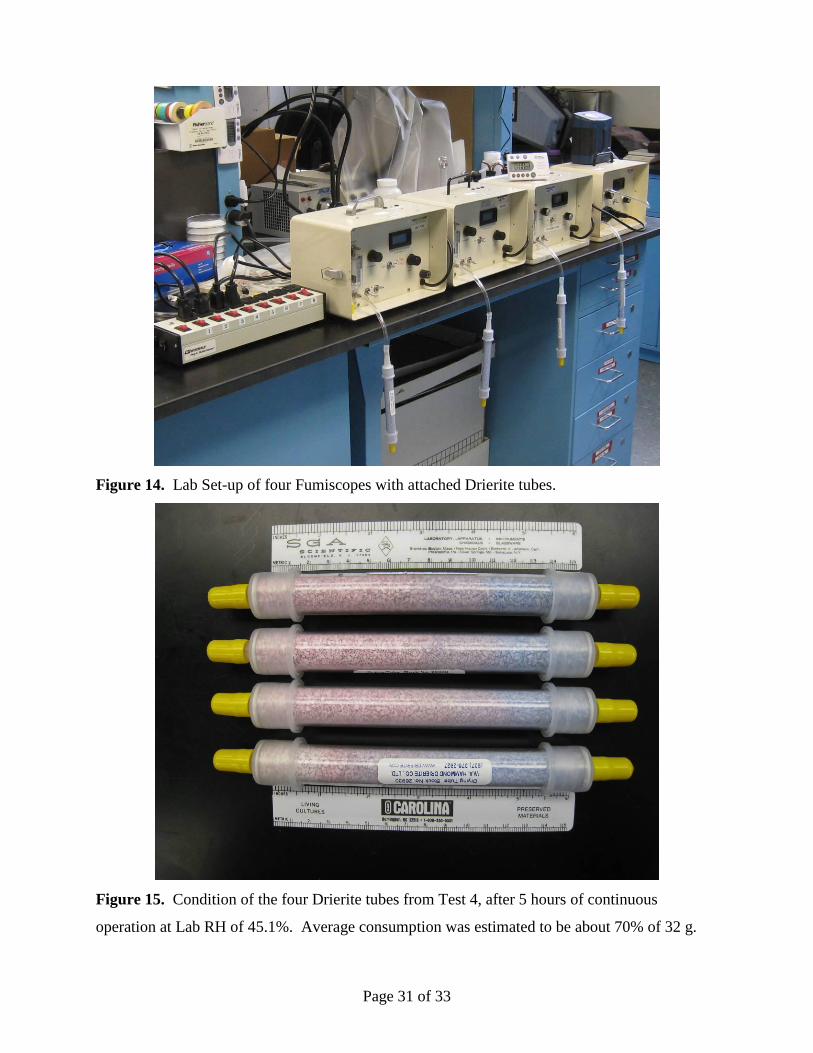
Page 31 of 33
Figure 14. Lab Set-up of four Fumiscopes with attached Drierite tubes.
Figure 15. Condition of the four Drierite tubes from Test 4, after 5 hours of continuous
operation at Lab RH of 45.1%. Average consumption was estimated to be about 70% of 32 g.
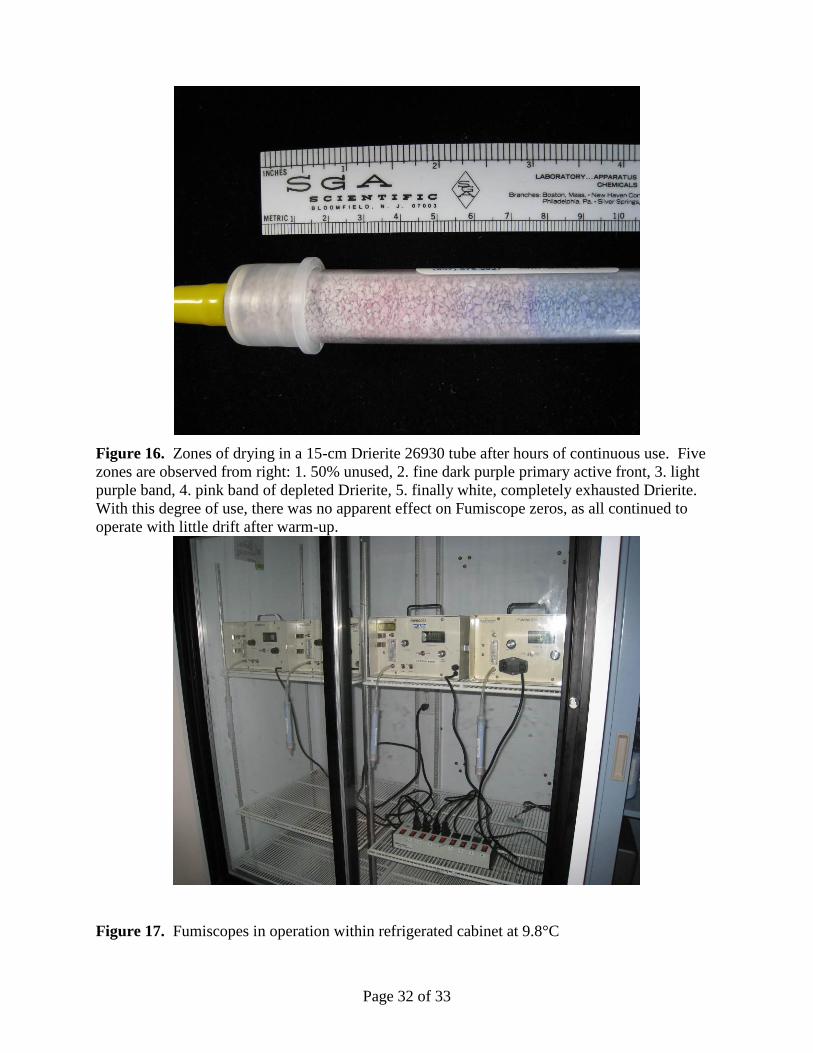
Page 32 of 33
Figure 16. Zones of drying in a 15-cm Drierite 26930 tube after hours of continuous use. Five
zones are observed from right: 1. 50% unused, 2. fine dark purple primary active front, 3. light
purple band, 4. pink band of depleted Drierite, 5. finally white, completely exhausted Drierite.
With this degree of use, there was no apparent effect on Fumiscope zeros, as all continued to
operate with little drift after warm-up.
Figure 17. Fumiscopes in operation within refrigerated cabinet at 9.8°C
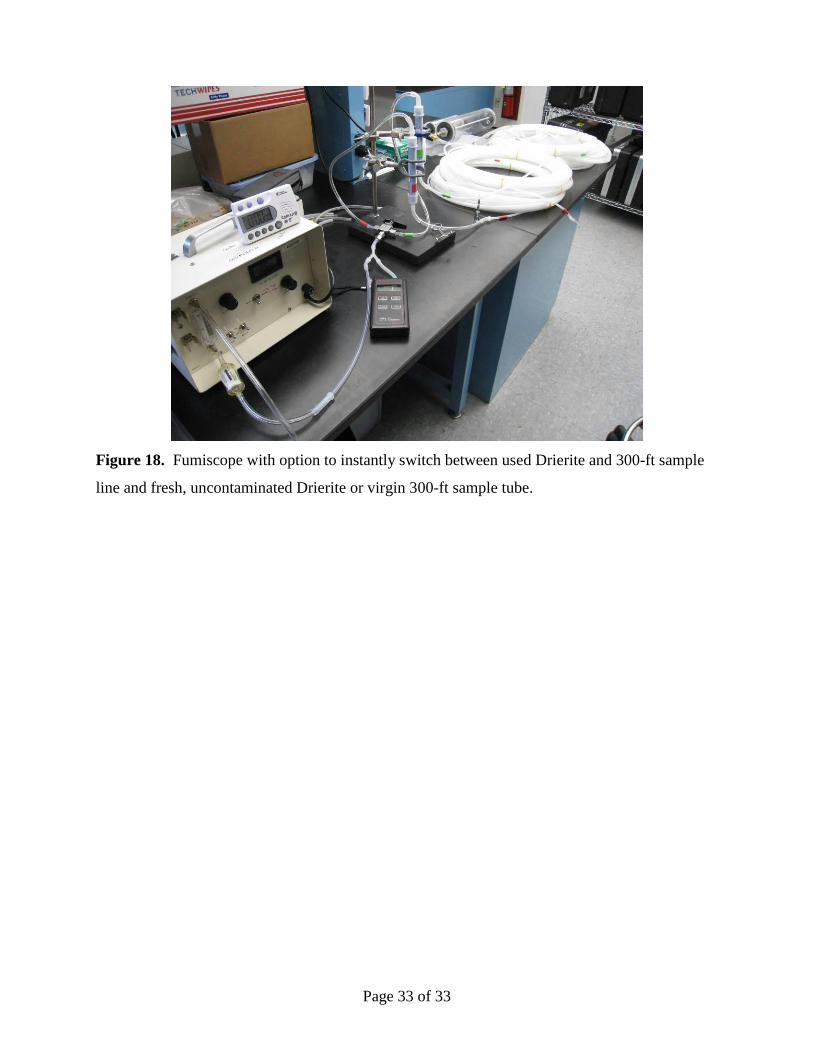
Page 33 of 33
Figure 18. Fumiscope with option to instantly switch between used Drierite and 300-ft sample
line and fresh, uncontaminated Drierite or virgin 300-ft sample tube.

Page 1 of 19
Technical Report: Zeroing methods for the Fumiscope.
Alan V. Barak
USDA APHIS PPQ, Otis Laboratory
Background
The Fumiscope, a thermal conductivity instrument, is used by APHIS for monitoring fumigant
gasses, primarily methyl bromide (MeBr). Older versions were supplied with glass tubes to hold about 10
g of 8-10 mesh indicating Drierite desiccant to dry the sample stream to a uniform and repeatable level to
avoid errors. Later versions of the Fumiscope were equipped with an internal drying system, but it was
found that the use of a Drierite tube improved consistent performance. APHIS requires the use of drying
tubes with the Fumiscope at all times. Either the traditional Fumiscope (about 10 g) glass tube or a
commercial tube containing ca. 30g of 10-20 mesh indicating Drierite is allowed. The effect of using
fresh uncontaminated Drierite to achieve a new zero is unknown. Carbon dioxide (CO2) may be present
in concentrations high enough to influence Fumiscope readings; therefore an in-line CO2 scrubber such as
Ascarite may be required. The glass tube holds about 10 g of Ascarite II. It is unknown if the use of
Ascarite in-line with the sample or zero air will significantly influence the zeroing process. The
following tests compare: 1) The re-zeroing speed and efficiency when sample air is allowed to flow
through used, MeBr-contaminated vs. clean Drierite by diverting fresh air through fresh unused Drierite
via a 3-way valve, and 2) The effect of Ascarite on the zeroing process, with ambient and 1.0% v/v CO2.
Procedures.
Calibration gas of 21,050 ppm ± 1.0% MeBr (ca. 79-81 g/m3 at Lab variable pressure and
temperature) was used in some tests (Scott-Marrin, Riverside, CA). For some tests, an 80 g/m3 mixture of
MeBr in air was prepared in 40-liter SKC Tedlar® gas bags (SKC, Inc. Eighty Four, PA). An additional
mixture of 80 g/m3 MeBr +.0% v/v CO2 was prepared. A Fumiscope, retro-fitted with the internal drying
system (Key Chemical and Equipment, Clearwater, FL) was first calibrated at 81 g/m3, based on the
supplied calibration gas ppm and the existent ambient pressure and temperature. The Fumiscope was set
up to allow the gas source to enter the Fumiscope through desiccant or sorbent tubes configured as to
allow the supply source to be switched alternatively from two different sample sources by use of a No. B-
43XS4 3-way high pressure ball valve (Swagelok, Solon OH). Drierite tubes employed were either the
traditional glass tube previously supplied with some Fumiscope models utilizing ca. 10 g, 8- mesh
indicating Drierite, or a purchased, #26930 disposable tube (Hammond Drierite Company, Xenia OH)
using ca. 30 g of the finer 10-20 mesh Drierite. Fumiscope exhaust was monitored by a Defender 510-M
Dry-Cal flow calibrator (Bios International Corp., Butler, NJ). The Fumiscope flow gauge was adjusted
Page 2 of 19
to supply input MeBr at ca. 472 ± 5 ml/min (1.0 SCFH). Flow rates after disconnection of MeBr or
diverted air were not re- adjusted further. Flow rates during re-zeroing were only slightly higher (ca. 480
ml/min). The experimental apparatus is shown in Figure 1a.
Tube connections were made using the 3-way brass valve previously described. The valve was
fitted with three 0.25 inch compression fittings. This fitting allows direct permanent connection of the
standard 0.25 inch LDPE sample lines. More flexible 0.25 in. OD, 3/16 inch ID Tygon type tube was
used to facilitate connections. Connections of different size tube were accomplished by using 0.25 in. ID
silicone tube (see Figure 1a). This fit over the 3/16 inch Tygon, and when doubled over, tightly fit the
0.25 in. sample line. Quick disconnect type fitting can also be employed, and when the quick connects
have a JG (John Guest) type push in connection to accept 0.25 in. LDPE sample tube, assembling the
apparatus is efficient.
Alternative and easier connections can be made using 3/16 inch ID silicone tube. This is flexible,
easy to cut, makes a tight, secure connection between 0.25 inch sample lines, the Fumiscope, the 3-way
valve, and with the glass or Hammond Drierite tube. This set-up is shown in Figure 1b.
Tests with glass "Fumiscope" tubes. A series of tests was conducted using only the traditional glass
desiccant tubes. The Fumiscope was zeroed, and then connected to a gas bag containg the supply of
MeBr. The instrument was allowed to receive MeBr for 10 minutes. During this time, periodic readings
and times were recorded, as the time in manures/seconds at which a stable inter reading was achieved.
After 10 minutes, the gas flow was disconnected, allowing the Fumiscope to come to zero with the
original used Drierite still in place. After 10 additional minutes the test was stopped. Following this, the
test was repeated, except that the Fumiscope was allowed to come to zero by diverting fresh air through
fresh Drierite via a 3-way Swagelok valve. The complete process was replicated three times with each
method of zeroing.
Re-Zero with Hammond Drierite tube. The second set of tests was conducted in exactly the same
way as the first set with glass tubes, except that the Drierite tube used was the commercial disposable
Hammond Drierite tube.
Ascarite effect on zero. A similar arrangement of the Fumiscope was devised so that the
instrument could be supplied with sample air from two alternate sources to test the effect of
Ascarite on zero. The arrangement is shown in Figure 1c. One air source was filtered through a
Hammond tube, followed by an in-line glass "Fumiscope" tube containing 10g of 8-mesh Ascarite-II
(Thomas Scientific, Swedesboro, NJ). The alternative source of air was filtered through only a single
Hammond Drierite tube. Inclusion of a 3-way valve (Swagelok, Solon OH) allowed for near
Page 3 of 19
instantaneous switching of the air source from one side to the other. The Fumiscope was allowed to
warm up for about 1-h prior to these tests. The Fumiscope air flow was adjusted at all times to provide
ca. 452-460 ml/min of sample air. At exactly 5-minute intervals, the air flow was changed to the alternate
side. This was repeated over 35 continuous. If the Fumiscope fluctuated between 0 and 1, the result was
charted as ±0.5 g/m3. If the result fluctuated between -0 and +0, the result was charted -0.2 g/m3, only to
illustrate small deviations from zero. This tabular adjustment was also applied to the second Ascarite test,
following.
Tests with Ascarite and 1.0% CO2. For the second test with Ascarite, as 40-liter gas bag with a
mixture of 1.0 % v/v CO2 was prepared. The air flow was alternated by switching between 1.0% CO2
supplied through a Hammond Tube/Ascarite tube (previously exposed to 1.0% CO2 for 5 min.) and
alternately through clean Drierite only by turning the 3-way valve at 5-minute intervals. The result was
paired tests with or without CO2 over 85 continuous minutes. This arrangement is shown in Figure 1c.
The method caused the Ascarite to scrub the CO2 during alternate 5-min. periods, so that the effect was
that the same Ascarite scrubbed the CO2 for a cumulative total of 45 min.
Tests with CO2 and common Ascarite. A third Ascarite test was devised in which a preparation of ca.
80 g/m3 MeBr and 1.0% CO2 v/v was supplied to the Fumiscope through two alternated Hammond tubes
(one used with gas mix, the other with fresh air) followed by a shared Ascarite tube positioned after the 3-
way vale proximal to the Fumiscope (Figure 1d). The gas flow was first supplied through Drierite,
zeroed through the used, and then supplied again but zeroed with fresh air and unused Drierite. This test
considered that a small Drierite tube did not contribute significantly to zeroing times, as shown in
previous tests, and that ambient (ca. 385 ppm, est. 0.44 g/m3 on a Fumiscope) CO2 would also be
scrubbed by the common Ascarite.
Results.
Tests with glass "Fumiscope" tubes. Figure 2 shows the effect on re-zero time when the air source
was supplied through the Drierite used to take fumigant readings compared with a fresh Drierite tube. In
this case, the Drierite tubes were the small glass tubes supplied with the Fumiscopes. Because of the
small volume, MeBr air was flushed quickly. Still, re-zero time was improved by about 1 minute, but
much less if outlier from first replicate was considered. The slightly delayed time to re-zero with used
Drierite was due mainly to the MeBr content of the tube purging, more than desorption of MeBr from
Drierite surfaces since Drierite capacity was small. With a small tube, practical when humidity is very
low, the benefit of clean air re-zeroing was not significant (Figure 3). Also, the response of the
Page 4 of 19
Fumiscope to actual gas concentrations was faster with the small tube, as less internal tube volume was
added to the input system and less Drierite was available to sorb MeBr.
Re-Zero with Hammond Drierite tube. Figure 4 shows the effect of using the larger capacity Drierite
tube during fumigation monitoring and re-zeroing. With a larger tube, the Fumiscope response to
supplied MeBr was not as rapid compared with the small tube, due to a larger internal volume of the
system and the longer time needed to purge fresh air. There was a large difference in time to re-zero
when Drierite used to monitor the MeBr was used compared with fresh air diverted to the Fumiscope
through a fresh Drierite tube. Re-zero readings of 0-1 were obtained in ca. 5 minutes, compared with ca.
2 minutes when fresh air and unused Drierite was used. Figure 5 directly compares the two methods of
re-zeroing. With the first replicate where used Drierite was in line, a Fumiscope value of 1.0 was reached
after 5:17 minutes. After 10:00 minutes the value was unchanged. Switching to fresh Drierite and air
immediately resulted in the reading going to zero, and when air was switched back to the used Drierite,
the Fumiscope again indicated 1.0, thus suggesting the effect of residual MeBr lingers. Switching to fresh
Drierite to zero the Fumiscope results in significantly reduced to zeroing time, which can be important in
taking sequential, timely readings.
Ascarite effect on zero. The chart in Figure 6 indicated that switching between Drierite/Ascarite and
Drierite only slightly increased Fumiscope readings. At one time (15 minutes) switching to Ascarite in-
line resulted in a jump to +2, but this I believe can be attributed to drift or a power fluctuation. After re-
zeroing after 20 minutes, the Fumiscope did not repeat the increase between 20 to 35 minutes with two
additional changes. This is discussed in the next paragraph.
Tests with Ascarite and 1.0% CO2. Considering that the Fumiscope was always zeroed at a reading of
"0", not "-0" there was a very small bias to read fractionally higher. The precision of the instrument is in
integers, therefore differences of 1-g/m3 or less during operation must not be considered as highly
significant. Further, periodic drift can account for small changes of less than 1-g/m3 over time. The data
in Figure 7 again show that switching sources to include had a slight effect on the zero readings.
Switching to Ascarite + CO2 usually resulted in a change in Fumiscope readings from 0/1 to 0 or -0. At
the 30-min mark the instrument read 1 g/m3, but the next switch did not result in a change. This suggests
the some internal drift had taken place. From 45 minutes through 85 minutes there was little change in
Fumiscope readings, and the Fumiscope was not re-zeroed during this time.
An additional factor is the presence of ca. 385 ppm (0.0385% v/v) CO2 naturally occurring in the
atmosphere. It has been shown that the Fumiscope responds to CO2, indicating about 11.5 g/m3 as MeBr
per 1% CO2. Natural CO2 at about 385 ppm should therefore contribute about 0.44 g/m3 to the
Fumiscope reading. It can be seen in Figure 7, that when supply air was switched from the
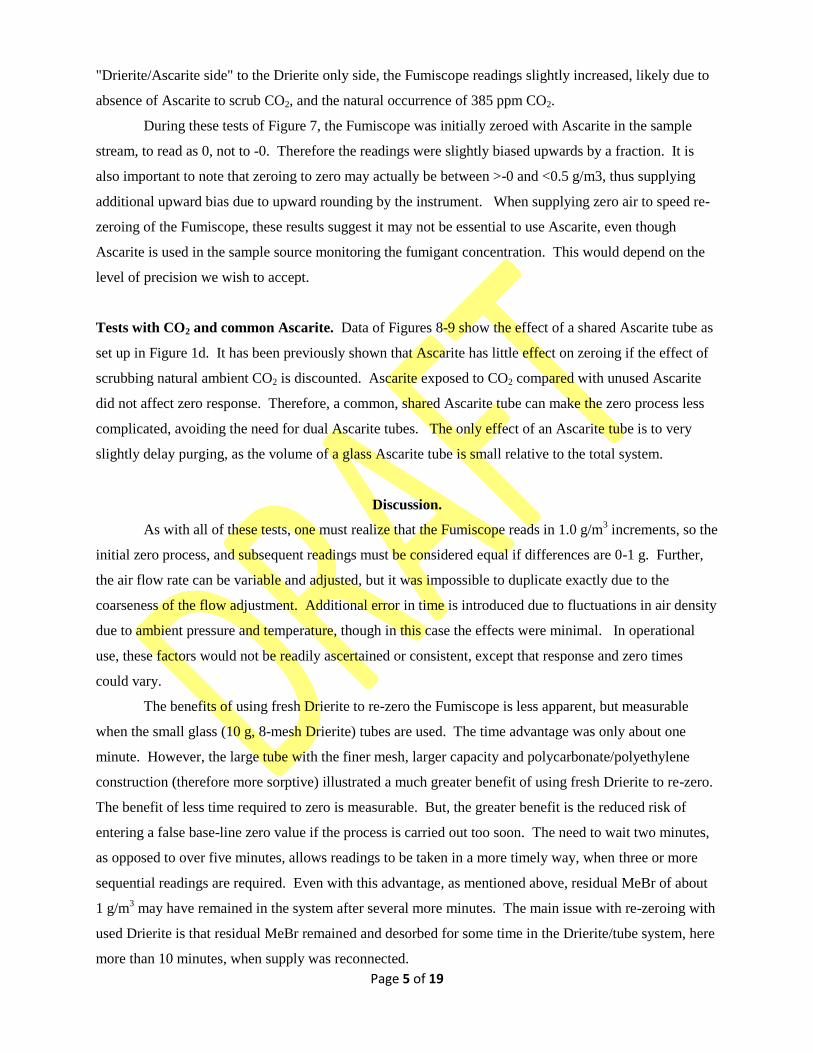
Page 5 of 19
"Drierite/Ascarite side" to the Drierite only side, the Fumiscope readings slightly increased, likely due to
absence of Ascarite to scrub CO2, and the natural occurrence of 385 ppm CO2.
During these tests of Figure 7, the Fumiscope was initially zeroed with Ascarite in the sample
stream, to read as 0, not to -0. Therefore the readings were slightly biased upwards by a fraction. It is
also important to note that zeroing to zero may actually be between >-0 and <0.5 g/m3, thus supplying
additional upward bias due to upward rounding by the instrument. When supplying zero air to speed re-
zeroing of the Fumiscope, these results suggest it may not be essential to use Ascarite, even though
Ascarite is used in the sample source monitoring the fumigant concentration. This would depend on the
level of precision we wish to accept.
Tests with CO2 and common Ascarite. Data of Figures 8-9 show the effect of a shared Ascarite tube as
set up in Figure 1d. It has been previously shown that Ascarite has little effect on zeroing if the effect of
scrubbing natural ambient CO2 is discounted. Ascarite exposed to CO2 compared with unused Ascarite
did not affect zero response. Therefore, a common, shared Ascarite tube can make the zero process less
complicated, avoiding the need for dual Ascarite tubes. The only effect of an Ascarite tube is to very
slightly delay purging, as the volume of a glass Ascarite tube is small relative to the total system.
Discussion.
As with all of these tests, one must realize that the Fumiscope reads in 1.0 g/m3 increments, so the
initial zero process, and subsequent readings must be considered equal if differences are 0-1 g. Further,
the air flow rate can be variable and adjusted, but it was impossible to duplicate exactly due to the
coarseness of the flow adjustment. Additional error in time is introduced due to fluctuations in air density
due to ambient pressure and temperature, though in this case the effects were minimal. In operational
use, these factors would not be readily ascertained or consistent, except that response and zero times
could vary.
The benefits of using fresh Drierite to re-zero the Fumiscope is less apparent, but measurable
when the small glass (10 g, 8-mesh Drierite) tubes are used. The time advantage was only about one
minute. However, the large tube with the finer mesh, larger capacity and polycarbonate/polyethylene
construction (therefore more sorptive) illustrated a much greater benefit of using fresh Drierite to re-zero.
The benefit of less time required to zero is measurable. But, the greater benefit is the reduced risk of
entering a false base-line zero value if the process is carried out too soon. The need to wait two minutes,
as opposed to over five minutes, allows readings to be taken in a more timely way, when three or more
sequential readings are required. Even with this advantage, as mentioned above, residual MeBr of about
1 g/m3 may have remained in the system after several more minutes. The main issue with re-zeroing with
used Drierite is that residual MeBr remained and desorbed for some time in the Drierite/tube system, here
more than 10 minutes, when supply was reconnected.
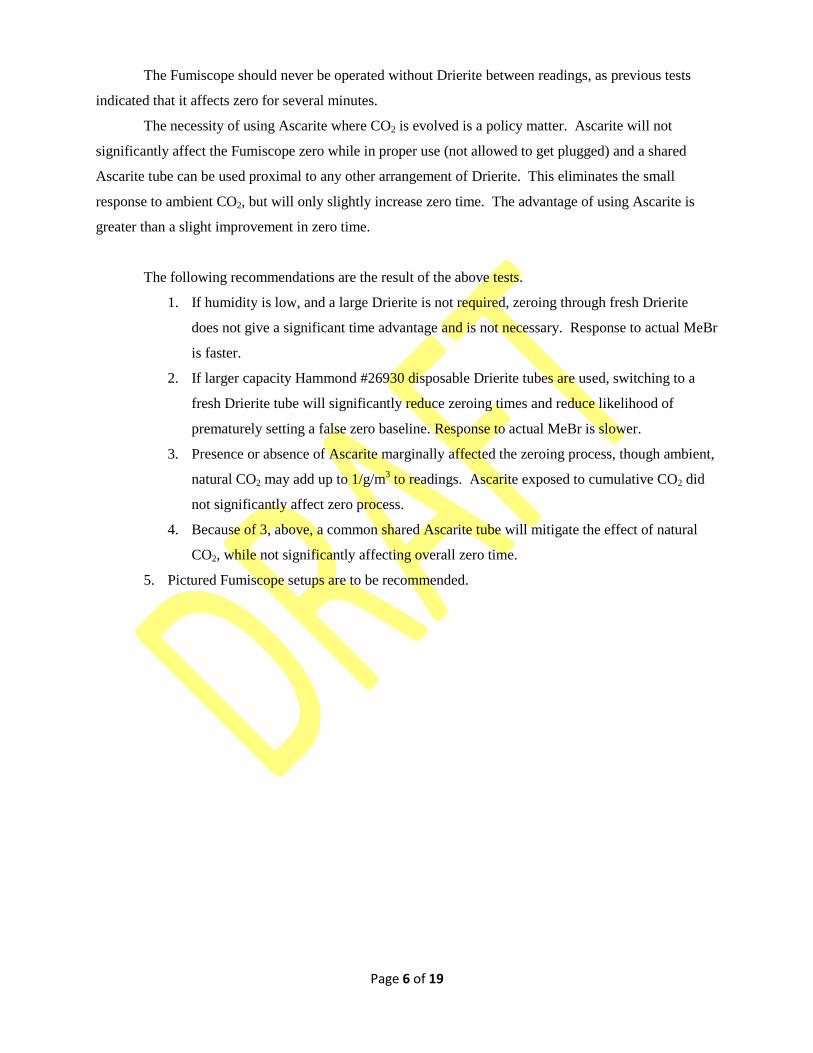
Page 6 of 19
The Fumiscope should never be operated without Drierite between readings, as previous tests
indicated that it affects zero for several minutes.
The necessity of using Ascarite where CO2 is evolved is a policy matter. Ascarite will not
significantly affect the Fumiscope zero while in proper use (not allowed to get plugged) and a shared
Ascarite tube can be used proximal to any other arrangement of Drierite. This eliminates the small
response to ambient CO2, but will only slightly increase zero time. The advantage of using Ascarite is
greater than a slight improvement in zero time.
The following recommendations are the result of the above tests.
1. If humidity is low, and a large Drierite is not required, zeroing through fresh Drierite
does not give a significant time advantage and is not necessary. Response to actual MeBr
is faster.
2. If larger capacity Hammond #26930 disposable Drierite tubes are used, switching to a
fresh Drierite tube will significantly reduce zeroing times and reduce likelihood of
prematurely setting a false zero baseline. Response to actual MeBr is slower.
3. Presence or absence of Ascarite marginally affected the zeroing process, though ambient,
natural CO2 may add up to 1/g/m3 to readings. Ascarite exposed to cumulative CO2 did
not significantly affect zero process.
4. Because of 3, above, a common shared Ascarite tube will mitigate the effect of natural
CO2, while not significantly affecting overall zero time.
5. Pictured Fumiscope setups are to be recommended.
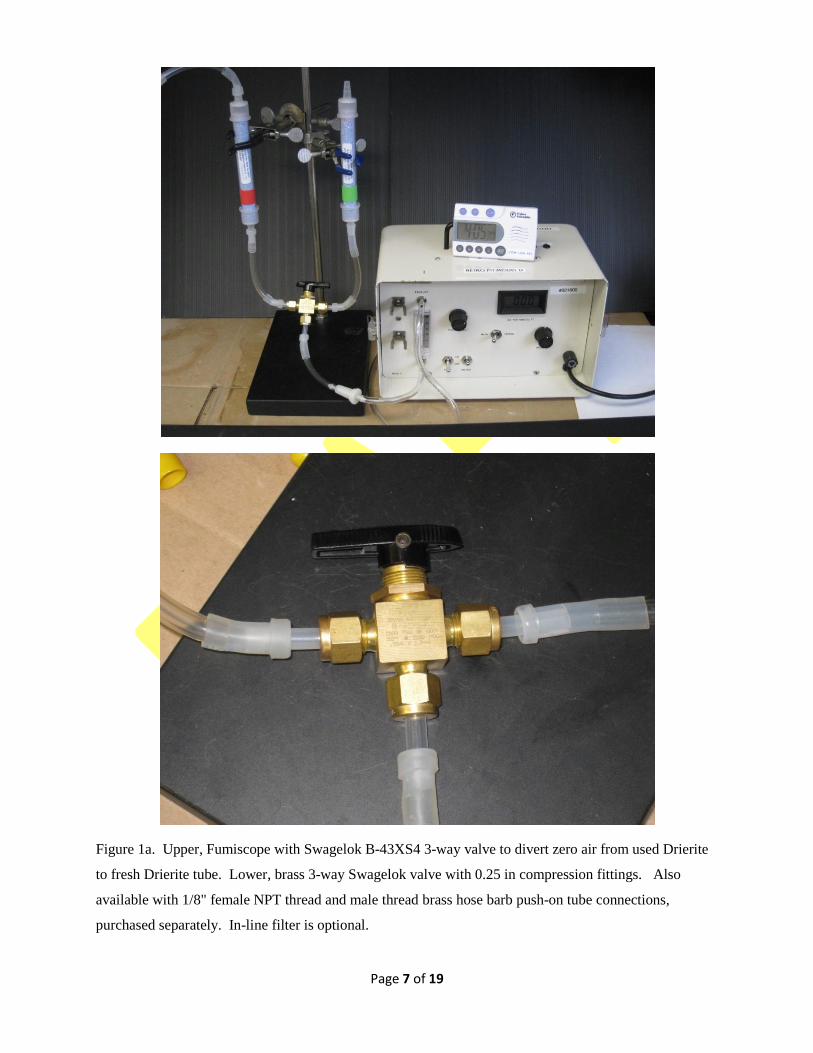
Page 7 of 19
Figure 1a. Upper, Fumiscope with Swagelok B-43XS4 3-way valve to divert zero air from used Drierite
to fresh Drierite tube. Lower, brass 3-way Swagelok valve with 0.25 in compression fittings. Also
available with 1/8" female NPT thread and male thread brass hose barb push-on tube connections,
purchased separately. In-line filter is optional.

Page 8 of 19
Figure 1b. Upper, Fumiscope with Swagelok B-43XS4 3-way valve to divert zero air from used Drierite
to fresh Drierite tube. Lower, brass 3-way Swagelok valve with 0.25 in compression fittings. Secure
connections were made with silicone 3/16 inch ID tube, which is easily cut and very flexible.
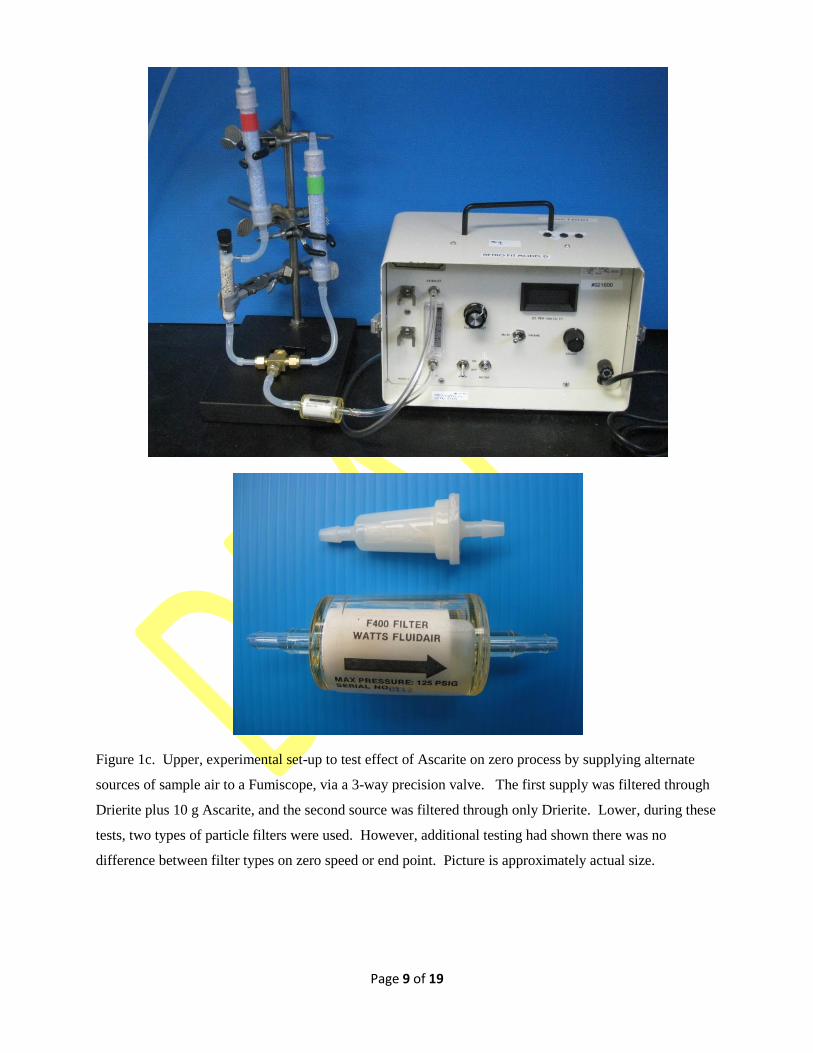
Page 9 of 19
Figure 1c. Upper, experimental set-up to test effect of Ascarite on zero process by supplying alternate
sources of sample air to a Fumiscope, via a 3-way precision valve. The first supply was filtered through
Drierite plus 10 g Ascarite, and the second source was filtered through only Drierite. Lower, during these
tests, two types of particle filters were used. However, additional testing had shown there was no
difference between filter types on zero speed or end point. Picture is approximately actual size.

Page 10 of 19
Figure 1d. Upper, Fumiscope with Swagelok B-43XS4 3-way valve to divert zero air from used Drierite
to fresh Drierite tube with common Ascarite-II tube. Lower, brass 3-way Swagelok valve, with post-
Drierite, shared glass tube containing 10 g of 8-10 mesh Ascarite-II.
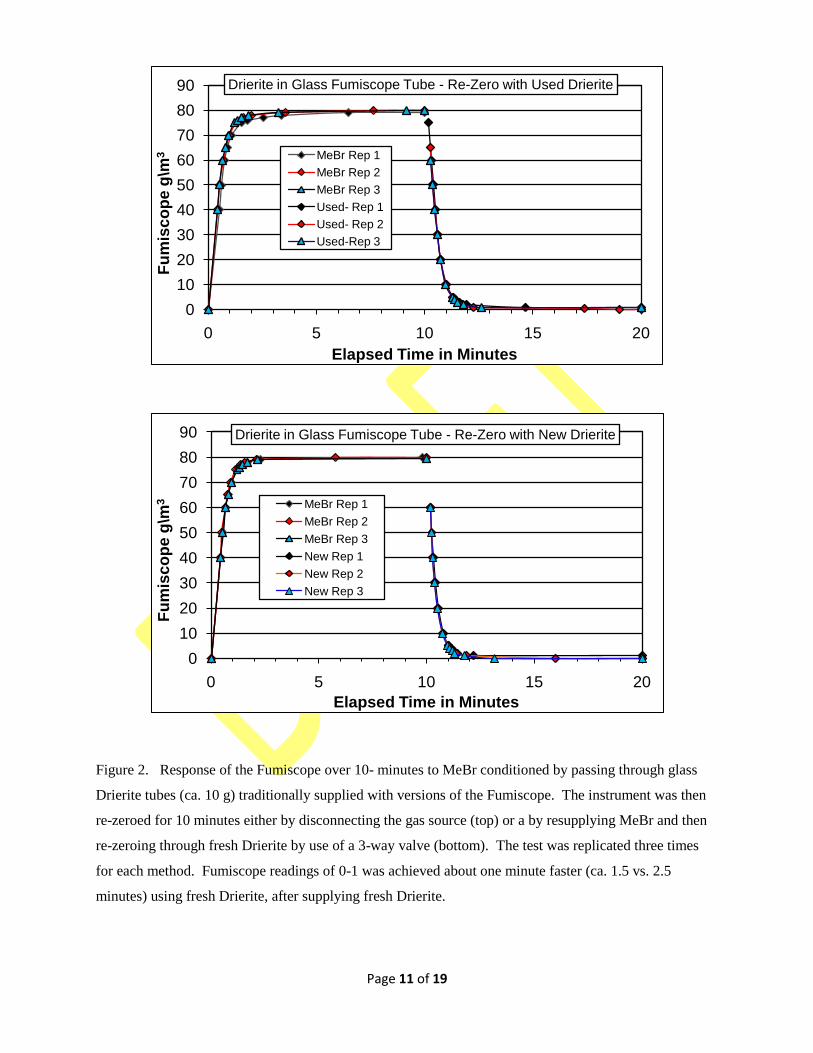
Page 11 of 19
Figure 2. Response of the Fumiscope over 10- minutes to MeBr conditioned by passing through glass
Drierite tubes (ca. 10 g) traditionally supplied with versions of the Fumiscope. The instrument was then
re-zeroed for 10 minutes either by disconnecting the gas source (top) or a by resupplying MeBr and then
re-zeroing through fresh Drierite by use of a 3-way valve (bottom). The test was replicated three times
for each method. Fumiscope readings of 0-1 was achieved about one minute faster (ca. 1.5 vs. 2.5
minutes) using fresh Drierite, after supplying fresh Drierite.
0
10
20
30
40
50
60
70
80
90
0 5 10 15 20
Fu
mis
co
pe g
\m3
Elapsed Time in Minutes
Drierite in Glass Fumiscope Tube - Re-Zero with Used Drierite
MeBr Rep 1
MeBr Rep 2
MeBr Rep 3
Used- Rep 1
Used- Rep 2
Used-Rep 3
0
10
20
30
40
50
60
70
80
90
0 5 10 15 20
Fu
mis
co
pe g
\m3
Elapsed Time in Minutes
Drierite in Glass Fumiscope Tube - Re-Zero with New Drierite
MeBr Rep 1
MeBr Rep 2
MeBr Rep 3
New Rep 1
New Rep 2
New Rep 3
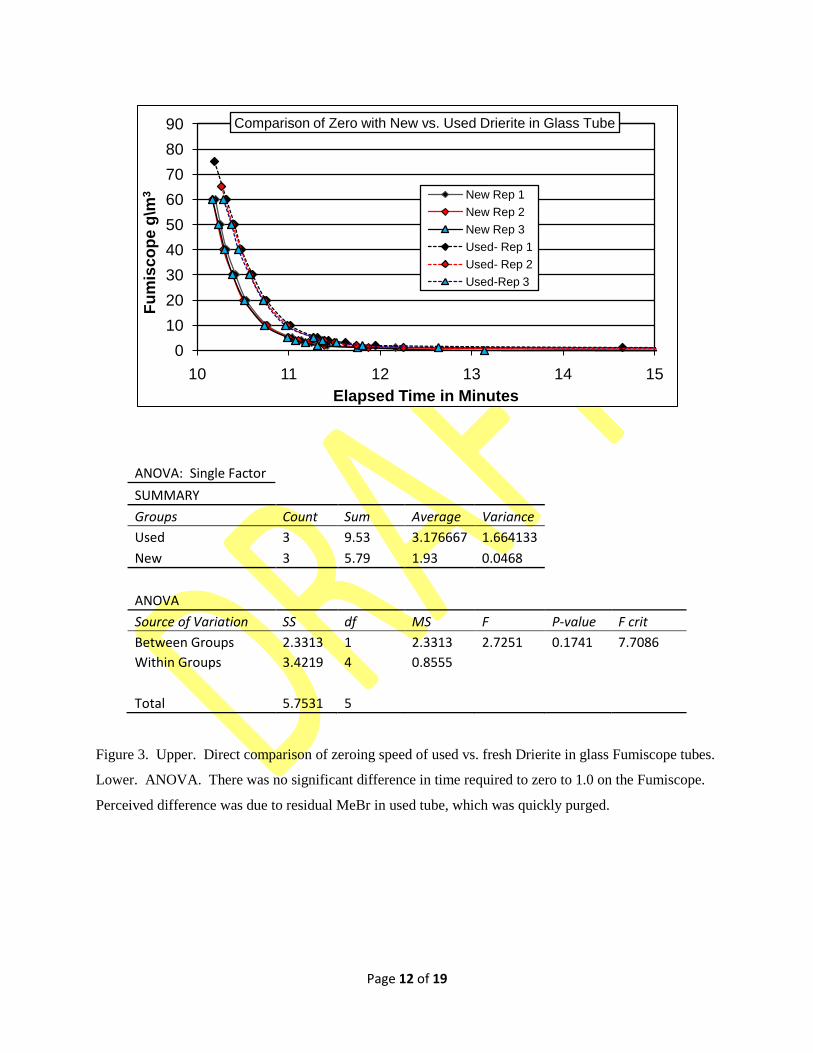
Page 12 of 19
ANOVA: Single Factor SUMMARY Groups Count Sum Average Variance
Used 3 9.53 3.176667 1.664133 New 3 5.79 1.93 0.0468
ANOVA Source of Variation SS df MS F P-value F crit
Between Groups 2.3313 1 2.3313 2.7251 0.1741 7.7086
Within Groups 3.4219 4 0.8555
Total 5.7531 5
Figure 3. Upper. Direct comparison of zeroing speed of used vs. fresh Drierite in glass Fumiscope tubes.
Lower. ANOVA. There was no significant difference in time required to zero to 1.0 on the Fumiscope.
Perceived difference was due to residual MeBr in used tube, which was quickly purged.
0
10
20
30
40
50
60
70
80
90
10 11 12 13 14 15
Fu
mis
co
pe g
\m3
Elapsed Time in Minutes
Comparison of Zero with New vs. Used Drierite in Glass Tube
New Rep 1
New Rep 2
New Rep 3
Used- Rep 1
Used- Rep 2
Used-Rep 3
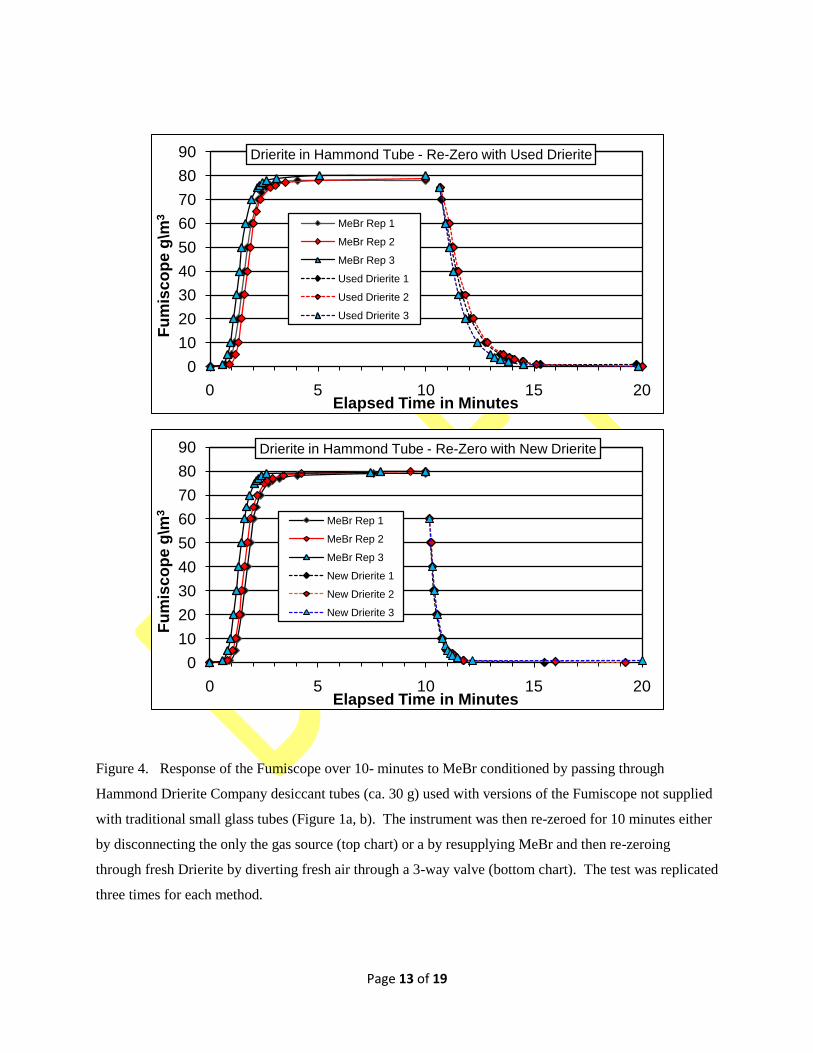
Page 13 of 19
Figure 4. Response of the Fumiscope over 10- minutes to MeBr conditioned by passing through
Hammond Drierite Company desiccant tubes (ca. 30 g) used with versions of the Fumiscope not supplied
with traditional small glass tubes (Figure 1a, b). The instrument was then re-zeroed for 10 minutes either
by disconnecting the only the gas source (top chart) or a by resupplying MeBr and then re-zeroing
through fresh Drierite by diverting fresh air through a 3-way valve (bottom chart). The test was replicated
three times for each method.
0
10
20
30
40
50
60
70
80
90
0 5 10 15 20
Fu
mis
co
pe g
\m3
Elapsed Time in Minutes
Drierite in Hammond Tube - Re-Zero with Used Drierite
MeBr Rep 1
MeBr Rep 2
MeBr Rep 3
Used Drierite 1
Used Drierite 2
Used Drierite 3
0
10
20
30
40
50
60
70
80
90
0 5 10 15 20
Fu
mis
co
pe g
\m3
Elapsed Time in Minutes
Drierite in Hammond Tube - Re-Zero with New Drierite
MeBr Rep 1
MeBr Rep 2
MeBr Rep 3
New Drierite 1
New Drierite 2
New Drierite 3
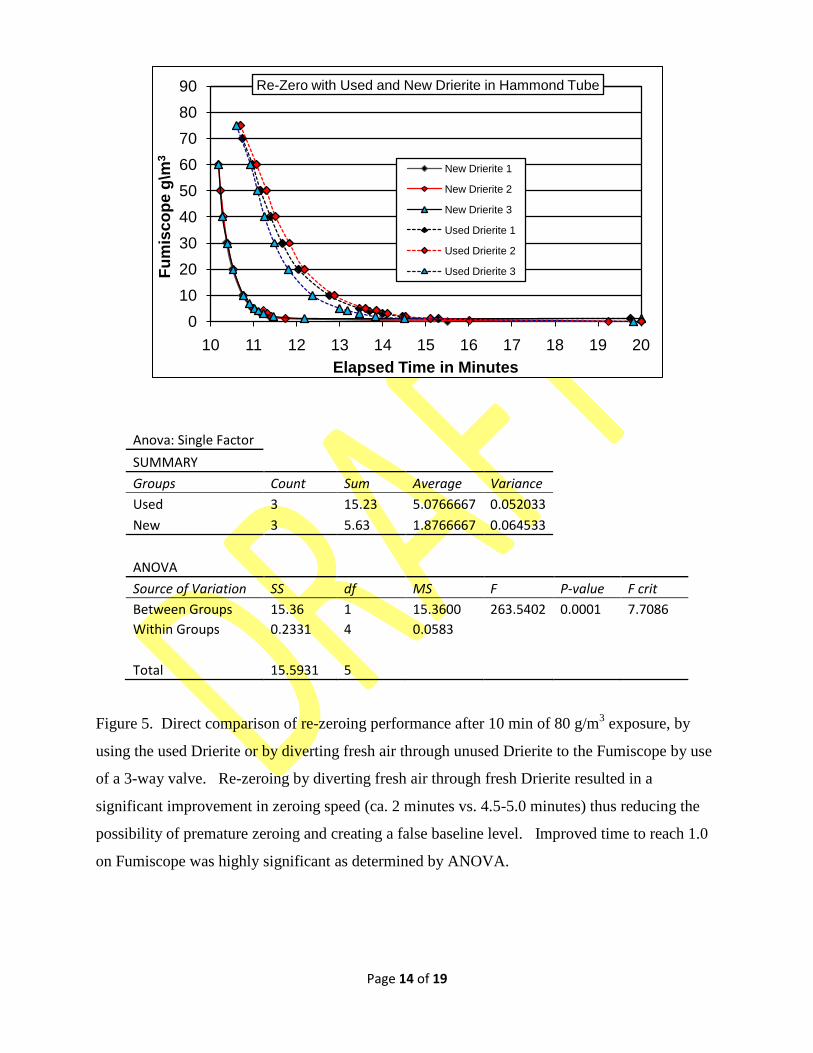
Page 14 of 19
Anova: Single Factor SUMMARY Groups Count Sum Average Variance
Used 3 15.23 5.0766667 0.052033 New 3 5.63 1.8766667 0.064533
ANOVA Source of Variation SS df MS F P-value F crit
Between Groups 15.36 1 15.3600 263.5402 0.0001 7.7086
Within Groups 0.2331 4 0.0583
Total 15.5931 5
Figure 5. Direct comparison of re-zeroing performance after 10 min of 80 g/m3 exposure, by
using the used Drierite or by diverting fresh air through unused Drierite to the Fumiscope by use
of a 3-way valve. Re-zeroing by diverting fresh air through fresh Drierite resulted in a
significant improvement in zeroing speed (ca. 2 minutes vs. 4.5-5.0 minutes) thus reducing the
possibility of premature zeroing and creating a false baseline level. Improved time to reach 1.0
on Fumiscope was highly significant as determined by ANOVA.
0
10
20
30
40
50
60
70
80
90
10 11 12 13 14 15 16 17 18 19 20
Fu
mis
co
pe g
\m3
Elapsed Time in Minutes
Re-Zero with Used and New Drierite in Hammond Tube
New Drierite 1
New Drierite 2
New Drierite 3
Used Drierite 1
Used Drierite 2
Used Drierite 3
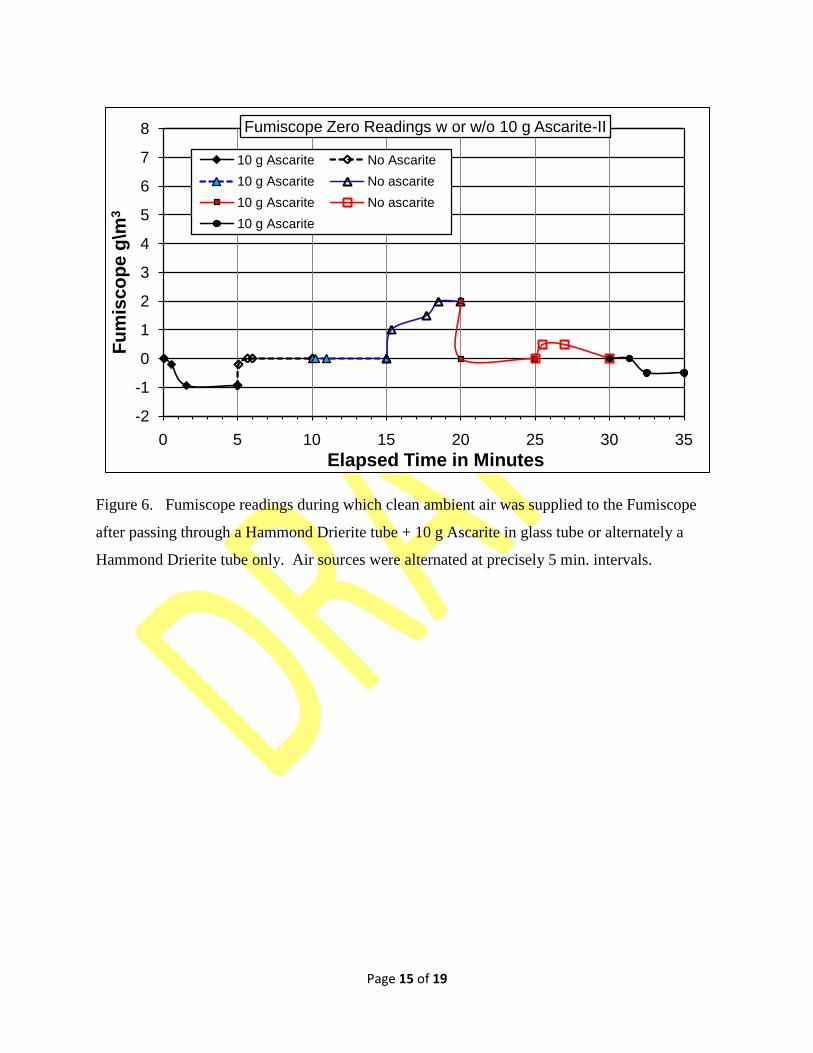
Page 15 of 19
Figure 6. Fumiscope readings during which clean ambient air was supplied to the Fumiscope
after passing through a Hammond Drierite tube + 10 g Ascarite in glass tube or alternately a
Hammond Drierite tube only. Air sources were alternated at precisely 5 min. intervals.
-2
-1
0
1
2
3
4
5
6
7
8
0 5 10 15 20 25 30 35
Fu
mis
co
pe g
\m3
Elapsed Time in Minutes
Fumiscope Zero Readings w or w/o 10 g Ascarite-II
10 g Ascarite No Ascarite
10 g Ascarite No ascarite
10 g Ascarite No ascarite
10 g Ascarite
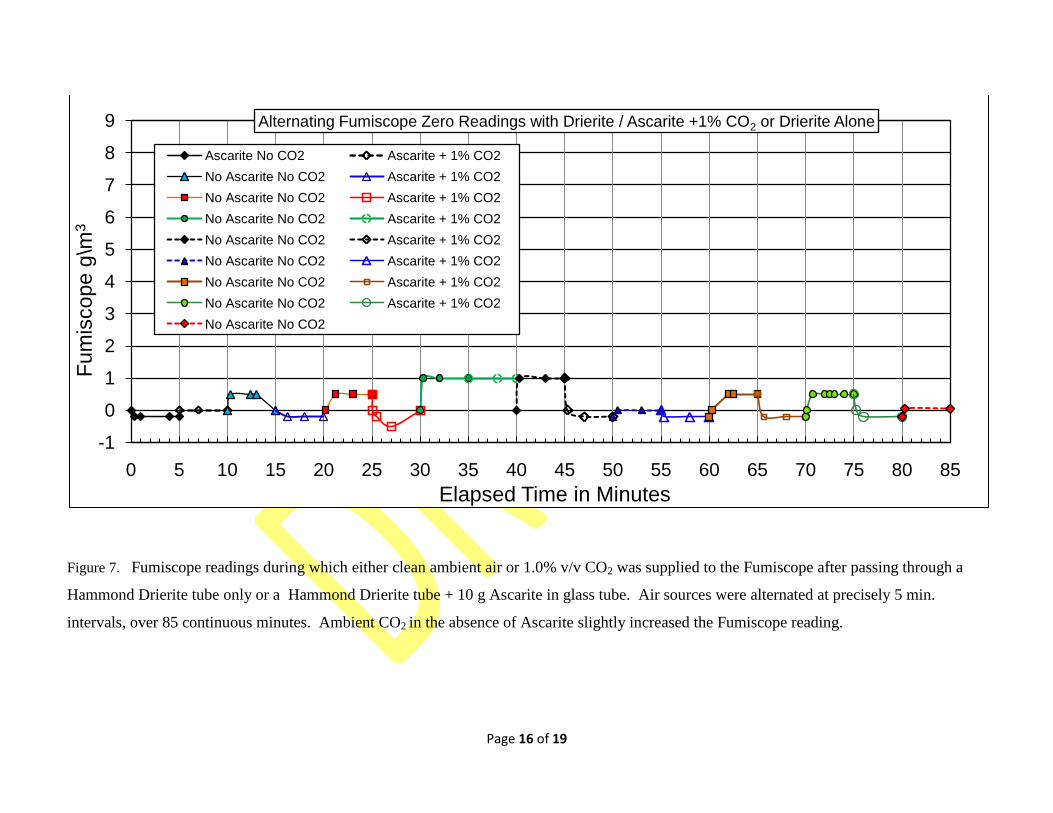
Page 16 of 19
Figure 7. Fumiscope readings during which either clean ambient air or 1.0% v/v CO2 was supplied to the Fumiscope after passing through a
Hammond Drierite tube only or a Hammond Drierite tube + 10 g Ascarite in glass tube. Air sources were alternated at precisely 5 min.
intervals, over 85 continuous minutes. Ambient CO2 in the absence of Ascarite slightly increased the Fumiscope reading.
-1
0
1
2
3
4
5
6
7
8
9
0 5 10 15 20 25 30 35 40 45 50 55 60 65 70 75 80 85
Fum
iscope g
\m3
Elapsed Time in Minutes
Alternating Fumiscope Zero Readings with Drierite / Ascarite +1% CO2 or Drierite Alone
Ascarite No CO2 Ascarite + 1% CO2
No Ascarite No CO2 Ascarite + 1% CO2
No Ascarite No CO2 Ascarite + 1% CO2
No Ascarite No CO2 Ascarite + 1% CO2
No Ascarite No CO2 Ascarite + 1% CO2
No Ascarite No CO2 Ascarite + 1% CO2
No Ascarite No CO2 Ascarite + 1% CO2
No Ascarite No CO2 Ascarite + 1% CO2
No Ascarite No CO2
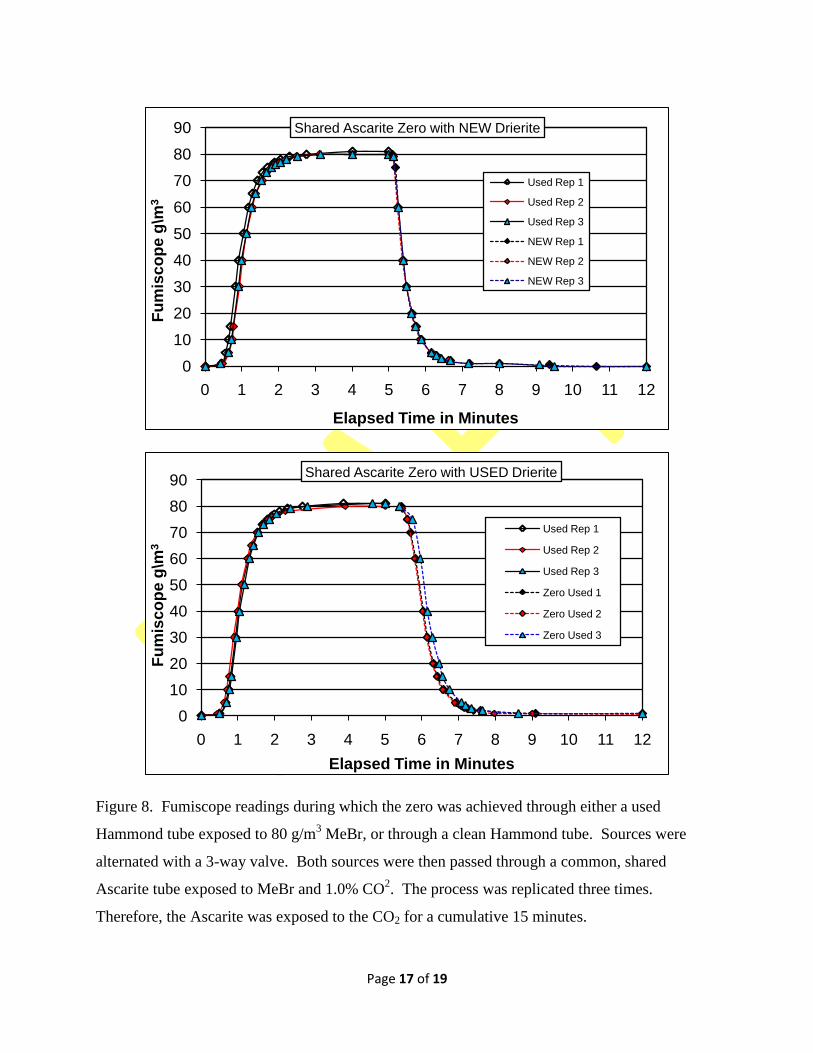
Page 17 of 19
Figure 8. Fumiscope readings during which the zero was achieved through either a used
Hammond tube exposed to 80 g/m3 MeBr, or through a clean Hammond tube. Sources were
alternated with a 3-way valve. Both sources were then passed through a common, shared
Ascarite tube exposed to MeBr and 1.0% CO2. The process was replicated three times.
Therefore, the Ascarite was exposed to the CO2 for a cumulative 15 minutes.
0
10
20
30
40
50
60
70
80
90
0 1 2 3 4 5 6 7 8 9 10 11 12
Fu
mis
co
pe g
\m3
Elapsed Time in Minutes
Shared Ascarite Zero with NEW Drierite
Used Rep 1
Used Rep 2
Used Rep 3
NEW Rep 1
NEW Rep 2
NEW Rep 3
0
10
20
30
40
50
60
70
80
90
0 1 2 3 4 5 6 7 8 9 10 11 12
Fu
mis
co
pe g
\m3
Elapsed Time in Minutes
Shared Ascarite Zero with USED Drierite
Used Rep 1
Used Rep 2
Used Rep 3
Zero Used 1
Zero Used 2
Zero Used 3
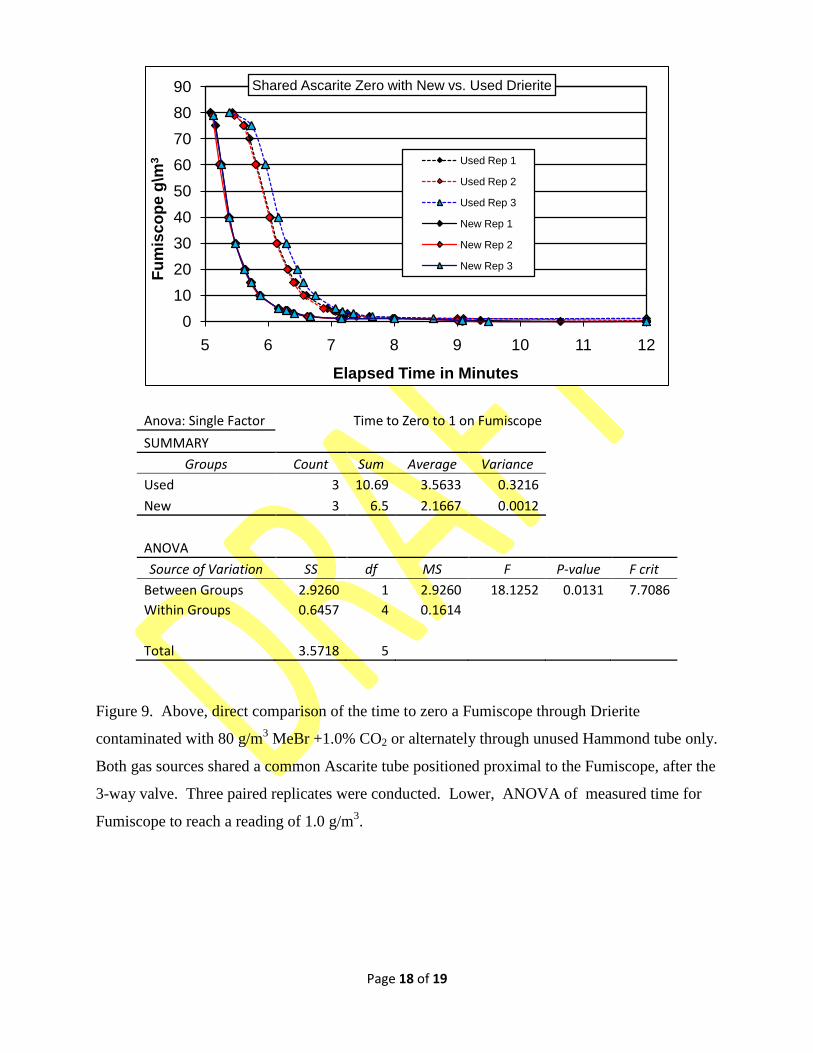
Page 18 of 19
Anova: Single Factor
Time to Zero to 1 on Fumiscope SUMMARY
Groups Count Sum Average Variance Used 3 10.69 3.5633 0.3216 New 3 6.5 2.1667 0.0012
ANOVA Source of Variation SS df MS F P-value F crit
Between Groups 2.9260 1 2.9260 18.1252 0.0131 7.7086
Within Groups 0.6457 4 0.1614
Total 3.5718 5
Figure 9. Above, direct comparison of the time to zero a Fumiscope through Drierite
contaminated with 80 g/m3 MeBr +1.0% CO2 or alternately through unused Hammond tube only.
Both gas sources shared a common Ascarite tube positioned proximal to the Fumiscope, after the
3-way valve. Three paired replicates were conducted. Lower, ANOVA of measured time for
Fumiscope to reach a reading of 1.0 g/m3.
0
10
20
30
40
50
60
70
80
90
5 6 7 8 9 10 11 12
Fu
mis
co
pe g
\m3
Elapsed Time in Minutes
Shared Ascarite Zero with New vs. Used Drierite
Used Rep 1
Used Rep 2
Used Rep 3
New Rep 1
New Rep 2
New Rep 3

Page 19 of 19