ASBESTOS SAMPLING & ANALYSIS - Trainex · PDF fileASBESTOS SAMPLING & ANALYSIS Collection...
32
1 ASBESTOS SAMPLING & ANALYSIS Collection Preparation Analysis Instruments Methods and Counting Rules
-
Upload
truongdiep -
Category
Documents
-
view
218 -
download
1
Transcript of ASBESTOS SAMPLING & ANALYSIS - Trainex · PDF fileASBESTOS SAMPLING & ANALYSIS Collection...
1
ASBESTOS SAMPLING & ANALYSIS
CollectionPreparation
Analysis Instruments
Methods and Counting Rules
2
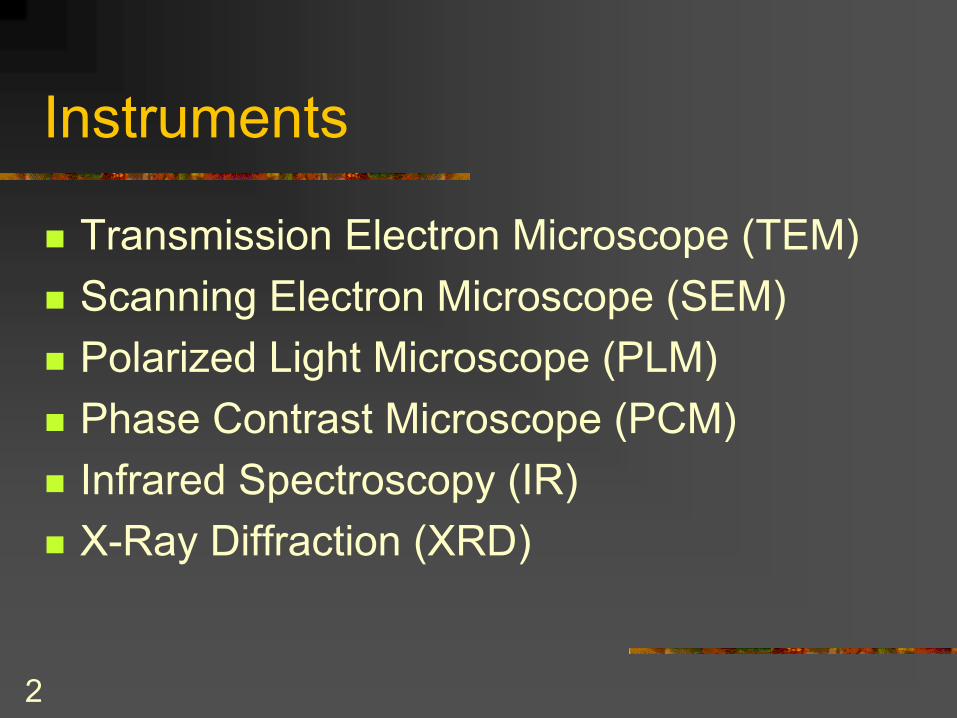
Instruments
! Transmission Electron Microscope (TEM)! Scanning Electron Microscope (SEM)! Polarized Light Microscope (PLM)! Phase Contrast Microscope (PCM)! Infrared Spectroscopy (IR)! X-Ray Diffraction (XRD)
3
Sample Collection, Preparation, and Analysis
! Soil! Bulk! Air! Dust
4
Collection of Soil Samples
! Collection No Different Than for Other Contaminants
! Typically Heterogeneous, Depends on Nature of Contaminant Source
! Take Appropriate Respiratory Protection ! Percent Asbestos by Weight
5
Soil Sample Preparation
! Need to Know Purpose of Samples Up Front! Pick Out Large Bundles/Chunks For Weighing,
Usually Under a Stereo-Microscope! Homogenize Sample! Regardless of the Instrument to be Used
Grinding Will Give the Most Accurate and Consistent Sample Data, But�
6
More Soil Preparation
! Grinding Will Compromise Morphological Information
! Grinding May Alter Mineral Habit (e.g. Bundles vs. Free Fibers)
! Grinding May Create Cleavage Fragments! Therefore, Qualitative Morphological
Assessment Should be Done Separate From Quantitative Analysis
7
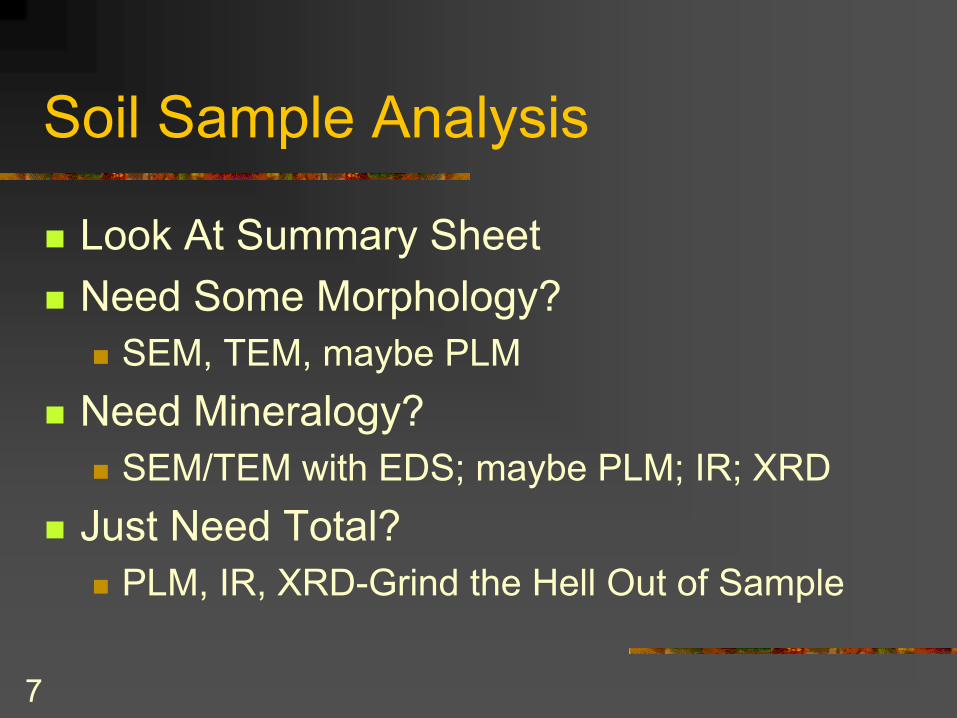
Soil Sample Analysis
! Look At Summary Sheet! Need Some Morphology?
! SEM, TEM, maybe PLM ! Need Mineralogy?
! SEM/TEM with EDS; maybe PLM; IR; XRD! Just Need Total?
! PLM, IR, XRD-Grind the Hell Out of Sample

8
PLM Microscope
9
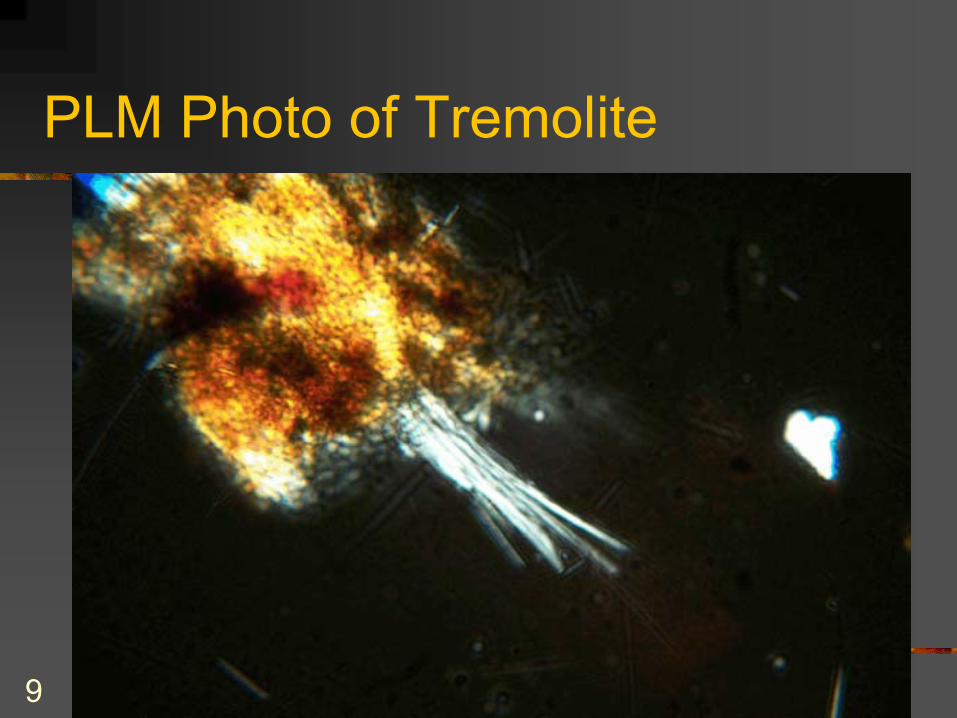
PLM Photo of Tremolite
10
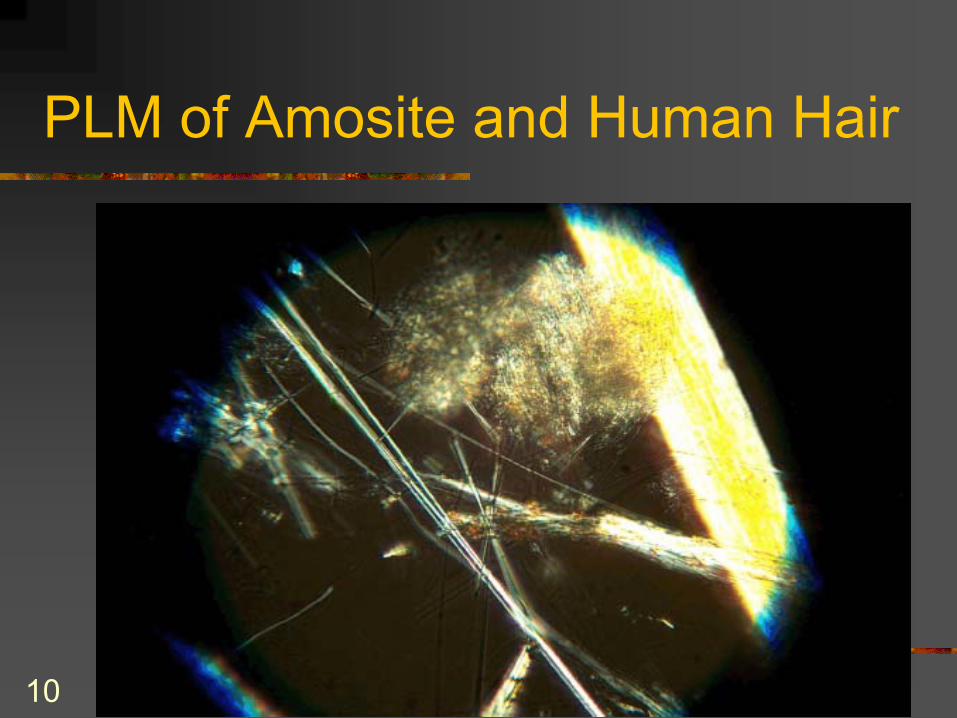
PLM of Amosite and Human Hair
11
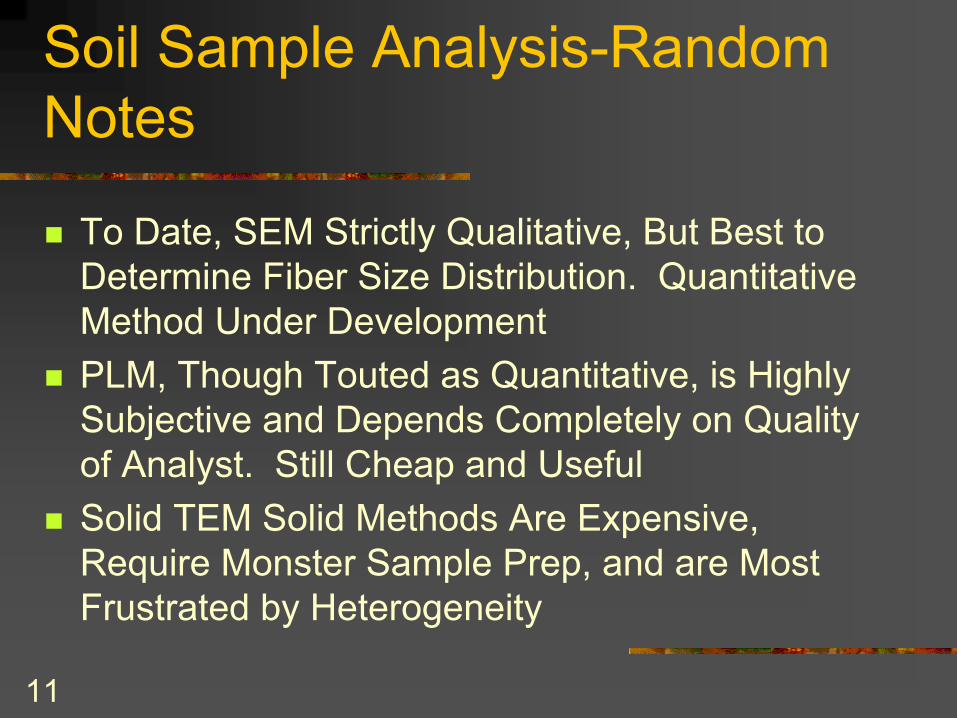
Soil Sample Analysis-Random Notes
! To Date, SEM Strictly Qualitative, But Best to Determine Fiber Size Distribution. Quantitative Method Under Development
! PLM, Though Touted as Quantitative, is Highly Subjective and Depends Completely on Quality of Analyst. Still Cheap and Useful
! Solid TEM Solid Methods Are Expensive, Require Monster Sample Prep, and are Most Frustrated by Heterogeneity
12
Collection of Bulk Samples
! Building Materials/Insulation! Material is Usually Homogeneous! Grab Samples Usually Used! May Involve Cutting of Discrete Section! Percent Asbestos by Weight
13
Preparation/Analysis of Bulk Samples
! Analogous to Soil Samples
14
Air Sample Collection
! All Involve a Pump Pulling Air Across a Filter, With the Prepared Filter Going Under the Instrument (f/cc)
! Three Basic Types! Stationary
! Passive, Active! Personnel! AHERA Clearance (see Part 763)
15
More Air Sample Collection
! The More Air Pulled Through, the Lower the Detection Level
! However, Depending on Site Conditions (e.g. dust) Large Sample Volumes May Produce Unreadable Samples
! Normal Ambient Conditions 4000L Collected at <12 /min is Practical Maximum
! Under Site Work Conditions, or Dusty Environments 1200 L is Usual Maximum, Sometimes 80 L is Maximum
16
More Air Sample Collection
! Sampling in Wet and/or Windy Conditions Not Advisable
! Pump Flow Rates Should Not Exceed 12-15 L/min
17
Air Sample Preparation
! A Small Sliver of Cassette Filter is Cut and Then Viewed for Opacity
! If Opacity Low (<10-25%) Then Sample is Sent for Direct Preparation
! If Opacity is High (>10-25%) Then Sample is Sent for Indirect Preparation
18
Direct Preparation
! The Sample Sliver is Etched! Sealed in Silicon! Mounted on a Specimen Grid! Put Into the Microscope
19
Indirect Preparation
! A Portion (typically ¼) of the Original is Cut Out, Dissolved or Ashed
! This Portion of Sample is Suspended in Liquid and Then Re-filtered
! Then the Direct Preparation Procedures Followed
20
About Air Sample Cassettes
! Only a Tiny Portion (typically 1/3700) of the Sample Viewed Under the Microscope
! Distribution of Fibers on Cassette is Not Uniform, Thought to be Either Poisson or Negative-Binomial Distribution
! Thus Typical Analyses Are Inherently Subject to Great Statistical Variation
21
Indirect Pros and Cons
! Pros! Allows information to be garnered from otherwise
unreadable samples! Generates nearly uniform distribution of fibers on
filters! Cons
! Involves large dilution of sample! Likely looses some material in sample prep! Possibly alters morphology and mineral habit
22
Air Sample Analysis
! PCM! NIOSH 7400
! TEM! NIOSH 7402! ISO 10-312! Yamate! AHERA
23
PCM Analysis
! Normally 250-400x! Can�t Distinguish Between Cat Hair and
Asbestos! Near Useless in Environmental/ Residential
Settings! Provides No Mineralogy! Required by OSHA for Health And Safety! Can Resolve only Fibers >5um long/ >0.25 um
wide
24
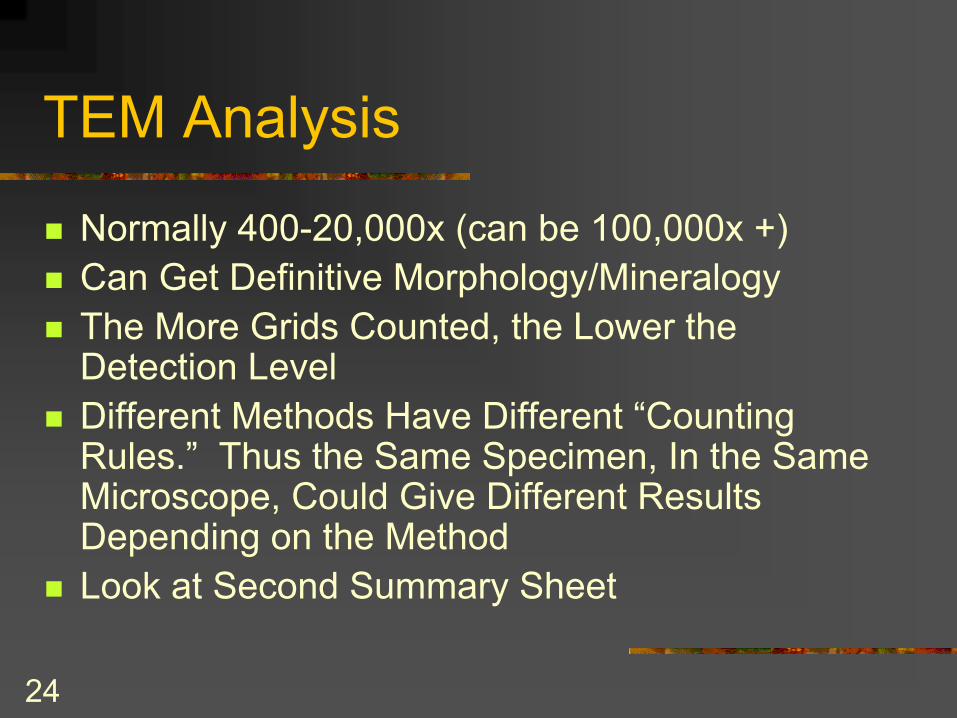
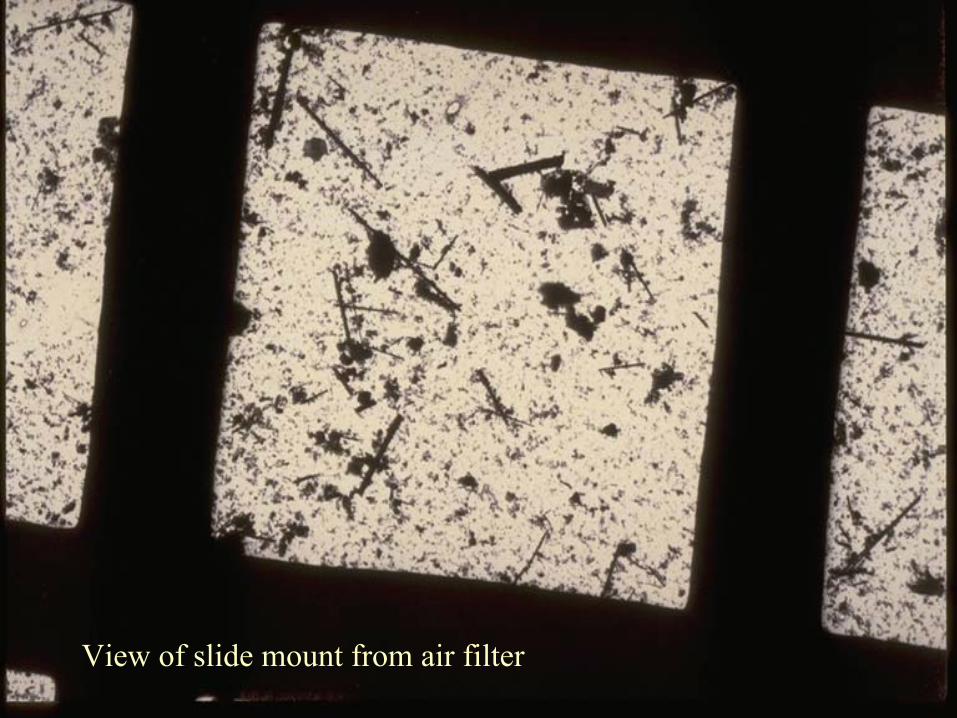
TEM Analysis
! Normally 400-20,000x (can be 100,000x +)! Can Get Definitive Morphology/Mineralogy! The More Grids Counted, the Lower the
Detection Level! Different Methods Have Different �Counting
Rules.� Thus the Same Specimen, In the Same Microscope, Could Give Different Results Depending on the Method
! Look at Second Summary Sheet
View of slide mount from air filter
26
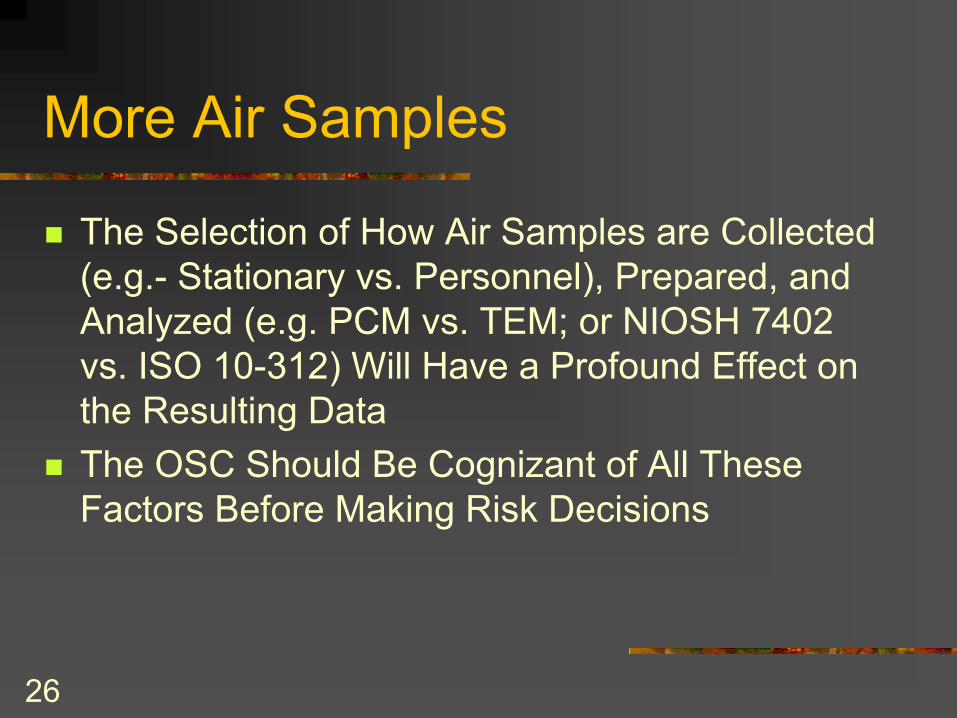
More Air Samples
! The Selection of How Air Samples are Collected (e.g.- Stationary vs. Personnel), Prepared, and Analyzed (e.g. PCM vs. TEM; or NIOSH 7402 vs. ISO 10-312) Will Have a Profound Effect on the Resulting Data
! The OSC Should Be Cognizant of All These Factors Before Making Risk Decisions
27
IndoorPersonal
IndoorPersonal
IndoorPersonal
0
0.1
0.2
0.3
0.4
0.5
0.6
Co
nce
ntr
atio
n (
Stru
ctur
es/c
c)
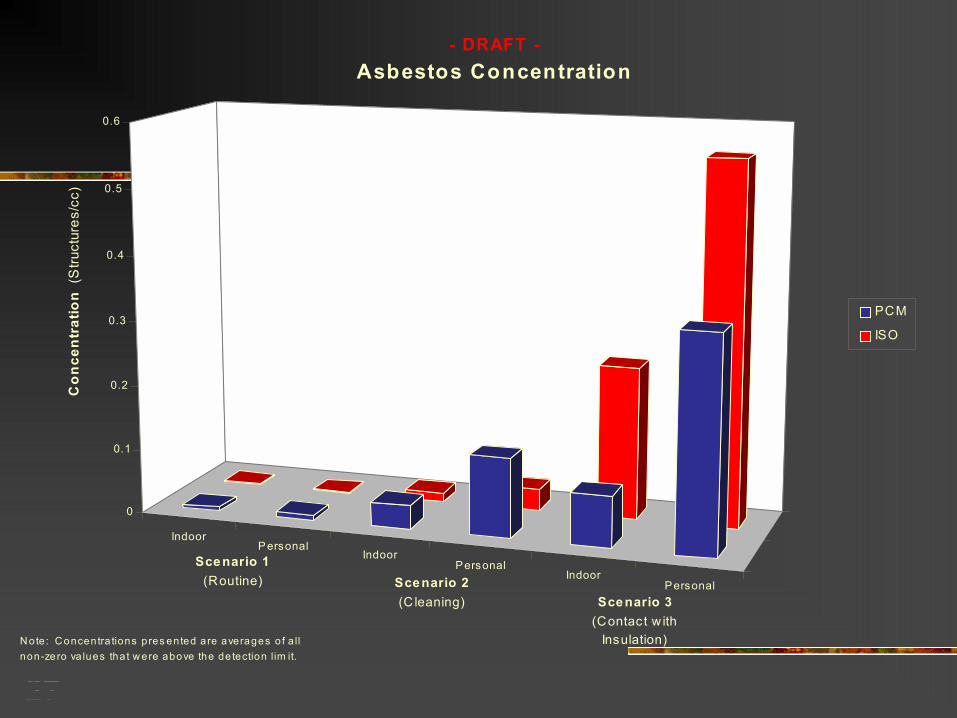
- DRAFT -Asbestos Concentration
PCM
ISO
Sce nario 1 (Routine) Scenario 2
(C leaning) Scenario 3 (Contac t w ith
Insulation)N ote: C oncentra tions p res ented are averages o f a ll non-zero va lues tha t w ere above the de tection lim it.
28
00.10.20.30.40.50.7511.251.5
0
2
5
10
15
0
5
10
15
20
25
30
35
40
Count
Width
Length
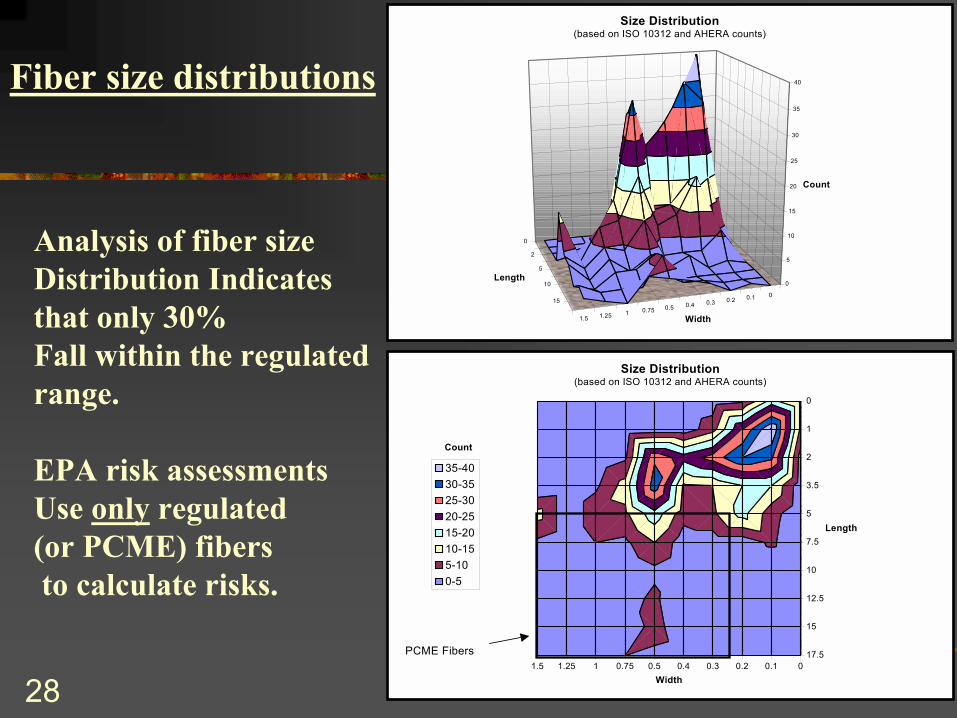
Size Distribution(based on ISO 10312 and AHERA counts)
00.10.20.30.40.50.7511.251.5
0
1
2
3.5
5
7.5
10
12.5
15
17.5
Count
Width
Length
Size Distribution(based on ISO 10312 and AHERA counts)
35-4030-3525-3020-2515-2010-155-100-5
PCME Fibers
Analysis of fiber sizeDistribution Indicates that only 30%Fall within the regulated range.
EPA risk assessments Use only regulated(or PCME) fibersto calculate risks.
Fiber size distributions
29
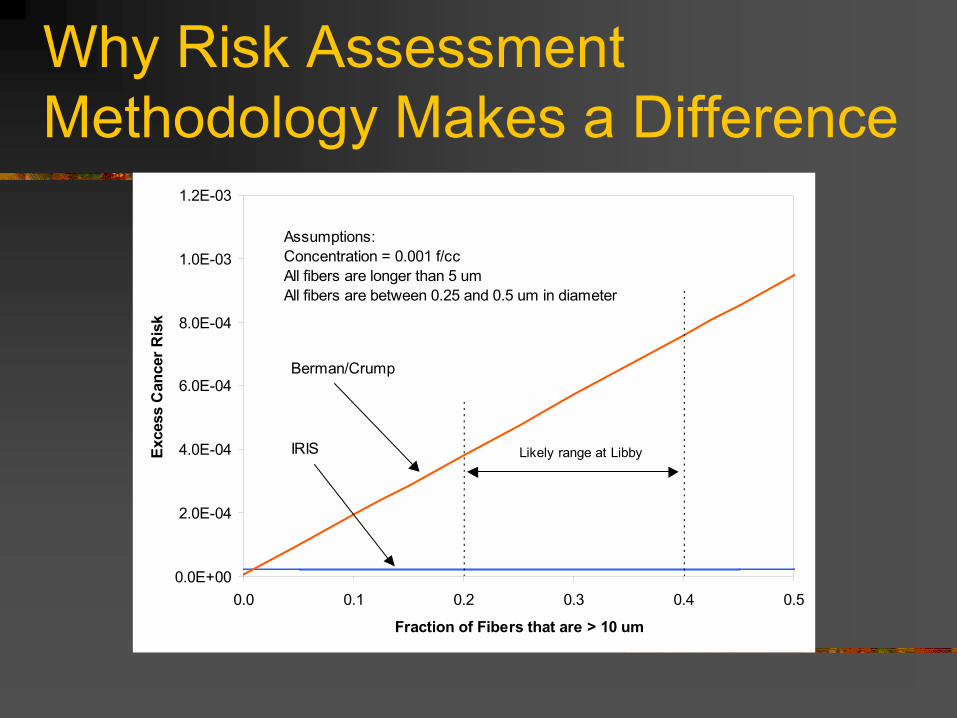
Why Risk Assessment Methodology Makes a Difference
0.0E+00
2.0E-04
4.0E-04
6.0E-04
8.0E-04
1.0E-03
1.2E-03
0.0 0.1 0.2 0.3 0.4 0.5
Fraction of Fibers that are > 10 um
Exce
ss C
ance
r Ris
k
Assumptions:Concentration = 0.001 f/ccAll fibers are longer than 5 umAll fibers are between 0.25 and 0.5 um in diameter
Berman/Crump
IRIS Likely range at Libby
30
Dust Sample Collection
! Wipe Samples! Microvac On to an Air Filter! Gives Indication of Surface Loading ! Fibers/cm2 of Surface Sampled
31
Dust Sample Preparation/Analysis
! Dust Samples Are Near Universally Handled Liked �Indirect� Air Samples
! Should Be Thought of As Quasi-Quantitative! Good Indicators of Relative Loading (both on
and off-site), But Are Not Easily Translated Into Risk or Quantitative Risk Assessments
! Good Before/After Tests
32
Other Random Asbestos S&A Issues
! Cleavage Fragments vs. Born Fibers vs. Transition Fibers
! OSHA �Regulated� Fibers vs. the Universe of Amphibole Fibers vs. Asbestos as a Hazardous Substance
! Fibers <5 um in Length