Asahi Broadcasting Corporation Earnings Reference...
18
Asahi Broadcasting Corporation Earnings Reference for the Third Quarter (Cumulative) of FISCAL 2017 (The fiscal year ending March 31, 2018) February 7, 2018 Securities Code:9405 ©ABC2018 Note:The following document is an English translation of the Japanese-language original.
Transcript of Asahi Broadcasting Corporation Earnings Reference...

Asahi Broadcasting Corporation
Earnings Reference for the Third Quarter
(Cumulative) of FISCAL 2017(The fiscal year ending March 31, 2018)
February 7, 2018
Securities Code:9405
©ABC2018
Note:The following document is an English translation of the Japanese-language original.
©ABC20181
Consolidated Earnings
FY2017 3Q(Apr-Dec, 2017)
FY2016 3Q(Apr-Dec, 2016)
Growth % change
Net sales 60,813 61,982 △1,169 △1.9%
Operating income 2,800 3,306 △505 △15.3%
Ordinary income 3,081 3,578 △497 △13.9%
Profit attributable to owners of
parent1,879 2,312 △433 △18.7%
©ABC20182
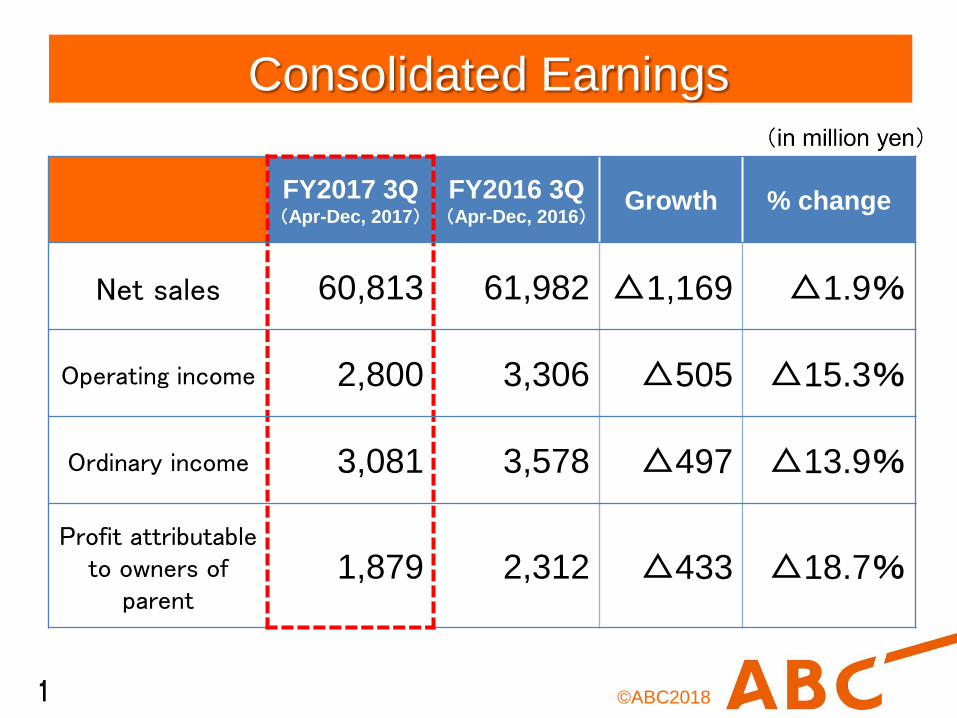
Consolidated Net Sales in the Past 5 Years
Full year3rd quarter (Apr-Dec)
61,055 60,559 60,462 61,892 60,813
81,484 80,691 81,059 82,302
0
10,000
20,000
30,000
40,000
50,000
60,000
70,000
80,000
90,000
2013 2014 2015 2016 2017 (FY)
©ABC2018
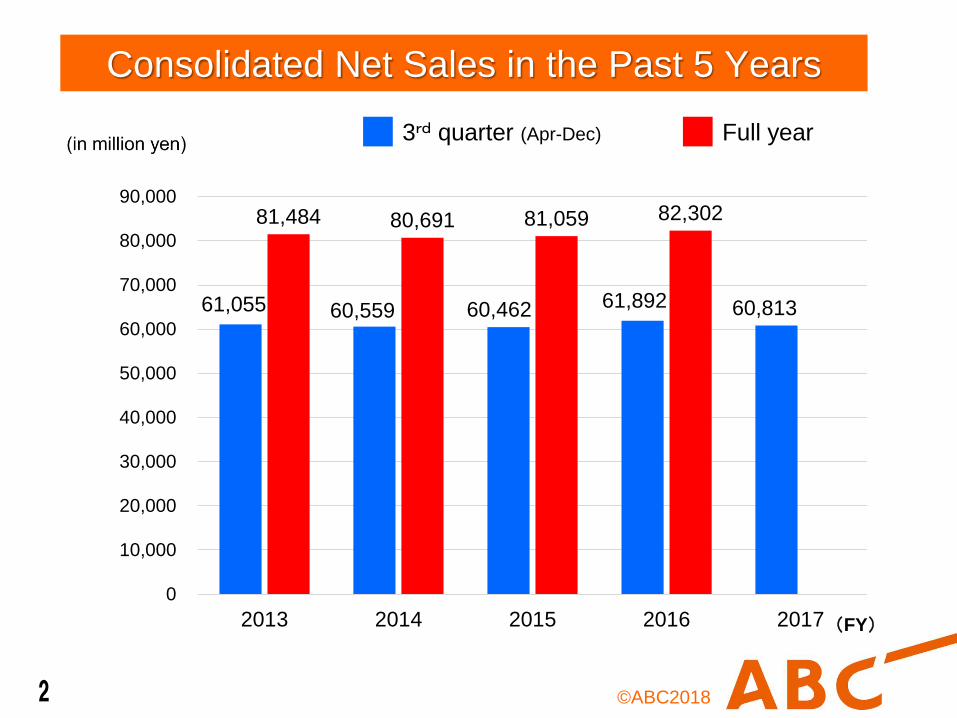
Consolidated Operating Income in the Past 5 Years
3
Full year
3,897 3,560
2,417
3,306
2,800
5,791
4,684
4,064
4,972
0
1,000
2,000
3,000
4,000
5,000
6,000
2013 2014 2015 2016 2017(FY)
3rd quarter (Apr-Dec)
©ABC20184
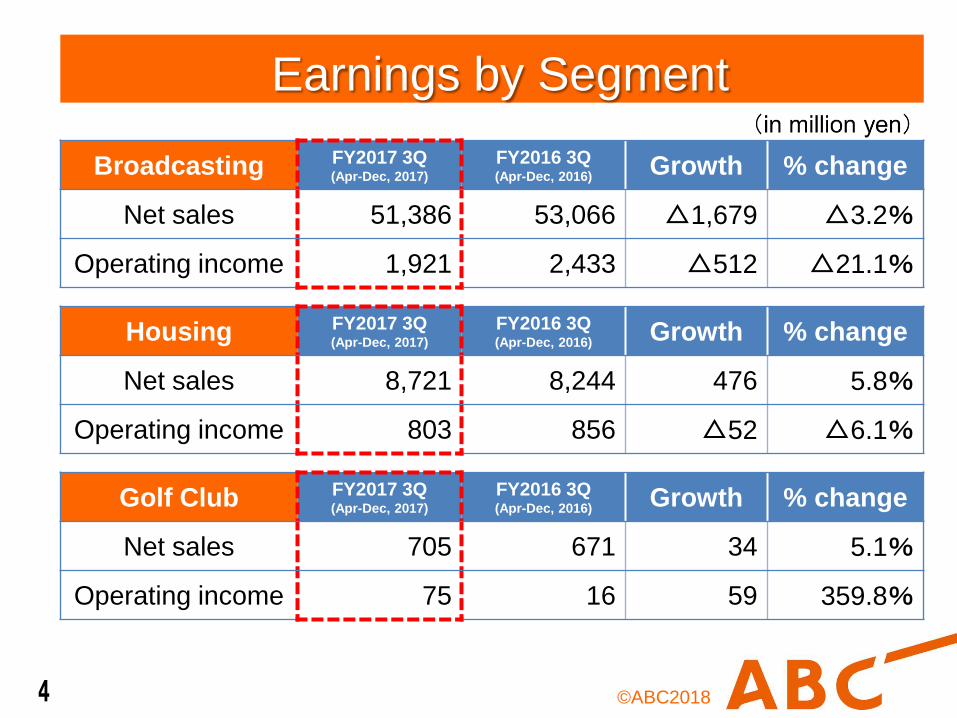
Earnings by Segment
Broadcasting FY2017 3Q(Apr-Dec, 2017)
FY2016 3Q(Apr-Dec, 2016)
Growth % change
Net sales 51,386 53,066 △1,679 △3.2%
Operating income 1,921 2,433 △512 △21.1%
Housing FY2017 3Q(Apr-Dec, 2017)
FY2016 3Q(Apr-Dec, 2016) Growth % change
Net sales 8,721 8,244 476 5.8%
Operating income 803 856 △52 △6.1%
Golf Club FY2017 3Q(Apr-Dec, 2017)
FY2016 3Q(Apr-Dec, 2016)
Growth % change
Net sales 705 671 34 5.1%
Operating income 75 16 59 359.8%
©ABC20185
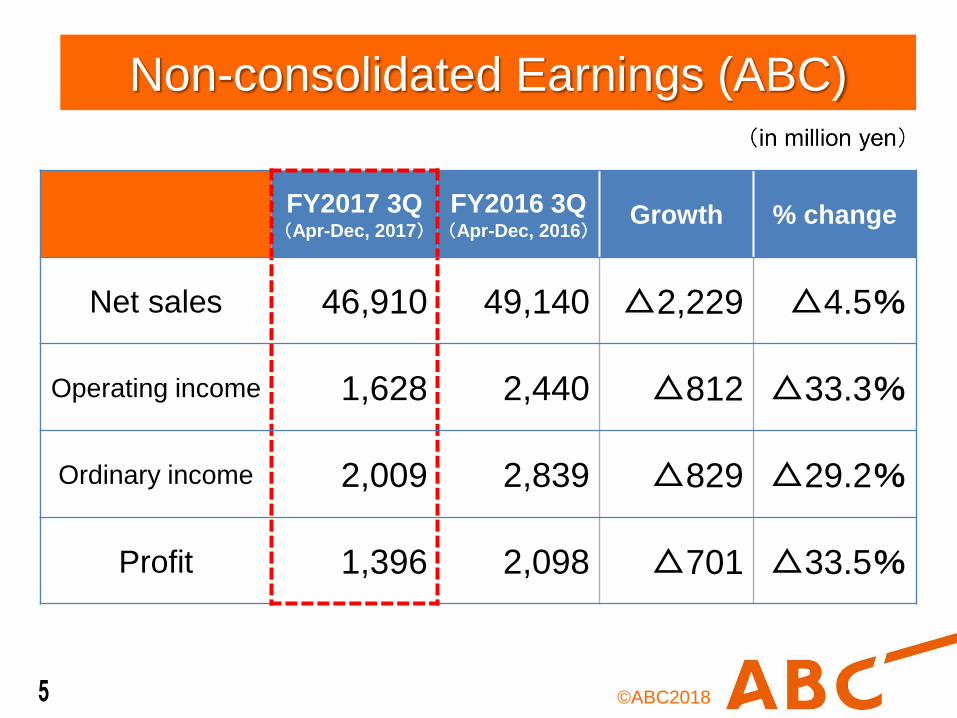
Non-consolidated Earnings (ABC)
FY2017 3Q(Apr-Dec, 2017)
FY2016 3Q(Apr-Dec, 2016)
Growth % change
Net sales 46,910 49,140 △2,229 △4.5%
Operating income 1,628 2,440 △812 △33.3%
Ordinary income 2,009 2,839 △829 △29.2%
Profit 1,396 2,098 △701 △33.5%
©ABC20186
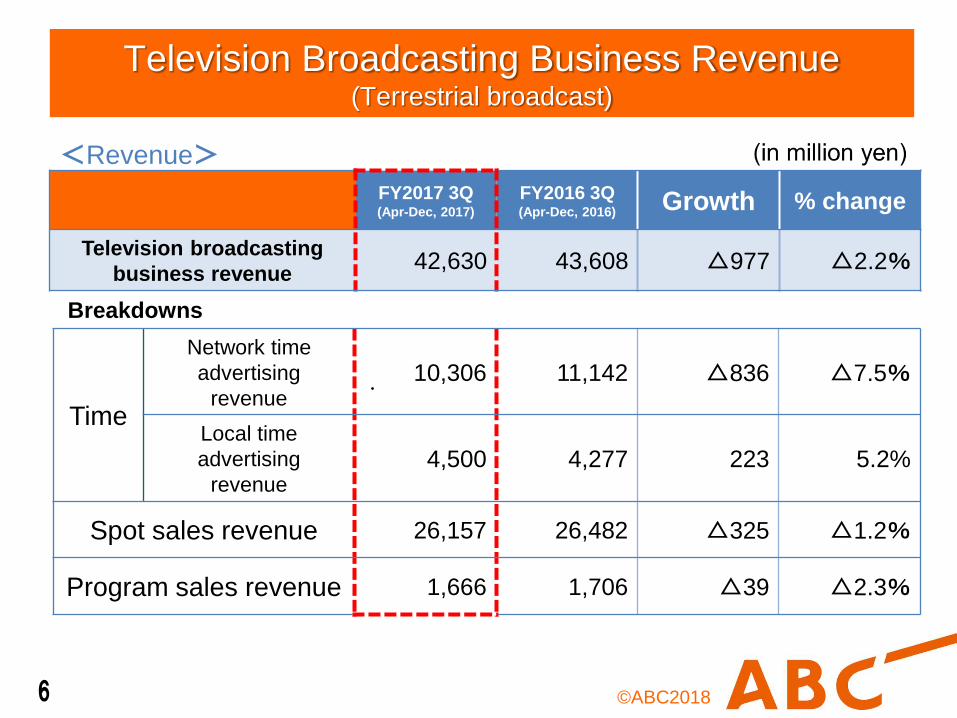
FY2017 3Q(Apr-Dec, 2017)
FY2016 3Q(Apr-Dec, 2016)
Growth % change
Television broadcasting
business revenue42,630 43,608 △977 △2.2%
Time
Network time
advertising
revenue10,306 11,142 △836 △7.5%
Local time
advertising
revenue4,500 4,277 223 5.2%
Spot sales revenue 26,157 26,482 △325 △1.2%
Program sales revenue 1,666 1,706 △39 △2.3%
Television Broadcasting Business Revenue(Terrestrial broadcast)
<Revenue>
Breakdowns
©ABC2018
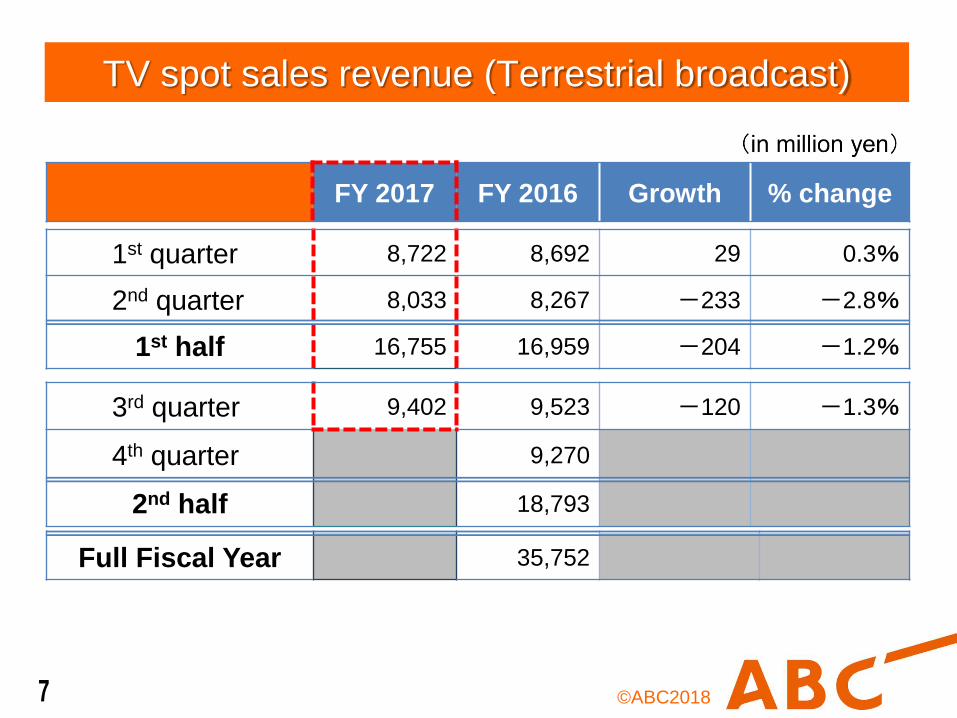
TV spot sales revenue (Terrestrial broadcast)
7
FY 2017 FY 2016 Growth % change
1st quarter 8,722 8,692 29 0.3%
2nd quarter 8,033 8,267 -233 -2.8%
1st half 16,755 16,959 -204 -1.2%
3rd quarter 9,402 9,523 -120 -1.3%
4th quarter 9,270
2nd half 18,793
Full Fiscal Year 35,752
©ABC2018
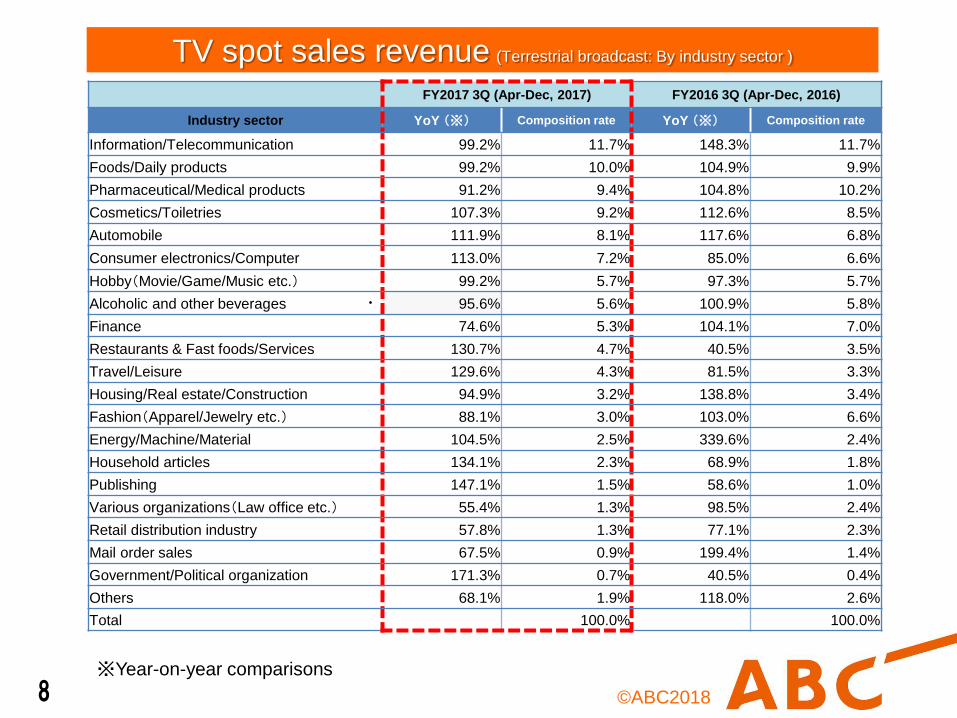
TV spot sales revenue (Terrestrial broadcast: By industry sector )
8※Year-on-year comparisons
FY2017 3Q (Apr-Dec, 2017) FY2016 3Q (Apr-Dec, 2016)
Industry sector YoY (※) Composition rate YoY (※) Composition rate
Information/Telecommunication 99.2% 11.7% 148.3% 11.7%
Foods/Daily products 99.2% 10.0% 104.9% 9.9%
Pharmaceutical/Medical products 91.2% 9.4% 104.8% 10.2%
Cosmetics/Toiletries 107.3% 9.2% 112.6% 8.5%
Automobile 111.9% 8.1% 117.6% 6.8%
Consumer electronics/Computer 113.0% 7.2% 85.0% 6.6%
Hobby(Movie/Game/Music etc.) 99.2% 5.7% 97.3% 5.7%
Alcoholic and other beverages 95.6% 5.6% 100.9% 5.8%
Finance 74.6% 5.3% 104.1% 7.0%
Restaurants & Fast foods/Services 130.7% 4.7% 40.5% 3.5%
Travel/Leisure 129.6% 4.3% 81.5% 3.3%
Housing/Real estate/Construction 94.9% 3.2% 138.8% 3.4%
Fashion(Apparel/Jewelry etc.) 88.1% 3.0% 103.0% 6.6%
Energy/Machine/Material 104.5% 2.5% 339.6% 2.4%
Household articles 134.1% 2.3% 68.9% 1.8%
Publishing 147.1% 1.5% 58.6% 1.0%
Various organizations(Law office etc.) 55.4% 1.3% 98.5% 2.4%
Retail distribution industry 57.8% 1.3% 77.1% 2.3%
Mail order sales 67.5% 0.9% 199.4% 1.4%
Government/Political organization 171.3% 0.7% 40.5% 0.4%
Others 68.1% 1.9% 118.0% 2.6%
Total 100.0% 100.0%
©ABC20189
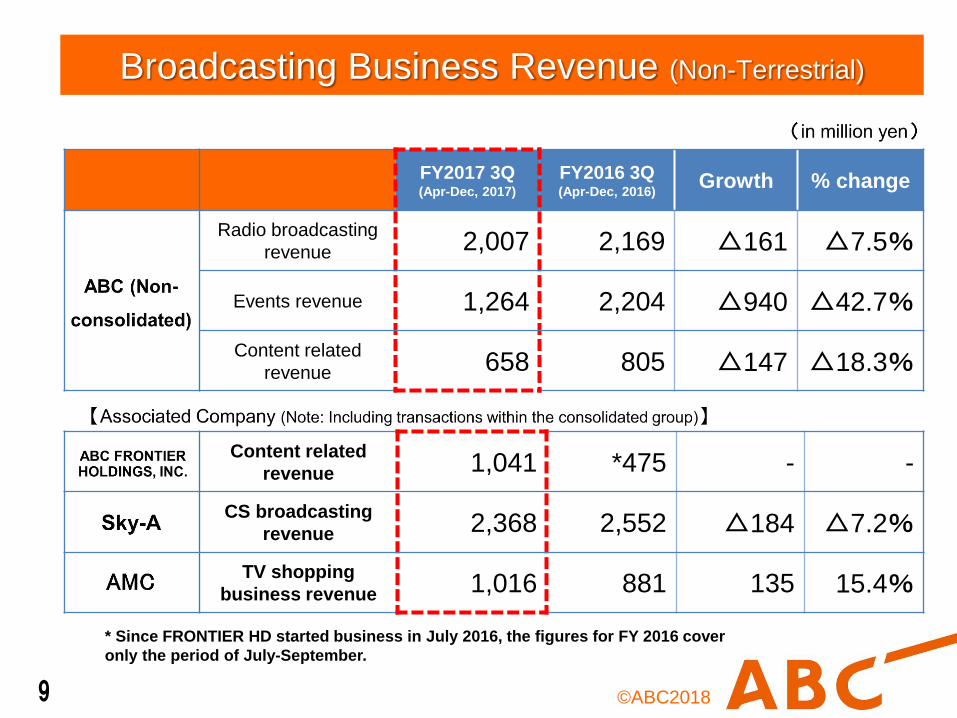
FY2017 3Q(Apr-Dec, 2017)
FY2016 3Q(Apr-Dec, 2016)
Growth % change
Radio broadcasting
revenue 2,007 2,169 △161 △7.5%
Events revenue 1,264 2,204 △940 △42.7%
Content related
revenue 658 805 △147 △18.3%
Content related
revenue 1,041 *475 - -
CS broadcasting
revenue 2,368 2,552 △184 △7.2%
TV shopping
business revenue 1,016 881 135 15.4%
Broadcasting Business Revenue (Non-Terrestrial)
* Since FRONTIER HD started business in July 2016, the figures for FY 2016 cover
only the period of July-September.
©ABC201810
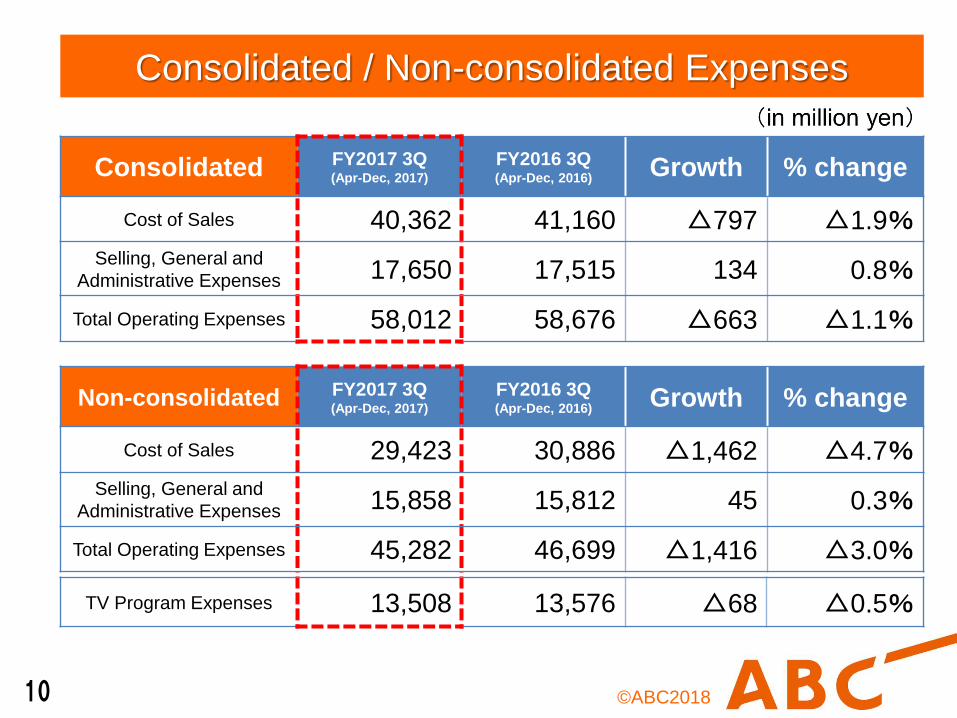
Consolidated / Non-consolidated Expenses
Non-consolidated FY2017 3Q(Apr-Dec, 2017)
FY2016 3Q(Apr-Dec, 2016)
Growth % change
Cost of Sales 29,423 30,886 △1,462 △4.7%
Selling, General and
Administrative Expenses 15,858 15,812 45 0.3%
Total Operating Expenses 45,282 46,699 △1,416 △3.0%
TV Program Expenses 13,508 13,576 △68 △0.5%
Consolidated FY2017 3Q(Apr-Dec, 2017)
FY2016 3Q(Apr-Dec, 2016)
Growth % change
Cost of Sales 40,362 41,160 △797 △1.9%
Selling, General and
Administrative Expenses 17,650 17,515 134 0.8%
Total Operating Expenses 58,012 58,676 △663 △1.1%
©ABC201811
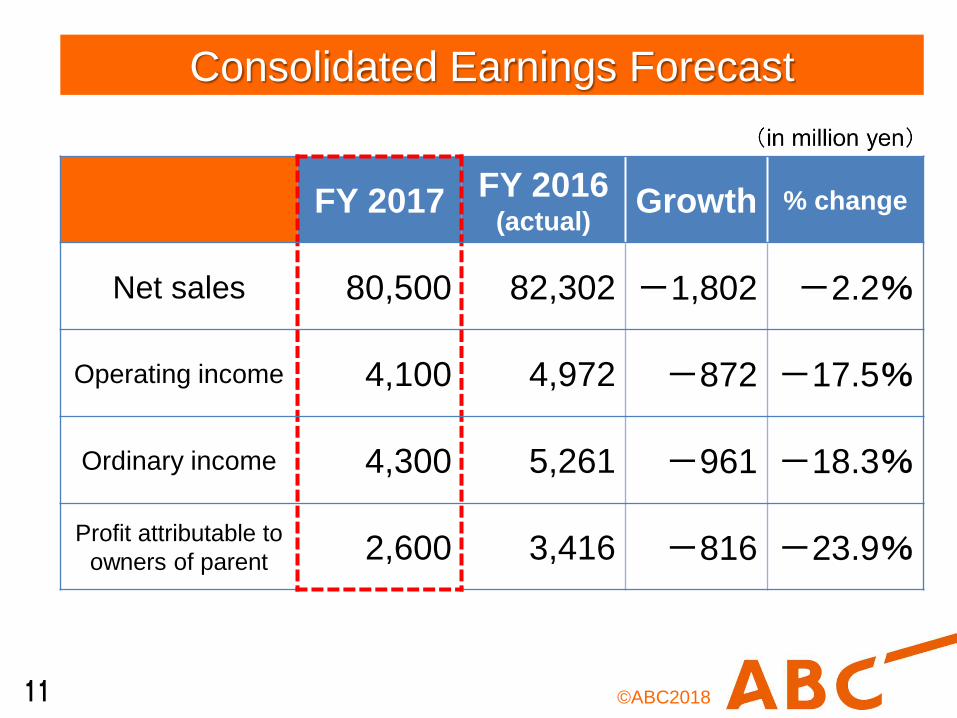
Consolidated Earnings Forecast
FY 2017 FY 2016(actual)
Growth % change
Net sales 80,500 82,302 -1,802 -2.2%
Operating income 4,100 4,972 -872 -17.5%
Ordinary income 4,300 5,261 -961 -18.3%
Profit attributable to
owners of parent 2,600 3,416 -816 -23.9%
©ABC201812
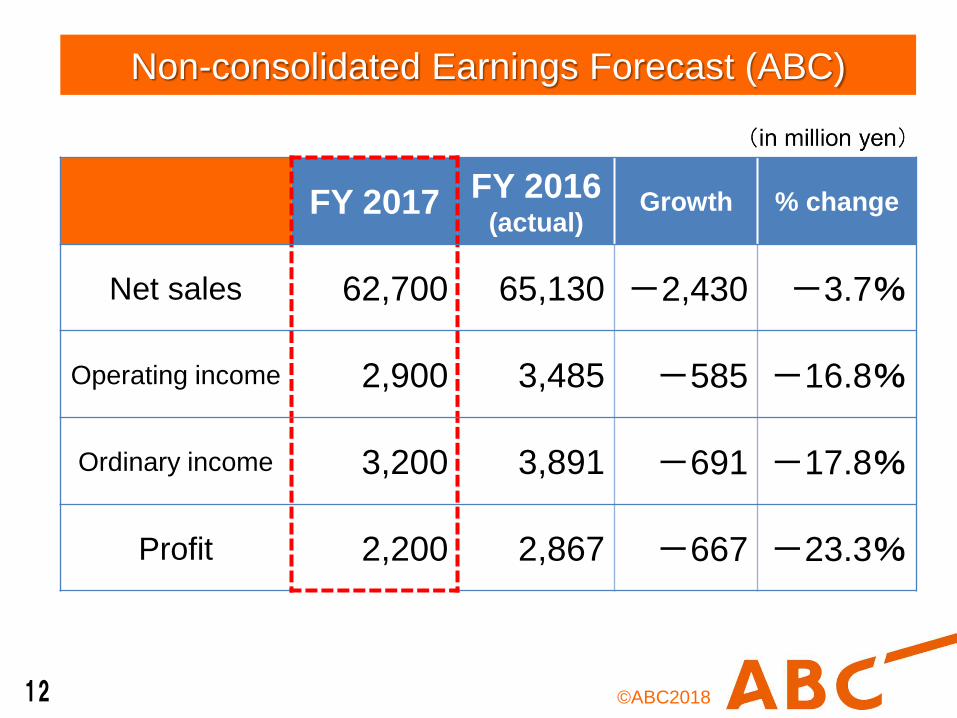
Non-consolidated Earnings Forecast (ABC)
FY 2017 FY 2016(actual)
Growth % change
Net sales 62,700 65,130 -2,430 -3.7%
Operating income 2,900 3,485 -585 -16.8%
Ordinary income 3,200 3,891 -691 -17.8%
Profit 2,200 2,867 -667 -23.3%
©ABC201813
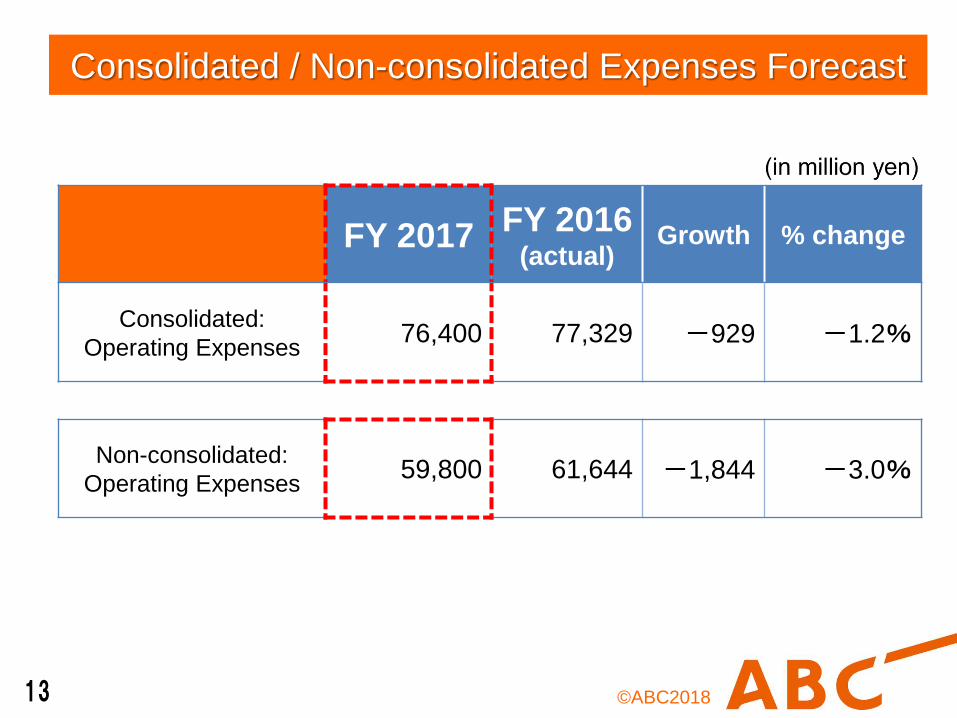
Consolidated / Non-consolidated Expenses Forecast
FY 2017 FY 2016(actual)
Growth % change
Consolidated:
Operating Expenses76,400 77,329 -929 -1.2%
Non-consolidated:
Operating Expenses59,800 61,644 -1,844 -3.0%
©ABC2018
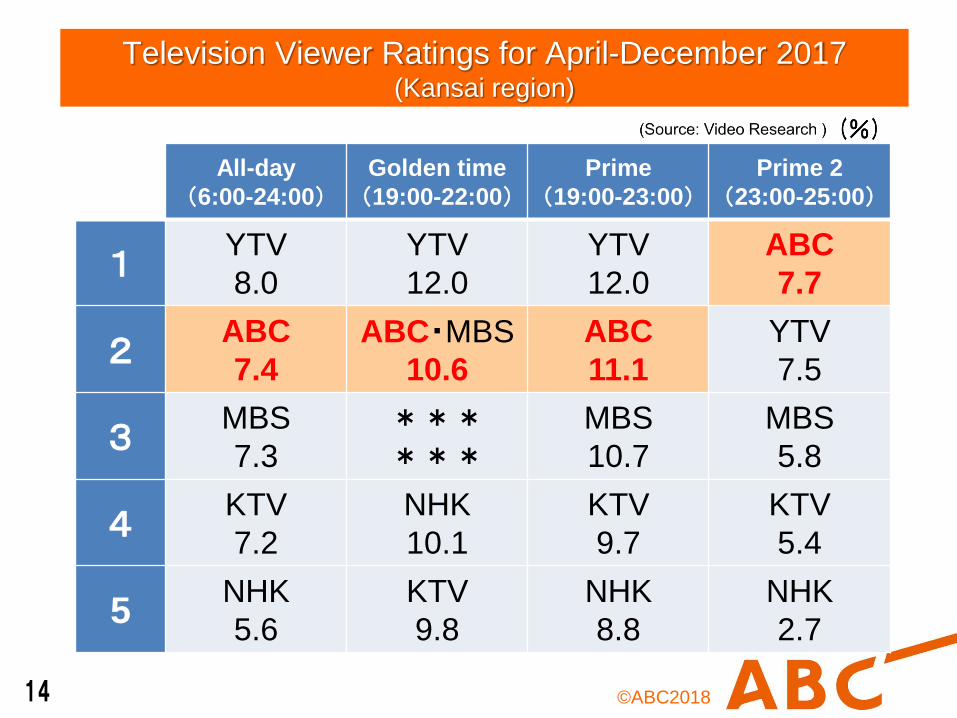
Television Viewer Ratings for April-December 2017 (Kansai region)
14
All-day
(6:00-24:00)Golden time
(19:00-22:00)Prime
(19:00-23:00)Prime 2
(23:00-25:00)
1YTV
8.0
YTV
12.0
YTV
12.0
ABC
7.7
2ABC
7.4
ABC・MBS
10.6
ABC
11.1
YTV
7.5
3MBS
7.3
******
MBS
10.7
MBS
5.8
4KTV
7.2
NHK
10.1
KTV
9.7
KTV
5.4
5NHK
5.6
KTV
9.8
NHK
8.8
NHK
2.7
©ABC2018
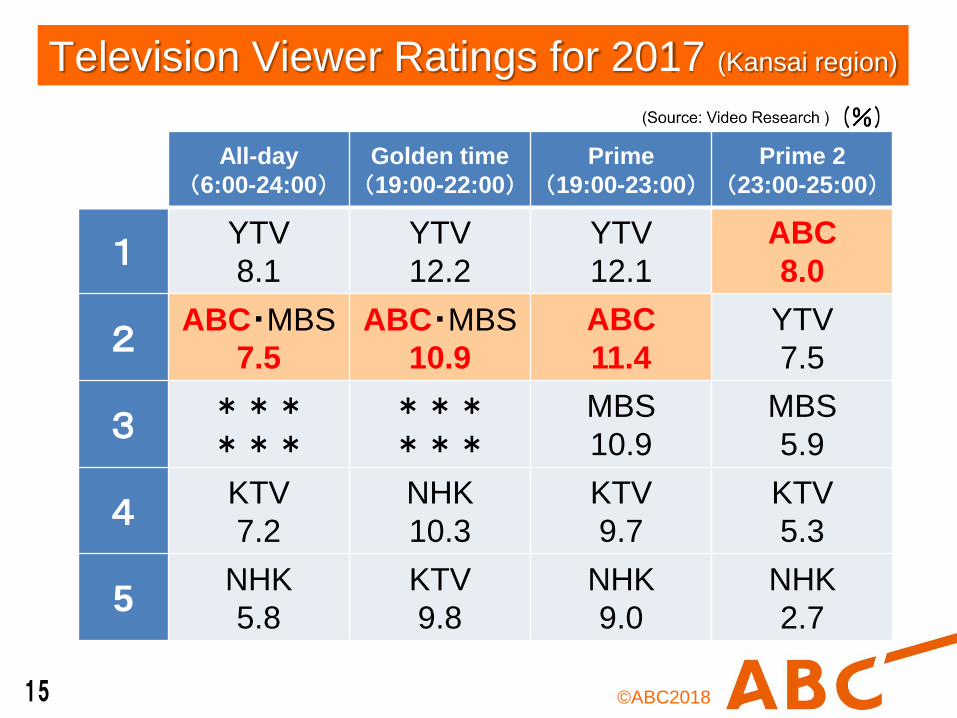
Television Viewer Ratings for 2017 (Kansai region)
15
All-day
(6:00-24:00)Golden time
(19:00-22:00)Prime
(19:00-23:00)Prime 2
(23:00-25:00)
1YTV
8.1
YTV
12.2
YTV
12.1
ABC
8.0
2ABC・MBS
7.5
ABC・MBS
10.9
ABC
11.4
YTV
7.5
3******
******
MBS
10.9
MBS
5.9
4KTV
7.2
NHK
10.3
KTV
9.7
KTV
5.3
5NHK
5.8
KTV
9.8
NHK
9.0
NHK
2.7
©ABC2018
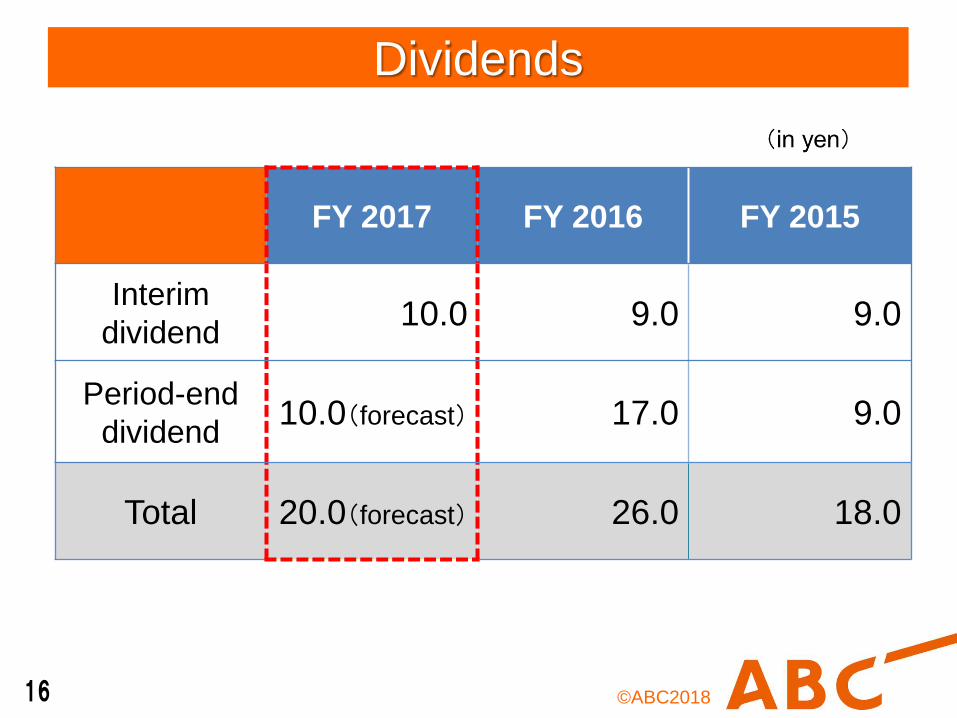
Dividends
16
FY 2017 FY 2016 FY 2015
Interim
dividend10.0 9.0 9.0
Period-end
dividend10.0(forecast) 17.0 9.0
Total 20.0(forecast) 26.0 18.0
©ABC2018
Contact/DisclaimerThis presentation is intended to provide information on our business etc., not to recommend the investment in our
company. And, this presentation contains forecasts and the other forward-looking statements relating to the plans,
outlook, targets, and forecasts of Asahi Broadcasting Corporation and its affiliated companies. These forecasts and
other forward-looking statements are based on assumptions and beliefs that draw on information that is available as of
the date of this presentation. As a result, the information in this presentation contains inherent risks and uncertainties.
Accordingly, readers are advised that actual results may differ materially from forecasts due to a variety of factors.
Asahi Broadcasting Corporation
+81-6-6458-5321(main number) +81-6-6454-1111
http://corp.asahi.co.jp/en/
For all shareholders, more detailed information such as consolidated financial
reports and annual securities reports can be found on the website.
17