^AS RABAYO MM! JAL!Leprints.uthm.edu.my/id/eprint/1159/1/24_Pages_from... · lakukan melalui...
24
QO^JIY AMALYS^S NEAR A SOU!) WASIE WiNG S!?E AT KAMPOMG KHJGHAP.BMIJ PAHA! ^AS RABAYO MM! JAL!L
Transcript of ^AS RABAYO MM! JAL!Leprints.uthm.edu.my/id/eprint/1159/1/24_Pages_from... · lakukan melalui...

Q O ^ J I Y AMALYS^S NEAR A SOU!) WASIE W i N G S!?E AT KAMPOMG
K H J G H A P . B M I J PAHA!
^AS RABAYO M M ! JAL!L

P E R P U S T A K A A N K U f T T H O
HIMgnnt!!]!]]!!)!!] 3 OOOO 00180733 2

KOLEJ UNIVERSITI TEKNOLOGI TUN HUSSEIN ONN
BORANG PENGESAHAN STATUS THESIS*
LEACHATE MIGRATION PATH ESTIMATIONS AND GROUNDWATER QUALITY ANALYSIS NEAR A SOLID WASTE DUMPING SITE AT KAMPONG KELICHAP, BATU PAHAT
SESI PENGAJIAN: 2004/2005
MAS RAHAYU BINTI JALIL (761003-01-7198) (HURUF BESAR)
mengakui membenarkan tesis ( PSM/ Sarjana/ Doktor Faisafah )* ini disimpan di Perpustakaan Koiej Universiti Teknoiogi Tun Hussein Onn (KUITTHO), dengan syarat-syarat seperti berikut:
1. Tesis ini adaiah hak miiik Koiej Universiti Teknoiogi Tun Hussein Onn. 2. Perpustakaan Kotej Universiti Teknotogi Tun Hussein Onn dibenarkan membuat persatinan untuk tujuan
pengajian sahaja. 3. Perpustakaan dibenarkan membuat saiinan tesis ini sebagai bahan pertukaran di antara institusi pengajian
tinggi. 4. **Siiatandakan(^j
JUDUL:
Saya
V
SULIT
TERHAD
(Mengandungi makiumat yang berdarjah keseiamatan atau kepentingan Maiaysia seperti yang termaktub di daiam AKTA RAHSIA RASMI 1972)
(Mengandungi makiumat TERHAD yang teiah di tentukan oteh organisasi/ badan di mana penyetidikan di jatankan)
TIDAK TERHAD
DisahHan Oieh:
(TANDATA)yG
Aiamat Tetap
PENULTS)
16. JALAN LIMAU. TAMAN MAJU. 86400 PARIT RAJA. BATU PAHAT. JOHOR
PENYELIA)
PROF. IR. DR. AMIR HASHIM BIN MOHD KASSIM (NamaPenyeiia)
Tarikh: 30 November 2004 Tarikh: 30November2004
CATATAN: Potong yang tidak berkenaan Jika tesis ini SULIT atau TERHAD, siia iampirkan surat daripada pihak berkuasa/orhanisasi berkenaan dengan menyatakan sekaii sebab dan tempoh tesis ini pertu dikeiaskan sebagai SULIT atau TERHAD. Tesis dimaksudkan sebagai tesis bagi [jazah Doktor Faisafah dan Sarjana secara penyetidikan atau disertasi bagi pengajian secara kursus dan penyeiidikan, atau taporan Projek Sarjana Muda (PSM).

"We hereby declare that we have read this thesis and in our opinion this thesis is
sufficient in terms of scope and quality for the award of the degree of Master of Civil
Engineering"
Signature
Name of Supervisor I
Date
Prof. Ir. Dr. Amir Hashim bin Mohd. Kassim
30 November, 2004
Signature
Name of Supervisor II
Date
Assoc. Prof. Hj. Ab Aziz bin Abd. Latiff
30 November, 2004

LEACHATE MIGRATION PATH ESTIMATIONS AND
GROUNDWATER QUALITY ANALYSIS NEAR A
SOLID WASTE DUMPING SITE AT KAMPONG
KELICHAP, BATU PAHAT
MAS RAHAYU BINTIJALIL
A thesis submitted in fulfillment of the requirements for the award of the Degree of
Master of Civil Engineering
Kolej Universiti Teknoiogi Tun Hussein Onn
NOVEMBER 2004

ii
"I declare that the work presented in this thesis, except where otherwise stated, is
based on m y own research, and has not been submitted previously for a degree in this
or any other university"
Signature
Author
Date
M A S RAHAYU BINTIJALIL
30 N O V E M B E R 2004

iii
For
M y husband
&
M y parents
iv
A C K N O W L E D G E M E N T
With the name of Allah, the most gracious and merciful, thanks to Allah for
his blessing for the accomplishment of this research. My first appreciation goes to
Prof. Ir. Dr. Amir Hashim bin Mohd Kassim for his supervision, concern, and
guidance throughout the research progress. It was a great pleasure to conduct thesis
under your supervision. My second appreciation goes to Assoc. Prof. Hj. Ab. Aziz
bin Abd. Latiff. Thanks for your advices and supports.
I would like to acknowledge Encik Mohamad Faiza! bin Tajul Baharuddin, all
the lecturers of civil engineering and environmental faculty, technicians of civil
engineering and chemistry laboratories, Batu Pahat Municipal Council and
Department of Survey and Mapping Malaysia (Segamat) for their great advices, help,
and cooperation.
Finally, m y special thanks to m y husband, Md. Rithauddin bin Yatni, for his
concerns, sacrifices, encouragement, and unlimited assistances throughout the
research progress. Thank you.

V
A B S T R A C T
The impact of Kampong Kelichap solid waste dumping site on groundwater
of an unconfined aquifer was investigated. The investigation involved the analysis of
groundwater quality and the estimations of leachate or contaminants movement
which included the flow direction and velocity. The leachate or contaminants
movement were assumed to be similar to the groundwater movement in the study
area. Groundwater level and water quality were monitored from August of 2003 to
June of 2004 in nine wells (SI to S9) located upstream and downstream of the study
area. The measured water quality parameters were pH, temperature, turbidity,
conductivity, dissolved oxygen (DO), total dissolved solids (TDS), ammonia
nitrogen (NH3 -N) , sulfate, biochemical oxygen demand (BOD5) , and chemical
oxygen demand (COD). Contaminants concentration distribution in groundwater has
been mapped or contoured using geostatistical analysis. Groundwater and
contaminant movement or flow characteristics were estimated using water table
contours, correlation surface analysis, and numerical models. The numerical
modeling was conducted by using M O D F L O W in conjunction with M O D P A T H and
MT3D. Field and laboratory results showed high concentrations of conductivity,
COD, N H 3 - N and TDS in the downstream groundwater. Field measurements,
laboratory analyses, and simulated models showed similar results in which the
contaminated wells were S3, S4, S5, and S6. Conductivity, COD, and NH3 -N
concentration contours suggested the dumping site as the main source of groundwater
contamination in the study area. The changes in the patterns on COD concentration
contours, the water table contours, the correlation surface analysis, and the numerical
models showed that the contaminants and groundwater were traveling mainly toward
the southwestern boundary with an average direction of 196 °, 199.5 °, 242.7 °, and
228.4°, respectively, as measured clockwise from the north. The estimated
contaminated groundwater velocities from the correlation analysis and numerical
model were ranging from 315.5 to 359 m/yr and 174 to 284 m/yr, respectively.

vi
ABSTRAK
Kesan tapak pelupusan sampah Kampung Kelichap ke atas air bumi di dikaji.
Kajian ini meliputi analisis kualiti air bumi (akuifer tak terkurung) dan anggaran arah
dan halaju pergerakkan air kurasan atau bahan pencemar. Pergerakkan air kurasan
atau bahan pencemar dari tapak pelupusan sampah tersebut di andaikan menyerupai
pergerakan air bumi di kawasan kajian. Aras air bumi dan kualiti air bumi di ukur
mulai Ogos, 2003 sehingga Jun, 2004 di sembilan buah telaga (S1-S9) yang terletak
di hulu dan di hilir kawasan kajian. Parameter-parameter kualiti air yang dikaji
adalah pH, suhu, kekeruhan, konduktiviti, oksigen terlarut, ammonia nitrogen (NH3-
N), sulfat, keperluan oksigen biokimia ( B O D 5 ) dan keperluan oksigen kimia (COD).
Pemetaan taburan kepekatan bahan pencemar di dalam air bumi di kawasan kajian di
lakukan melalui analisis geostatistik. Pergerakan air bumi and bahan pencemar di
anggarkan menggunakan kontur paras air bumi untuk akuifer tak terkurung, analisis
korelasi, dan model simulasi. Model simulasi dilakukan menggunakan M O D F L O W
bersama dengan M O D P A T H dan MT3D. Air bumi yang terletak di hilir kawasan
kajian didapati mengandungi kepekatan konduktiviti, COD, NH3 -N dan TDS yang
tinggi. Hasil kerja lapangan, makmal and model simulasi menunjukkan bahawa
telaga yang telah dicemari air kurasan dari tapak pelupusan sampah tersebut adalah
S3, S4, S5, dan S6. Corak taburan konduktiviti, COD, dan NH3 -N mencadangkan
tapak pelupusan sampah tersebut sebagai punca pencemaran utama air bumi di
kawasan kajian. Perubahan corak taburan kepekatan COD, kontur paras air bumi,
analisis korelasi, dan model simulasi menunjukkan aliran utama bahan pencemar dan
air bumi adalah ke arah sempadan baratdaya masing-masing dengan purata arah yang
diukur mengikut arah j a m dari utara, 196 °, 199.5°, 242.7°, dan 228.4°. Halaju air
bumi tercemar yang terhasil melalui analisis korelasi dan model simulasi masing-
masing adalah di dalam lingkungan 315.5 hingga 359.2 dan 174 hingga 284 m/yr.

vii
CONTENTS
C H A P T E R SUBJECT PAGE
A C K N O W L E D G E M E N T iv
ABSTRACT v
A B S T R A K vi
LIST OF TABLES xiv
LIST OF FIGURES xv
LIST OF SYMBOLS xix
LIST OFABBREVIATIONS xx
LIST OF APPENDICES xxii
I INTRODUCTION
1.1 Research Background 2
1.2 Study Area 4
1.2.1 Kampong Kelichap Solid Waste 7
Dumping Site
1.2.2 Structure Plan for Solid Waste 7
Management in Batu Pahat
1.3 Problem Statement 8
1.4 Importance of the Study 9
1.5 Research Objective 9
1.6 Scopes 10
1.7 Assumptions 10
1.8 Thesis Layout 11

V l l l
LITERATURE REVIEW AND THEORETICAL
B A C K G R O U N D
2.1 Introduction 13
2.2 Landfill Leachate 13
2.3 Landfill Leachate and Its Impact On 15
Groundwater
2.4 Physical and Chemical Characteristics 17
of Landfill Leachate and Landfill Leachate
Contaminated Groundwater
2.4.1 Temperature 17
2.4.2 pH 17
2.4.3 Conductivity IS
2.4.4 Total Dissolved Solids (TDS) IS
2.4.5 Dissolved Oxygen (DO) 18
2.4.6 Turbidity 19
2.4.7 Biochemical Oxygen Demand (BOD) 19
2.4.8 Chemical Oxygen Demand (COD) 20
2.4.9 Ammonia Nitrogen 21
2.4.10 Sulfate 21
2.5 Groundwater and Hydrologic Cycle 22
2.6 Groundwater and Aquifer Properties 23
2.6.1 Hydraulic Conductivity 24
2.6.2 Porosity and Effective Porosity 25
2.6.3 Transmissivity 25
2.6.4 Intrinsic Permeability 26
2.6.5 Specific Yield 26
2.7 Groundwater Flow Characteristics 26
2.7.1 Groundwater Velocity 27
2.7.1.1 Hydraulic Head 27
2.7.2 Groundwater Flow Direction 28
2.7.2.1 Water Level Contour 29
2.7.2.2 Land Surface Elevation and 29
Geoid Height Determination

ix
2.8 Leachate Fiow or Movement Characteristics 31
2.9 Methods of Investigating Groundwater 33
Contamination
2.10 Geostatistical Analysis 34
2.10.1 Semivariogram 35
2.10.2 Cross Validation and Error Analysis 37
2.10.2.1 Van Leeuwen et al. (1996) and 37
Guftasson and Hallgreen
Larsson (2000)
2.10.2.2 S y e d e t a l . (2003) 38
2.11 Correlation Surface Analysis 39
2.12 Numerical Modeling (MODFLOW, 41
MODPATFI, and MT3D)
2.12.1 Groundwater Flow Theory 42
2.12.2 Boundary Conditions 43
2.12.3 Calibration ofModel to Steady State 44
Conditions and Model Validation
2.13 Particle Tracking Simulation (MODPATH) 45
2.14 Contaminant Transport Model (MT3D) 51
2.15 Contaminant Transport Theory 52
2.15.1 Contaminant Transport Equations 52
III M E T H O D O L O G Y
3.1 Introduction 54
3.2 Initial Investigation (&age 7) 56
3.2.1 Consultation with Batu Pahat Municipal 56
Authorities
3.2.2 Sampling Point Selection (Groundwater) 56
3.2.3 Sampling Point Selection 57
(Surface Water Samples)
3.2.4 GPS Observation 59
X
3.2.4.2 Ground or Land Surface 59
Elevation
3.2.5 Development of Ground or Surface 60
Level Contour
Field measurement and Laboratory Analysis 61
(Aage 2)
3.3.1 7n ^ / / M Measurement 61
3.3.1.1 Surface Water 61
3.3.1.2 Groundwater 61
3.3.1.3 Well Water Level Measurement 62
3.3.2 Sampling 63
3.3.2.1 Soil 63
3.3.2.2 Surface Water 63
3.3.2.3 Groundwater 64
3.3.3 Laboratory Analysis 65
3.3.3.1 Soil Samples 65
3.3.3.2 Water Samples 66
Data Analysis (<S7age J?) 68
3.4.1 Geostatistical Analysis (Development 69
of Contaminants Concentration and
Water Table Contours)
3.4.2 Correlation Surface Analysis 70
3.4.2.1 Estimation of Hydraulic 71
Conductivity (K)
3.4.3 Steady State Simulation of the 72
Groundwater Flow System
3.4.3.1 Modeling Approach 73
3.4.3.2 Description of Model 74
3.4.3.3 Initial Condition 75
3.4.3.4 Boundary Condition 76
3.4.3.5 Calibration of Model to Steady 76
State Conditions
3.4.4 Potential Contaminant Migration 78
3.4.5 Contaminant Transport Simulation 78

XI
3.4.6 Estimations of Contaminated 79
Groundwater Velocity
RESULTS OF G R O U N D W A T E R QUALITY ANALYSIS
FOR SELECTED PARAMETERS
4.1 Introduction 80
4.2 Surface Water Quality 81
4.3 Groundwater Quality 82
4.3.1 Biochemical Oxygen Demand (BOD5) 83
4.3.2 Chemical Oxygen Demand (COD) 85
4.3.2.1 Comparison with Water 86
Table and Land Surface Elevations
4.3.4 Arnmoma Nitrogen (NH3-N) 88
4.3.5 Sulfate 88
4.3.6 Temperature 90
4.3.7 Turbidity 90
4.3.8 Dissolved Oxygen 91
4.3.9 pH 92
4.3.10 Total Dissolved Solids 92
4.3.11 Conductivity 93
4.3.11.1 Comparison with Water Table 93
and Land Surface Elevations
4.3.11.2 Groundwater Density Estimations 94
4.4 Application of Geostatistics and 95
Data Transformation
4.4.1 Variogram Modeling 95
4.4.2 Cross Validation and Error Analysis 96
4.4.3 Interpolation and Description of 96
Spatial Patterns
4.4.3.1 Development of COD Contours 99
and Analysis of COD
Contamination
X l l
4.4.3.2 Estimation of Groundwater and 101
Leachate or Contaminant Flow
Direction and Velocity from
COD Contours
4.4.3.3 Sulfate Concentration Contour 102
4.4.3.4 Ammonia Nitrogen 103
Concentration Contour
4.4.3.5 Field or : n ^ M Water 104
Quality Parameters
Concentration Contours
4.5 Contamination Factor (CF) 106
RESULTS OF G R O U N D W A T E R F L O W DIRECTION
ESTIMATIONS
5.1 Introduction 107
5.2 Land Surface Elevation 108
5.3 Results of Sieve Analysis 109
(Porous Medium Classification)
5.4 Groundwater level and Development of 109
Water Table Contours
5.4.1 Estimation of Groundwater Flow 110
Direction and Velocity Using Water
Table Contours
5.5 Correlation Surface Analysis 113
5.5.1 Estimation of Groundwater Movement 116
(Flow Direction and Velocity)
5.6 Estimation of Hydraulic Conductivity 119
(K) of the Porous Medium
5.7 Steady State Groundwater Flow Simulation 120
5.7.1 Potential Contaminant Migration 124
5.7.2 Contaminant Transport 126

xiii
5.7.3 Effect of Different Boundary 130
Condition
5.7.4 Model Limitations 130
5.7.4.1 Input Data 130
5.7.4.2 Assumptions or Simplifications 131
5.8 Estimations of Contaminated Groundwater 132
Velocity
5.9 Estimations of Contaminated Groundwater 134
Velocity Using Present Results (Density)
VI CONCLUSIONS AND R E C O M M E N D A T I O N S
6.1 Research Summary 136
6.2 Conclusions 137
6.3 Recommendations 138
R E F E R E N C E S 139
APPENDICES 151
xiv
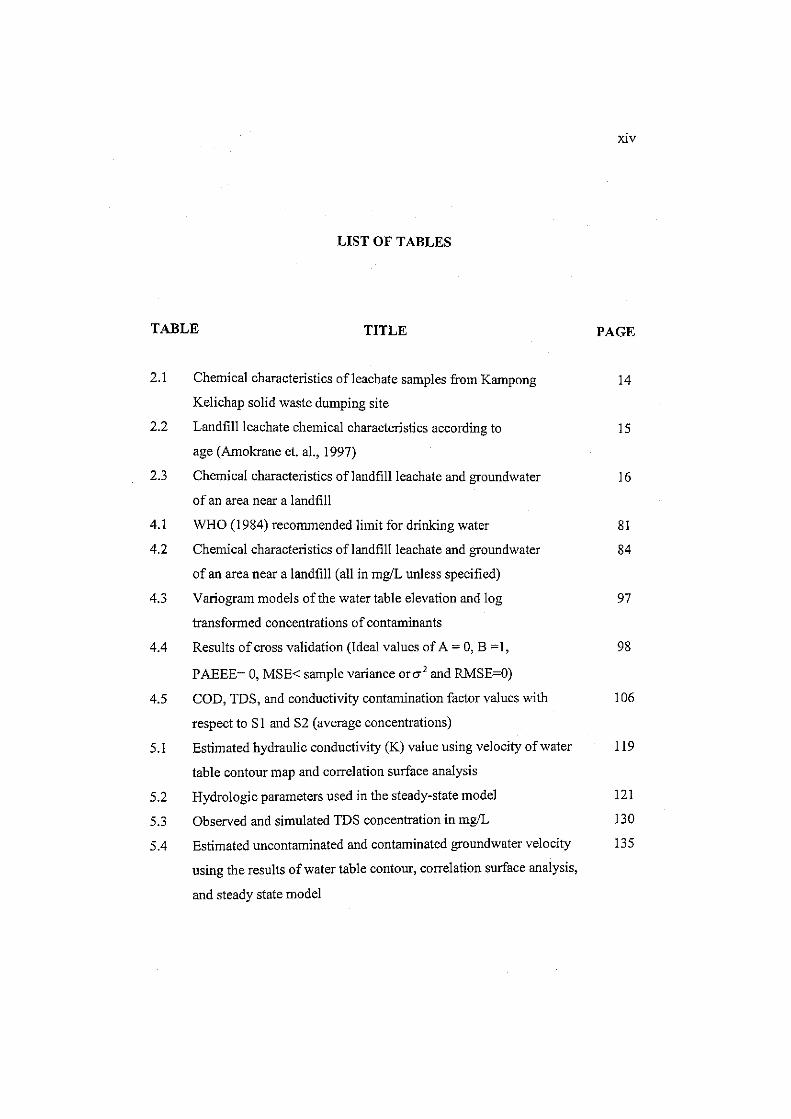
LIST OF TABLES
T A B L E TITLE PAGE
2.1 Chemical characteristics ofleachate samples from Kampong 14
Kelichap solid waste dumping site
2.2 Landfill leachate chemical characteristics according to 15
age (Amokrane et. al., 1997)
2.3 Chemical characteristics oflandfill leachate and groundwater 16
of an area near a landfill
4.1 W H O (1984) recommended limit for drinking water 81
4.2 Chemical characteristics oflandfill leachate and groundwater 84
of an area near a landfill (all in mg/L unless specified)
4.3 Variogram models of the water table elevation and log 97
transformed concentrations of contaminants
4.4 Results of cross validation (Ideal values of A = 0 , B = 1 , 98
PAEEE= 0, MSE< sample variance or and RMSE=0)
4.5 COD, TDS, and conductivity contamination factor values with 106
respect to SI and S2 (average concentrations)
5.1 Estimated hydraulic conductivity (K) value using velocity of water 119
table contour map and correlation surface analysis
5.2 Hydrologic parameters used in the steady-state model 121
5.3 Observed and simulated TDS concentration in mg/L 130
5.4 Estimated uncontaminated and contaminated groundwater velocity 135
using the results of water table contour, correlation surface analysis,
and steady state model

XV
LIST OF FIGURES
FIGURE TITLE PAGE
1.1 Mechanism of groundwater contamination (Fetter, 1999) 2
1.2 Geochemicai zonation of the leachate plume from a landfill receiving 4
organic waste (Fetter, 1999)
1.3 Location of the study area (indicated by red star) 5
1.4 Geological map of Batu Pahat (GMS after 1985) 5
1.5 Rainfall map for peninsular Malaysia (Monthly weather bulletin, 6
Meteorological Service of Malaysia, 2003 & 2004)
2.1 Schematic diagram of a hydrologic cycle (Chin, 2000) 23
2.2 Ranges ofhydraulic conductivity values for earth materials 25
(Anderson and Woessner, 1992)
2.3 Relationship between median grain size and water-storage 26
properties of alluvium (Stephens et al., 1998)
2.4 Hydraulic head of confined and unconfined (water table aquifers) 28
2.5 Illustrative view of various reference surfaces (Whittal & Teggin, 2001) 31
2.6 Parallel plane Modeling (Whittal & Teggin , 2001) 31
2.7 Experimental and model variogram 36
2.8 Movement o f a storm in t ime t . Maximum Lag Cross Correlation Occurs 41
a t j a n d j ' (Kassim, 1989)
2.9 Finite difference cell showing definitions of x-y-z and i-j-k ; Q is a 46
volume flow rate across a cell face (Pollock, 1994)
2.10 Schematic showing the computation of exit point and travel t ime of 51
the case of two dimensional flow in x-y plane (Pollock, 1994).
3.1 Research methodology 55
3.2 Sampling wells distribution (not according to scale) 57
3.3 Boring machine used for well construction 58

xvi
FIGURE TITLE PAGE
3.4 Components of a bore well 5g
3.5 Coordinate conversion by Geotrans version 2.2.4 (National Imagery 60
and Mapping Agency, 2003)
3.6 Horiba water quality checker 62
3.7 Field water quality parameters measurement using HORIBA water 62
quality checker unit
3.8 A. Water level probe and B. bailer 64
3.9 Water sampling using bailing method 65
3.10 A. COD reactor and B . H A C H D R 2010 unit used for COD 67
analysis
3.11 Data set interpolation using GMS version 4.0 69
3.12 Experimental and model variogram estimation using GMS 70
version 4.0
3.13 Movement of groundwater in time t (the arrow and 0 show the 72
Direction of movement; 0 was measured clockwise from the north)
3.14 Downloading of the map of the study area to the GMS 73
software version 4.0
3.15 Running the M O D L F O W simulation using the GMS 74
version 4.0
3.16 Finite-difference grid for the numerical three-dimensional 77
model of ground water flow; blue dots are the calibrated wells and
black dots are specified head wells
4.1 Average COD concentration in surface water 82
4.2 Average B O D 5 concentration in groundwater 85
4.3 COD concentration in the groundwater 86
4.4 Relation between COD concentration (mg/L) and water table 87
elevation (m)
4.5 Relation between COD concentration (mg/L) and water table 87
elevation (m)
4.6 Ammonia Nitrogen concentration in groundwater samples collected in 88
June of 2004 (mg/L) A i Q u i f a t ^ r-fYnrMifrntinn in eroundwater 89

xvii
FIGURE TITLE PAGE
4.8 Turbidity (NTU) PO
4.9 Dissolved Oxygen concentration in mg/L 91
4.10 Total dissolved solids $3
4.11 Conductivity values (uS/cm) 94
4.12 Relation between conductivity and water table elevation 95
4.13 Model and experimental average COD variograms for measurements 96
made in June of 2004
4.14 Log transformed COD concentration contour (log 10 mg per liter) 100
4.15 Estimation of the path of the contaminant movement based on COD 101
concentration contour (The arrow and 9 show the direction of
movement; 9 is heading measured clockwise from the nor th )
4.16 Sulfate (average) concentration contour (log 10 mg/L) 102
4.17 Ammonia nitrogen concentration contour for June of2004 103
(mg/L)
4.18 Conductivity concentration contour for A. August of 2003 and 104
B. June of 2004 (log 10 pS/cm)
4.19 A. Temperature, B. pH, C. dissolved oxygen distribution pattern 105
(log ]omg/L)
5.1 Surface elevation (orthometric height) of the study area; the elevation 108
is in meters (m) and the contour interval is 1.3 m
5.2 Result of si eve analysis 109
5.3 Observed water levels or water table elevations throughout the 110
investigation period (m)
5.4 Water table contour maps ofmeunconf ined aquifer (altitudes are 112
in meters above sea level and contour interval is 0.4 m; blue arrows
show the path of the groundwater movement or flow)
5.5 Groundwater movement determination from the deviation of peaks 113
on the water table contours (the direction is indicated by the arrow
and 0)
5.6 T = 0 correlation surface 114
5.7 T = 4 correlation surface 115
5.8 t = 112 correlation surface 115

XVH1
5.9 Determination o f the path ofgroundwater movement (dots indicate 117
the position of the centroid of peaks on the correlation contours)
5.10 The estimated movement direction as measured clockwise from the 118
north (degrees)
5.11 The estimated average velocity (m/yr) 118
5.12 Simulated head distribution of the unconfmed aquifer. Contour 122
interval is 0.773 m (Green bars indicate simulated values within two
feets of the observed and bars above center indicate simulated values
less than observed values)
5.13 Comparison of simulated and observed heads of the unconfmed 123
aquifer and a summary of error
5.14 Simulated particle flow path (pirux arrows) from the vicimty o f the 125
dumping site for 450 and 900 days (Contour interval is 0.773 m)
5.15 Simulated particle flow path (pink arrows) from the vicinity of the 126
dumping site for 2500 days (Contour interval is 0.773 m)
5.16 Simulated contaminant transport for 15 0 and 450 days 12 8
5.17 Simulated contaminant transport for 900 and 2500 days 129
FIGURE TITLE PAGE
XX
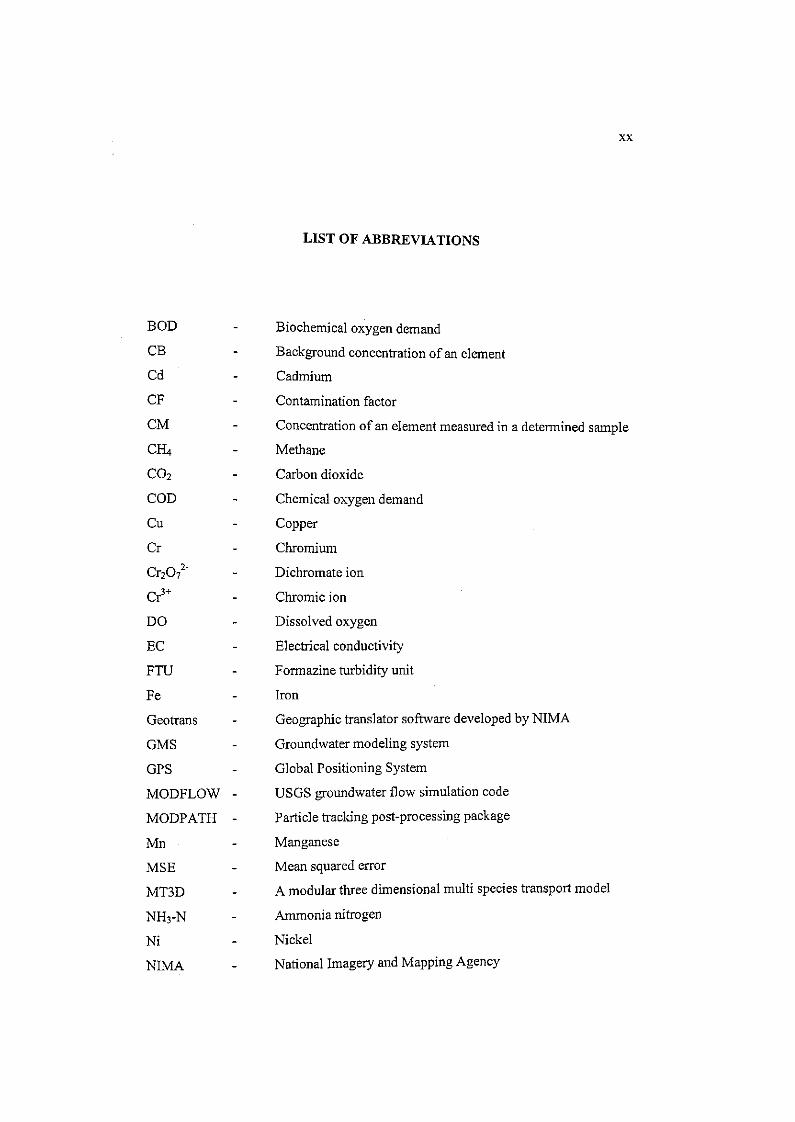
L I S T O F A B B R E V I A T I O N S
B O D - Biochemical oxygen demand
CB - Background concentration of an element
Cd - Cadmium
CF - Contamination factor
C M - Concentration of an element measured in a determined sample
CELi - Methane
CO2 - Carbon dioxide
COD - Chemical oxygen demand
Cu - Copper
Cr - Chromium
0 * 2 0 7 ^ * - Dichromate ion
C r ^ - Chromic ion
DO - Dissolved oxygen
EC - Electrical conductivity
FTU - Formazine turbidity unit
Fe - Iron
Geotrans - Geographic translator software developed by NIMA
GMS - Groundwater modeling system
GPS - Global Positioning System
M O D F L O W - USGS groundwater flow simulation code
M O D P A T H - Particle tracking post-processing package
M n - Manganese
M S E - Mean squared error
MT3D - A modular three dimensional multi species transport model
NH3 -N - Ammonia nitrogen
Ni - Nickel
N I M A - National Imagery and Mapping Agency

N T U Nephelometric turbidity unit
PAEE Percentage average estimation
Pb Lead
R M S E Relative mean squared error
TDS Total dissolved solids
TSS Total suspended solids
U S G S U.S. Geological Survey
W H O World Health Organization
Zn Zinc